Article

Developing Intensity-Duration-Frequency (IDF) Curves Based on Rainfall Cumulative Distribution Frequency (CDF) for Can Tho City, Vietnam

1
College of Environment and Natural Resources, Can Tho University, Can Tho 900000, Vietnam
2
College of Technology, Can Tho University, Can Tho 900000, Vietnam
3
Institute for Global Environmental Strategies, Hayama 240-0115, Japan
*
Authors to whom correspondence should be addressed.
Earth 2022, 3(3), 866-880; https://doi.org/10.3390/earth3030050
Submission received: 28 June 2022 / Revised: 25 July 2022 / Accepted: 29 July 2022 / Published: 1 August 2022

Abstract

:
Information on the relationship between rainfall intensity, duration and accumulation frequency or return period (IDF) is commonly utilized in the design and management of urban drainage systems. Can Tho City, located in the Vietnamese Mekong Delta, is a city which has recently invested heavily in upgrading its stormwater drainage systems in the hope of preventing reoccurring flood events. Yet, much of these works were designed based on obsolete and outdated IDF rainfall curves. This paper presents an updated IDF curve for design rainfall for Can Tho City. For each duration and designated return period, a cumulative distribution function (CDF) was developed using the Pearson III, Log-Pearson III, and Log-Normal distribution functions. In order to choose the best IDF rainfall curve for Can Tho City, the CDF rainfall curve and empirical formulas used in Vietnam and Asia (Vietnamese standard 7957:2008, Department of Hydrology, Ministry of Transportation, Talbot, Kimijima, and Bermard) were compared. The goodness of fit between the IDF relationship generated by the frequency analysis (CDF curve), and that predicted by the IDF empirical formulas was assessed using the efficiency index (EI), and the root mean squared error (RMSE). The IDF built from Vietnam’s standard TCVN 7957:2008 with new parameters (A = 9594, C = 0.5, b = 26, n = 0.96) showed the best performance, with the highest values of EI (0.84 EI 0.93) and the lowest values of RMSE (2.5 RMSE 3.2), when compared to the other remnants.

1. Introduction

Determining the three key variables of rainfall intensity (I), frequency (F), and duration (D) are important prerequisites in the design of urban drainage systems and stormwater management practices [1,2]. The relationship between the three variables is usually represented as a graph, in which rainfall duration is placed on the horizontal axis, rainfall intensity is placed on the vertical axis, and the curves corresponds to the period of reappearance or frequency. The relationship has been a commonly applied input criteria for the design of drainage systems worldwide since the 1920s. Urbanization and floodplain management were of interest to Meyer [3]. Sherman [4] used the basic formula to determine rainfall intensity for different areas throughout each period, and Bernard (1932) [5] further developed the IDF curve so that it could be applied to larger study regions. Thereafter, investigating varying return periods of 2, 5, 20, 50, 100, and 200 years and varying rainfall intensity durations, Hershfield (1961) [6] created numerous IDF rainfall curves. Whereas, Bell created an IDF rainfall curve in 1969 using a scale zoom calculation formula for the then Soviet Union, and Chen (1983) [7] presented a straightforward and generic method to create an IDF curve that was applicable to all study areas.
In a more recent study, Di Baldassarre et al. (2006) analyzed seven individual IDF curves to determine how well they represented the varying relationships between rainfall intensity, duration, and frequency. They found that rainfall intensity could only be accurately determined for short rainfall events (typically less than 1 day). However, if the rainfall monitoring data at a single station was sufficiently large, cumulative distribution frequency (CDF) could be used successfully to generate an IDF rainfall curve [8,9].
Similar research applied the IDF curve for precipitation data in Korea using the cumulative distribution function [10]. Here, the authors estimated the IDF curve parameters from the CDF using a variety of techniques, including single- and multi-objective algorithms, ROBUST, OneStep, and linear and non-linear regression (MOGA). They then roughly divided the parameters into short-term and long-term precipitation using the SEPDUR approach to produce a more precise calculation. The effectiveness of each method was compared using both the RMSE and RRMSE between the estimated value and the findings from an in-situ frequency study. The results demonstrated that, the IDF curve based on the CDF showed the least relative standard error in the IDF (RRMSE) and relative mean square error (RMSE), respectively. These results found that the most accurate method is a MOGA’s IDF curve, which links CDF and SEPDUR.
The work investigating the design rainfall for Qatar by [11], employed a linear moments (L-monents) regional index to develop input data for an IDF curve. With an average relative error of only 5.5%, the study also highlighted that employing the Pearson III distribution function to construct the IDF rainfall curve was optimal. An IDF curve based on the Gumbel and Person III functions was also developed in a study focusing on Saudi Arabia [12]. Here, these methods both provided outcomes that were consistent with previous research. The parameters of the IDF equation were calculated for different return periods using non-linear multivariable regression with correlation numerical analysis for 2, 5, 10, 25, 50, and 100 years. The obtained results showed that every return period exhibited a strong correlation and were suitable for use in the computation of the study area’s IDF curve. The work also highlighted that the IDF curve’s construction based on the Gumbel distribution function displayed a high level of accuracy.
It is now well-known and acknowledged that climate change exerts a direct impact on the hydrological cycle, influencing precipitation intensity, duration, and frequency [13]. Rainfall is frequently taken into account for planning and designing stormwater collection systems, run-off, flood estimation, calculating urban drainage capacities, and computing the effects of different climate change scenarios in order to estimate the future risk and the efficiency of different adaptation options in urban areas.
However, because each location exhibits a unique I, D, F relationship, it is still challenging to evaluate the link between rainfall intensity for specific periods (I), duration of rain events (D), and the frequency of precipitation (F), or repeatability (N). Currently in Asia, IDF rainfall curves have been developed, for monsoon-affected regions with high rainfall, such as China (Sherman), Indonesia (Talbot, Sherman), and Japan (Kimijima, Talbot, Bermard), in addition to the application of some methods for calculating rain intensity according to the limit intensity of the Soviet Union (former) D.F. Gorbachev (1920) or British, American, German, and Polish formulas. In Vietnam, the Department of Hydrology, Ministry of Transport, and Vietnamese standards are used to develop experimental formulations (TCVN 7957:2008). The deterministic character of the hydrological system (geography) provides the foundation for the aforementioned approaches, which ignores the randomness of hydrological occurrences. Using the case of Can Tho City in the Vietnamese Mekong delta, this study applies experimental methods and probability distribution, which have been used successfully in many previous studies [14,15,16] to construct a locally relevant IDF curve.

2. Materials and Methods

Some definitions of rainfall intensity, design rain time step, and repetition period (repeatability) are provided in this study.
  • Rainfall intensity (i, q), is the amount of rain falling per unit area in a unit of time. Rainfall intensity can be in the form of accumulative rainfall depth (i.e., mm/min, cm/h) or rainfall volume (q, L/s.ha) and is shown to be related by the formula q = 166.7i.
  • Design rainfall time step (period, t), is the amount of rainfall in the calculation period (15 min or 30 min) assuming that the intensity does not change.
  • Rainfall return period or frequency (N, years): is the time in years for the reappearance of rainfall of the equal amount (or greater than that of design intensity). The larger the rainfall, the less frequent it will occur (in case P ≤ 50%).
Figure 1 and Figure 2 depict the location of Can Tho, a city in the VMD, and outline of the research methodology used in this study respectively. The study collected rainfall data from the official Can Tho station, Can Tho City over a period of 38 years (1978–2015). For each year, the maximum precipitation value was selected for the calculation of time steps (15 min, 30 min, 60 min, 90 min, and 180 min respectively).
Some European and Southeast Asian countries have typically used 3-parameter Log-Normal distribution or External I and External III. While, Russia, China and Vietnam have typically relied Pearson III distribution [17]. According to the research results of Tuan [18], who compared the frequency distribution functions for rainfall in the VMD, the distribution functions of Pearson III (P.III) and Log-Pearson III, Log-Normal are the most suitable. Furthermore the research of Anh [19] shows that the Log-Normal, Pearson III and Log Pearson III all provided equivalent calculation results and large biased result compared to other curves in the region with rare return periods for curve for Hoa Binh and Son Tay stations in Vietnam. Resultantly, this study assessed the development a cumulative rain frequency curve for each period according to the distribution of Pearson III (P.III), Log-Pearson III, Log-Normal and re-adjusted the coefficient of variation (Cv) suitable for rainfall in each period.
Distribution   of   P . III :   ( x ) = 1 α . Γ ( β ) . [ x γ α ] β 1 . e [ x γ α ]
Distribution   of   Log - Pearson   III :   P ( x ) = 1 α . x . Γ ( β ) . [ l n x γ α ] β 1 . e [ l n x γ α ]
Distribution   of   Log - Normal :   P ( x ) = 1 ( x a ) . σ y . 2 π   . e [ ln ( x a ) μ y ] 2 2 σ y 2
In which: α, β, γ are the 3 parameters which indicate the scale, shape and position of the data set, respectively; while Γ(β) is the Gamma function.
Determined rainfall intensity return period (N, year): Determine the rainfall intensity return period (N, years) for the rainfall intensity for the selected event 2 years, 10 years, 20 years, 50 years, and 100 years, respectively. Based on the event’s occurrence frequency, determined the return period: N = 100/P (years) if P ≤ 50%.
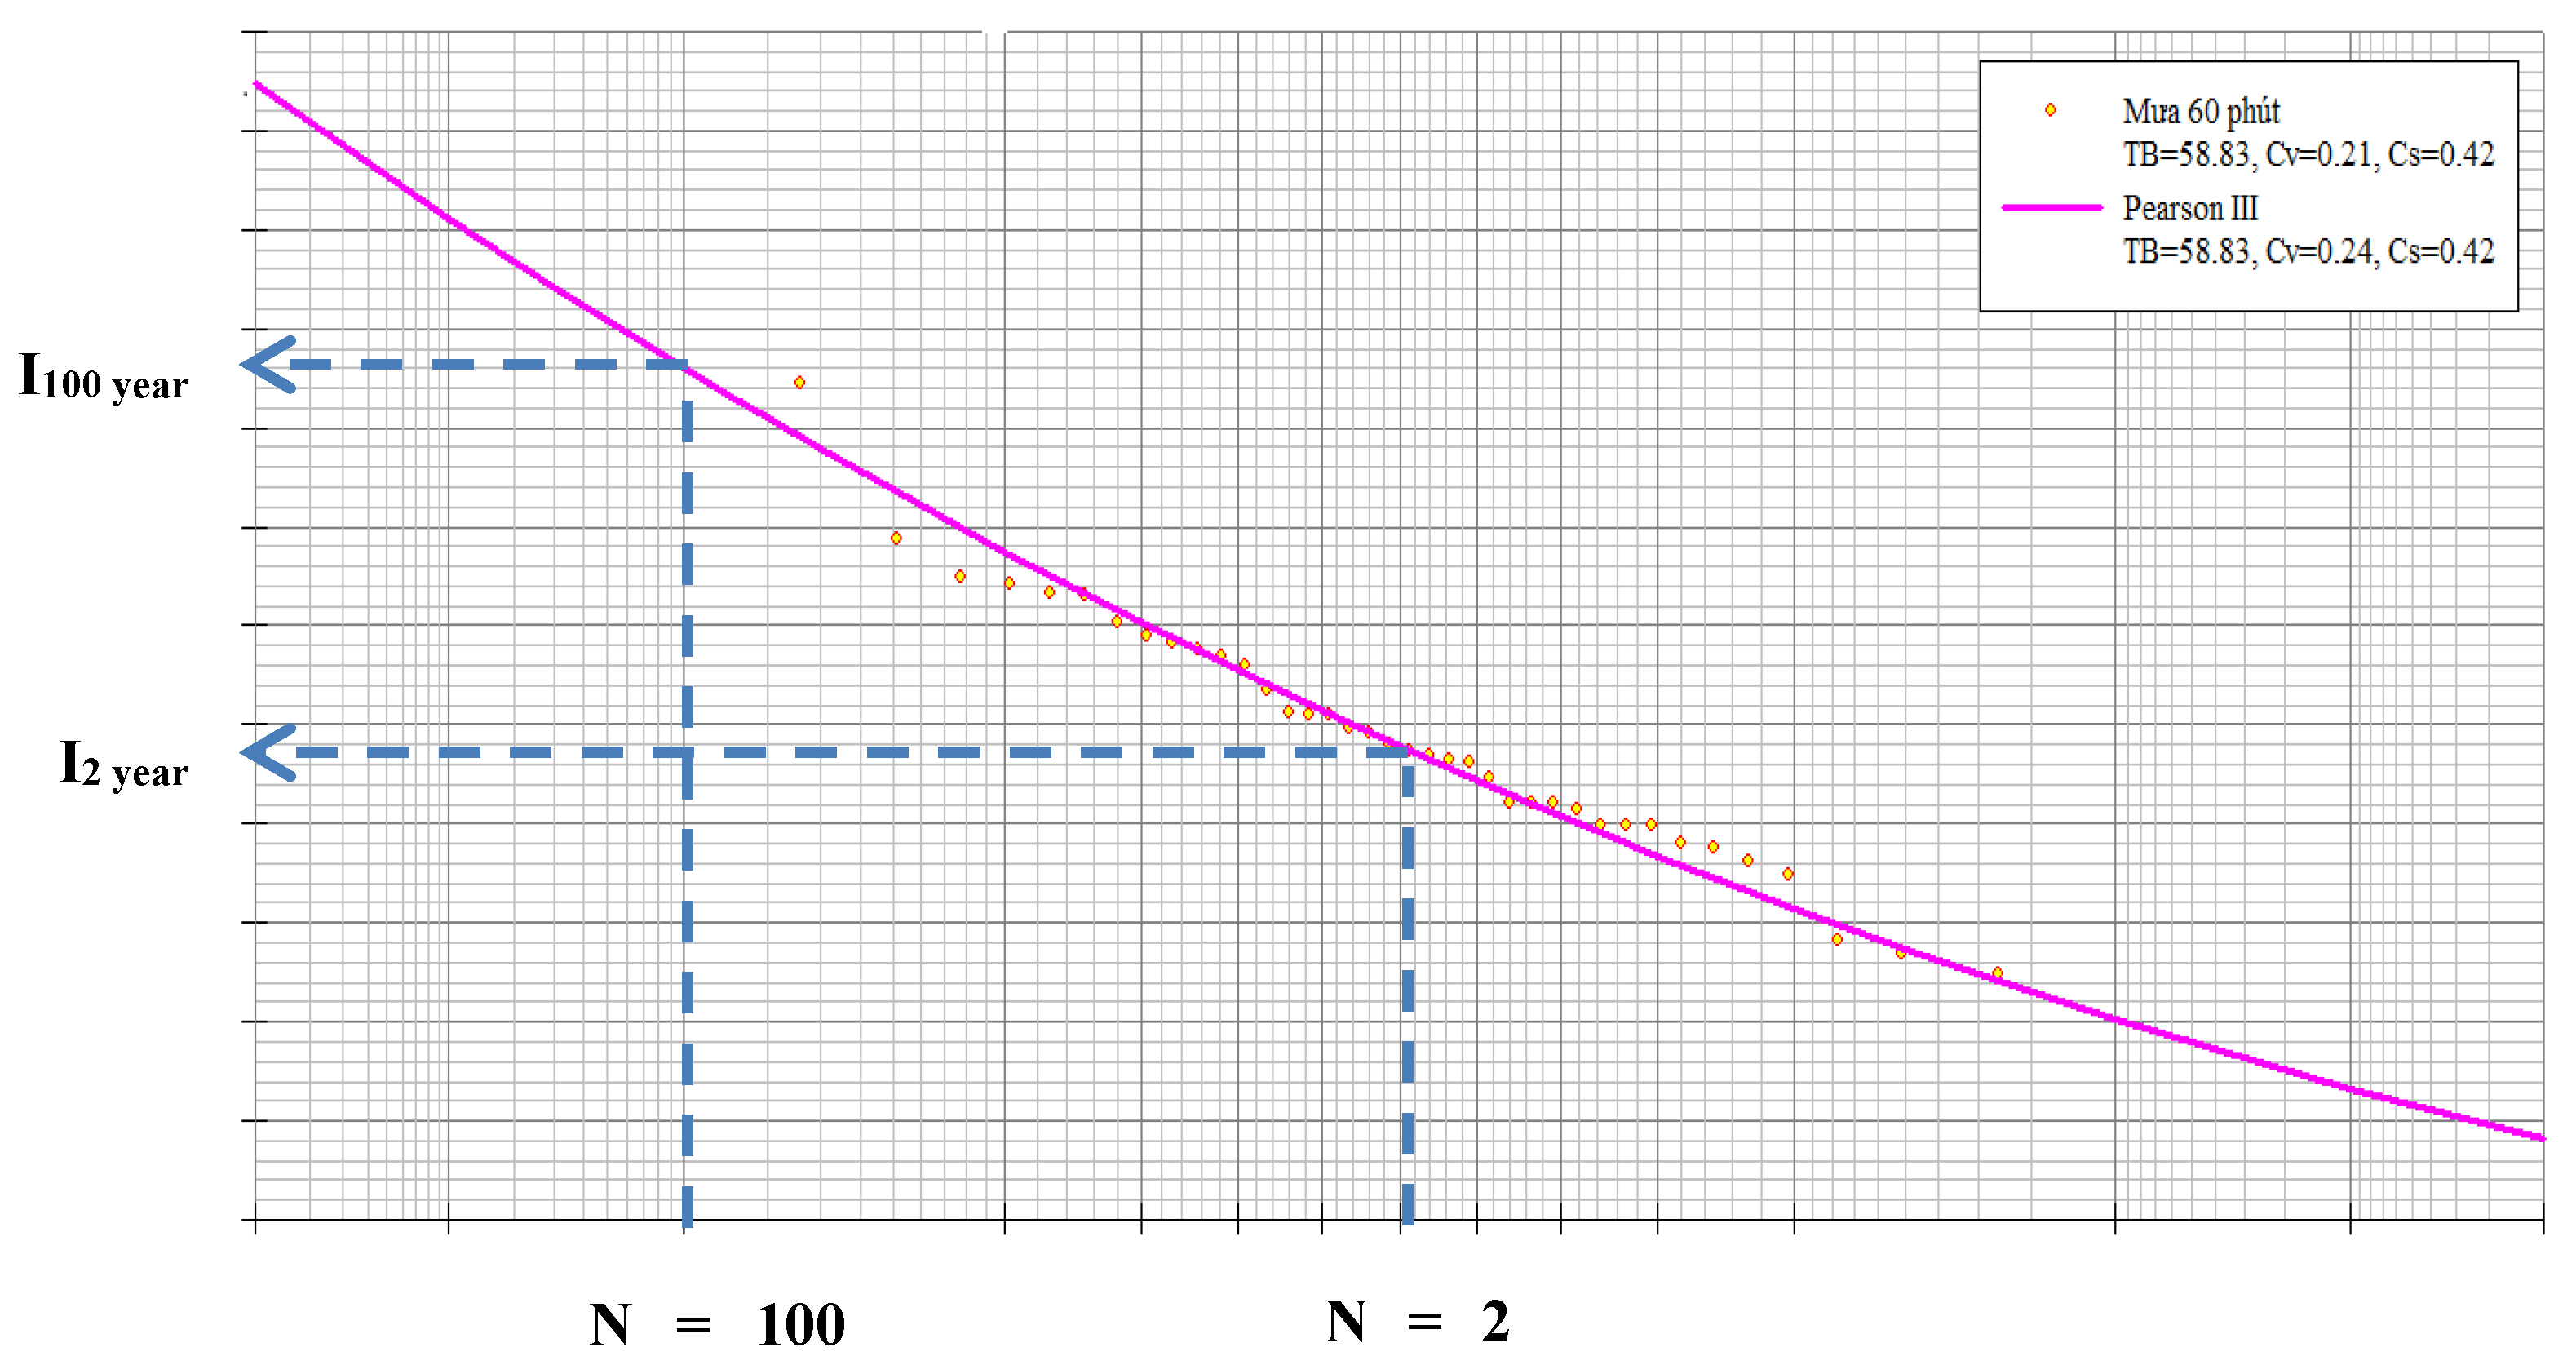
Develop the IDF rainfall curve from the CDF rainfall curve: The rainfall intensity according to the return period can be determined from the curve of cumulative duration frequency (CDF) for each duration of rainfall. Figure 3 offers an illustration of how to calculate the intensity of rain that will fall over a period of 60 min, corresponding to a return period of 100 years and 2 years, respectively. Using this method, the duration and return periods for other rainfall events were determined.

2.1. Development of the IDF Rainfall Curve Using Empirical Formula

The study developed the IDF rainfall curve from empirical formulas according to (i) the Vietnamese standard (TCVN 7957: 2008) [20], (ii) the according to the Department of Hydrology, and (iii) the Ministry of Transport.
To develop IDF rainfall curve according to the Vietnamese standard (TCVN 7957:2008)
q = A ( 1 + C . log P ) ( t + b ) n  
To develop IDF rainfall curve according to the Department of Hydrology
q = q 20 . ( 20 + b ) n . ( 1 + C . l g P ) ( t + b ) n  
To develop IDF rainfall curve according to the Ministry of Transport
q = A + B . l g   N ( t + b ) n
where: q—rainfall intensification ( L s . h a ); t, Td—rainfall duration (minutes); P, f (N)—rainfall event return period (year); A, C, b, n, q20—These parameters were determined according to local conditions ((Vietnamese standard TCVN 7975:2008; for areas not listed in the table, adjacent or the closest areas were used) [20].
In addition, the study was also expanded to include the development of some empirical IDF rainfall curves commonly used in Japan (Kimijima, Bermard, Talbot).
Kimijima :   i = a ( d c + b )
Bermard :   i = a d c
Talbot :   i = a d + b
where: i—Rainfall intensity; d—Rainfall duration; a, b, c—These available parameters are listed in tables.

2.2. Selecting the Most Suitable IDF Rainfall Curve for Can Tho City

To select the most suitable IDF rainfall curve for Can Tho City, the IDF curves built from the empirical formulas were compared with the IDF curve built from the CDF rainfall curve. The study used the EI index, and the root mean standard error (RMSE) for comparison and selection.
E I = i = 1 n ( x i x ¯ ) 2 i = 1 n ( x i y i ) 2 i = 1 n ( x i x ¯ ) 2  
R M S E = i = 1 n ( x i y i ) n 1  

3. Results and Discussion

3.1. Various Rainfall Intensity Duration Assessments

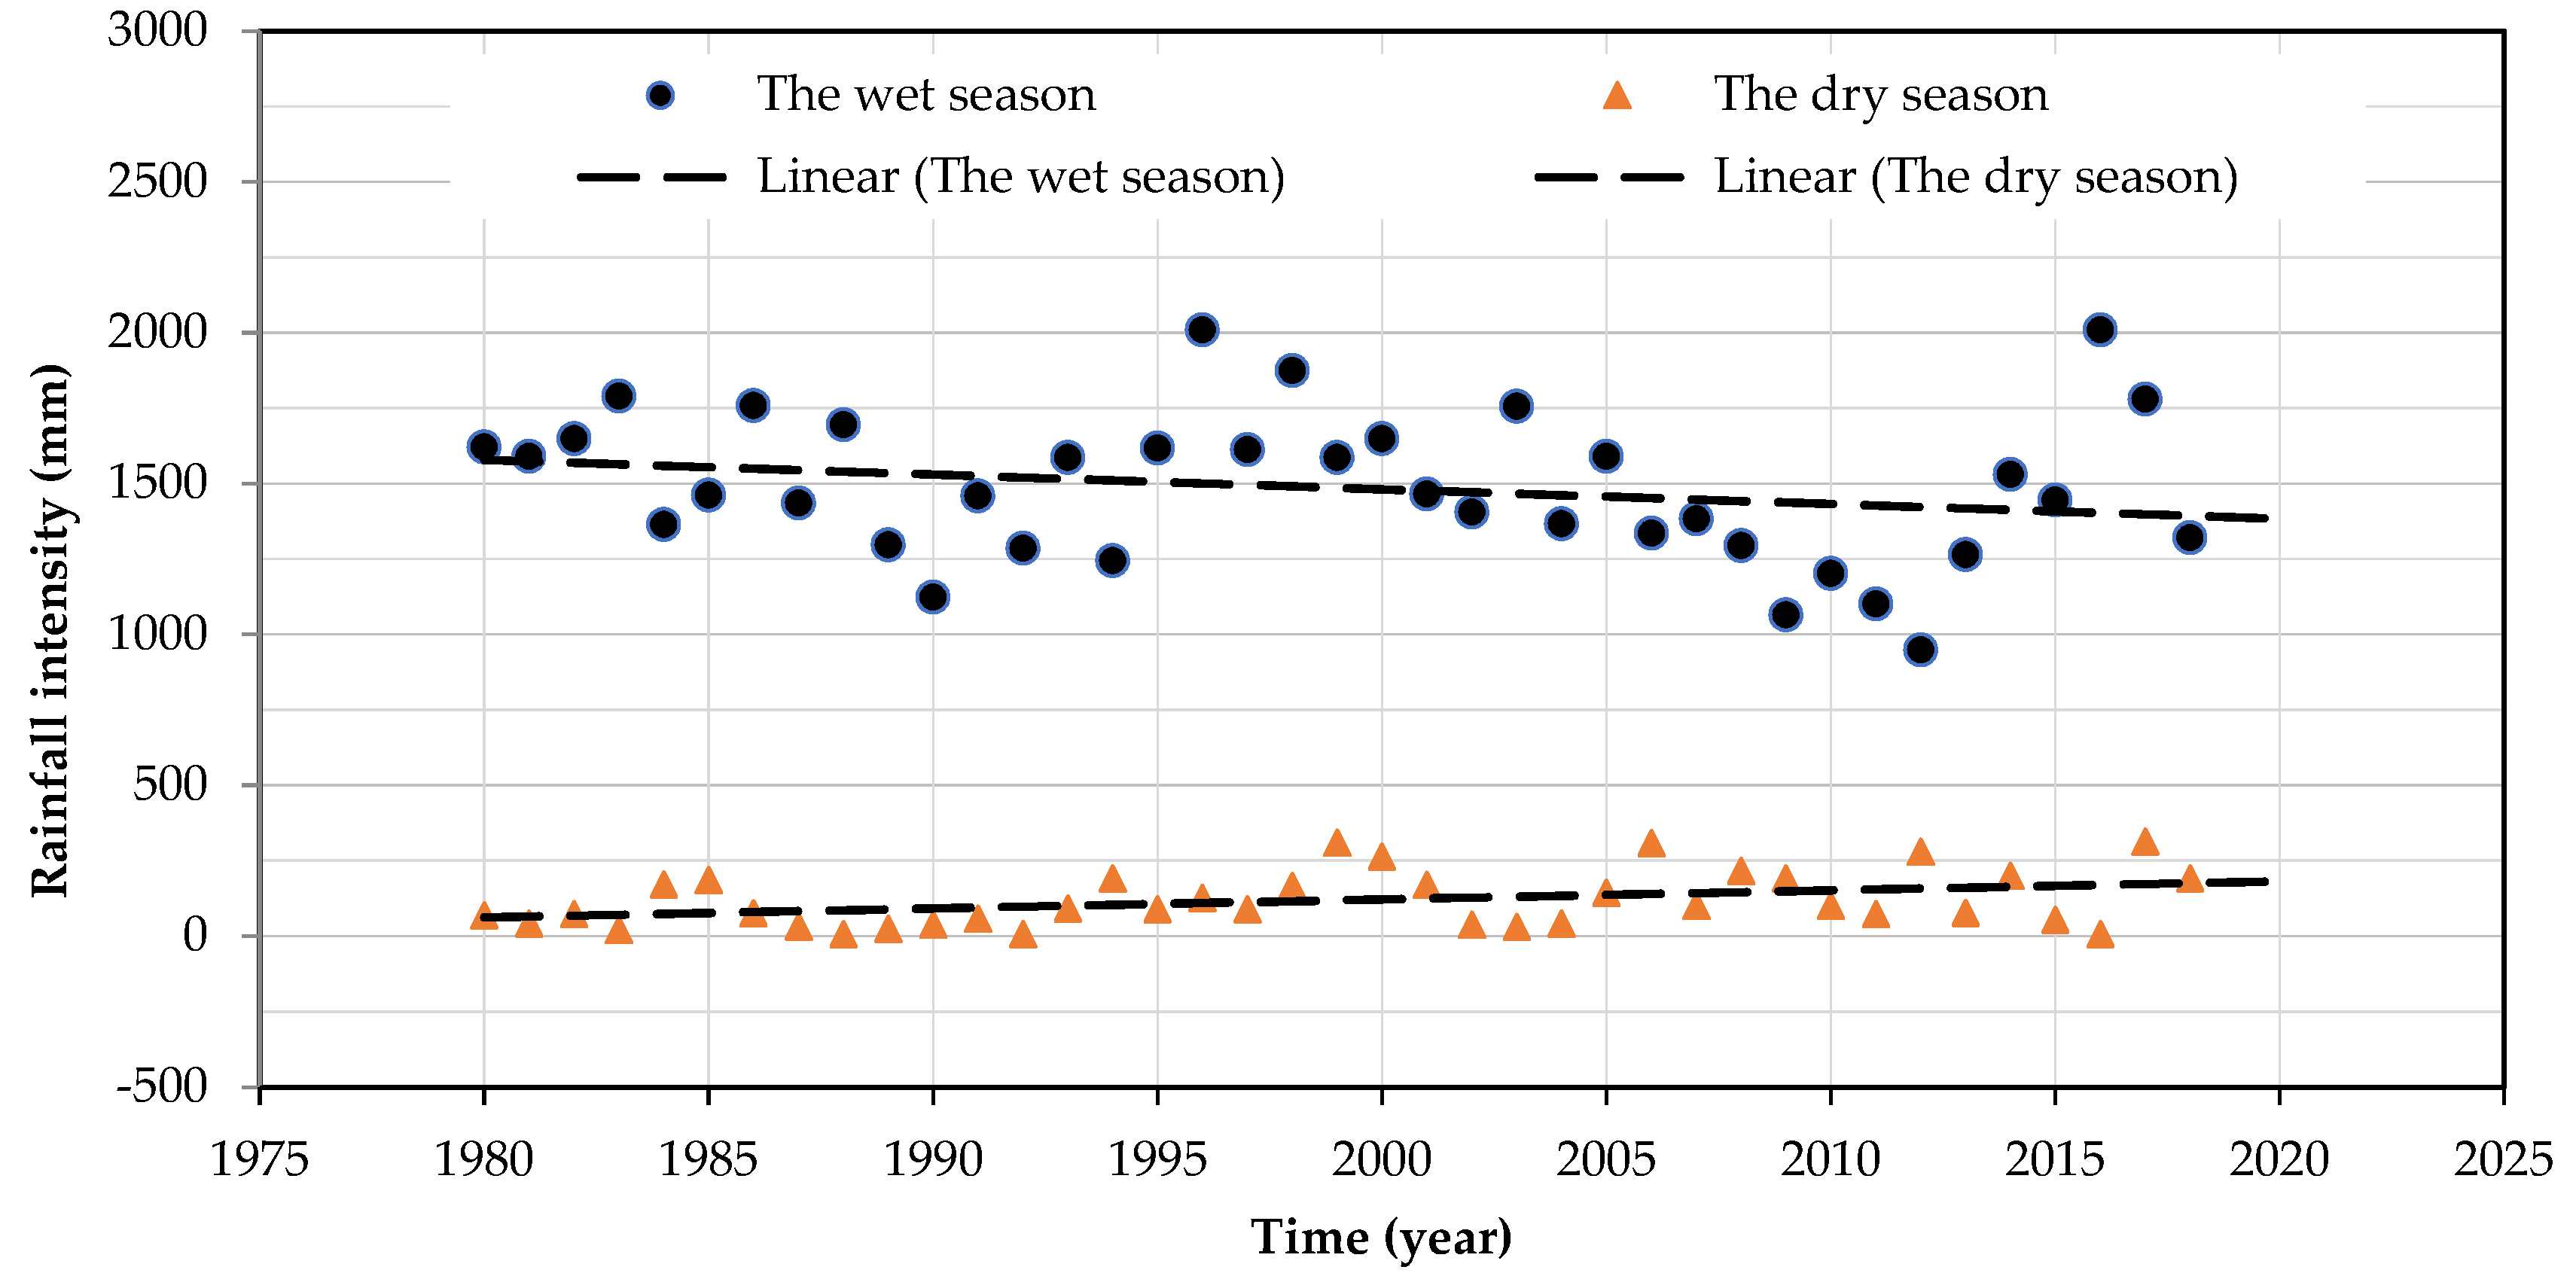
Rainfall measurements collected over 38 years included the long-term rainfall duration (yearly data), and the maximum rainfall intensify for short periods (180 min, 30 min, 60 min, 90 min, 120 min, and 180 min, respectively) as shown in Figure 4.
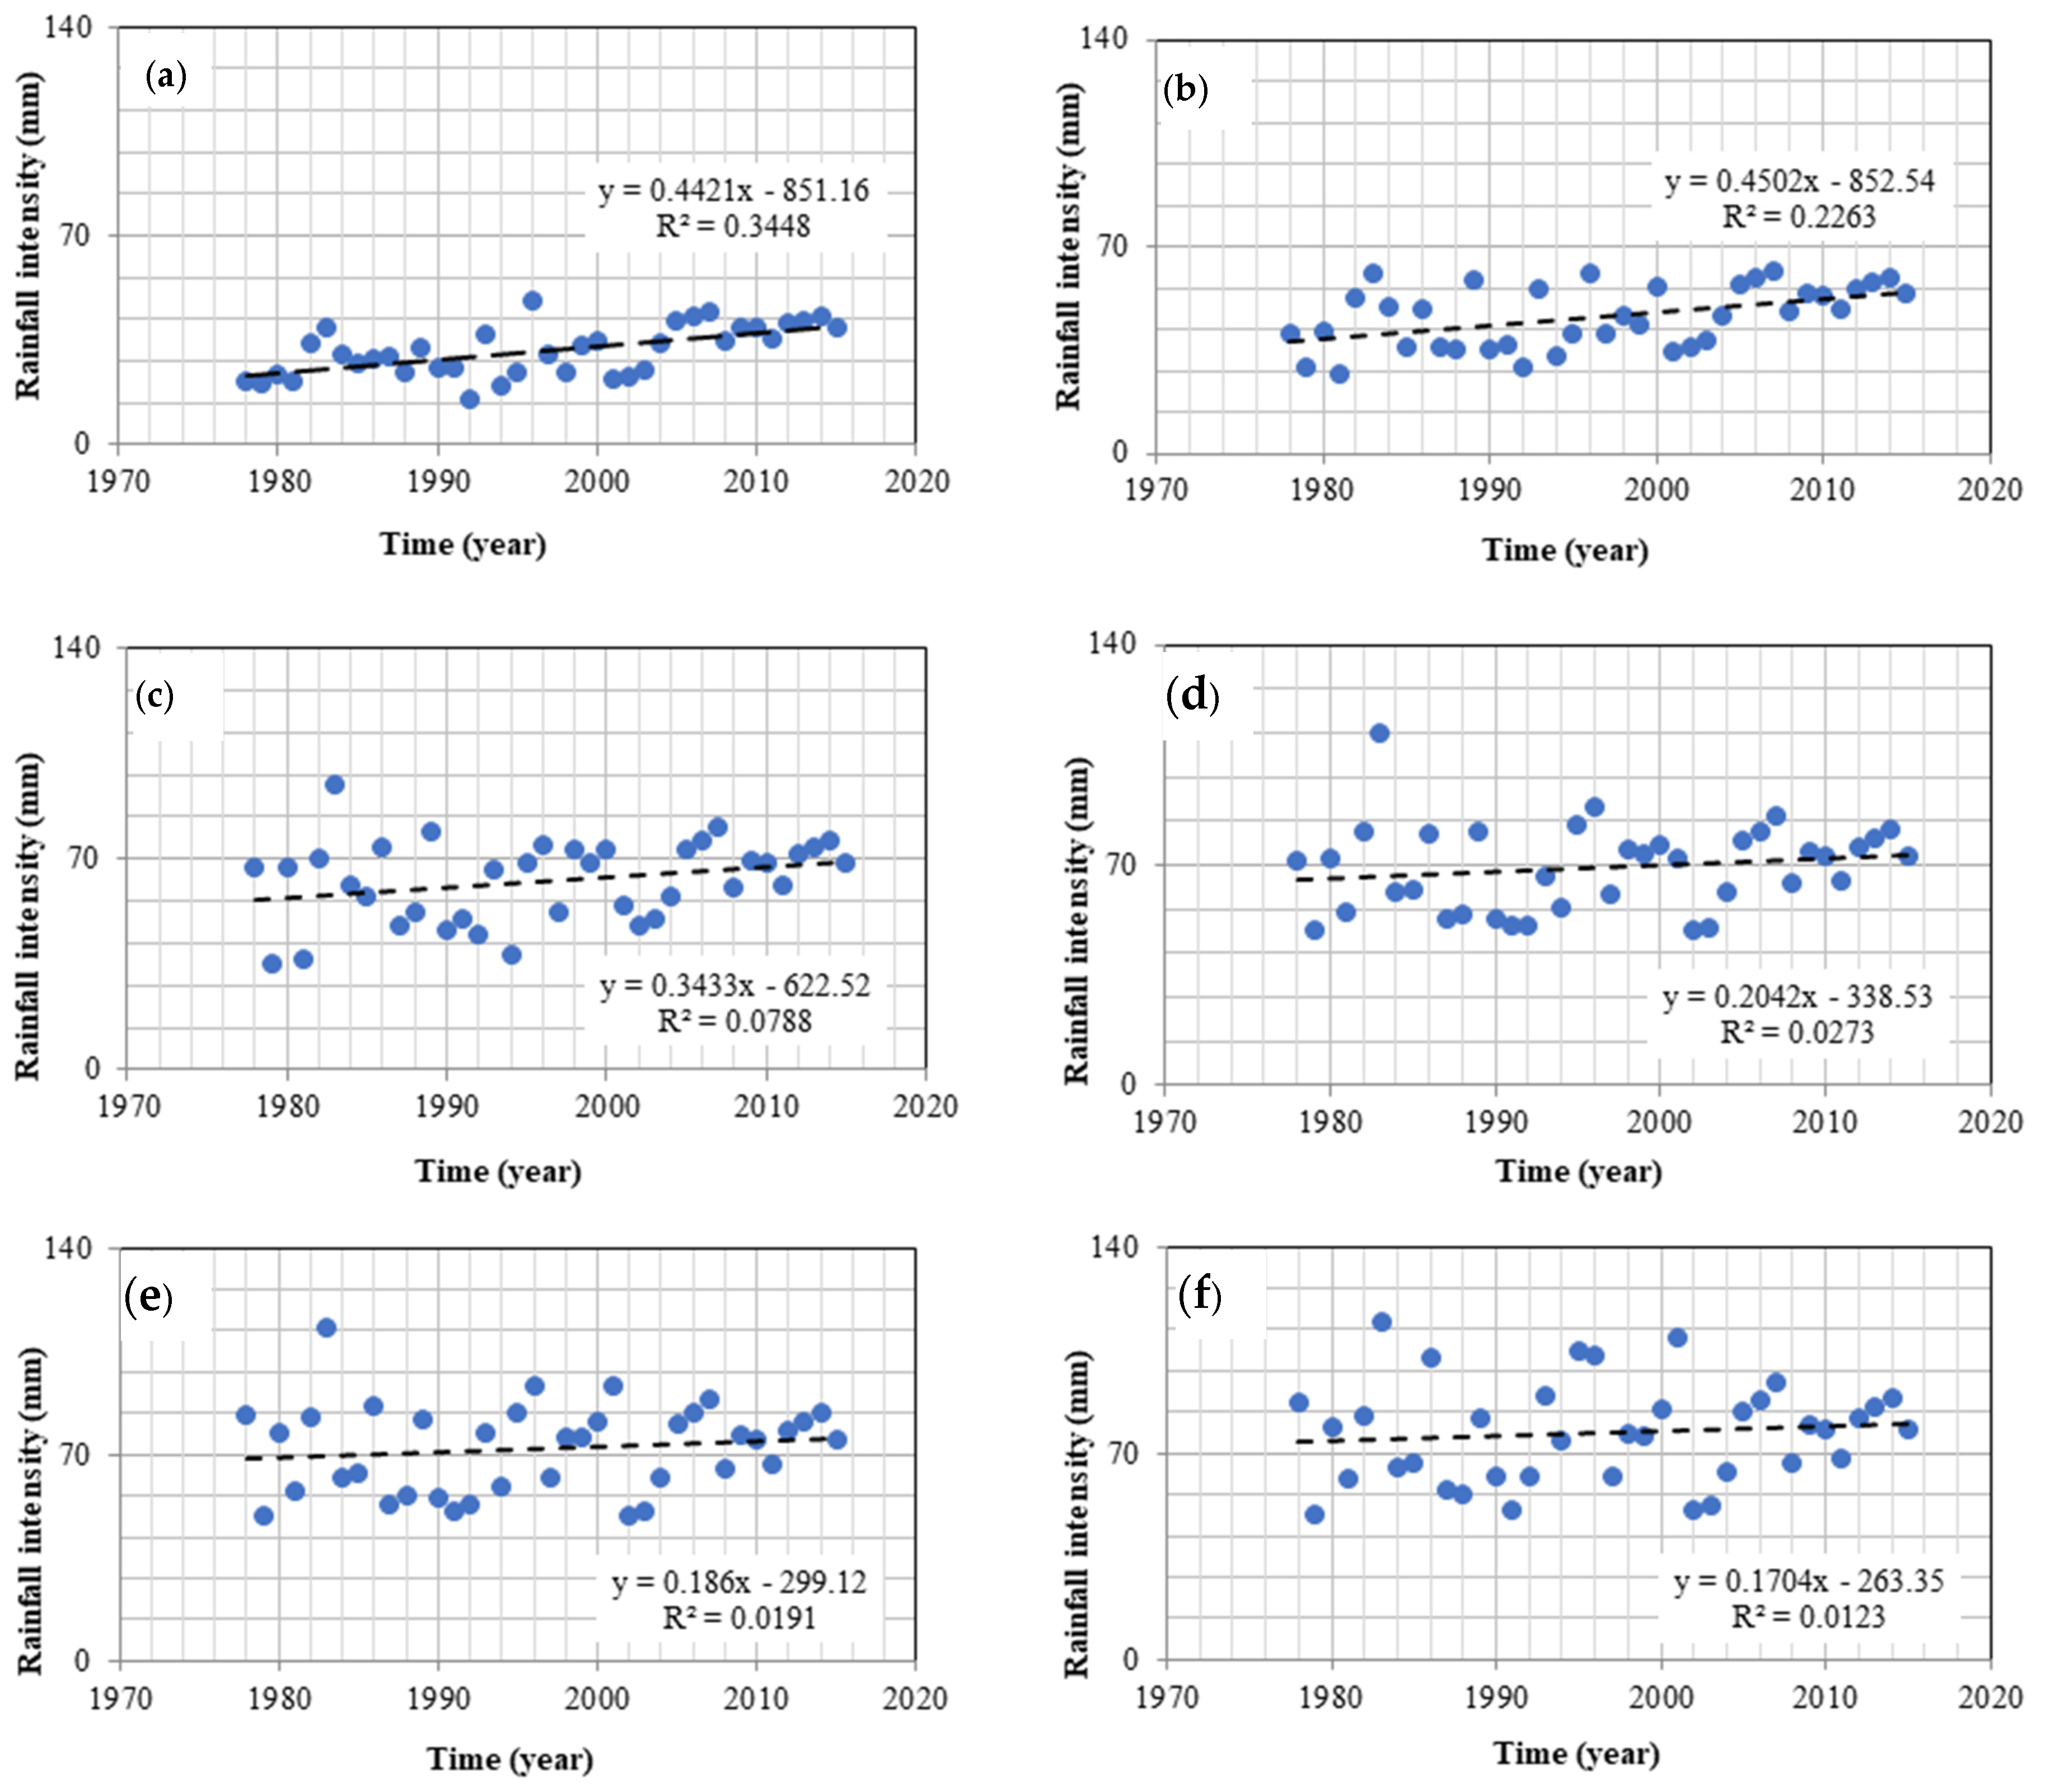
Figure 4 shows that the rainfall in the rainy season and the dry season both increased and decreased alternately over the years. Moreover, the coefficient of variation (Cv) for all periods was quite high ( C v 0.2 ), yet the fluctuations in the periods were found to be not significantly different from each other (Cv ranges from 0.2 to 0.3) (Table 1). The high Cv showed that the level of precipitation varied from period to period over the years. Although Cv was quite high, the data series of 38 years for Can Tho station is quite long, so σ x ¯ 6 % in all time periods. According to the Code of Calculation of Design Hydrological Characteristics (1997), the 38-year data series is reliable enough to represent the Can Tho station for calculating the cumulative rainfall frequency distribution. On the one hand, Figure 5 shows rainfall in the rainy season has tended to decrease, while on the other hand, the rainfall in the dry season has tended to increase. Rainfall in each period (15 min, 30 min, 60 min, 90 min, 120 min, and 180 min) has also tended to increase. Furthermore, rainfall over shorter periods has tended to increase, more than rainfall over longer periods. However, these uptrends showed low R-square values.

3.2. Developing an IDF Rainfall Curve Based on CDF Rainfall Curve

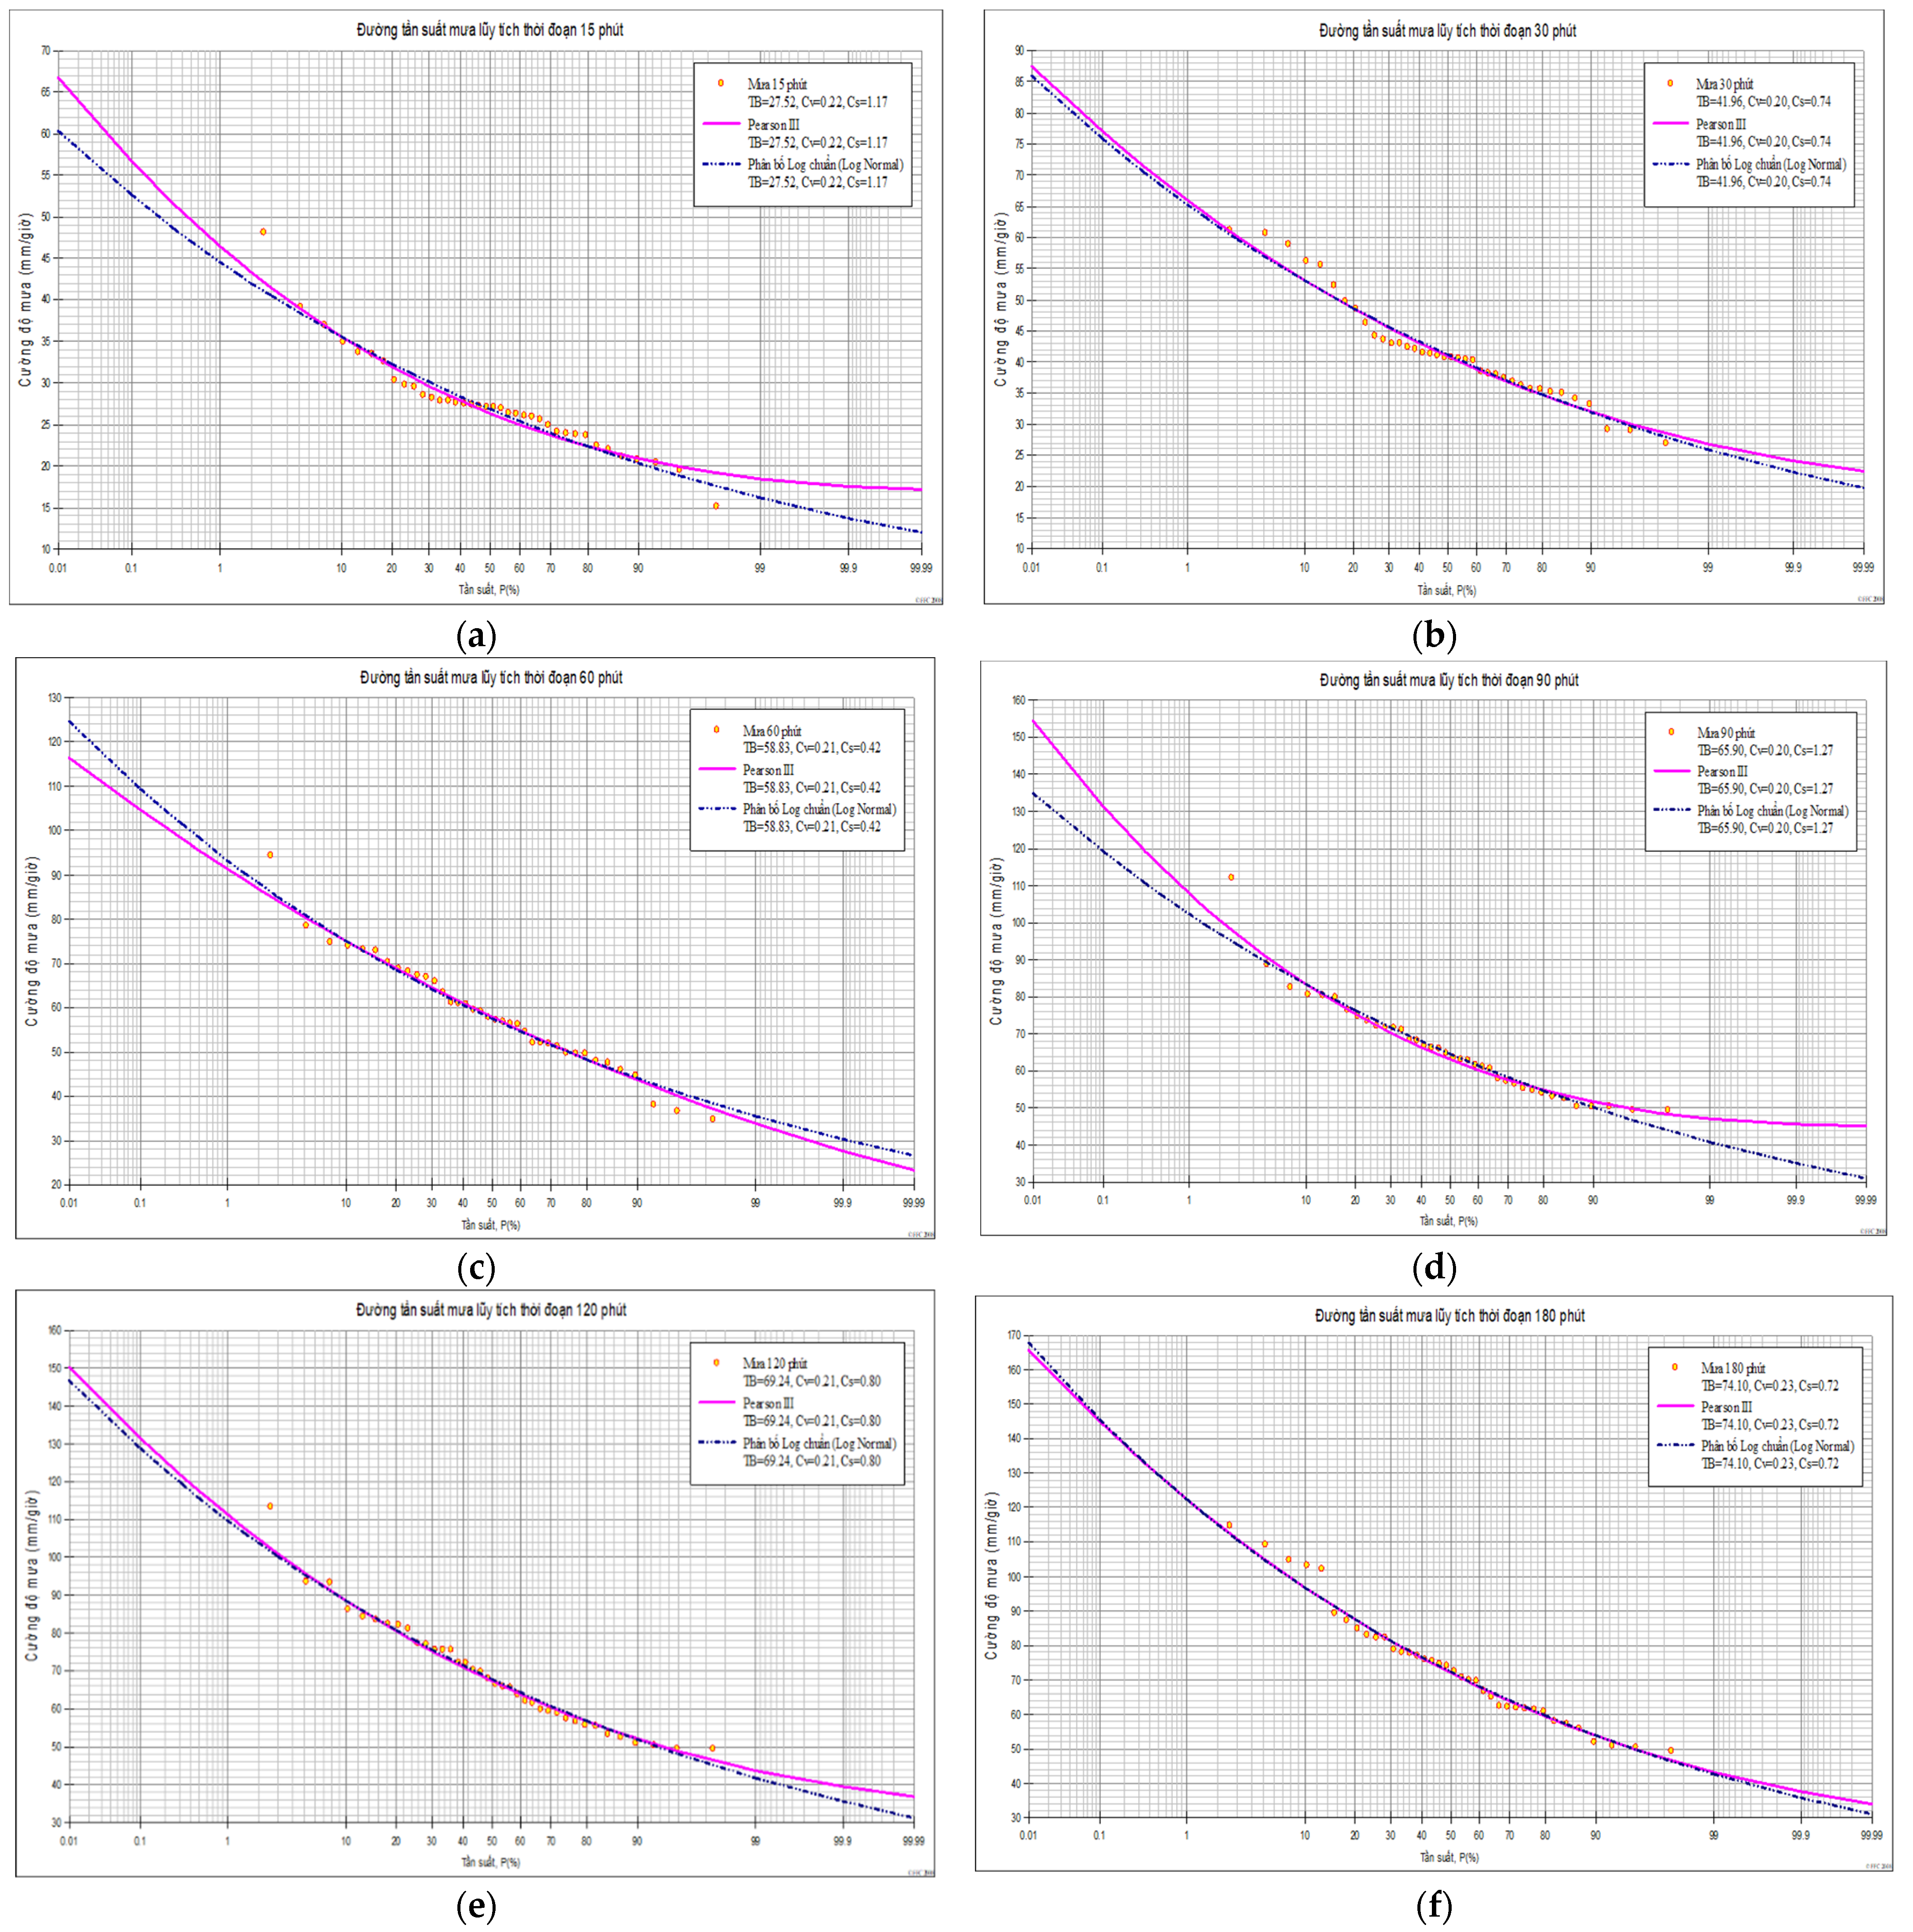
The CDF was built from the three distribution curves, P.III, Log-P.III, and Log-Normal 3 parameters in a short period of time (<1 day). The Log-P.III distribution pattern showed that it was only suitable for the rainfall measured in the 60-min duration and 180-min duration, while the remaining durations were deemed not suitable with the measured data obtained from Can Tho station. While P.III, Log-Normal III were suitable for the rain durations (15 min, 30 min, 60 min, 90 min, and 180 min). The study calculated and compared the RMSE between P.III and Log-N-III, with the results suggesting that the P.III curve is more consistent with the actual measured points at each calculation period than the with Log-N.III three parameters. Therefore, the study selected P.III to build the CDF curve for each period in this study. Figure A1 shows the distribution of P.III and Log-N-III for the rain monitoring points of each period at Can Tho station.
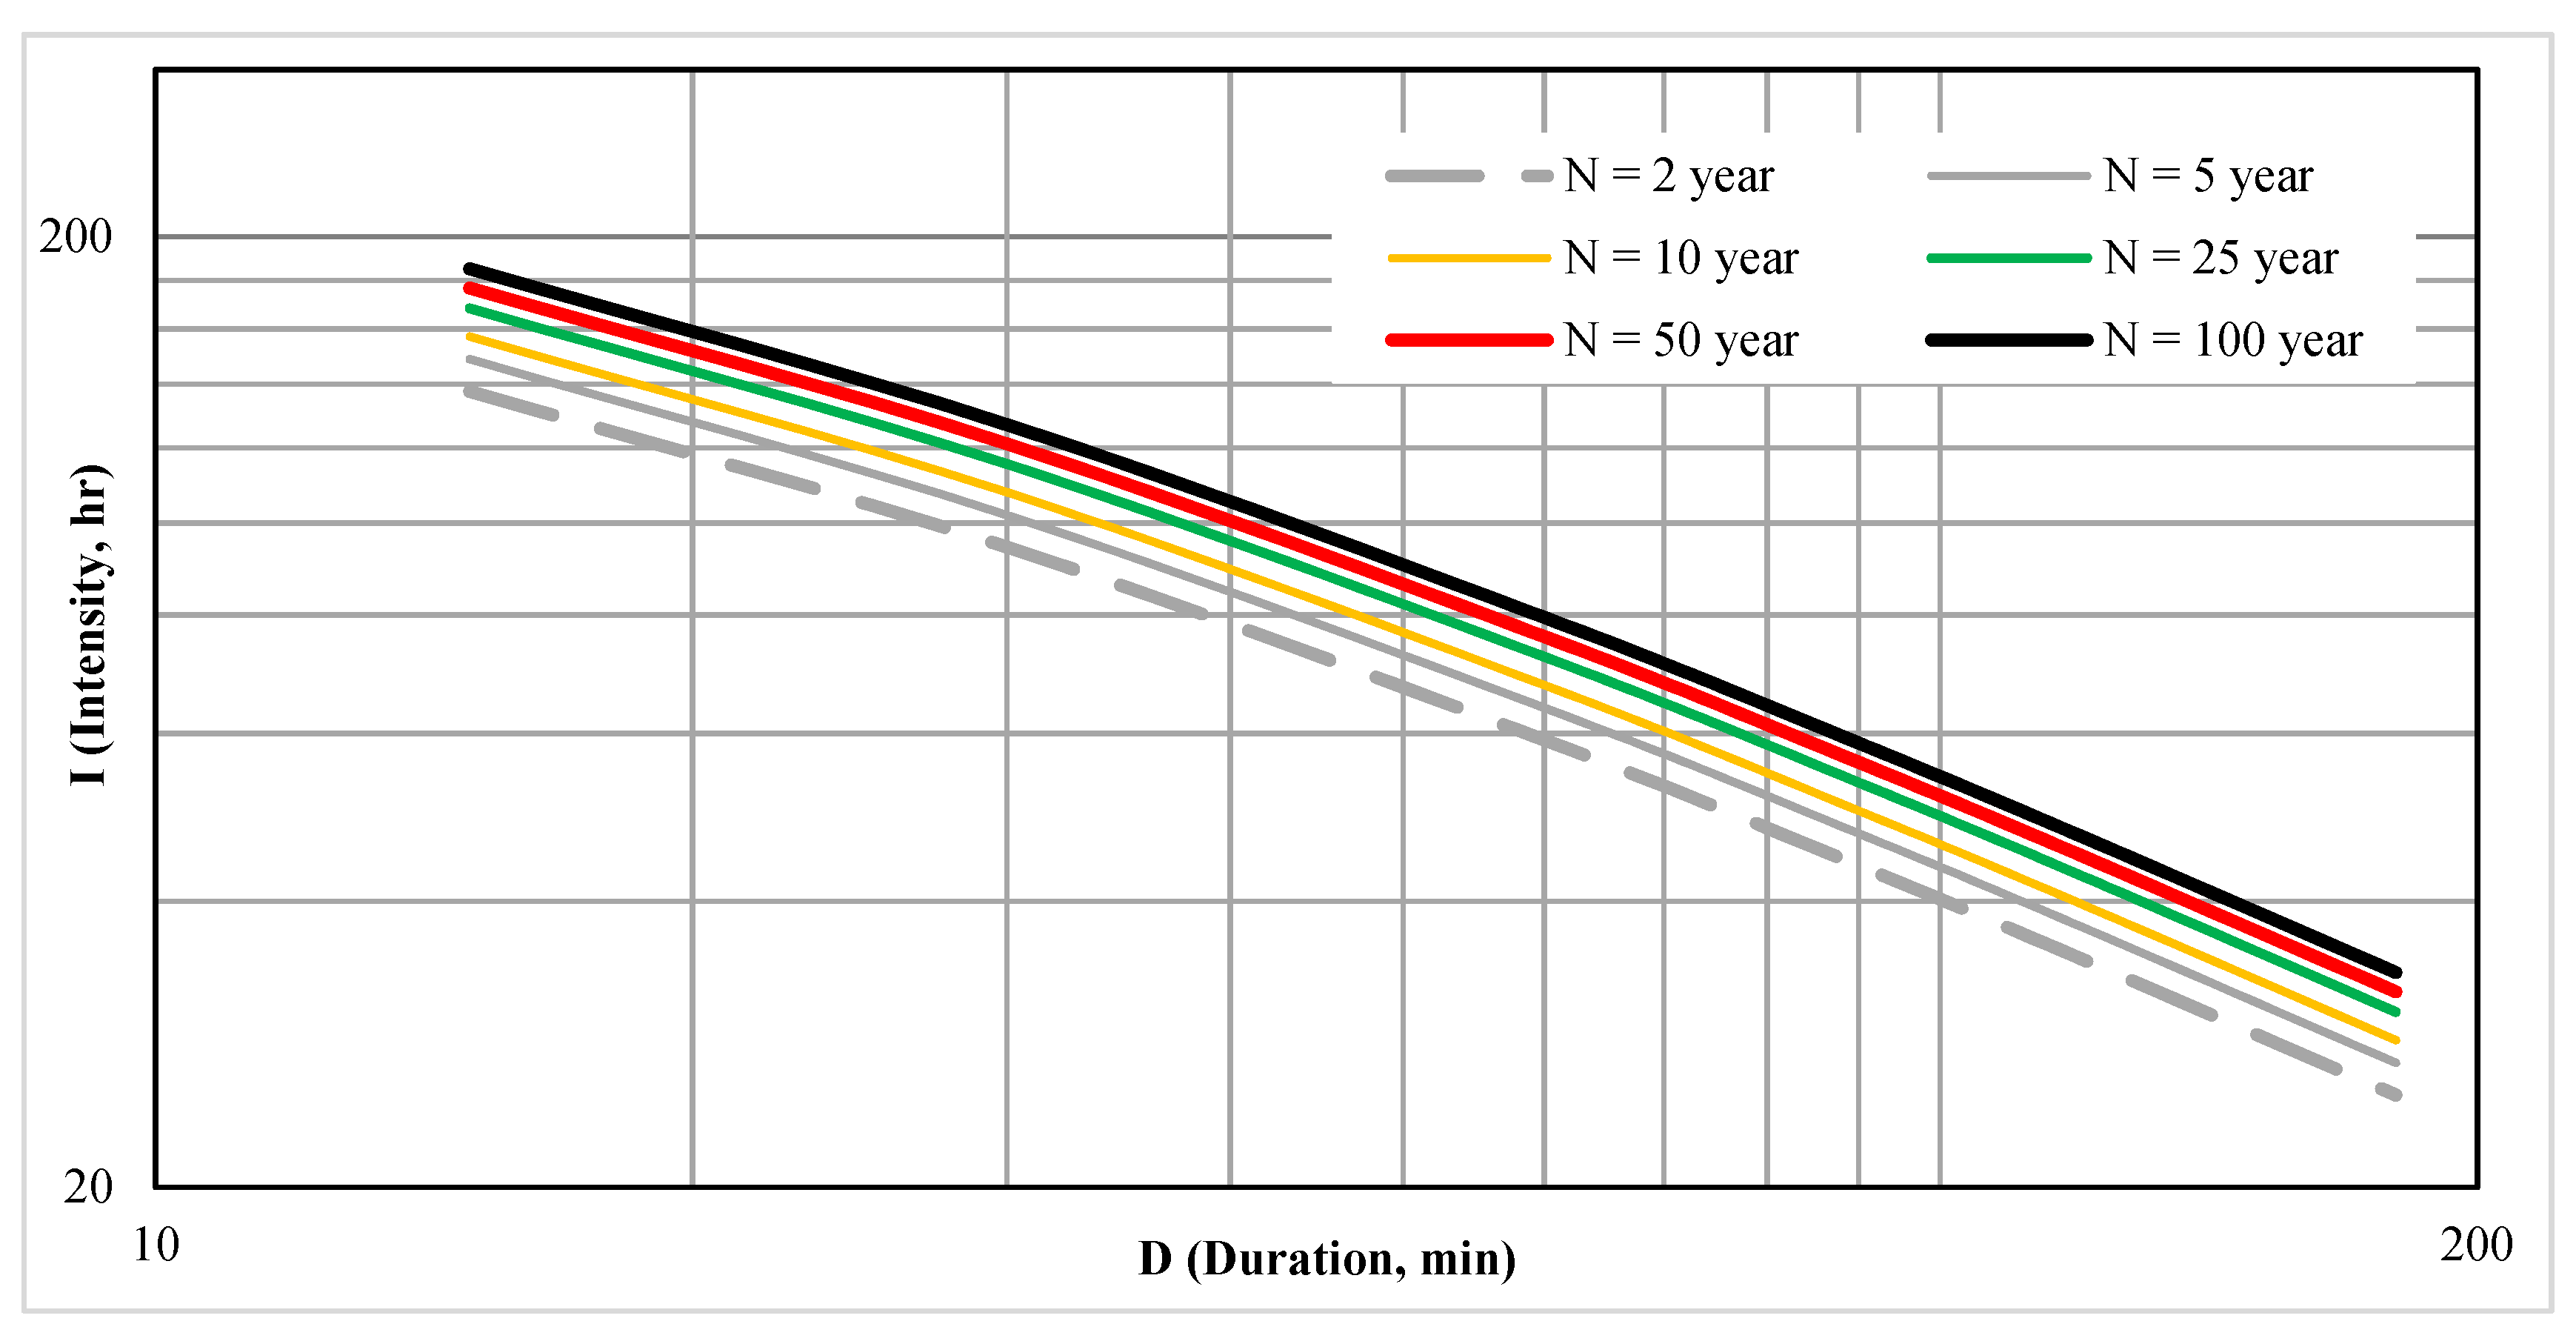
Based on each calculation period and repeatability, the study found the corresponding rainfall intensity (mm/h) shown in Figure 6.

3.3. Development of IDF Rainfall Curve from Empirical Formulas According to the Vietnamese Standard (TCVN 7957:2008), the Department of Hydrology, and the Ministry of Transport

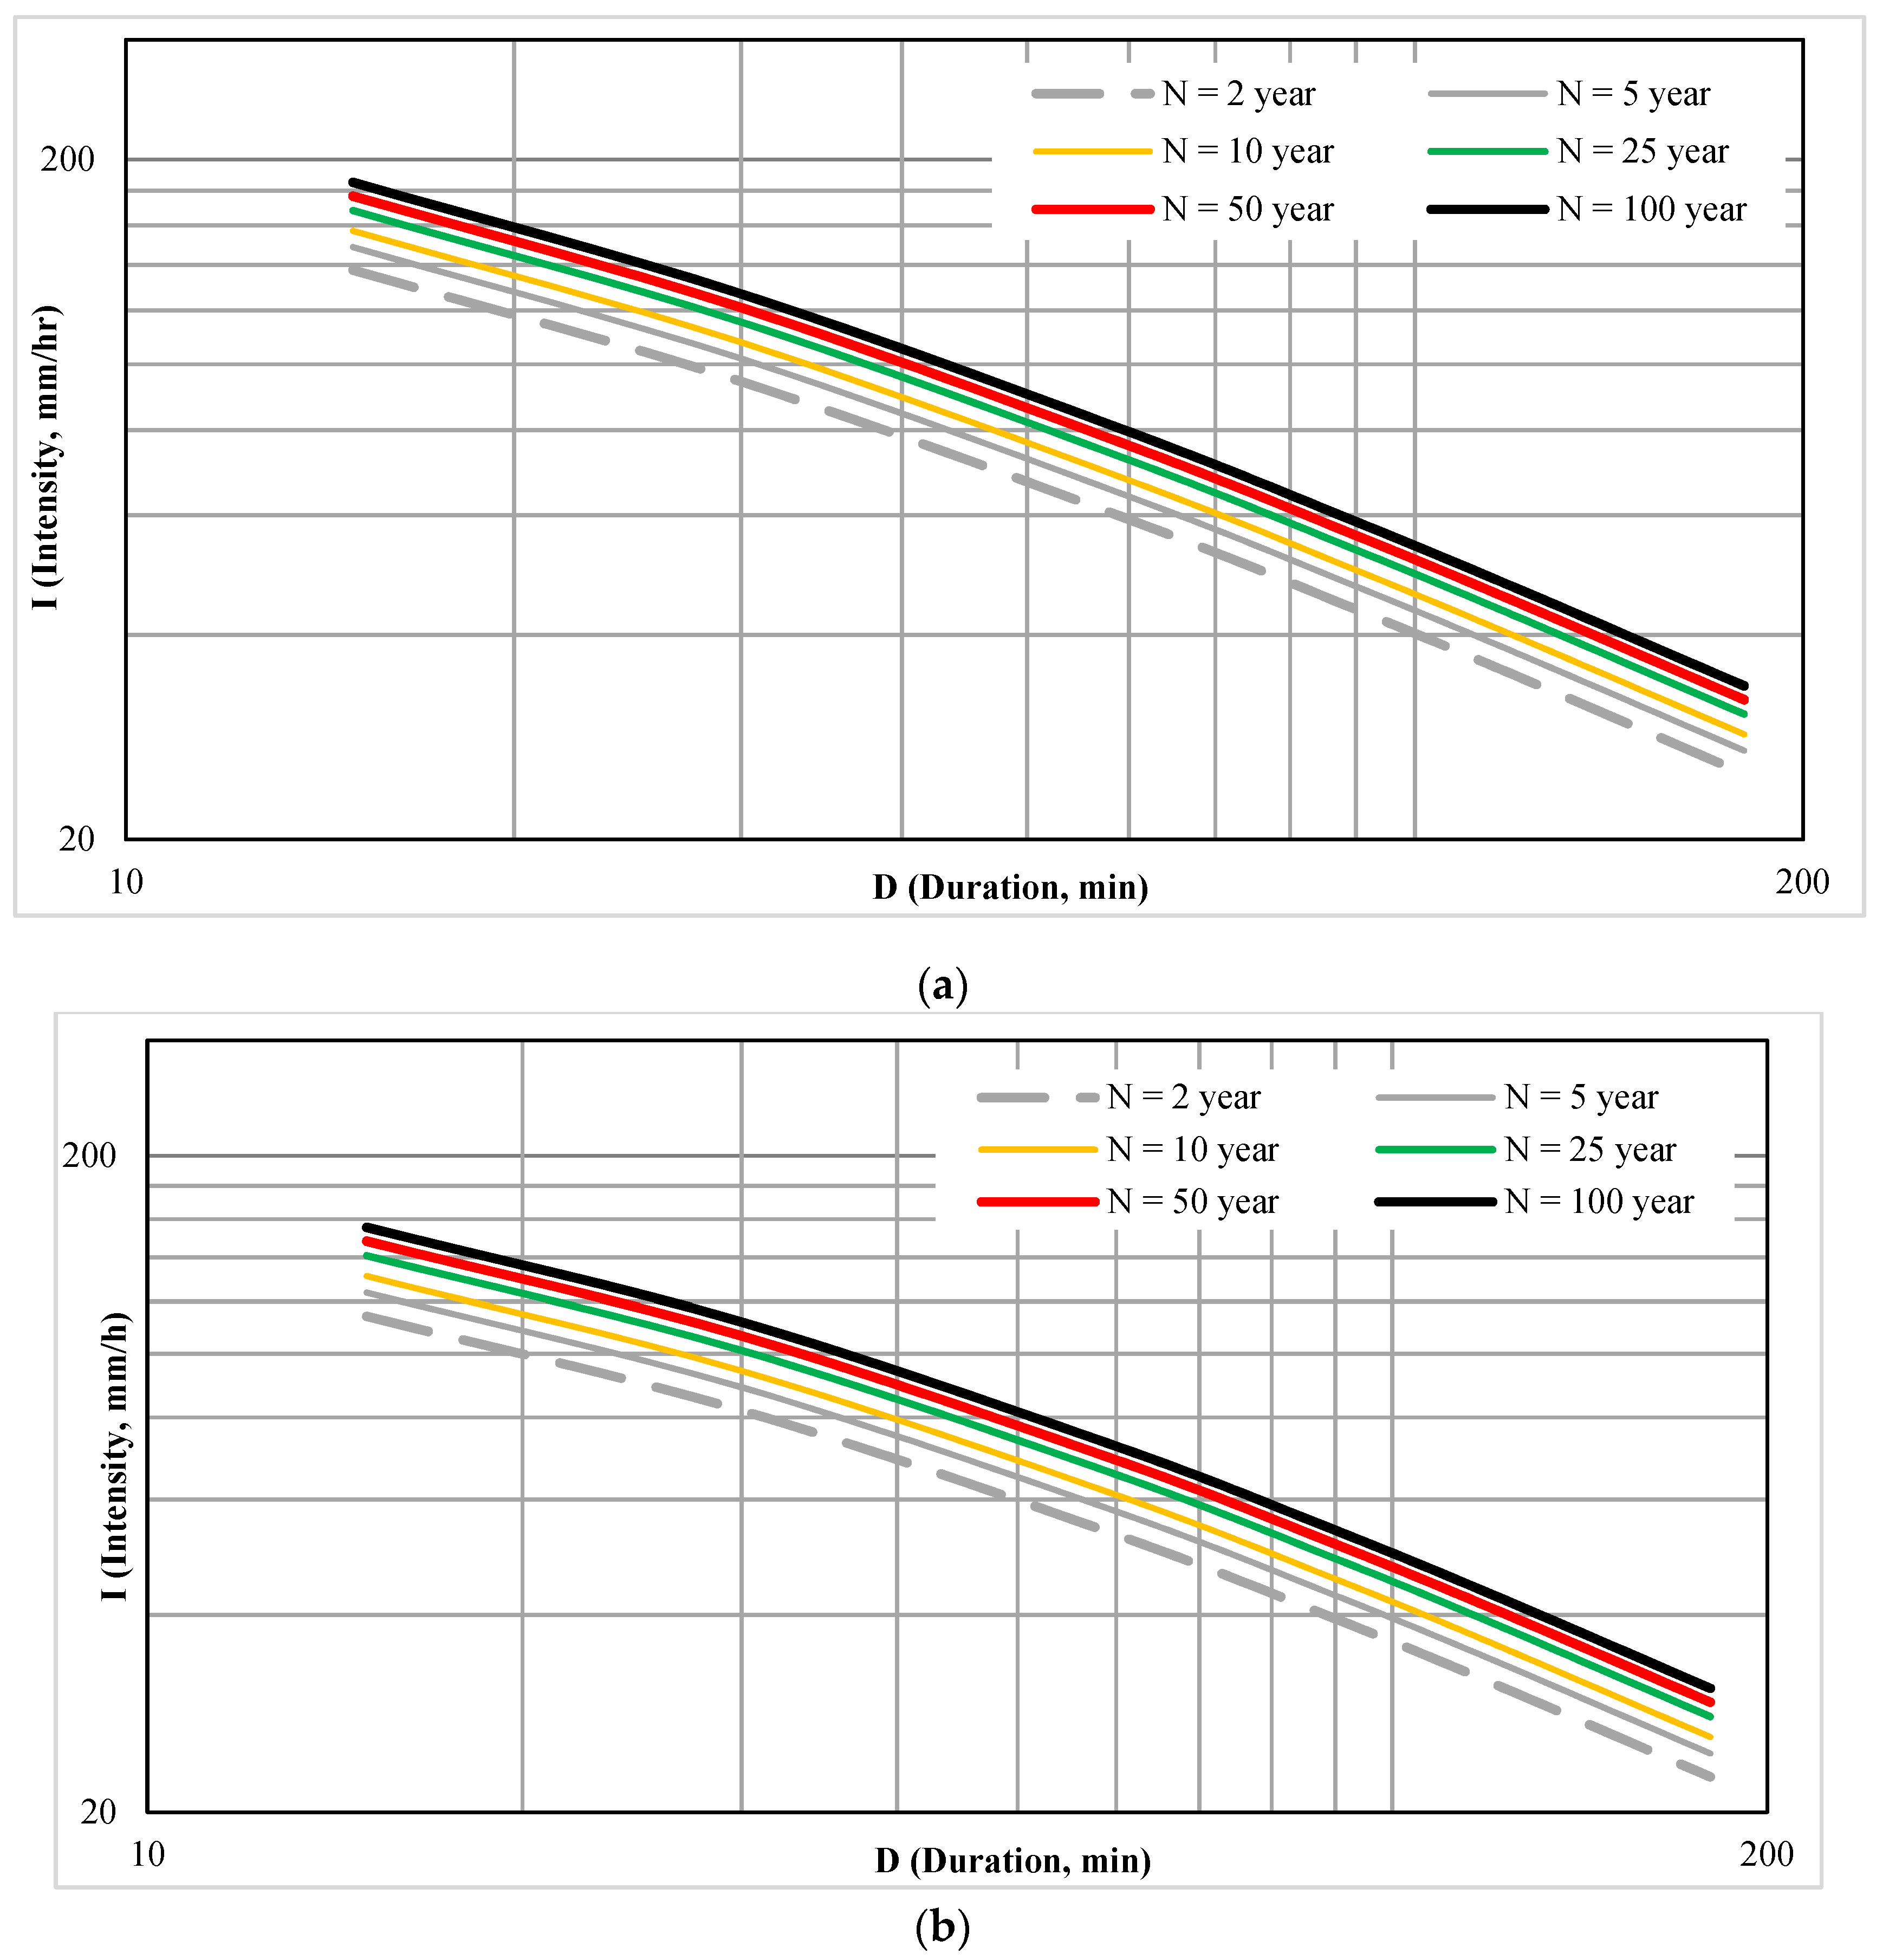
According to the Vietnamese design standards (TCVN 7957:2008) on drainage-external networks and structures, to determine the intensity of rainfall in each return period, it is possible to use a curve or other empirical calculation formulas for comparison. Therefore, we attempted this with two experimental formulas proposed by TCVN 7957:2008. Climatic parameters were not shown for the study area (Can Tho City) in the table according to TCVN 7957:2008. Therefore, the study compared the data of two neighboring stations (stations in Ho Chi Minh City and Ca Mau). The results show that the parameters in Ca Mau were best suited to the study area, as shown in Figure 7.
Similarly, the IDF rainfall curve built on the empirical formula of the Department of Hydrology and the Ministry of Transport is shown in Figure 8.

3.4. The IDF Rainfall Built from Empirical Formulas That Have Been Used in Some Asian Countries

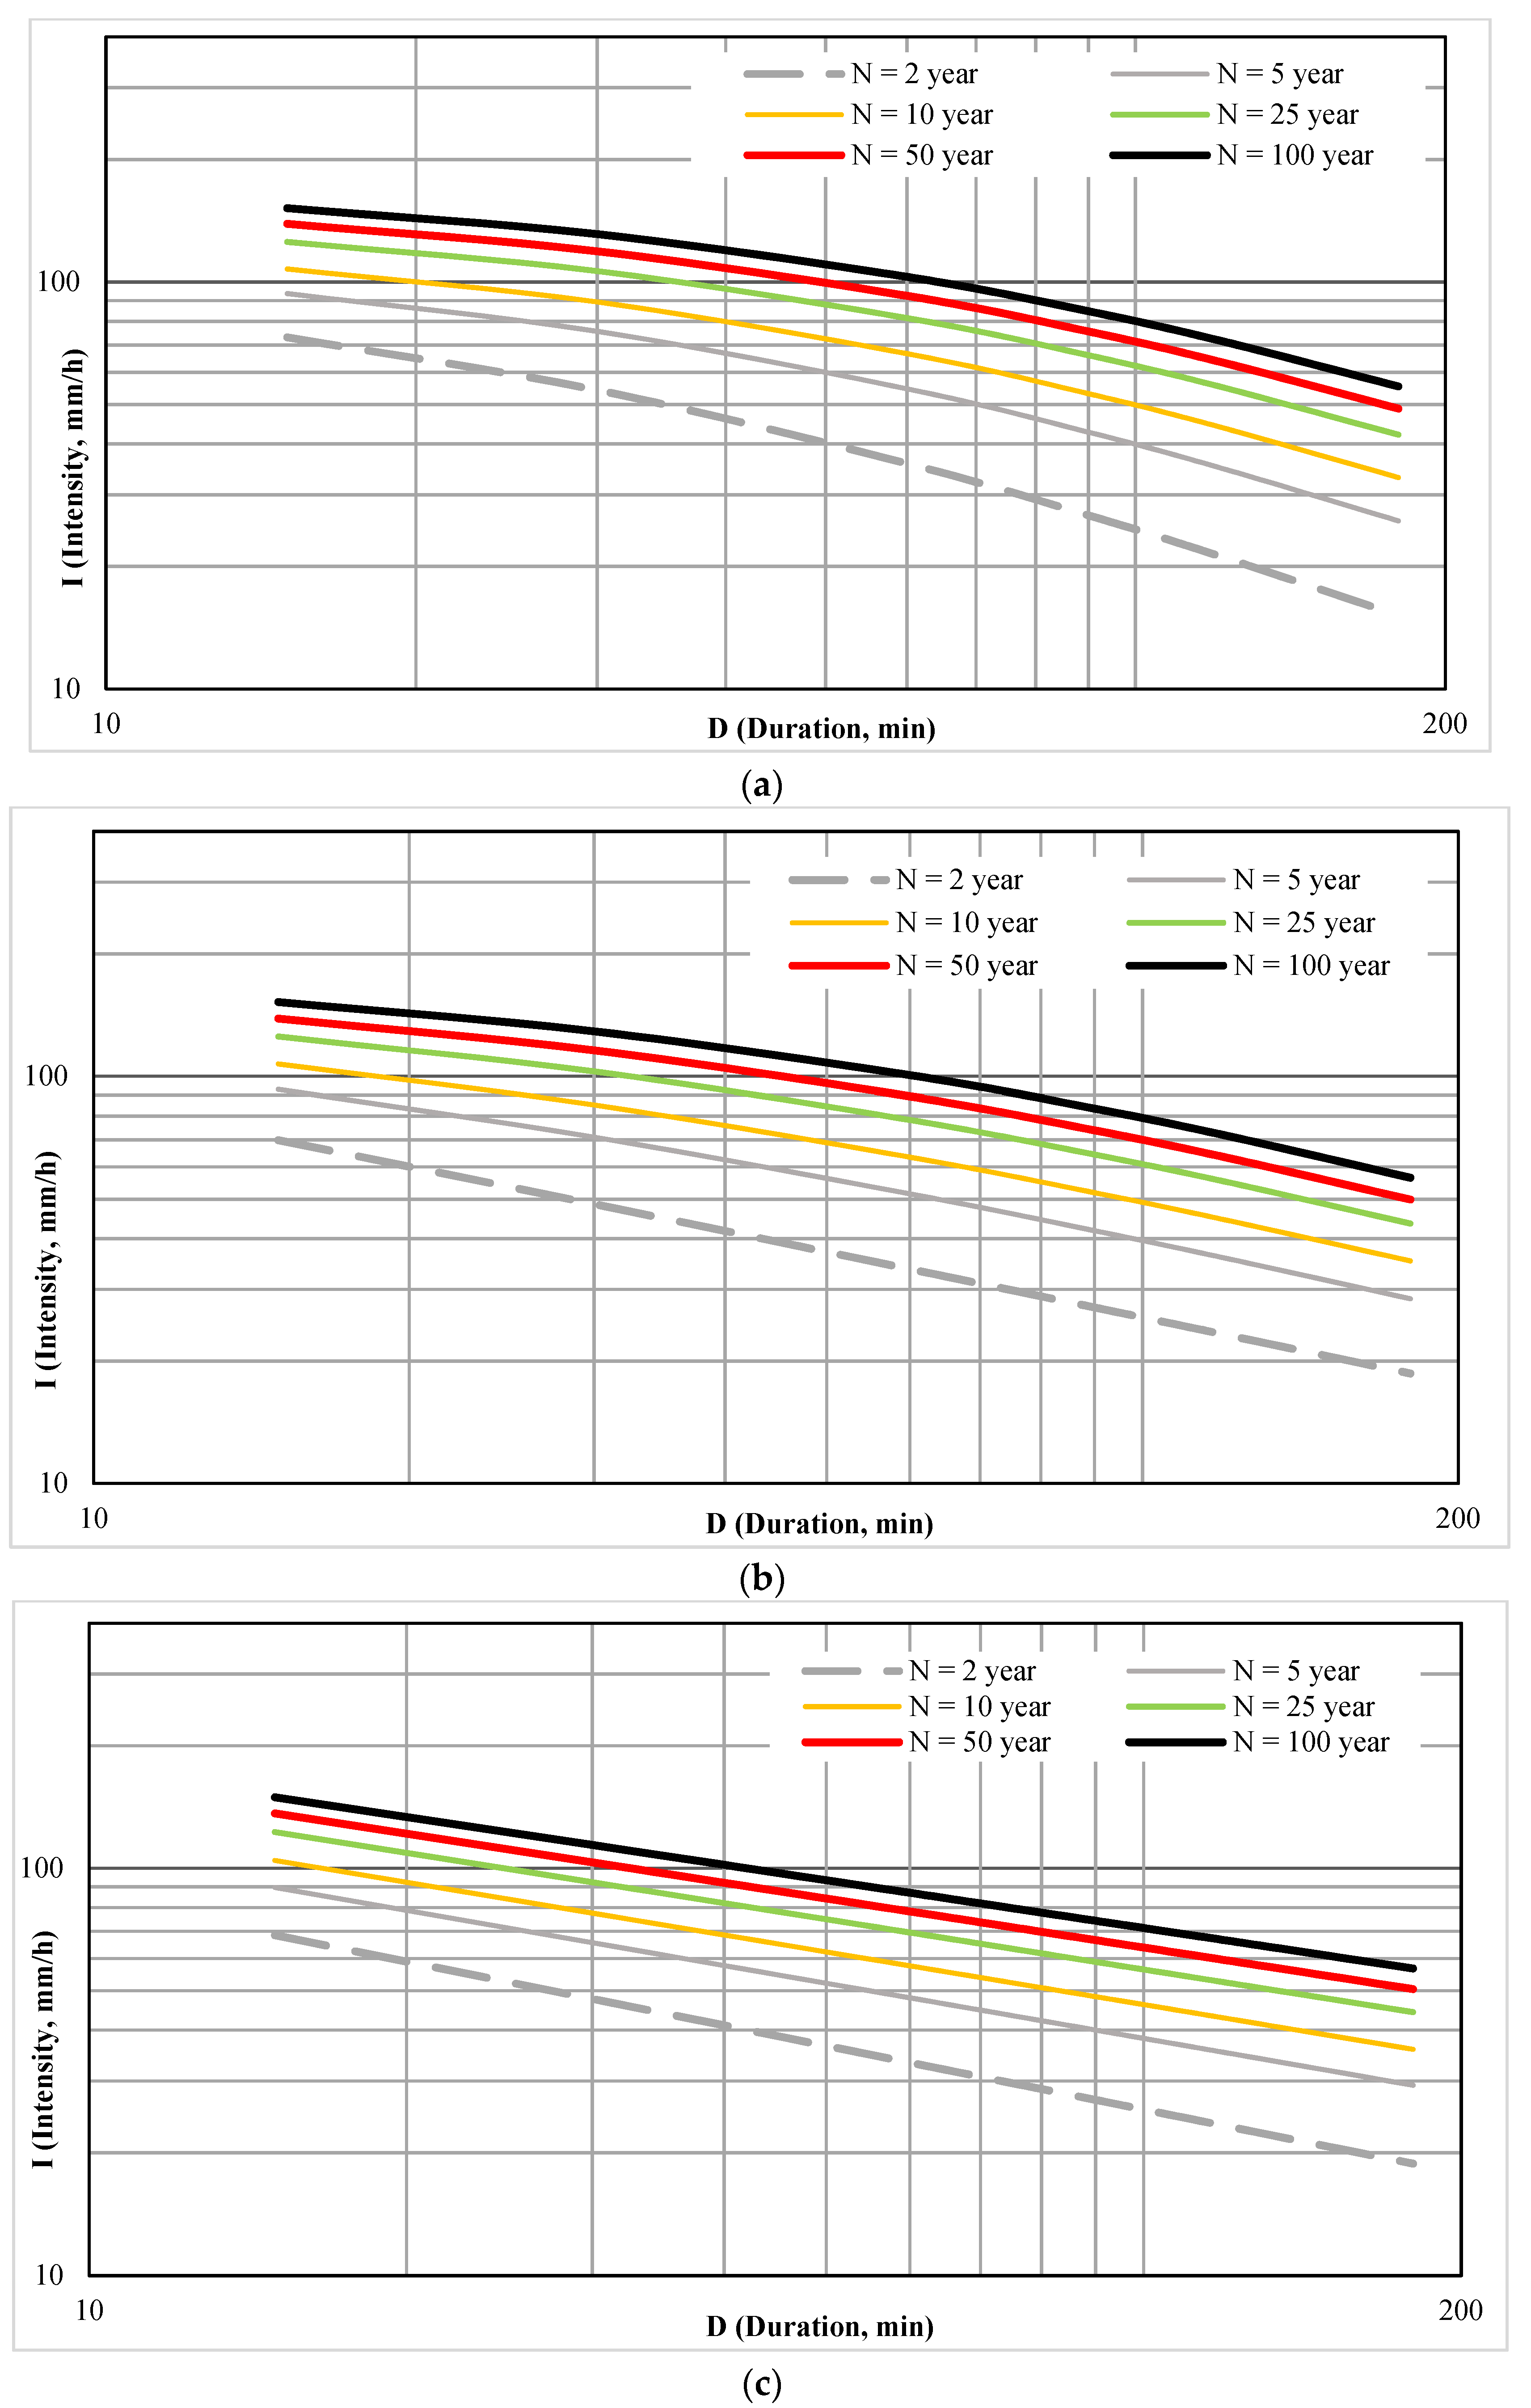
Furthermore, the results of IDF curves according to Talbot, Kimijima and Bermard are shown in Figure 9.

3.5. Compareration the Selection of IDF Curves for the Study Area

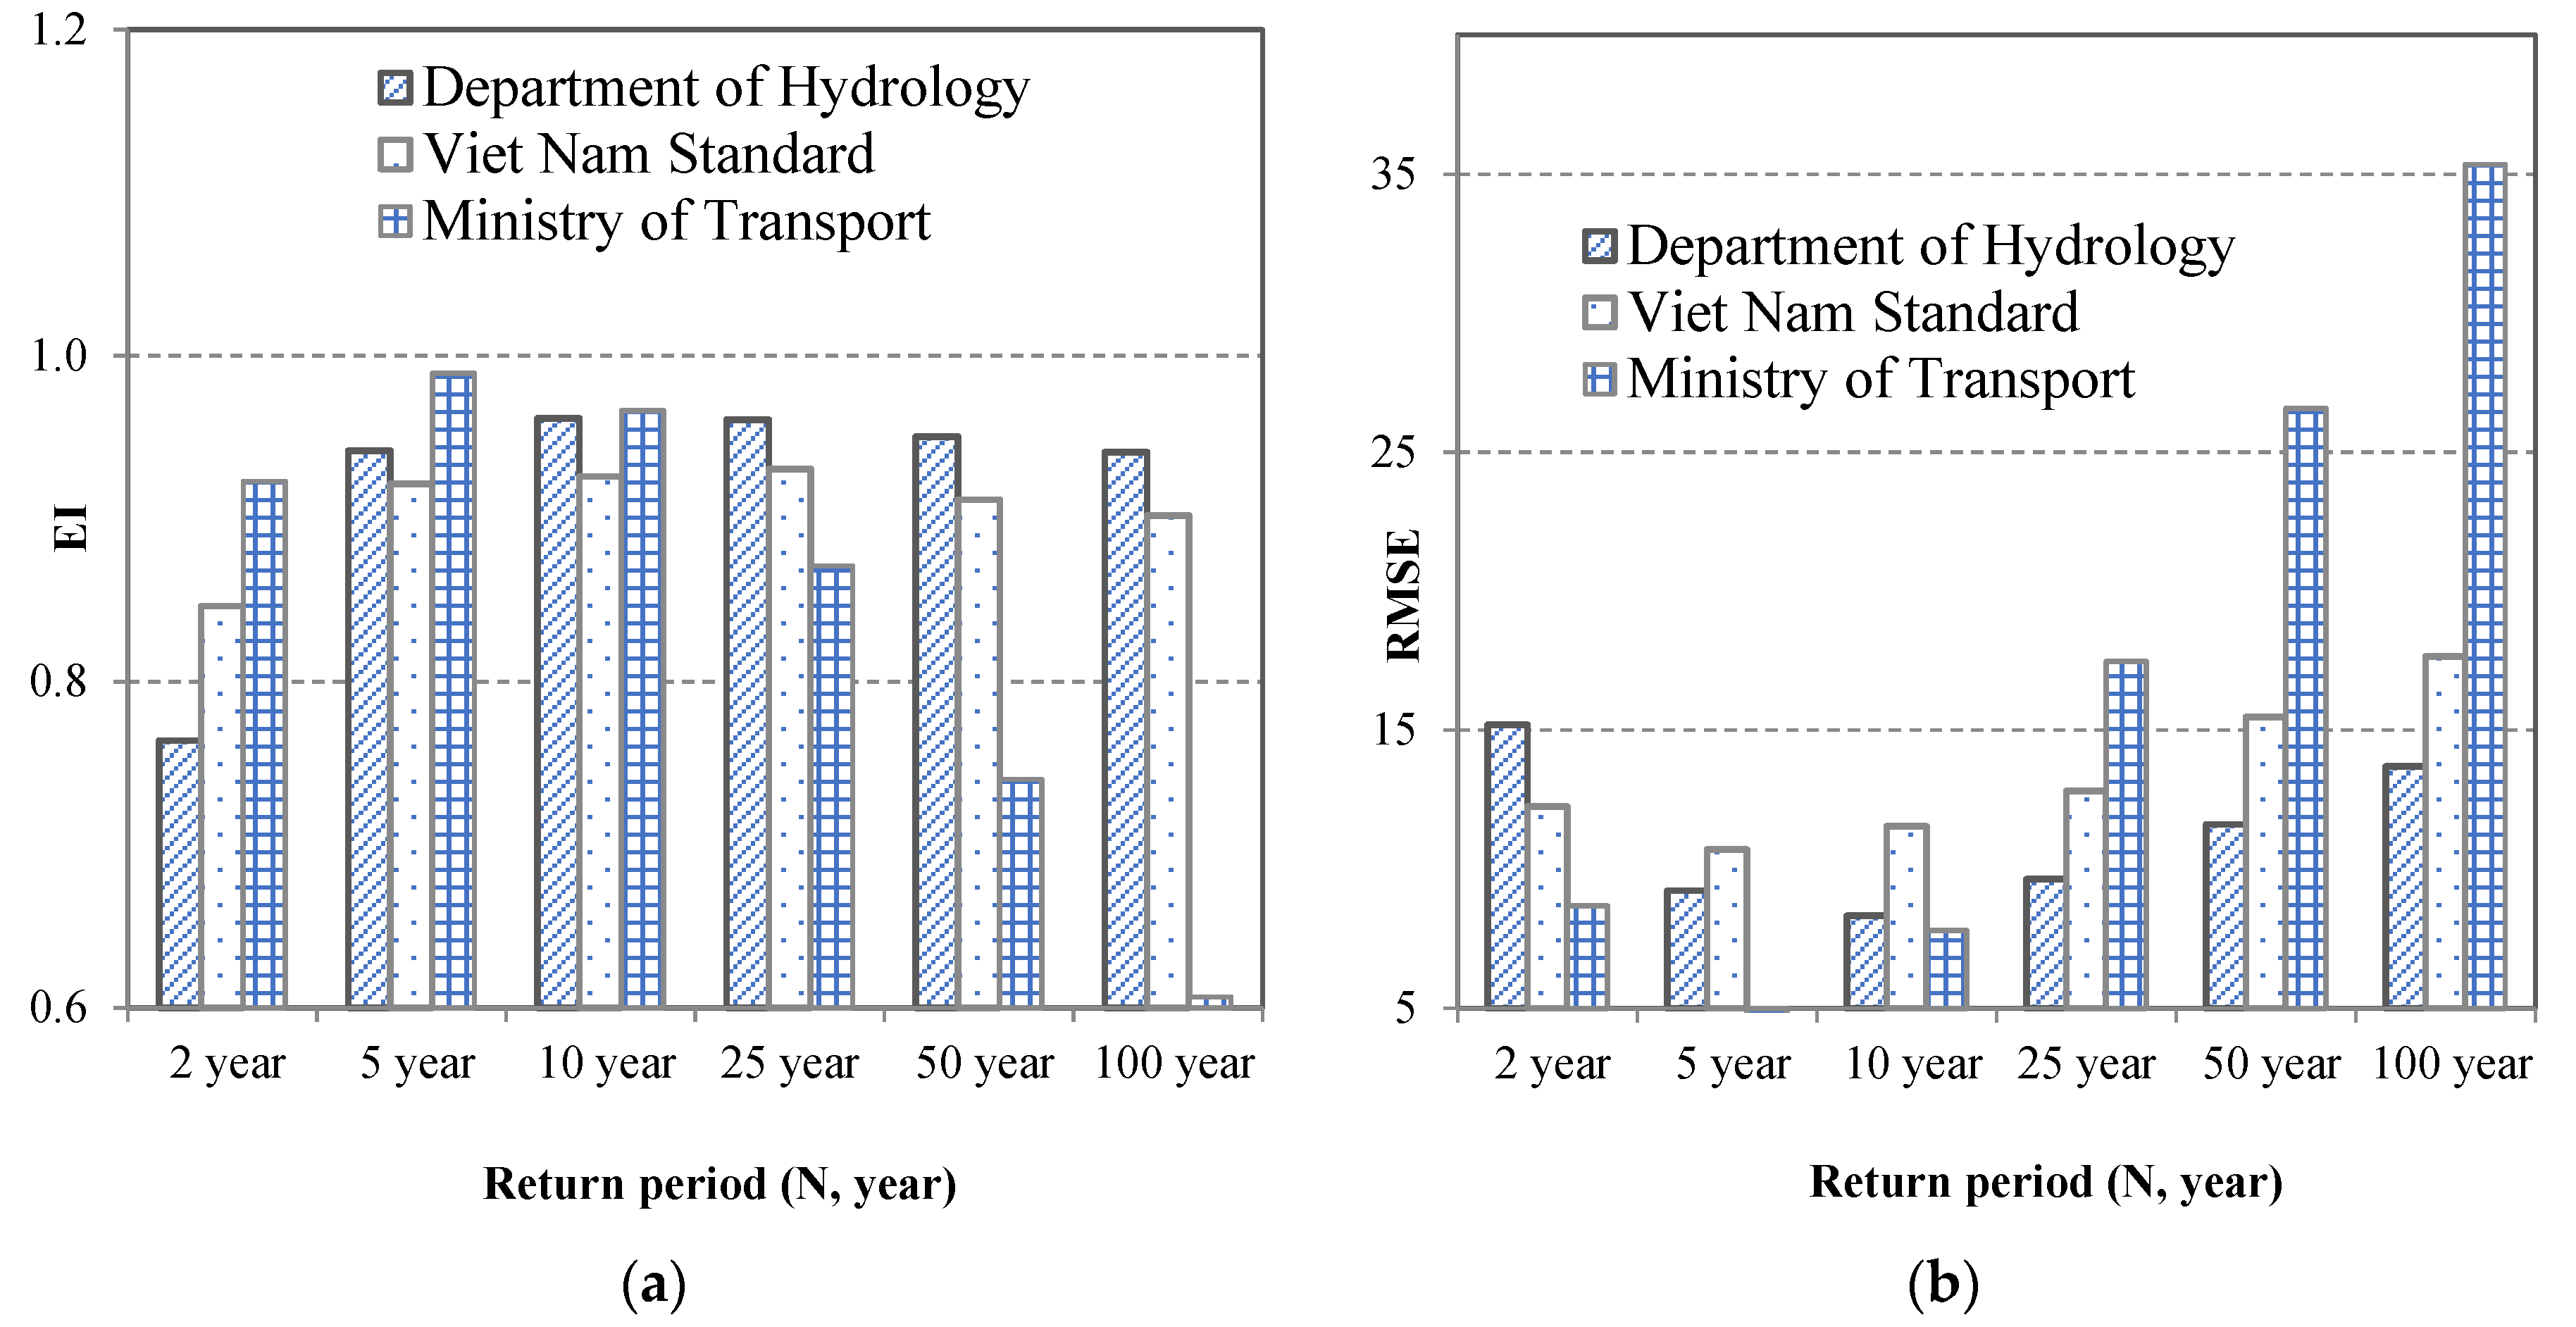
The study compared the IDF rainfall curve built from CDF with empirical formulas. The results shown in Figure 10 are efficiency factor (EI) comparisons.
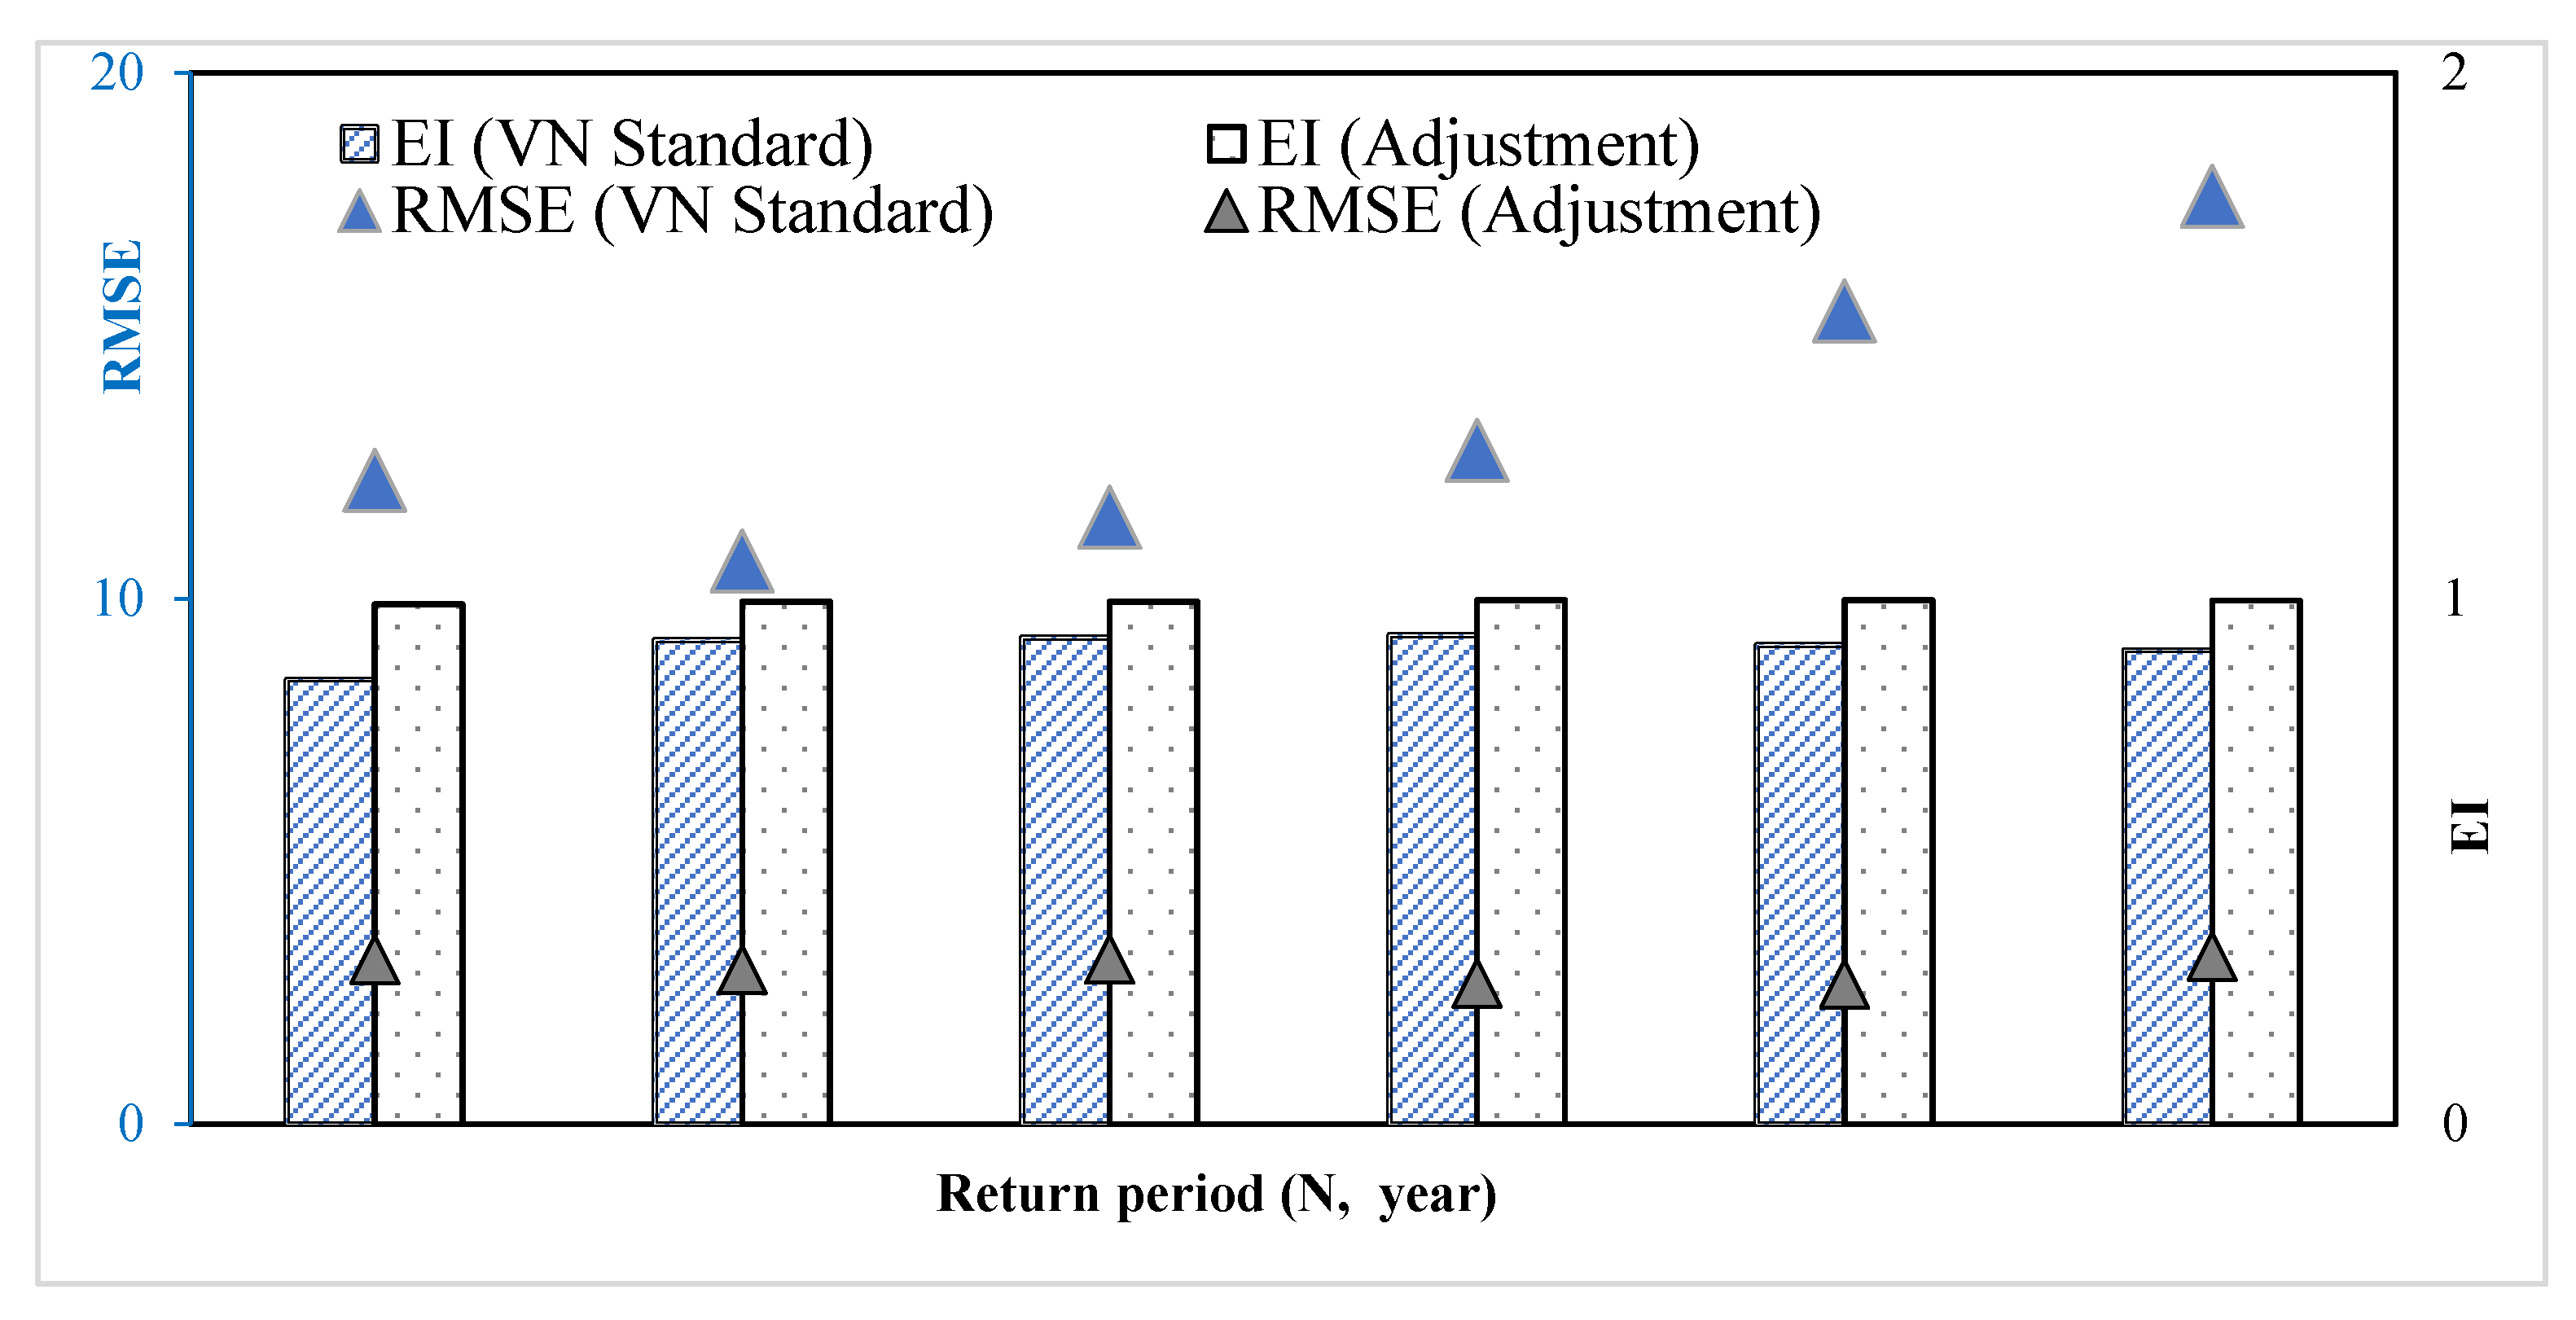
Figure 9 shows the three empirical formulas, including those from the Department of Hydrology, the Vietnamese national Standard (TCVN 7957:2008), and the Ministry of Transport which have EI ≥ 0.6. The two datasets calculated according to the Department of Hydrology and TCVN 7957:2008 have EI ≥ 0.9, although they show slight decrease (EI ≈ 0.8) at N = 2 years. In general, the RMSE is within the acceptable range (RMSE ≈ 10). Meanwhile, at N = 2 years, N = 5 years, and N = 10 years, the practical formula according to the Ministry of Transport is the best (EI ≥ 0.9). However, as N increases, the EI decreases and the RMSE increases (the highest RMSE = 35 at N = 100 years). The formula according to TCVN 7957:2008 has good EI values at all return periods (EI ≥ 0.8) and RMSE ≈ 12 is quite high. The study used the trial and error method to find the suitable coefficient for the study area (A = 9594, C = 0.5, b = 26, n = 0.96). The results of comparing EI and RMSE between the data using the neighbor approach and adjustment coefficients for the study area are shown in Figure 11.
The comparison of the EI and RMSE according to the TCVN between the neighboring station and with the adjustment dataset for the study area show that, at each return period, EI was ≥0.97 in the adjustment dataset, while at the neighboring station, EI is only in the range of 0.84 ≤ EI ≤ 0.93. When comparing the RMSE according to the Vietnamese standard between the neighboring station and with the adjustment dataset, the adjusted dataset that RMSE is in the range of 2.5 ≤ RMSE ≤ 3.2, while the neighboring station is comparatively high, 11 ≤ RMSE ≤17. A similar study also comparing EI and RMSE for Talbot, Kimijima and Bermard are shown in Table 2.
Table 2 shows that the empirical formula according to Talbot has a high EI and lower RMSE, than the other two formulas. For the return period of 25 years or more, the EI at three stations gave good results, but the RMSE at all periods were high (RMSR ≥ 19.4). Therefore, all three stations Talbot, Kimijima, and Bermard were deemed not suitable for the study area.
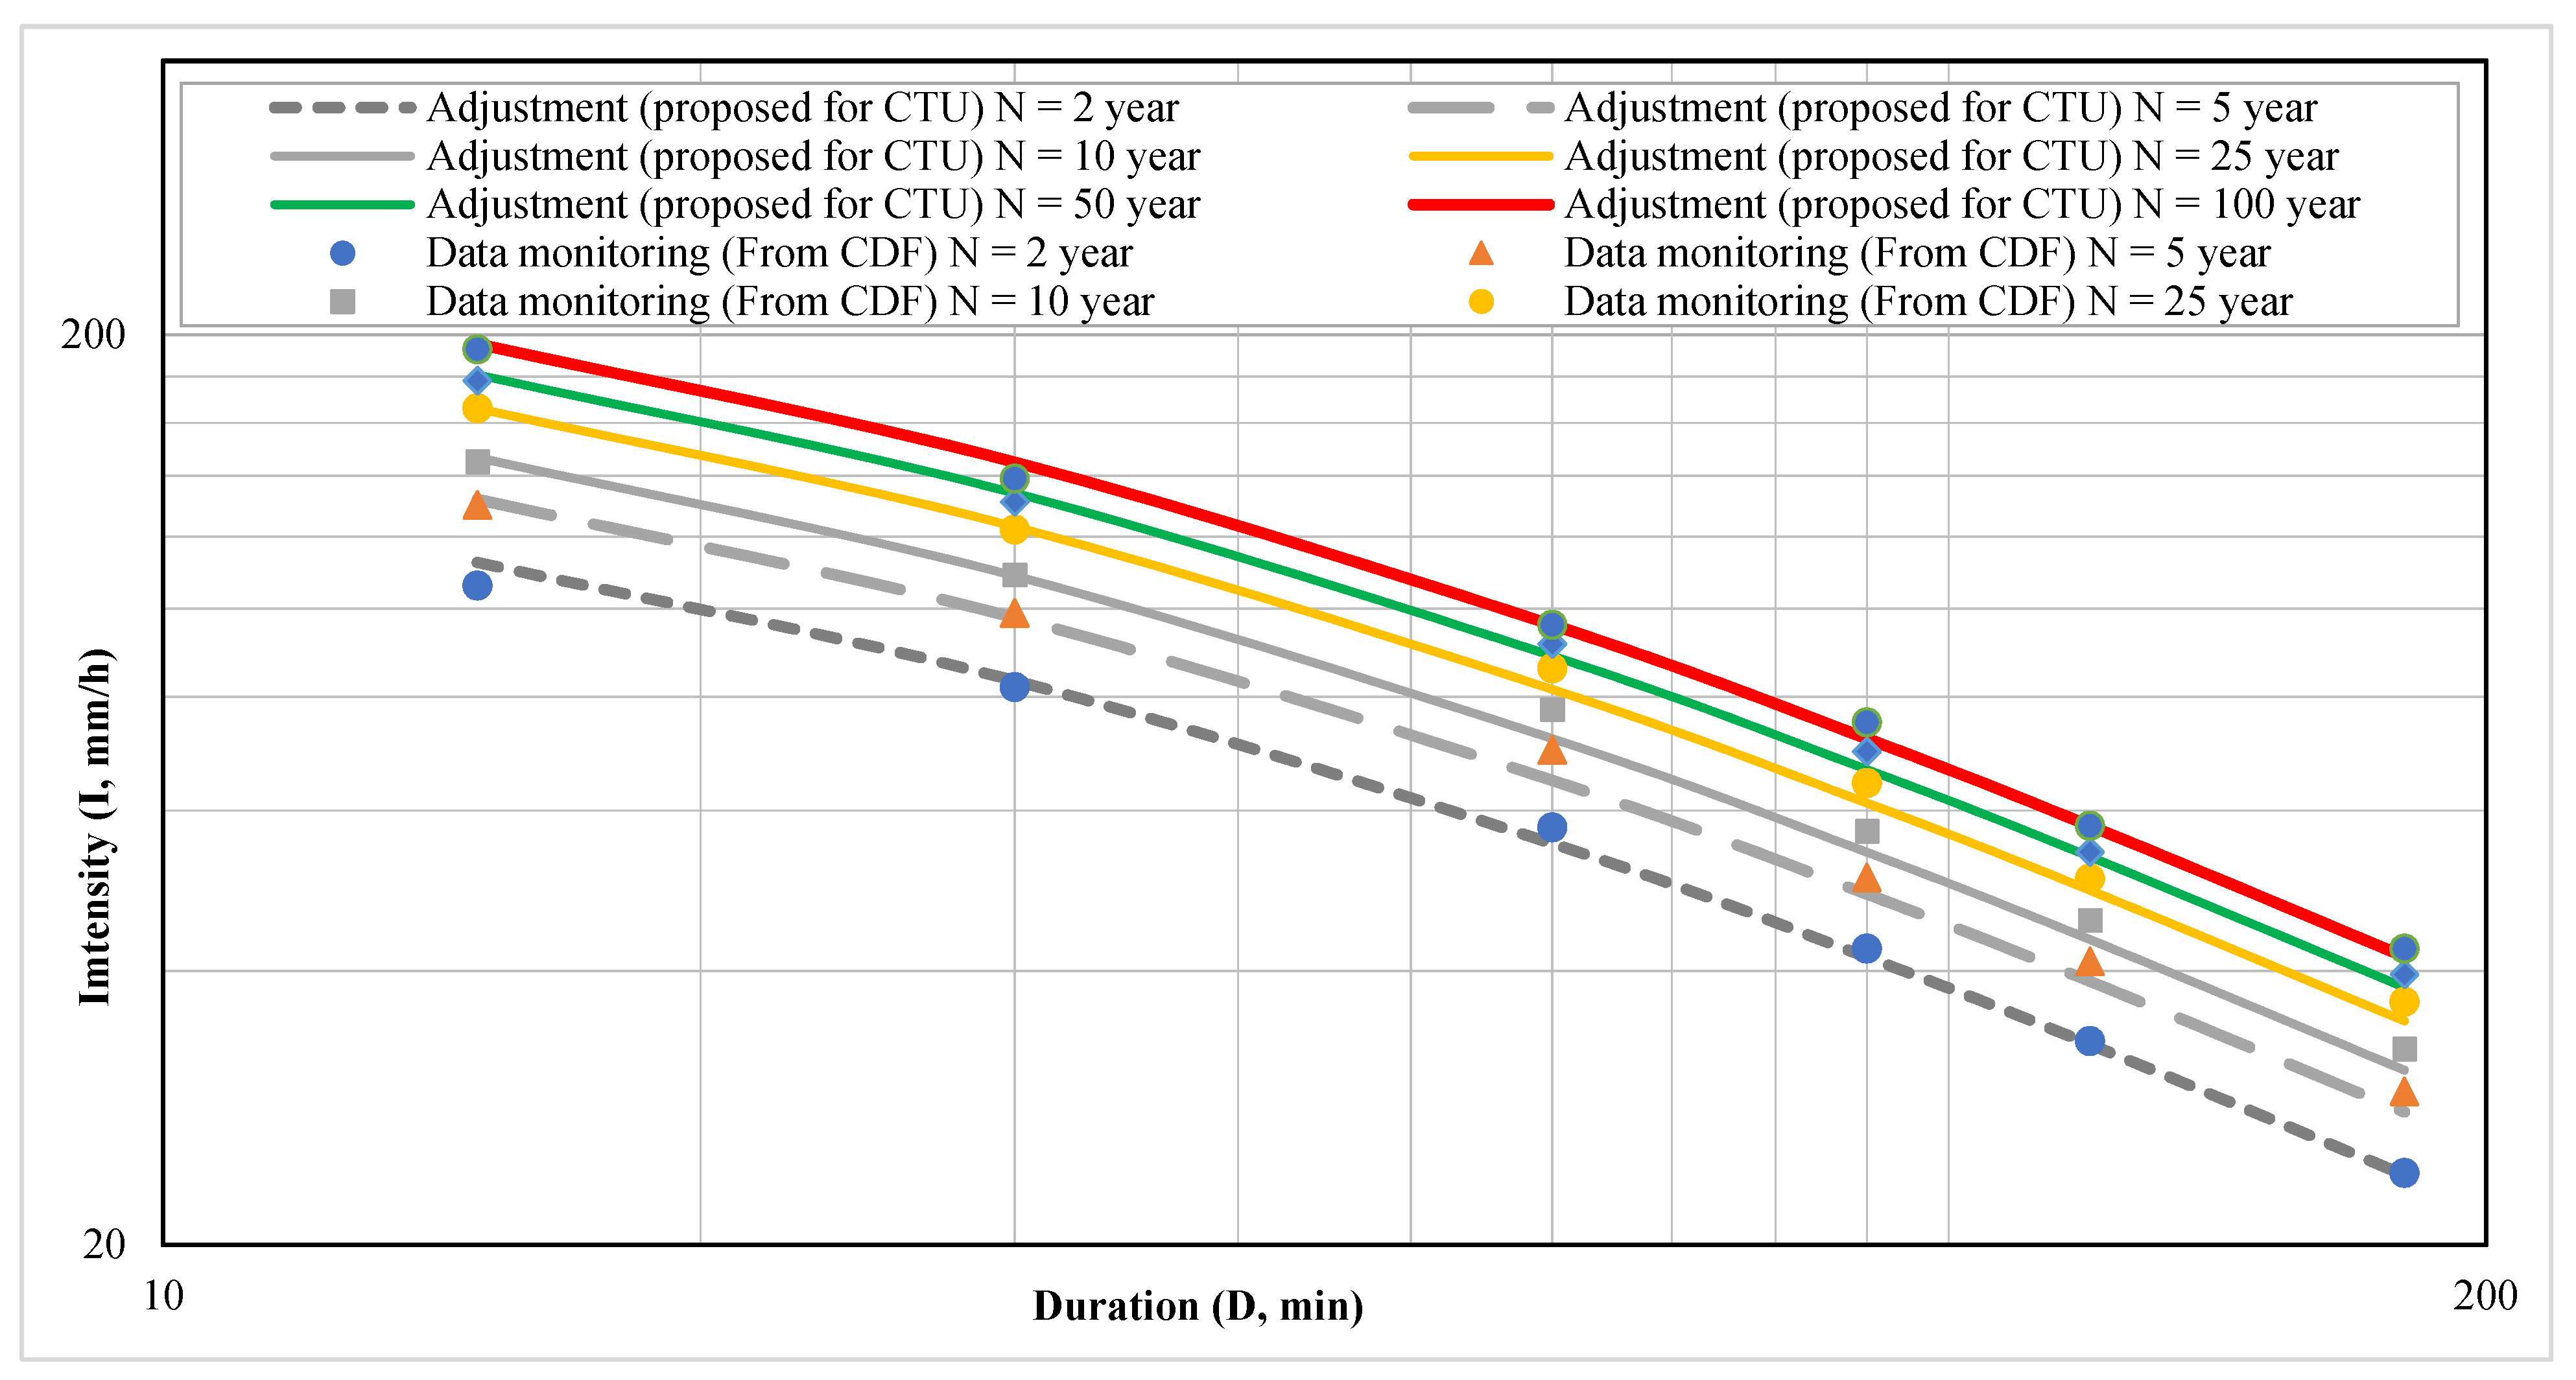
From the results of the comparison of efficiency coefficients, and mean standard errors, along with comparison of IDF curves built according to empirical formulas in Vietnam and Asia, we developed an IDF rainfall curve set for Can Tho City as shown in Figure 12.
Figure 12 shows the proposed set of IDF curves for Can Tho City, in which at a period of less than 60 min, the monitoring points are approximately lower than the values of the proposed IDF curve. However, for durations of more 60 min, the values at the monitoring points are approximately greater than the values of the proposed IDF curve at all repetition periods. Therefore, although the results of the proposed IDF curve fit very well with the monitoring points, further studies are needed to adjust the parameters (A, C, b, n).

4. Conclusions

This study calculated and selected the most suitable IDF rainfall curve for Can Tho City according to the empirical formulas in Vietnam (Department of Hydrology, TCVN 7957:2008, and the Ministry of Transport), as well as, via the formulas used previously for several other Asian countries (Talbot, Kimijima, and Bermard). In order to compare and select a suitable IDF rainfall curve, we constructed an IDF rainfall curve from the CDF according to rainfall intensity for each duration (15 min, 30 min, 60 min, 90, 120 min and 180 min), and also using EI and RMSE as the basis for selection. Research results for the three experimental formulas (Talbot, Kimijima, and Bermard) were found not suitable for the study area. When comparing the empirical formulas in Vietnam, the EI was relatively high, and the RMSE was also quite large. Here, the experimental formula according to TCVN 7957:2008 gave the best results at all calculation periods, compared to the other two formulas. As there is no set coefficients for Can Tho City in TCVN 7957:2008, this study used the closest location (Ca Mau) for construction. Therefore, the study used (A = 9594, C = 0.5, b = 26, n = 0.96) according to TCVN 7957:2008. With the new set of coefficients, the developed and adjusted IDF rainfall curve fitted very well with IDF built from CDF with 0.84 ≤ EI ≤ 0.93 and 2.5 ≤ RMSE ≤ 3.2. The suitable IDF rainfall curve for Can Tho City was selected according to the empirical formula of TCVN 7957:2007, with a new developed correction factor for the city. Although the proposed IDF rainfall curve results for Can Tho City fitted well with the monitoring points, it is necessary to continue to adjust the parameters (A, C, b, n) in further studies.

Author Contributions

Conceptualization, H.V.T.M., K.L., T.V.T. and P.K.; Methodology, H.V.T.M., K.L., L.T.L., L.V.T., N.P.C., T.V.T., N.K.D. and P.K.; Data curation, H.V.T.M.; Writing—original draft preparation, H.V.T.M., K.L., L.T.L., L.V.T., N.P.C., T.V.T., N.K.D. and P.K.; Writing—review and editing, H.V.T.M., K.L., N.K.D. and P.K. All authors have read and agreed to the published version of the manuscript.

Funding

This research received no external funding.

Institutional Review Board Statement

Not applicable.

Informed Consent Statement

Not applicable.

Data Availability Statement

Not applicable.

Acknowledgments

We would like to express our appreciation to Giap Van Vinh for his assistance with the data.

Conflicts of Interest

The authors declare no conflict of interest.

Appendix A

Figure A1. Distribution curve of CDF various duration according to P.III. CDF rainfall curve of 15 min (a), 30 min (b), 60 min (c), 90 min (d), 120 min (e), and 180 min (f).
Earth 03 00050 g0a1

References

  1. Nguyen, Q.; Thi Thao Nhi, P.; Nguyen Khoi, D. Developing IDF Curve of Extreme Rainfall at Tan Son Hoa Station for the Period 1980–2015. Sci. Technol. Dev. J.-Sci. Earth Environ. 2017, 1, 73–81. [Google Scholar] [CrossRef]
  2. Zhao, W.; Kinouchi, T.; Nguyen, H.Q. A Framework for Projecting Future Intensity-Duration-Frequency (IDF) Curves Based on CORDEX Southeast Asia Multi-Model Simulations: An Application for Two Cities in Southern Vietnam. J. Hydrol. 2021, 598, 126461. [Google Scholar] [CrossRef]
  3. Meyer, A.F. The Elements of Hydrology; Wiley: New York, NY, USA, 1917. [Google Scholar]
  4. Sherman, C.W. Frequency and Intensity of Excessive Rainfalls at Boston, Massachusetts. Trans. Am. Soc. Civ. Eng. 1931, 95, 951–960. [Google Scholar] [CrossRef]
  5. Bernard, M.M. Formulas for Rainfall Intensities of Long Duration. Trans. Am. Soc. Civ. Eng. 1932, 96, 592–606. [Google Scholar] [CrossRef]
  6. Hershfield, D.M. Estimating the Probable Maximum Precipitation. Trans. Am. Soc. Civ. Eng. 1963, 128, 534–551. [Google Scholar] [CrossRef]
  7. Chen, C. Rainfall Intensity-Duration-Frequency Formulas. J. Hydraul. Eng. 1983, 109, 1603–1621. [Google Scholar] [CrossRef]
  8. Di Baldassarre, G.; Brath, A.; Montanari, A. Reliability of Different Depth-duration-frequency Equations for Estimating Short-duration Design Storms. Water Resour. Res. 2006, 42. [Google Scholar] [CrossRef]
  9. Nhat, L.M.; Tachikawa, Y.; Takara, K. Establishment of Intensity-Duration-Frequency Curves for Precipitation in the Monsoon Area of Vietnam. Annu. Disaster Prev. Res. Inst. 2006, 49, 93–103. [Google Scholar]
  10. Kim, J.-W.; Nam, W.-S.; Shin, J.-Y.; Heo, J.-H. Regional Frequency Analysis of South Korean Rainfall Data Using FORGEX Method. J. Korea Water Resour. Assoc. 2008, 41, 405–412. [Google Scholar] [CrossRef] [Green Version]
  11. Al Mamoon, A.; Joergensen, N.E.; Rahman, A.; Qasem, H. Derivation of New Design Rainfall in Qatar Using L-Moment Based Index Frequency Approach. Int. J. Sustain. Built Environ. 2014, 3, 111–118. [Google Scholar] [CrossRef] [Green Version]
  12. Elsebaie, I.H. Developing Rainfall Intensity–Duration–Frequency Relationship for Two Regions in Saudi Arabia. J. King Saud Univ.-Eng. Sci. 2012, 24, 131–140. [Google Scholar] [CrossRef] [Green Version]
  13. De Paola, F.; Giugni, M.; Topa, M.E.; Bucchignani, E. Intensity-Duration-Frequency (IDF) Rainfall Curves, for Data Series and Climate Projection in African Cities. SpringerPlus 2014, 3, 133. [Google Scholar] [CrossRef] [PubMed] [Green Version]
  14. Femin, C.V.; Varija, K. Identification of the Best-Fit Probability Distribution and Modeling Short-Duration Intensity-Duration-Frequency Curves—Mangalore. In Trends in Civil Engineering and Challenges for Sustainability; Springer: Singapore, 2021; pp. 765–783. [Google Scholar]
  15. Schardong, A.; Simonovic, S.P.; Gaur, A.; Sandink, D. Web-Based Tool for the Development of Intensity Duration Frequency Curves under Changing Climate at Gauged and Ungauged Locations. Water 2020, 12, 1243. [Google Scholar] [CrossRef]
  16. Dang, T.A. Simulating Rainfall IDF Curve for Flood Warnings in the Ca Mau Coastal Area under the Impacts of Climate Change. Int. J. Clim. Chang. Strateg. Manag. 2020, 12, 705–715. [Google Scholar] [CrossRef]
  17. Kite, G.W. Frequency and Risk Analysis in Hydrology; Water Resources Publications, LLC: Littleton, CO, USA, 1977. [Google Scholar]
  18. Tuan, L.A. Comparison of Frequency Density Distribution Functions Used in Rainfall Calculation in the Mekong Delta. Master’s Thesis, Asian of Institute of Technology (AIT), Khlong Nueng, Thailand, 1999. [Google Scholar]
  19. Anh, L.T. Evaluation of Design Flood Calculation Results by Different Frequency Distribution Curves. VNU Sci. J. Nat. Sci. Technol. 2015, 31, 1–5. [Google Scholar]
  20. TCVN 7957:2008; Drainage and Sewerage-External Networks and Facilities-Design Standard 2008. Vietnam Standard and Quality Institute: Hanoi, Vietnam, 2008.
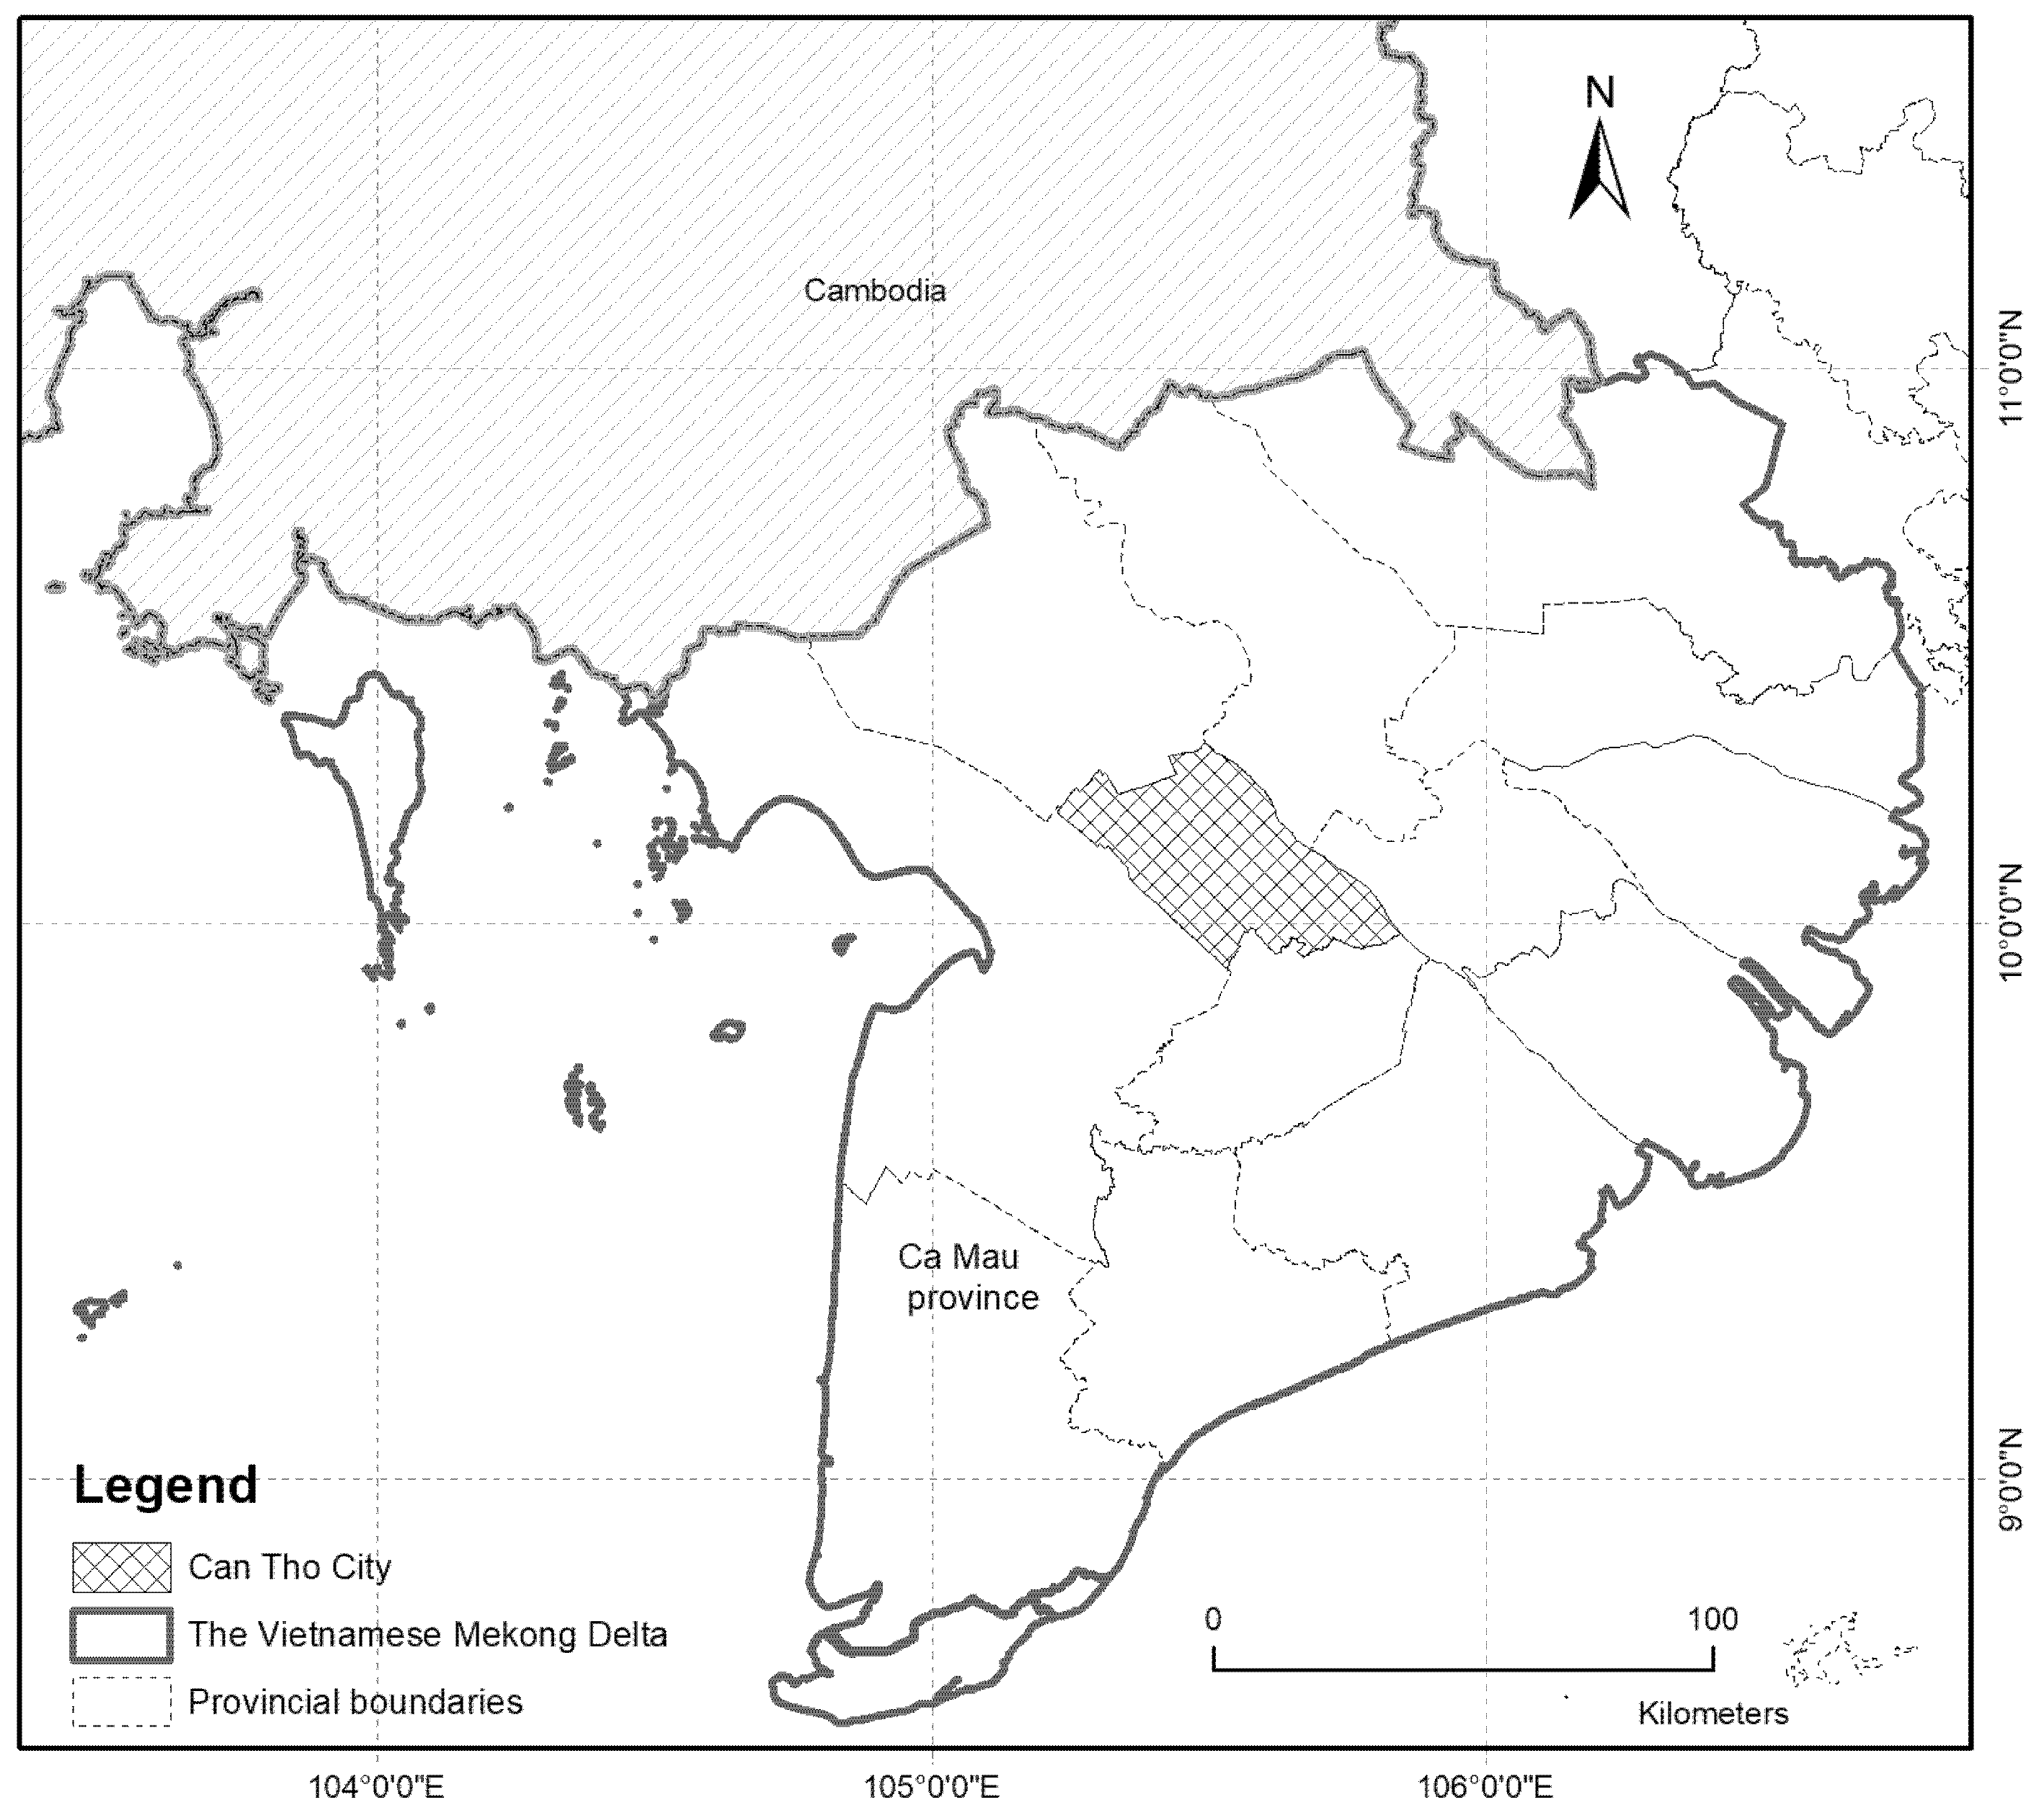
Figure 1. Location of Can Tho City and Ca Mau province, in the Vietnamese Mekong Delta.
Earth 03 00050 g001
Figure 2. The employed research methodology.
Earth 03 00050 g002
Figure 3. Frequency curve of cumulative rainfall distribution, rainfall duration 60 min. TB denotes the average rainfall value, Cv the denotes Coefficient of Variation, Cs denotes the Coefficient of skewness.
Earth 03 00050 g003
Figure 4. Total rainfall in the wet season (from May to December) and in the dry season (from December to April) at Can Tho station.
Earth 03 00050 g004
Figure 5. The trend of maximum rainfall for 15 min (a), 30 min (b), 60 min (c), 90 min (d), 120 min (e), 180 min (f) periods, respectively.
Earth 03 00050 g005
Figure 6. Development of IDF rainfall curve from CDF rainfall curve for various durations.
Earth 03 00050 g006
Figure 7. Development of IDF rainfall curve based on the Viet Nam standard (TCVN 7957:2008, using the neighborhood parameter, Ca Mau province).
Earth 03 00050 g007
Figure 8. The IDF rainfall curve was built by the Department of Hydrology (a) and the Ministry of Transport (b).
Earth 03 00050 g008
Figure 9. The IDF rainfall curves according to (a) Talbot, (b) Kimijima, and (c) Bermard.
Earth 03 00050 g009
Figure 10. Comparation of the EI index (a) and RMSE index (b) among empirical formulas.
Earth 03 00050 g010
Figure 11. Comparing EI and RMSE according to the TCVN and adjustment dataset.
Earth 03 00050 g011
Figure 12. Proposed IDF rainfall curve for Can Tho city. IDF curve proposed for Can Tho City with parameter modification, and IDF curve built from monitoring rainfall data of Can Tho City.
Earth 03 00050 g012
Table 1. Coefficient of variation and average relative error of maximum rainfall over each period at Can Tho station.
Rainfall Duration (Min)Cv σ x ¯ = C v n 100 %   ( % ) Rainfall Duration (Min)Cv σ x ¯ = C v n 100 %   ( % )
150.223.55900.203.25
300.203.321200.213.42
600.213.461800.233.73
Table 2. EI and RMSE for Talbot, Kimijima and Bermard.
Return Period (N, year)EIRMSE
TalbotKimijimaBermardTalbotKimijimaBermard
2 year0.430.310.2723.725.926.6
5 year0.700.640.5421.122.926.0
10 year0.780.750.6519.721.225.1
25 year0.830.820.7419.920.825.0
50 year0.860.850.7919.420.023.8
Publisher’s Note: MDPI stays neutral with regard to jurisdictional claims in published maps and institutional affiliations.