Article

Evaluating the Transformation of Urban River Water Quality from Receiving Urban Sewage to a Leisure Venue through an Economic Lens: A Case Study from Tokyo

Institute for Global Environmental Strategies, Hayama 240-0115, Kanagawa, Japan
*
Author to whom correspondence should be addressed.
Earth 2022, 3(3), 881-894; https://doi.org/10.3390/earth3030051
Submission received: 28 June 2022 / Revised: 3 August 2022 / Accepted: 3 August 2022 / Published: 10 August 2022

Abstract

:
Although environmental sustainability provides a foundation for maintaining economic and social sustainability, it is often neglected in favor of economic sustainability. Ameliorating water impairment is costly, and policymakers do not always prioritize this problem because its economic benefits are often intangible. This study explored the potential economic value for Tokyo’s regional economy of past improvements in the water quality of its rivers. Transitioning the rivers from their previous role as sewage drainage pipes to venues for spending leisure time created economic incentives in the local economy. An input-output analysis showed that in 1985, the inland navigation sector in the Sumida River generated 1.5 times the economic output by increasing demand. While this impact decreased to 1.3 times in 2005, the results clearly indicate that the regional economy can generate amenity values by improving the environmental quality. This study provides useful information to guide policymakers in allocating the budget for environmental management. In particular, it allows them to envision possible development plans to promote the livelihood of urban residents as well as understand the linkage between the environment and the economy.

1. Introduction

Ecosystems provide us with a significant number of services that enrich human well-being and aquatic species. However, these services are taken for granted under the pretext of economic development. Disturbing these ecosystems beyond their carrying capacities would lead to the loss of these precious services [1]. Rapid industrialization results in densely populated urban areas and severely damages the surrounding ecosystems and natural resources. However, sustainable development and a productive labor force are both essential to the continuous growth of cities. Here, sustainability should include the three types of sustainability—social sustainability, economic sustainability, and environmental sustainability [2], which ultimately help to achieve human well-being in a region.
Economic sustainability is clearly necessary for maintaining objective well-being. Meanwhile, social sustainability is necessary for subjective well-being because it forms the basis of safety, belonging, self-esteem, and self-actualization [3]. Furthermore, environmental sustainability is needed to maintain the physical and mental health of urban residents; the existence of urban nature is linked to people’s health status [4,5,6] and is thus also important for maintaining a productive labor force. The three types of sustainability are closely bound together. Economic sustainability depends on environmental sustainability because economic growth is built upon consuming natural resources and releasing waste products back into the environment [7]. Moreover, it also depends on social sustainability because a stable social foundation and human capital are vital for economic productivity. Finally, as a strong civil society is needed for social sustainability [2], it is necessary to invest in citizen’s education and health, indicating that economic sustainability plays a role in achieving social sustainability.
Does environmental sustainability require economic sustainability and social sustainability? Social sustainability is probably vital to environmental sustainability because community is a foundation of societal and traditional norms, which include sensitivity and respect for nature. Although the economic activities that maintain economic sustainability are often considered to exploit natural resource unilaterally, this may not be the case all the time. The relationship between economic development and the environment has been studied using the environmental Kuznets curve (EKC), and an inverse U-shaped curve has often been found [8,9,10]. The U-shaped curve indicates that economic achievement contributes to environmental sustainability after a certain point because the deteriorating environmental quality starts to improve. The shape of the EKC varies depending on the level of development, and a past study found that recent technological advances have helped to shift the turning point and to arrive at that point faster [10]. Sometimes no relationship is detected [11], but many studies have found that economic development helps to achieve environmental sustainability. EKC studies focus on finding a turning point and investigating the relationship between environmental quality and economic outputs at that point. Improving environmental quality brings ecosystem services back to people, and as a result, amenity values may be generated without consuming resources. After the turning point from degradation to improvement, regional economies obtain more benefits from nature.
Since the impact of environmental quality improvement at a regional scale is often studied qualitatively, this study aimed to explore the potential economic value generated in a regional economy by improving the water quality. To estimate the regional impacts, the study analyzed water quality and economic transaction data from Tokyo. Tokyo is located at the estuary of Tokyo Bay, and multiple rivers run through the area. In the past, manufacturers preferred lands near major rivers for strategic reasons. As a result, rapid industrialization and urbanization severely impaired water resources in a short period of time. The quality was later improved with great effort, and the rivers in Tokyo eventually became a venue for spending leisure time. The local economy now generates amenity values from the rivers because of this transformation. To clearly illustrate the process of degradation, improvement, and economic benefits, this study selected the Sumida River and the inland navigation sector. First, the study analyzed the transition of the industry and surrounding environment by reviewing the available literature. Then, changes in water quality and investment were discussed through graphical analysis. Finally, regional economic gains were estimated by applying input-output analysis.
The contingent valuation and hedonic price estimation methods are frequently applied to estimate the amenity value of water resources. However, this study estimated the region-wide economic impacts induced by improvement. Therefore, input-output analysis was applied, and changes in demand for the inland navigation sector were used to estimate the regional impacts. The demand for the inland navigation sector was calculated from the passenger data of the river boat system for sightseeing in Tokyo, called water-bus.
Other major cities have had similar experiences with the problem of river impairment caused by directly discharging sewage into rivers and turning the rivers into a sink [12]. Policymakers in London allowed the discharge of all refuse from houses and streets into the Thames River, and the offensive odor from anaerobic digestion within the river became a problem in the middle of the 19th century [13]. This situation was caused by rapid population growth triggered by the Industrial Revolution. The problem lasted for decades and was finally mitigated when new infrastructure was built in the middle of the 20th century to cater to this wastewater [14].
Inland navigation was a major transportation system in Japan before railroads were built, and the importance of the Sumida River for logistics has been recognized since the 17th century [15]. Boats navigated the river for many purposes, including cargo, passengers, sightseeing, and fishing. Small passenger boats were utilized like a taxi to connect riverbanks [16]. However, technological development changed the river’s function around 1880s. People stopped using boats to cross rivers once more bridges were built, and the development of railway systems along with government policies to promote railways contributed to the decline of the inland navigation sector [17].
The water-bus first entered service in 1885, and the service was interrupted by World War II. It resumed service in 1950, but the number of passengers decreased due to the offensive odor of the rivers [18]. Furthermore, measures for floodwaters were implemented in 1950 because areas near the Sumida are flood-prone, and a levee over 6 m high from the lowest water level of the Arakawa River (A.P. + 6.4 m – A.P. + 6.9m) was built. The construction was completed in 1974 [19]. Fireworks and other events that were held annually at the Sumida were also interrupted in the 1960s for over a decade because the river became fetid [16], causing people to avoid it. Declining demand and changes in transportation policy significantly affected the inland navigation sector, and water quality impairment and the high levee further contributed to the decreased use of river transportation. Meanwhile, capital accumulated during the high-growth period was invested in infrastructure projects that were expected to lead Tokyo to higher economic growth, such as expressways and bullet trains; conserving public goods was low on decision-makers’ list of priorities [20].
The Water Pollution Prevention Act came into force in 1970, and the Tokyo Metropolitan Government (TMG) gradually increased the budget for sewage management. Regulations and investment in sewage management contributed to quality improvements, and a water route between Asakusa and Takeshiba/Hinode sanbashi resumed service in 1971 [21]. Other interrupted social events also resumed in 1978 [16], forming the foundation of the transformation. In addition to resuming leisure activities on the Sumida, waterfront development initiatives were undertaken.
Despite the scarcity of land in cities, urban waterfronts around the world were not fully utilized after technological changes in the shipping industries. For example, North American cities suffered from the shuttering and relocation of industries located on the waterfront in the 1970s and 1980s [22]. The success story of waterfront development in Boston and Baltimore in the 1970s came under the spotlight, and urban waterfront development has been seen in several major cities since then [22]. In such cities, the waterfront became a place to connect in all social, economic, and ecological contexts [23]. Tokyo was no exception, and emptied factories and industrial sites near the water were converted into commercial venues. A major development project began after the closure of a heavy industry manufacturing plant downstream of the Sumida in 1979 [24], and high-rise residential towers were built on the plant site after 1988 [25]. This was a catalyst to transform other neglected sites into popular areas. While waterfront development triggered by changes in industrial structure was probably the most significant factor in attracting people to the Sumida, this shift would not have been possible without water quality improvement, especially considering past studies finding that offensive odors affected the inland navigation sector [16,18,26].

2. Materials and Methods
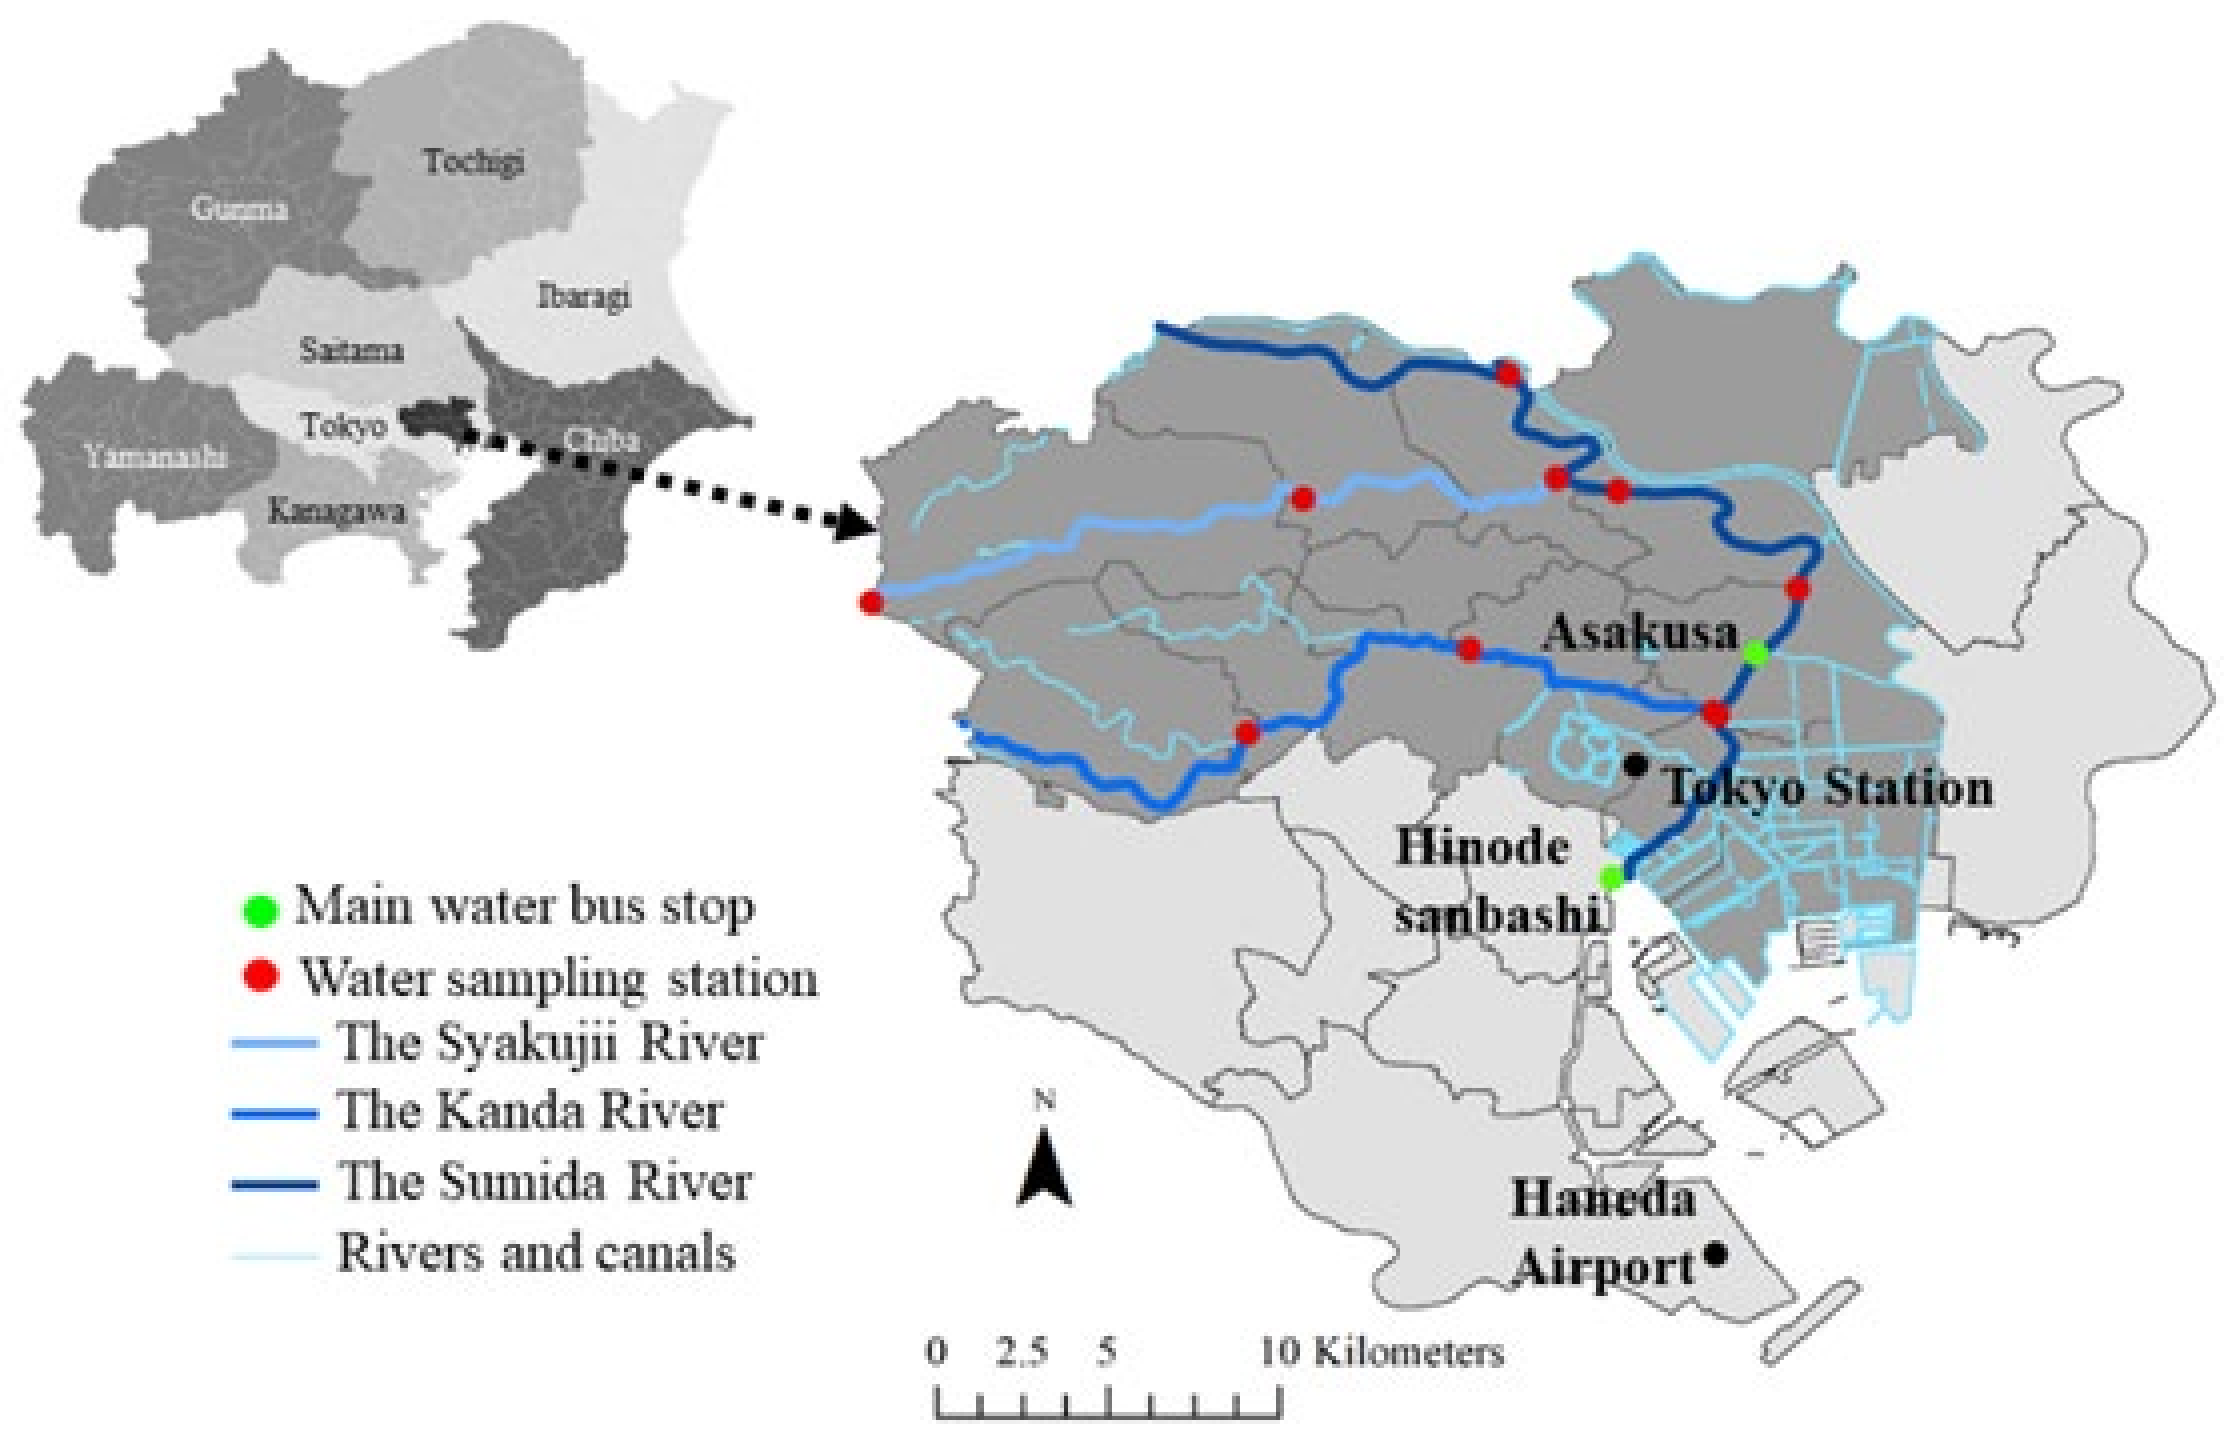
2.1. Water Quality

Water quality in Japan is monitored by the local government or the Ministry of Land, Infrastructure, Transportation and Tourism (MLIT), depending on the river. The quality of the Sumida is monitored by the Bureau of Environment of the TMG at multiple sampling points (Figure 1). The monthly data from 1998 are available on the TMG website, and the data between 1970 and 1997 are available at the TMG office. The data include general water quality indices such as temperature, color, odor, pH, dissolved oxygen (DO), biochemical oxygen demand (BOD), chemical oxygen demand (COD), total suspended solids (TSS), fecal coliform, phosphorus, nitrogen, and other chemicals. Data from the four sampling points on the Sumida River were aggregated annually, and the results of BOD and DO concentration from 1961 to 2009 are shown in Figure 2a.
Odor is a categorical variable classified into six odor types. In order to compare the offensiveness of odors, they were converted into numerical values using odor hedonic tones. The hedonic tones were developed in the 1980s from 146 descriptors, including fruits and sewer odor [27]. In this study, data using the bipolar scale from −4 to 4 (−4 being the most unpleasant and 4 the most pleasant) were converted into a 0–1 scale by fitting the regression line of y = −0.125x + 0.5, where y is the converted value on the 0–1 scale and x is the value on the bipolar scale. In the converted scale, 1 and 0 represent the most unpleasant and least unpleasant values, respectively [28].
The 146 descriptors analyzed in Dravnieks et al., (1984) were classified into six odor types because the TMG classifies odor into six different types in the water quality data. The classification by the TMG was the factor value. Hence, the hedonic tones were converted into numeric values in this study. The six classifications were fragrance, plant, dirt/mold, fishy, chemical, and foul/rotten. We aggregated the hedonic tones from Dravnieks et al., (1984) based on the type and then derived the hedonic tones for the six classifications of the TMG. We applied the value 0 to the data recorded as odorless in this study (Figure 2b). The mean of each group was used to replace the factor values in the data. The odor scores of fragrance and plant odors turned out to be significantly lower than those of the other types. This indicates that if an odor was recorded as odorless, aromatic, or plant, the river was not as fetid as others because a lower score indicates that the odor was less unpleasant. A weight was applied if the intensity was also recorded; the tone was multiplied by 1.3 if the odor was strong and 0.3 if it was weak.

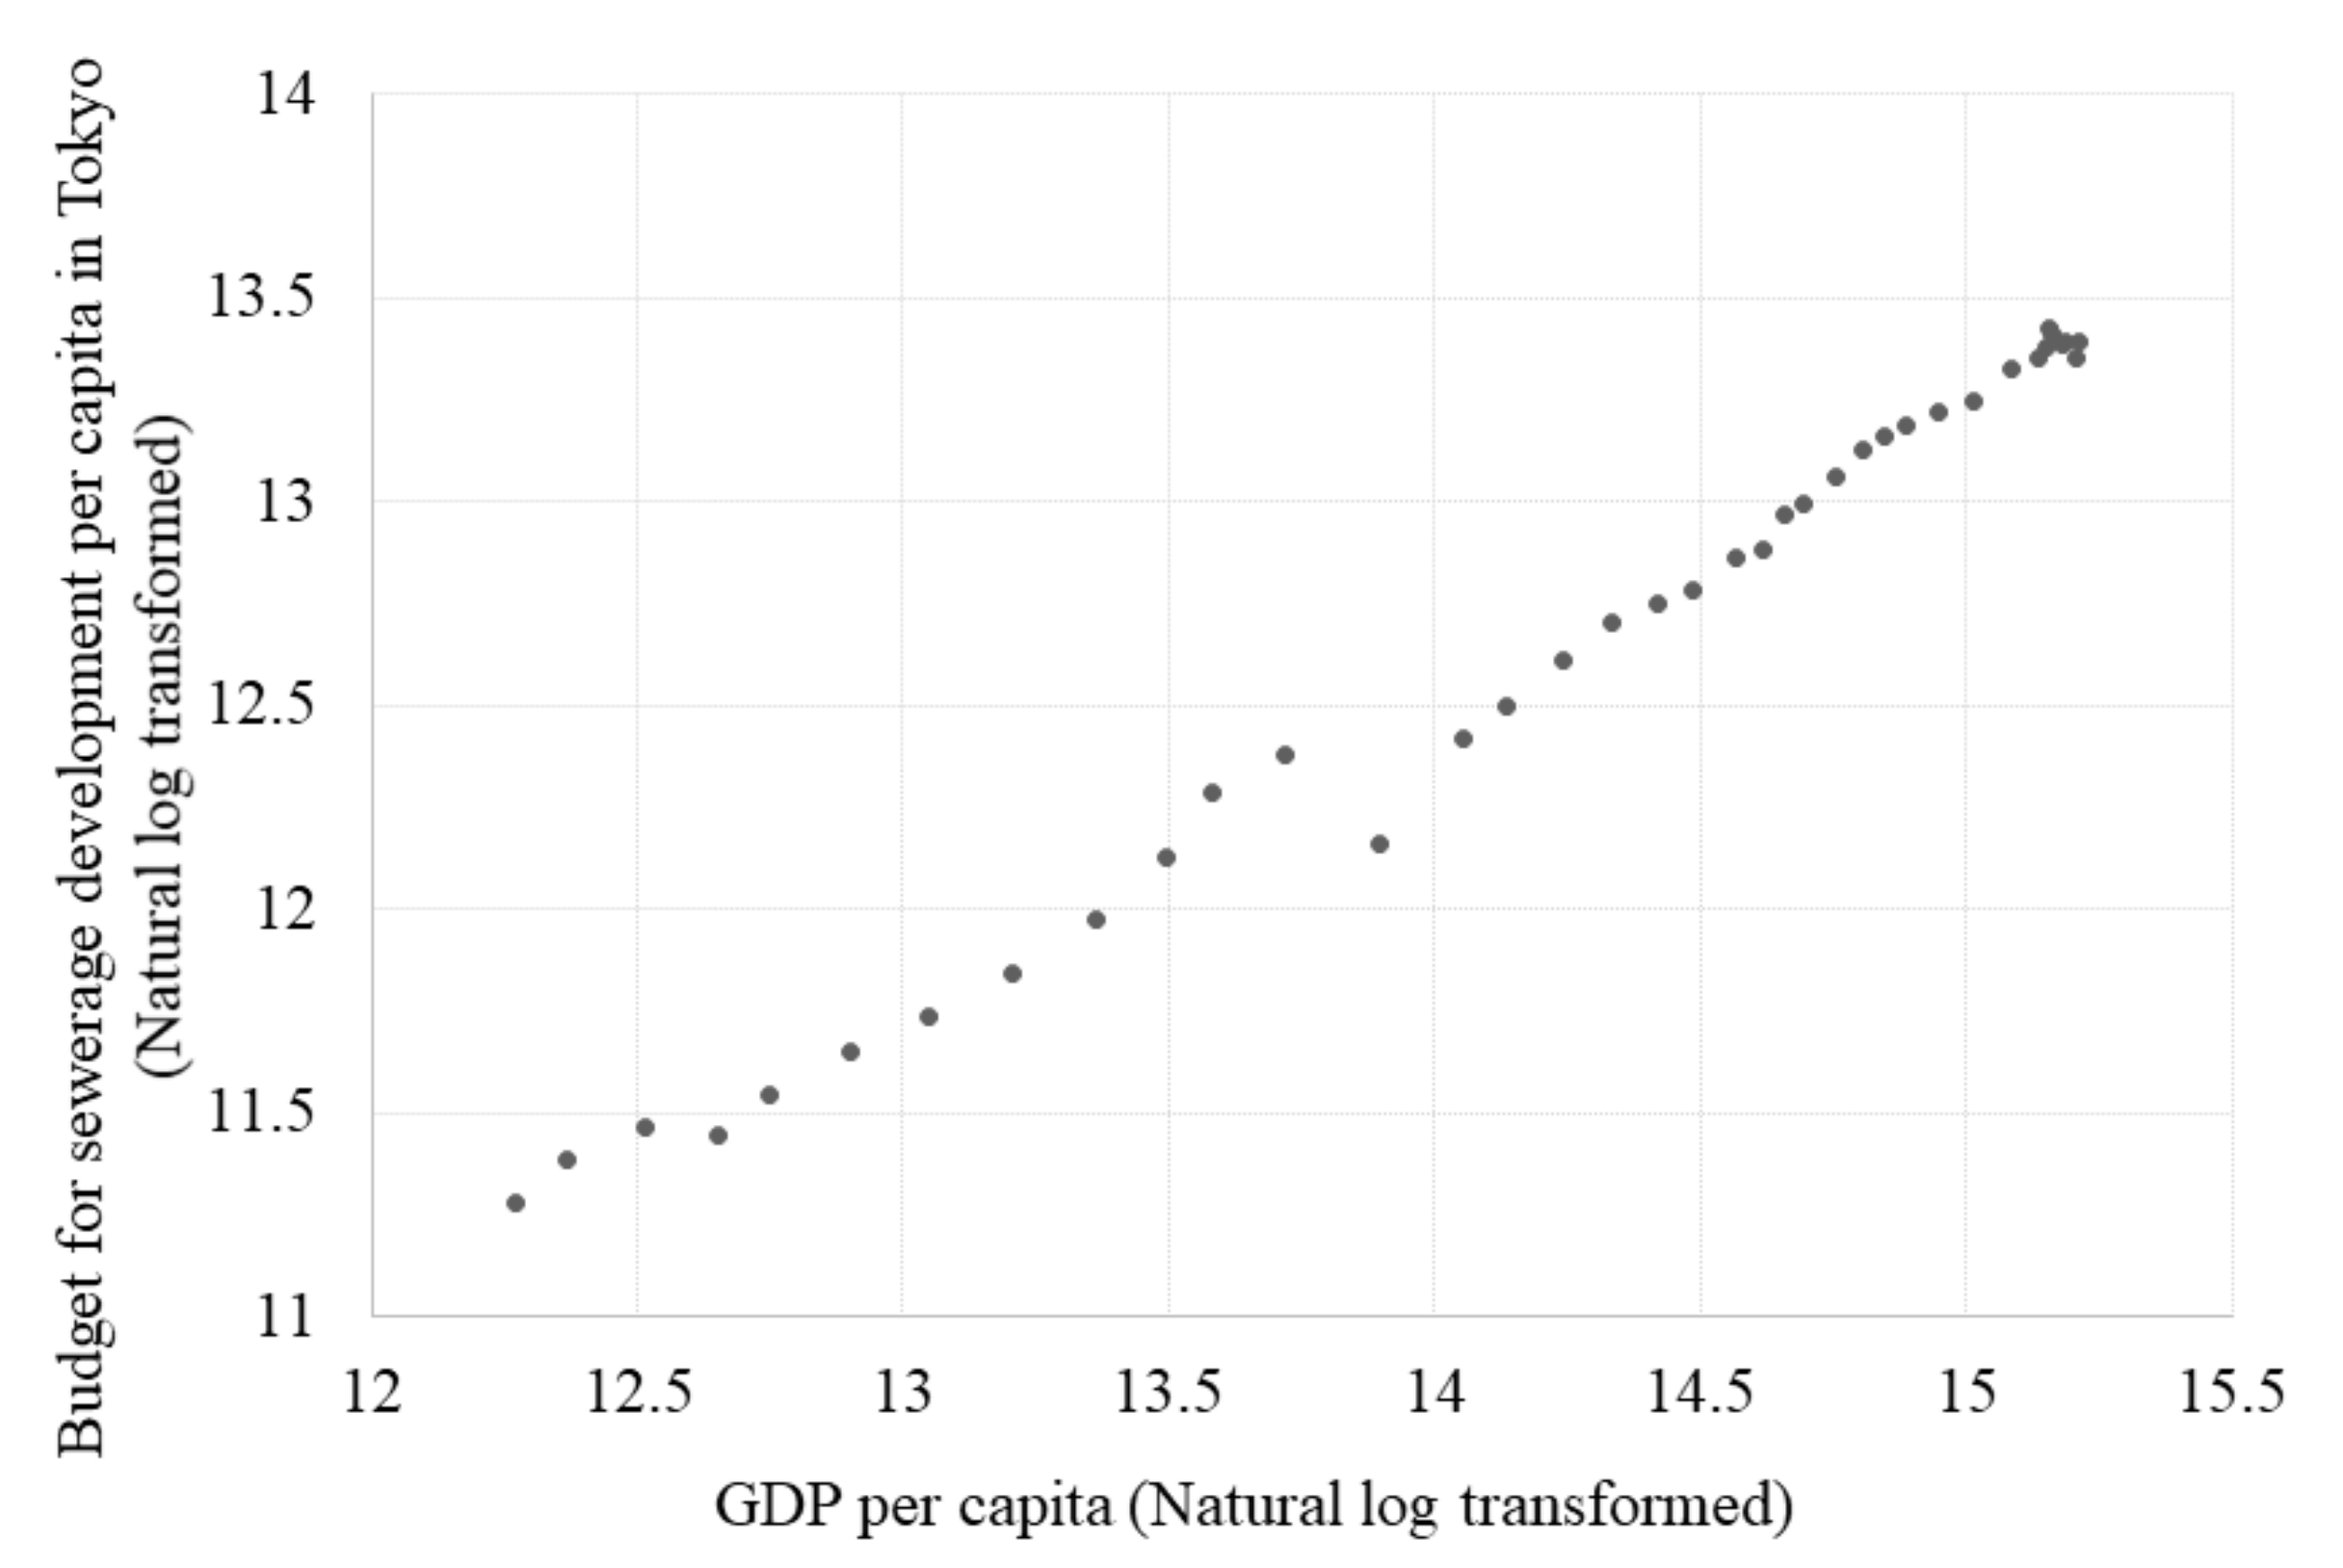
2.2. Expenditure on Sewage Management

The expenditure on sewage management is disclosed in the Tokyo Statistical Yearbook online by the Statistics Division of the Bureau of General Affairs of the TMG [29]. The data were obtained from “expenditure for sewage” on the budget and settled account sheet. The price was adjusted to the 1990 price level for the analysis because the real GDP data from the Cabinet Office of the Government of Japan was adjusted to that level.

2.3. Annual Income Level (Gross Domestic Products)

The monthly household income of residents in Tokyo is correlated to their income per capita at the national level. Therefore, the gross domestic product per capita (GDPpc) was used. The earliest dataset covered the period from 1955 to 1998, and the values were adjusted to 1990 prices. The sewage management expenditure is plotted against the GDPpc (Figure 3). As the datasets covering extended periods are adjusted to the price of different years, consolidating data from different datasets is difficult. Since water quality data are available from 1961, all graphical analyses were done for the period between 1961 and 1998.

2.4. Number of Water-Bus Passengers

The traditional route of the water-bus on the Sumida River is between Asakusa and Hinode sanbashi. The service was introduced by a private company, Tokyo Cruise Ship, in 1971, and the route is still in service today. Its destination was originally Takeshiba, but the route was changed to nearby Hinode sanbashi in 1985. The route is 8.8 km long, and the entire journey takes about 40 min [30]. The number of passengers from 1974 to 1996 was obtained from Osawa (1997), and the numbers between 1997 and 2010 were obtained from the company. Tokyo Park Organization has also operated a route on the Sumida since 1999 [21], but it was not included in the study because the data are only available from 2005.

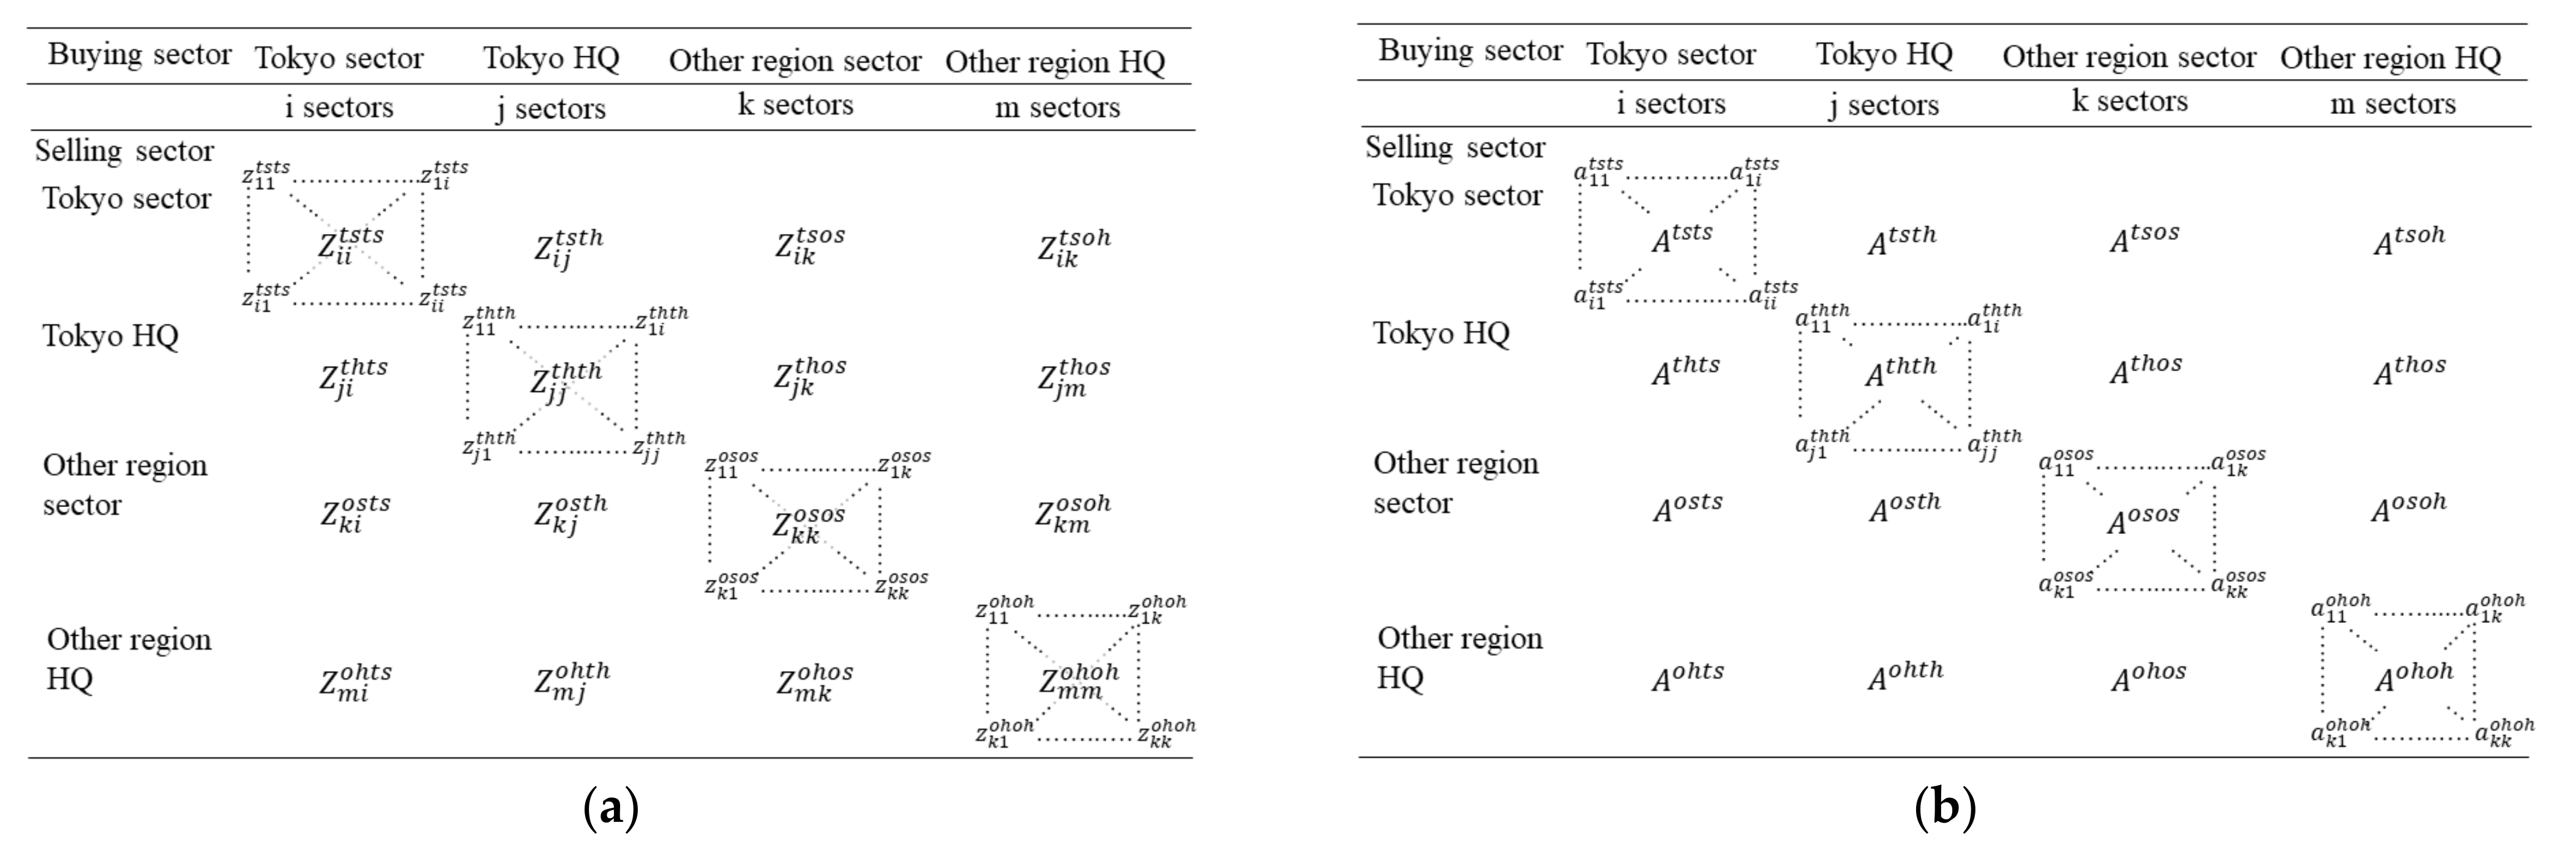
2.5. Input-Output Table

TMG publishes three different input-output (IO) tables and other related data every five years using different classifications of the intermediate sector; these classifications include 51 sectors, 138 sectors, and 280 sectors. In the broad category table covering 51 sectors, transportation by railroad, ground, air, and ferry is aggregated in a single transportation sector. Since the present study aimed to explore changes in inland water navigation and regional economies, we used the table with 280 sectors. In this table, inland navigation is differentiated from ocean ferries.
The economy of Tokyo is closely linked with the economies of other regions, and many companies place their headquarters in Tokyo. Therefore, the IO table of Tokyo follows the basic IO table structure for the sectors, but the intermediate demand and input consist of sectors in Tokyo and other regions as well as headquarters in Tokyo and other regions.

2.6. Methodology: Input-Output Analysis

Including sectors and headquarters in Tokyo and other regions, the table includes four regions: sectors in Tokyo (ts), headquarters in Tokyo (th), sectors in other regions (os), and headquarters in other regions (oh). The structure of intermediate input and demand of the present study is shown in Figure 4a. The final output with a new demand was estimated by following the inter-regional approach explained by Miller and Blair (2009) [31].
The distribution of a product produced by sector i in Tokyo is as follows:
x i = z i 1 + z i 2 + + z i j + + z i k + + z i m + E X i
where EXi denotes the exports of i. The total output of sector 1 in Tokyo (TS) becomes:
x 1 T S = z 11 t s t s + + z 1 i t s t s + z 11 t s t h + + z 1 j t s t h + z 11 t s o s + + z 1 k t s o s + z 11 t s o h + + z 1 m t s o h + E X 1 t s
The total output of other sectors in other regions was calculated in the same way. Since the study was interested in investigating local spillover induced by demand changes in the inland navigation sector, the analysis focused on the intermediate input and demand changes. The regional input coefficients for the Tokyo sector, a, is calculated as follows:
a i i t s t s = z i i t s t s / x i T S
Other coefficients were calculated in the same way, and the coefficient matrix for a four-region inter-regional model is shown in Figure 4b.
The Leontief inverse matrix L is calculated by: L   = I A 1 , where I is an identity matrix. The final output xnew with new demand fnew is calculated by Lfnew. xnew was the value of interest in this study because it indicates which sectors are affected by changes in one sector—in this case, inland navigation. Summation of xnew indicates the spillover effects in the region.
Figure 4. (a) Intermediate sectors of the study and (b) coefficient matrix of the model.
Earth 03 00051 g004

3. Results and Discussion

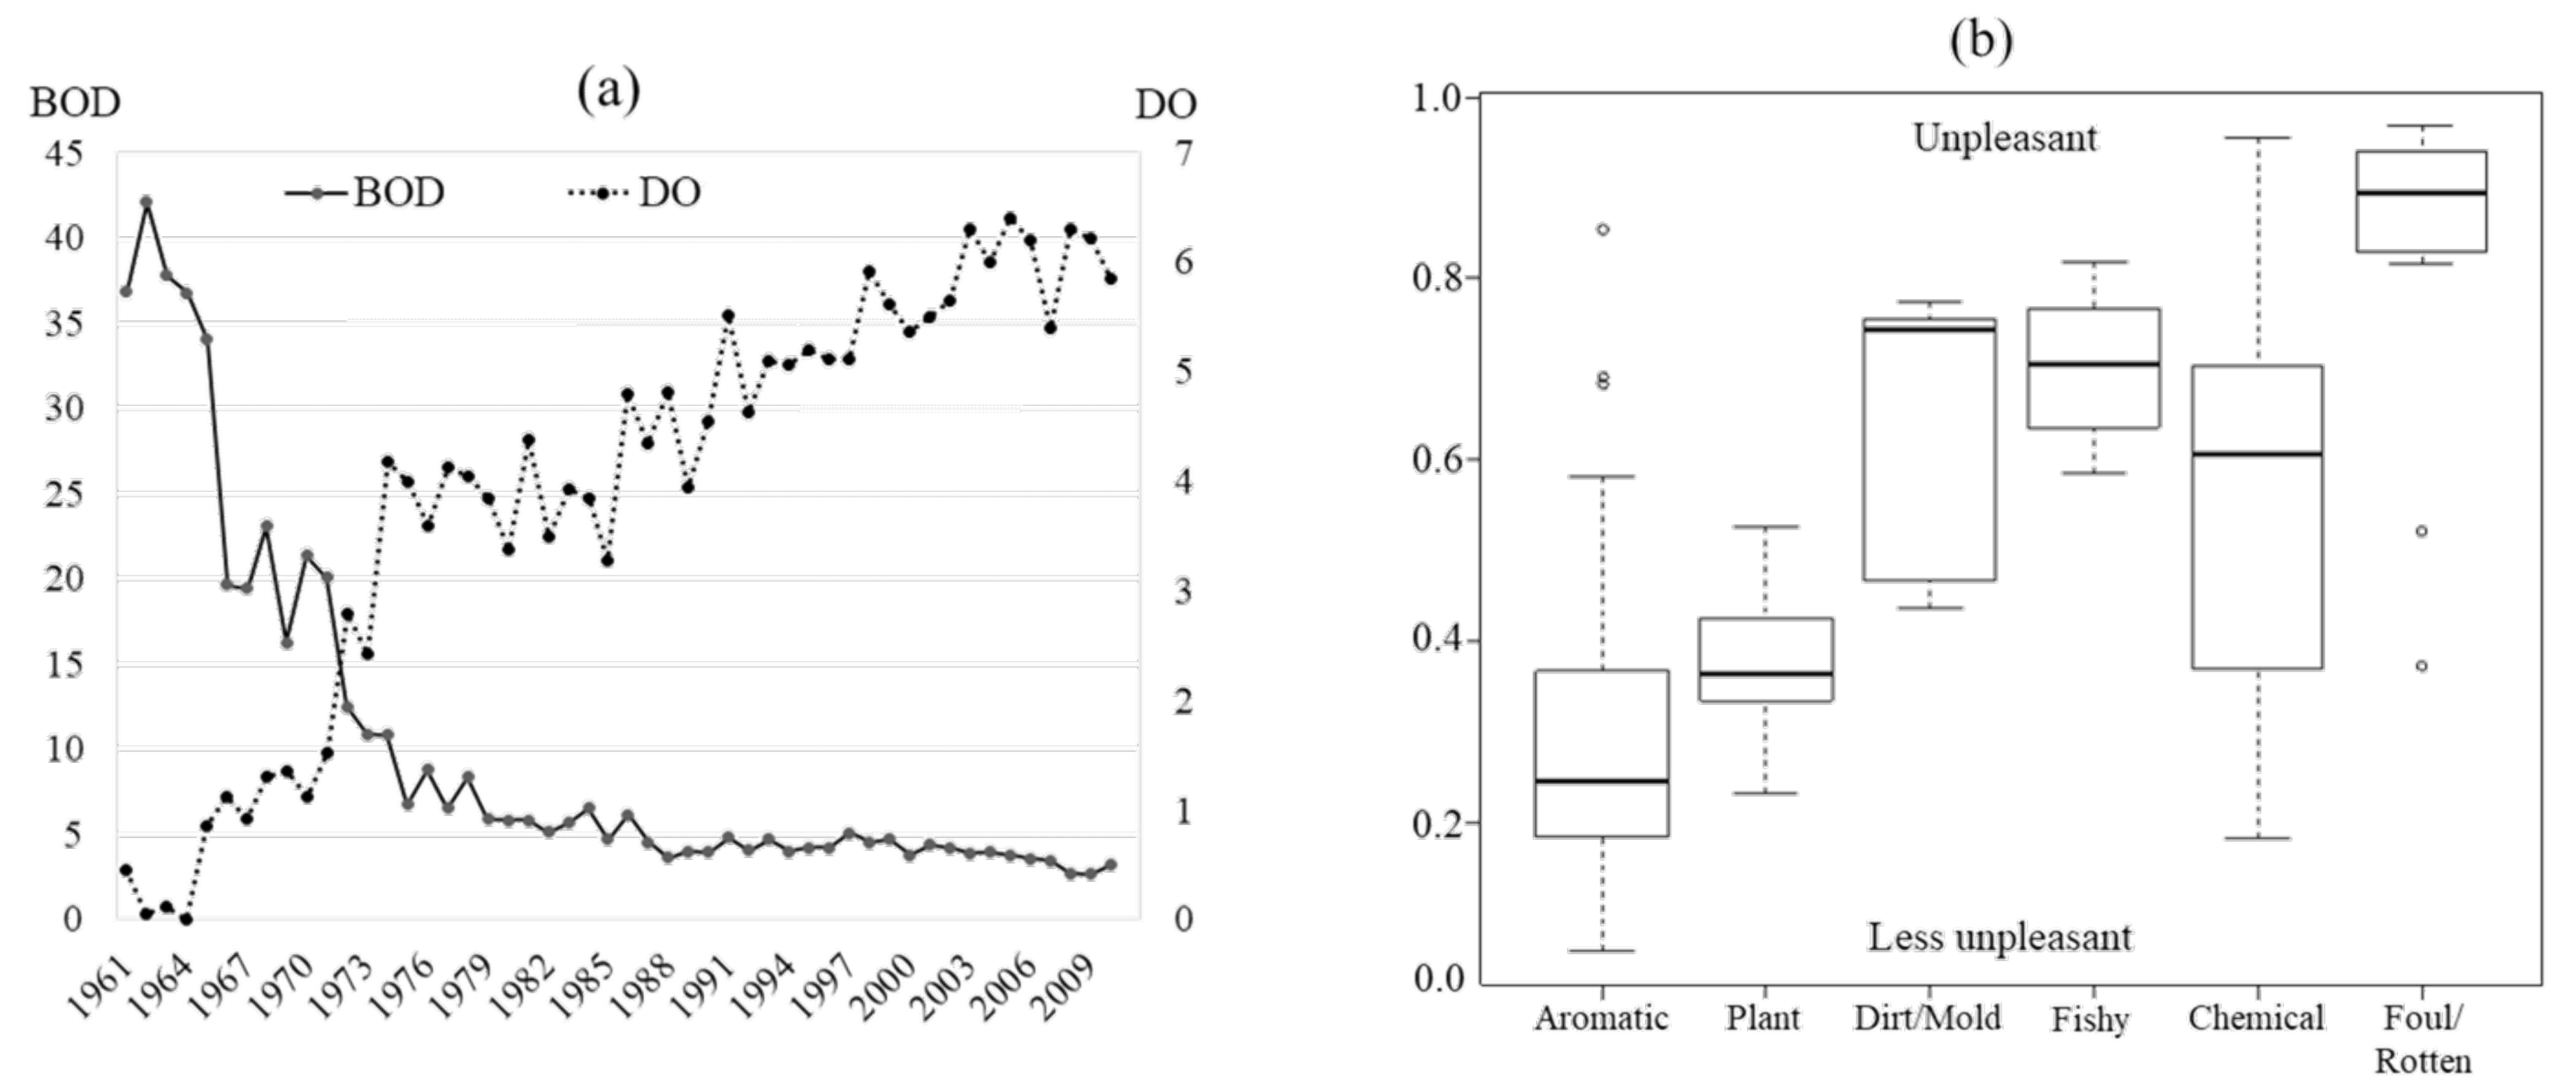
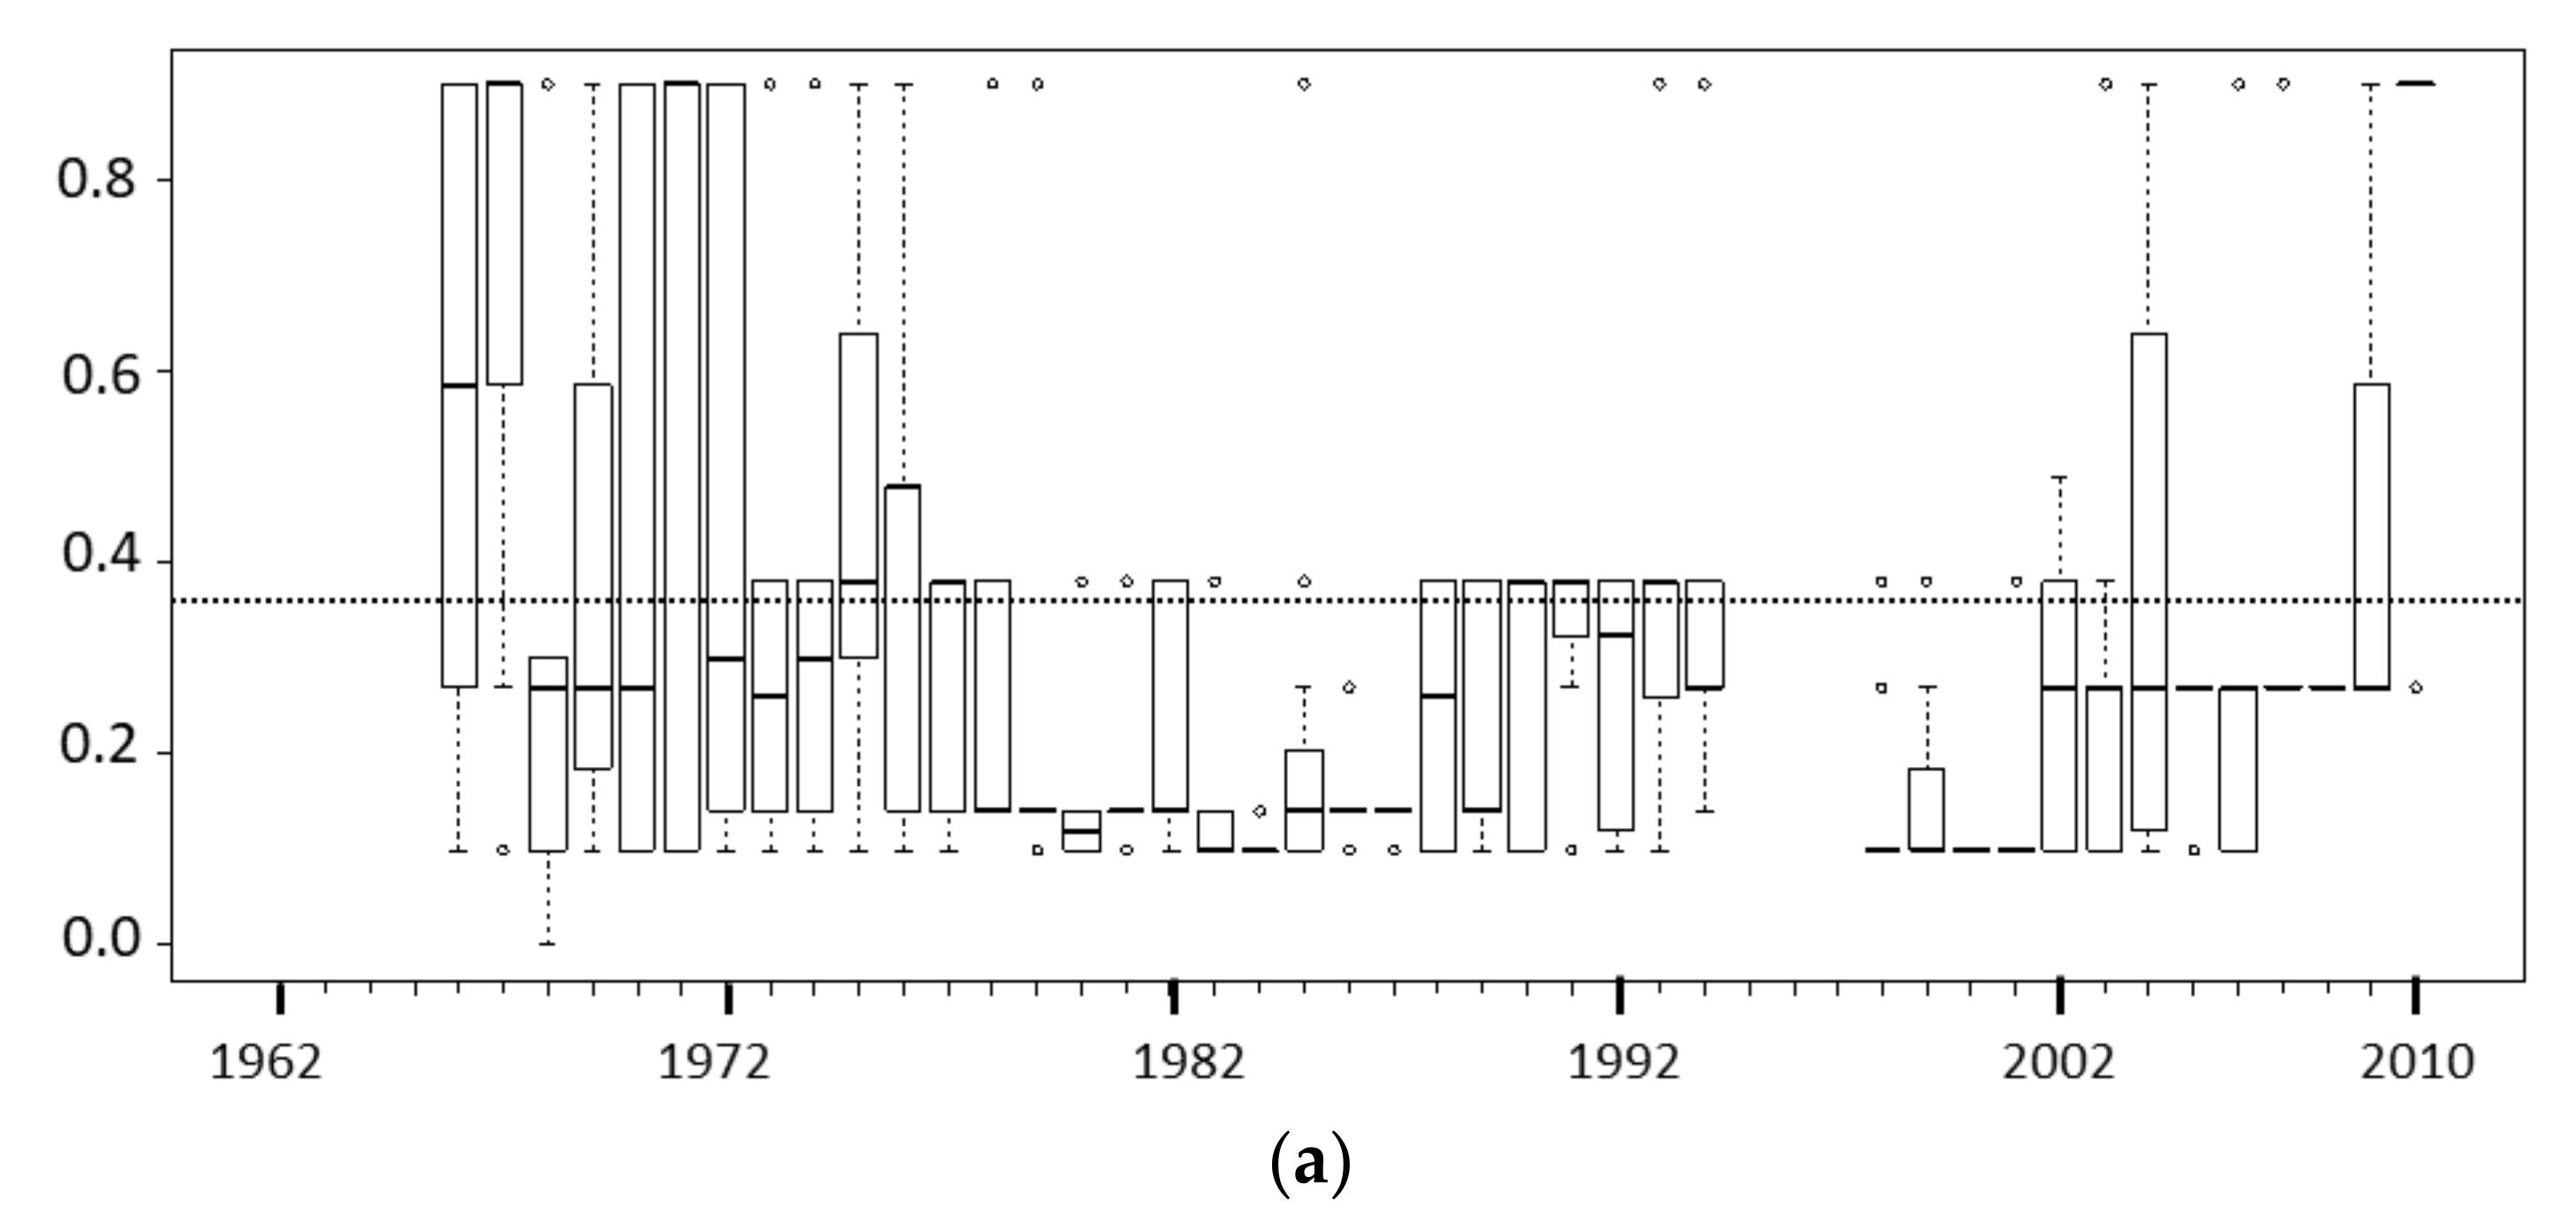
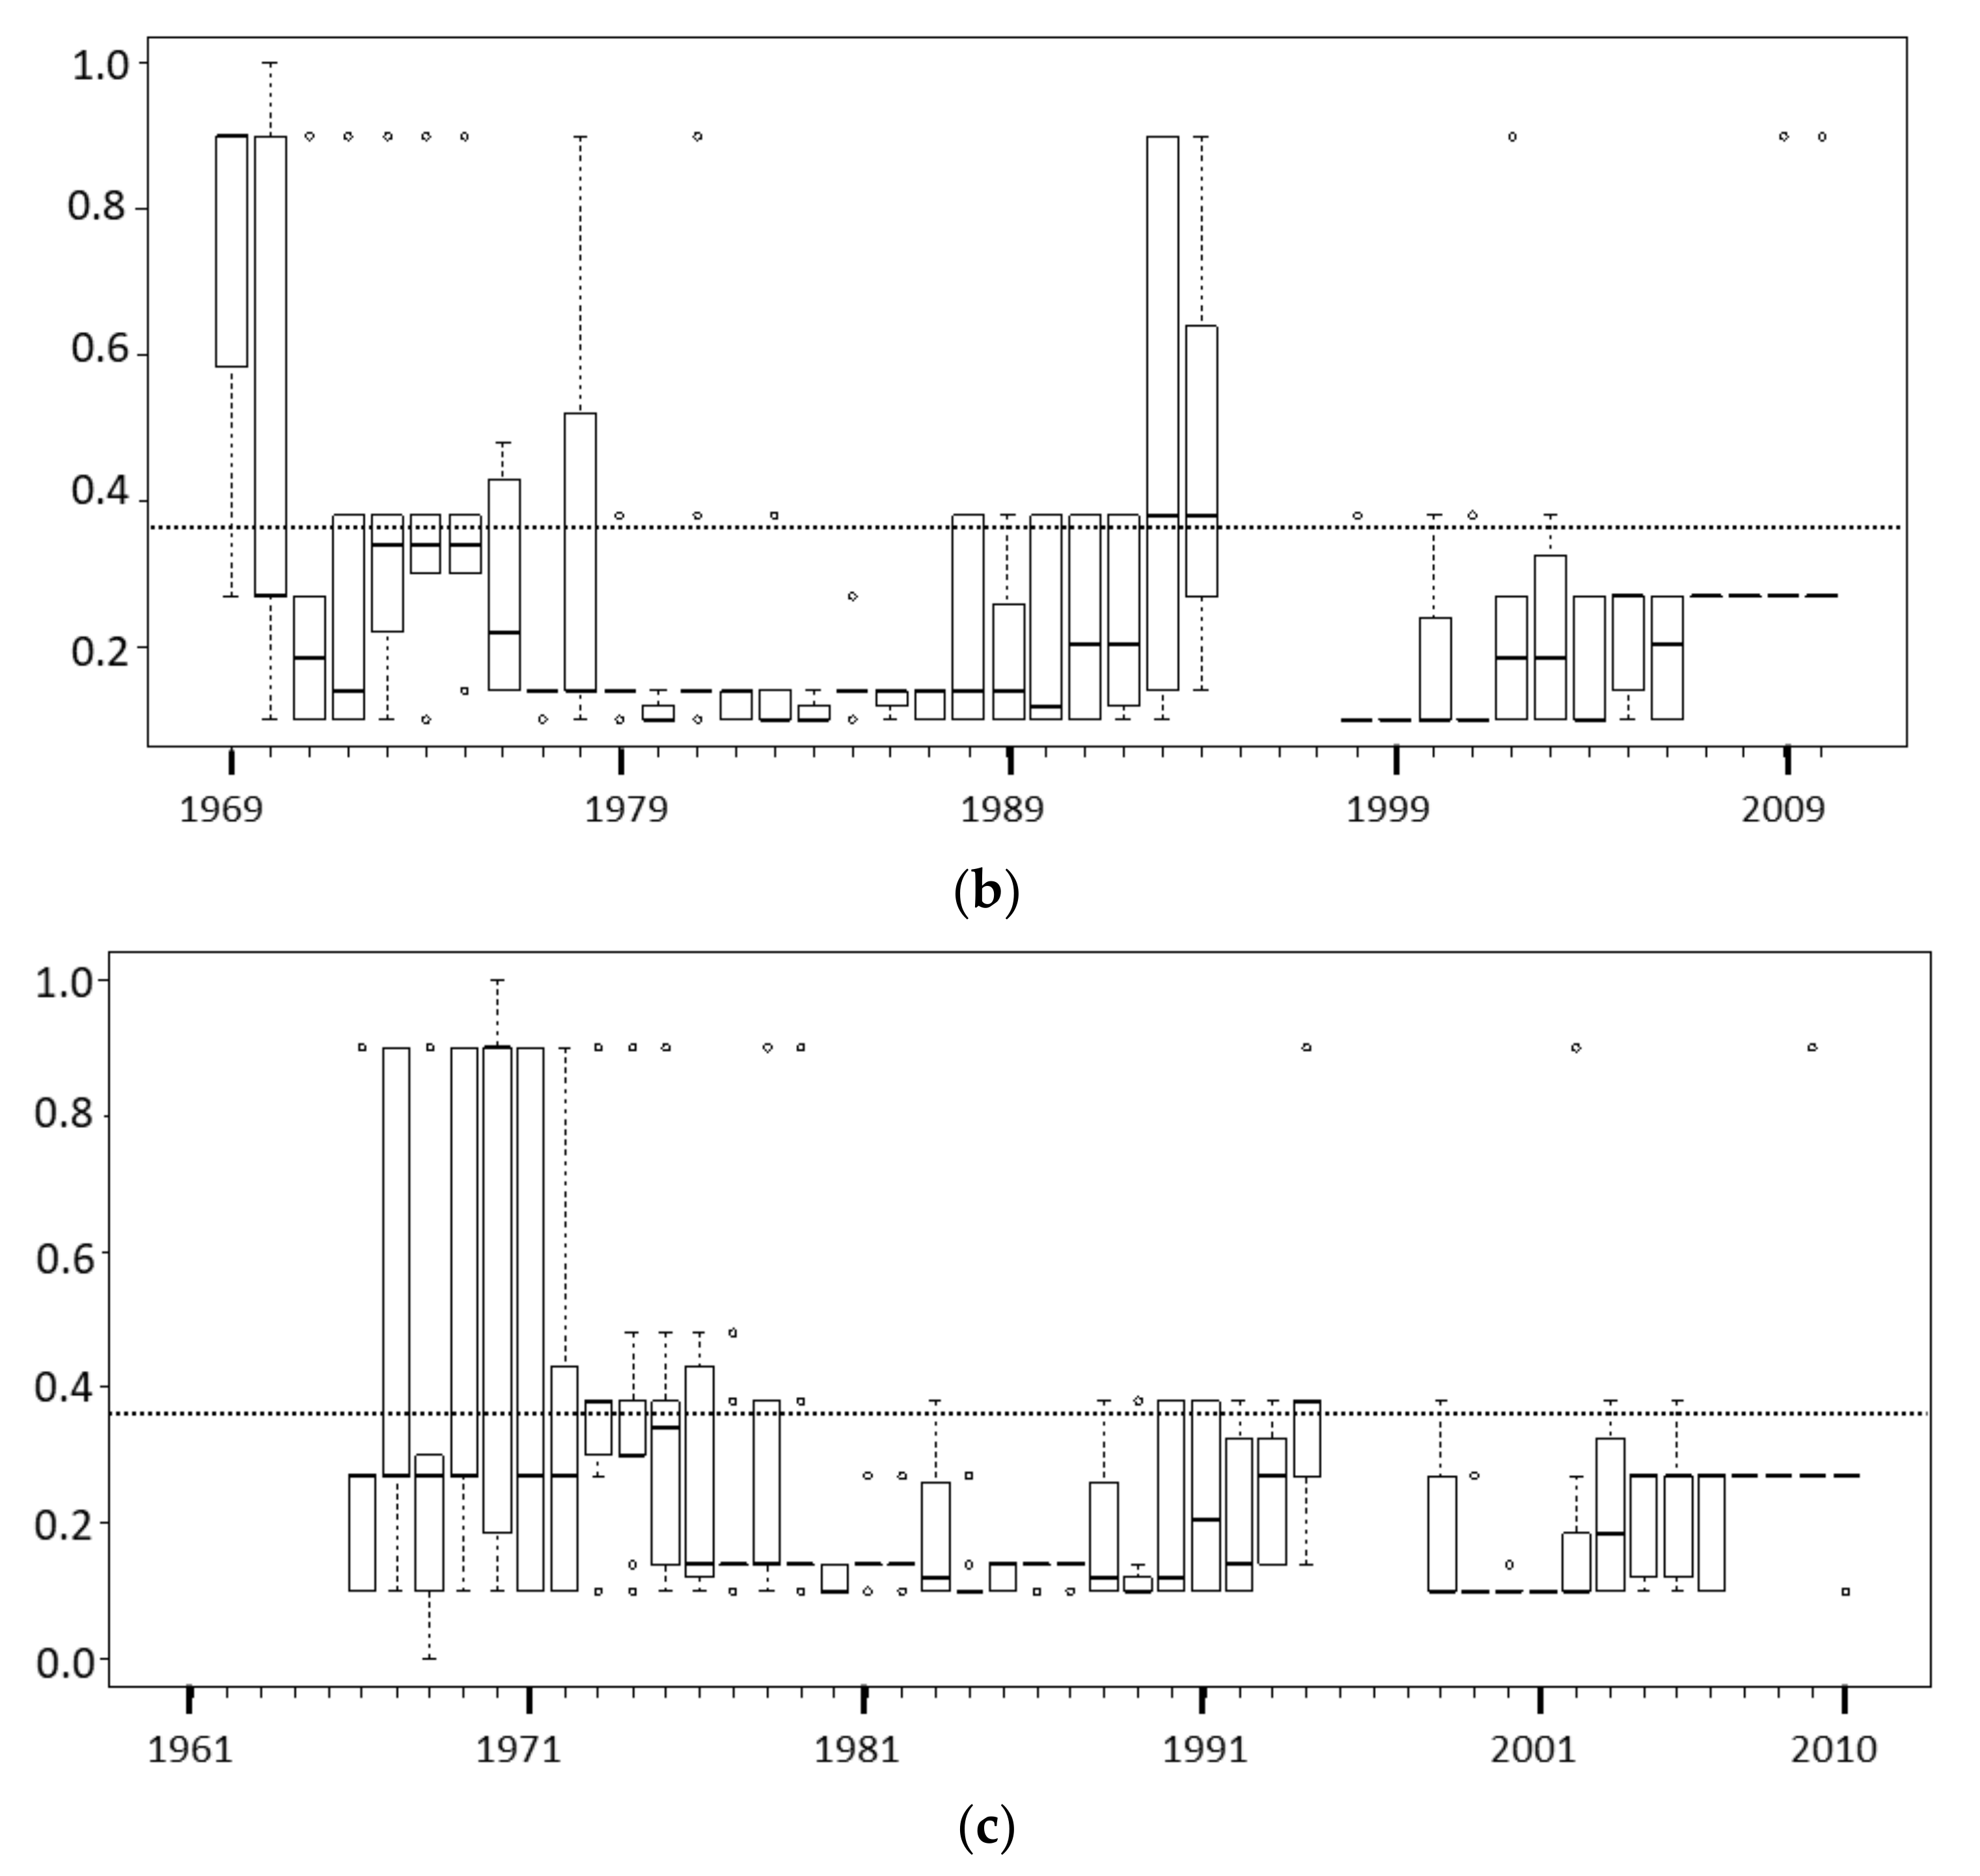
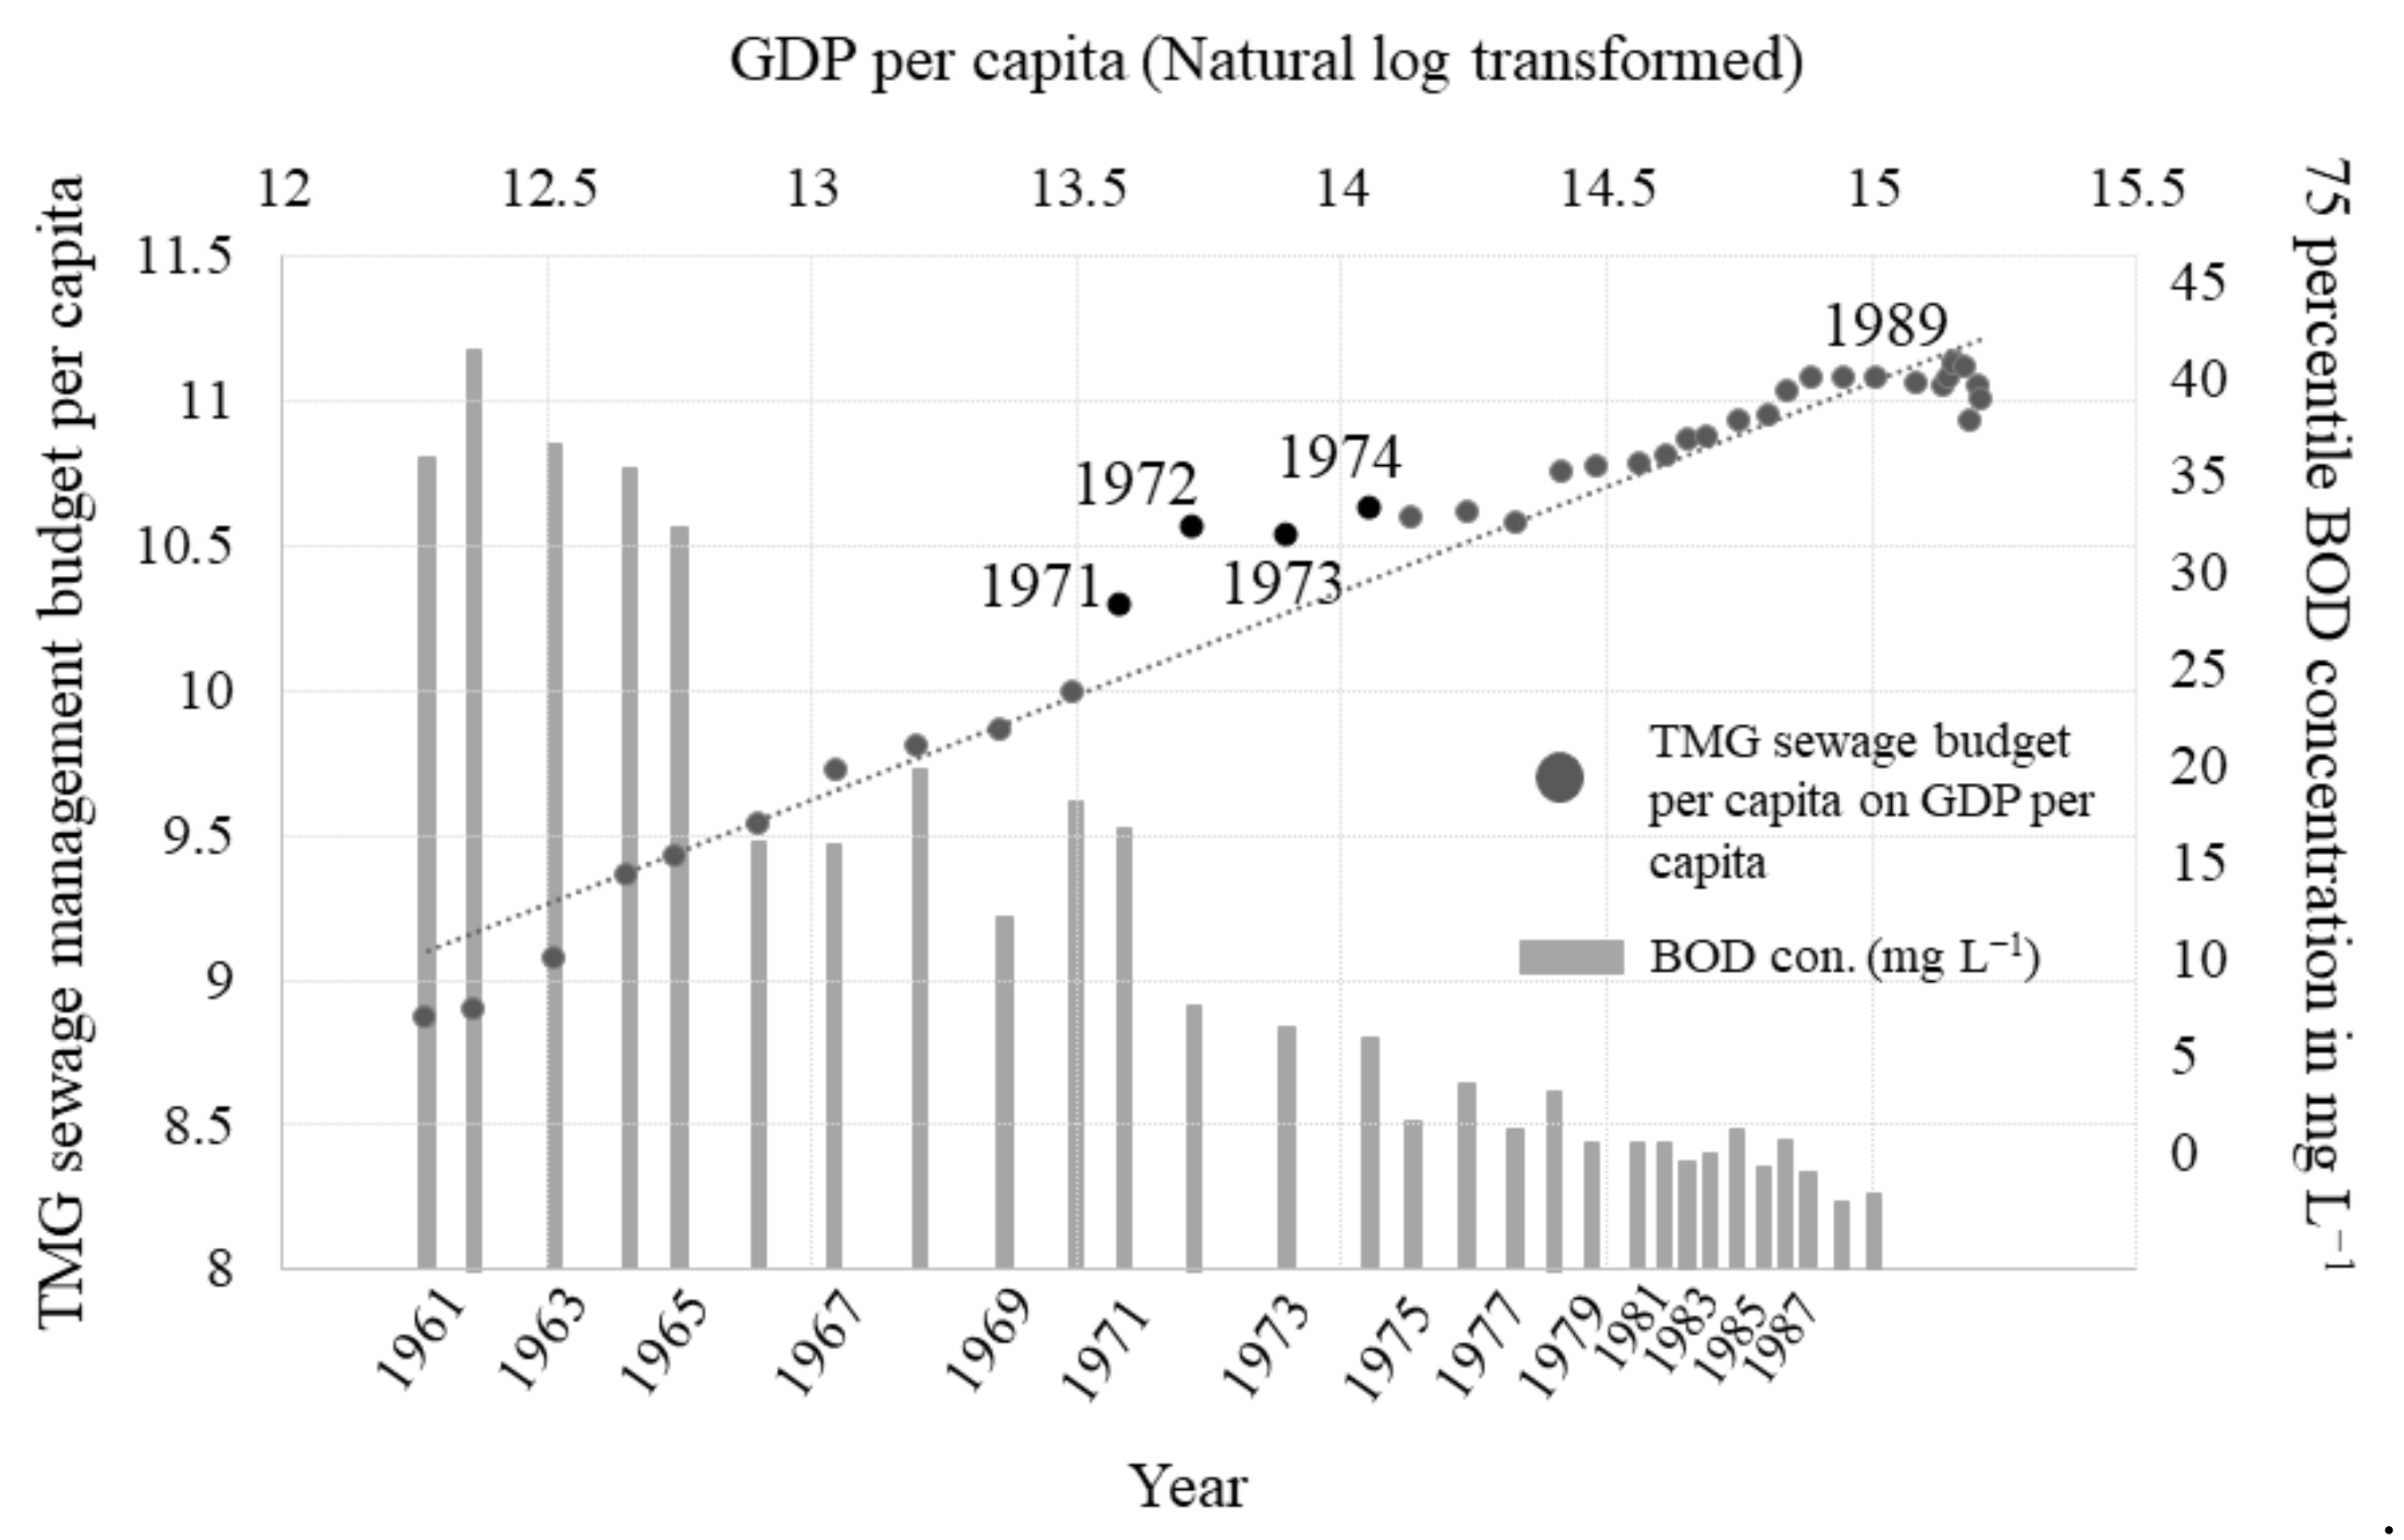
3.1. Odor and Water Quality

The odor scores for three sampling points—the confluence with the Syakujii (upstream), Azuma Bridge (midstream), and the confluence with the Kanda River (downstream)—are shown in Figure 5a–c. On the graph, the higher the score, the more unpleasant or offensive the odor. The dotted line on the graph is the mean score of the plant odor, which was 0.37. Three years from 1995 to 1997 were missing on the graph because the odor and color data were not available at the TMG office.
The odor score was clearly high before the 1980s at all the stations. The scores at the confluences were even higher, indicating that odor was more offensive there. The values observed in the Sumida River were larger than those of its two tributaries. Therefore, the odor values decreased along the river’s course (both midstream and downstream) after the confluence points due to the dilution process. The higher scores at the confluence indicated that the odors of the Syakujii and Kanda were very unpleasant during the 1970s. Figure 5a–c support the findings of qualitative analyses that foul odor estranged people from the Sumida during the high-growth period [16,18]. On the other hand, the odor at Azuma bridge, the midstream point where the water-bus stop is located, was only strong and unpleasant for a few years of the study period.
The TMG’s efforts to improve the water quality of the Sumida and the results are depicted in Figure 6. The TMG’s budget for sewage management per population of Tokyo is plotted against GDPpc from 1961 to 1998. BOD is not shown after 1987 because all values were under 5 mg L−1 (the permissible limit for surface water), averaging 4.3 mg L−1. The relations between the expenditure and GDPpc were linear. Before 1964 and after 1989, the sewage management budget was below the line. The first significant reduction in BOD was seen between 1965 and 1966. During that period, three major actions were taken; the Bureau of Construction of the TMG implemented a two-year policy for the protection of the Sumida against pollution in 1962, water intake from the Tone River began in 1964, and operation of wastewater treatment plants began in 1966 [32]. The next significant reduction was seen between 1971 and 1972. The Government of Japan enforced the Water Pollution Prevention Act in 1970, and the TMG allocated more of its budget to sewage management between 1971 and 1974 (as seen in Figure 6). All these mitigation efforts paid off, and the water quality of the Sumida improved significantly by the late 1970s. Additionally, once the situation improved, the government needed to allocate a relatively smaller budget to maintain the status quo, as indicated by the low values after 1989.

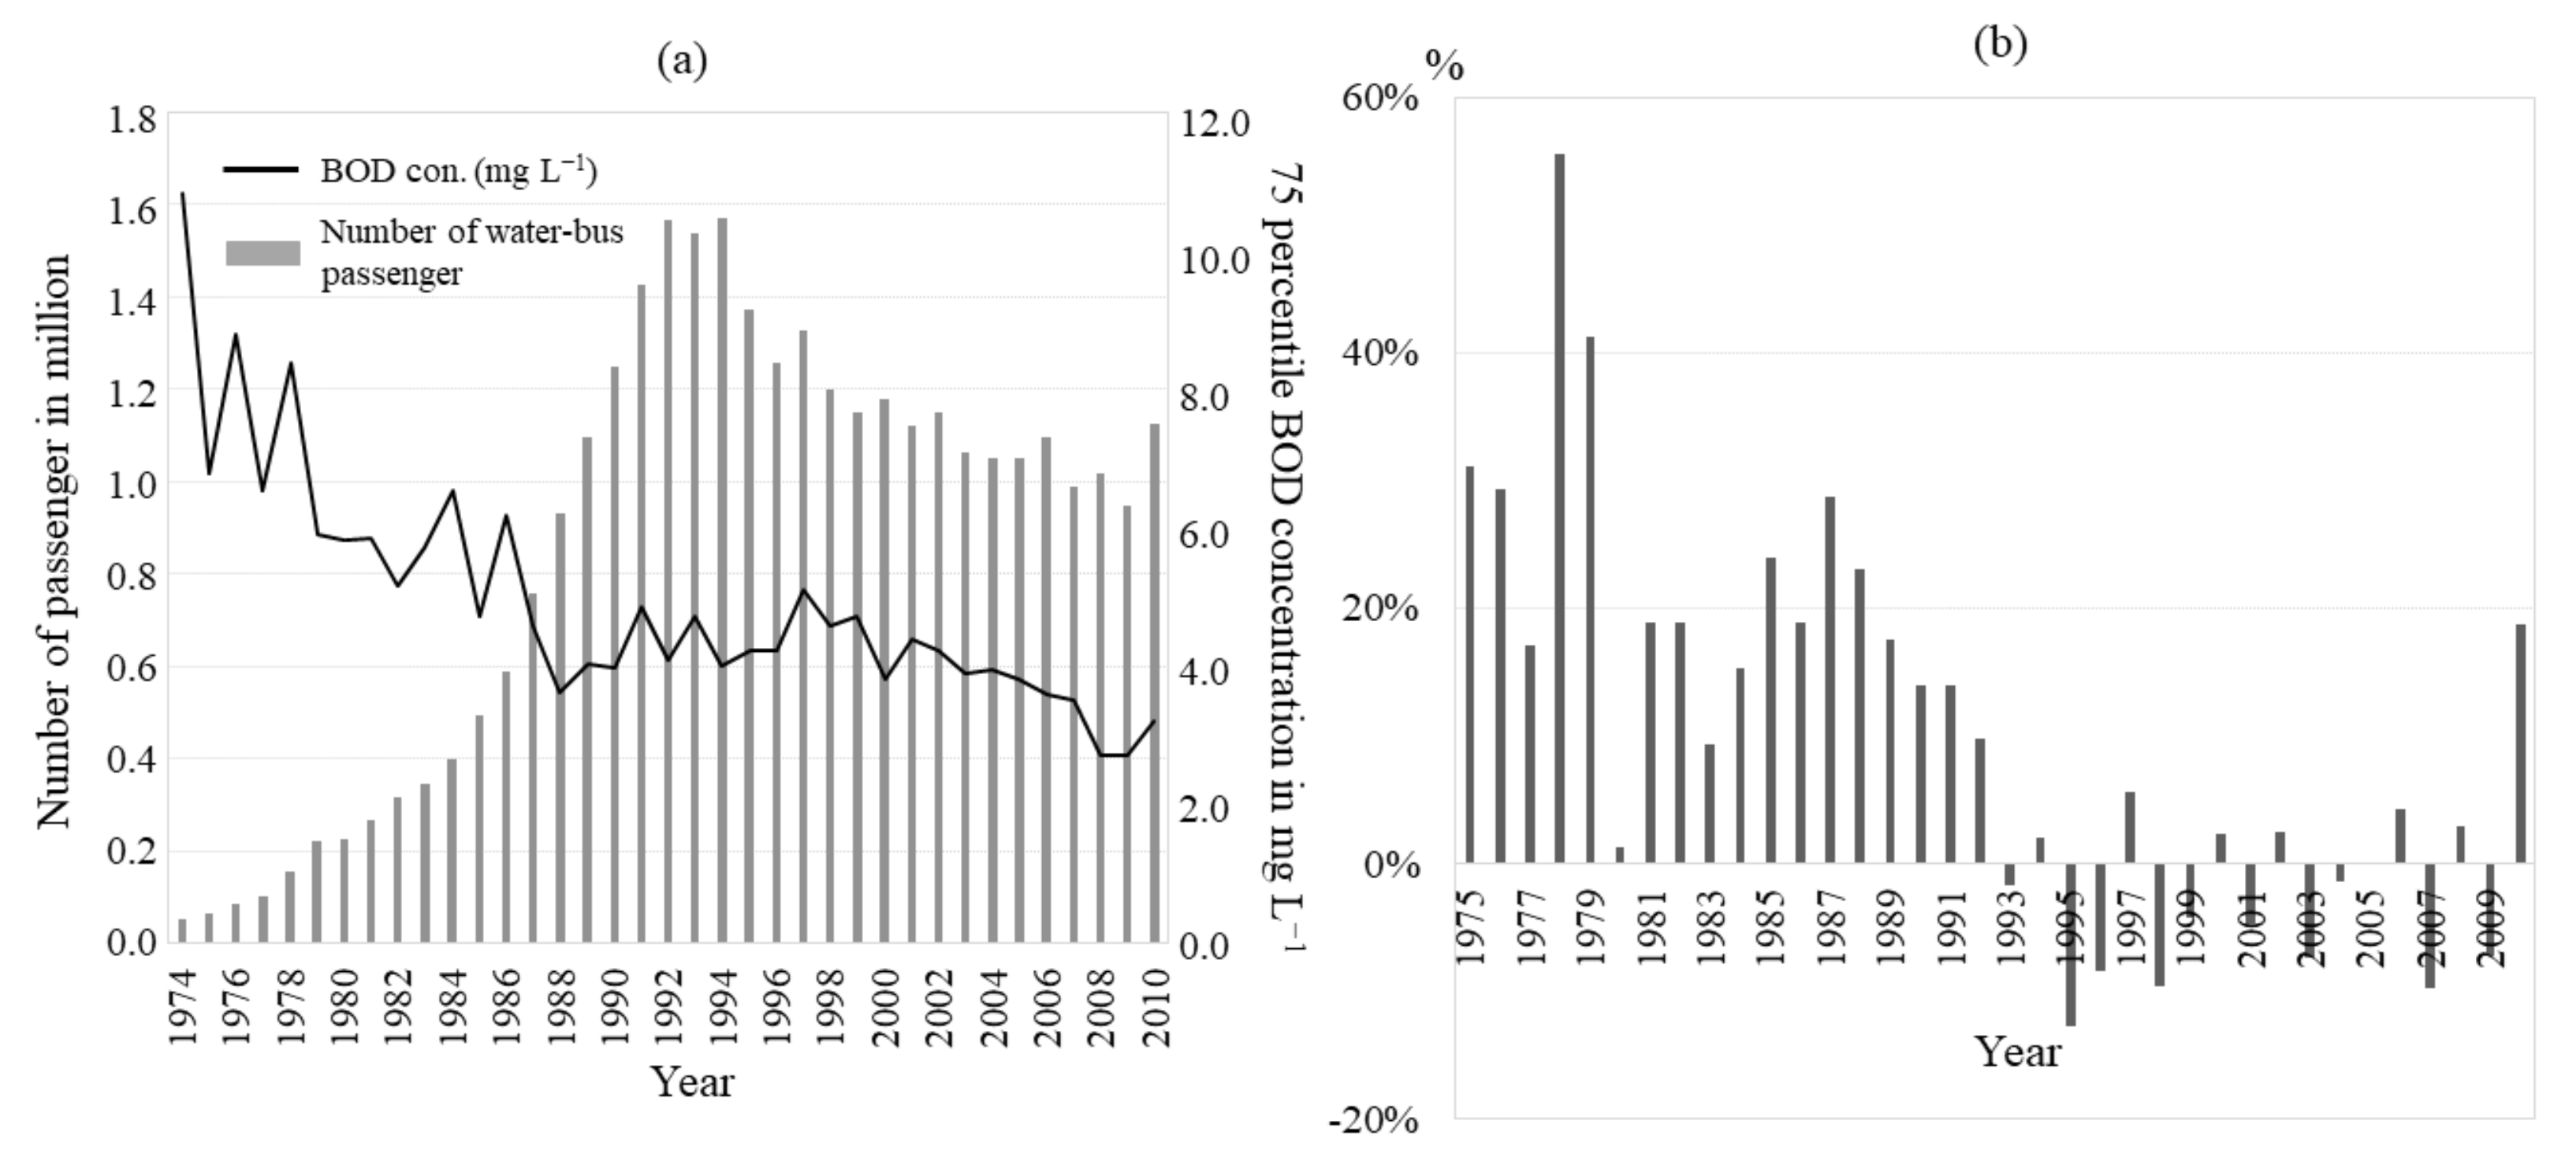
3.2. Water-Bus Passengers

The numbers of water-bus passengers on the Asakusa-Hinode route and the growth rates are shown in Figure 7a,b. The growth rate had two peaks, one in 1978 and another in 1987. Waterfront development attracted global attention in the early 1980s, and the second peak corresponds to the period of the waterfront boom and the bubble economy in Japan. However, the growth during the 1970s was most likely induced by water quality improvement. Once Japan entered a recession period in the middle of the 1990s, the number of passengers decreased over a decade. This decline was not caused by a deterioration in water quality, which had stabilized after the late 1980s. Instead, it was probably caused by the economic recession and people’s diversified interests in newly developed leisure activities.

3.3. Regional Impacts Caused by Demand Change

A series of IO analyses were conducted using the IO table with 280 sectors in 1985, 1990, 1995, 2000, and 2005. The inland navigation sector was classified under “coast/river transportation”, and it was differentiated from ocean ferries. Leontief inverse matrices were calculated using the inter-regional model, and regional output changes were calculated assuming that the demand for the inland navigation sector increased by JPY 10 million. The results are shown in Table 1.
The inland navigation sector is connected with many other industries both within and outside of Tokyo, and spillover effects were detected because the total regional output in Tokyo increased more than the demand increase in the inland navigation sector. The effects were larger if regions other than Tokyo were included; increasing the demand in the inland navigation sector by JPY 10 million generated JPY 15 million within Tokyo and JPY 24 million in all regions in 1985. However, the spillover effect diminished year by year.
Industries influenced by the demand change in the Tokyo inland navigation sector are shown in Table 2. The finance sector benefited most from the demand change, followed by the wholesale, vessel services, petroleum products, and advertisement sectors. The results would be different if a more localized IO table for the Taito area was used for the estimation, as the water-bus terminal was located there and the bus-operating company had connections with local merchants. With the IO table of Tokyo, the impacts on the retail sector turned out to be small.
The sales of the water-bus company were JPY 11.7 billion in 2009 and JPY 12.6 billion in 2010. Considering the change in the number of passengers from 2009 to 2010, one additional passenger increased sales by JPY 613. Since the fare in the 1970s and 1980s is unknown, it was estimated using the price index for the transportation sector published by the Statistics Bureau of Japan. The estimated fares were JPY 606 for 1985 and JPY 610 for 1986. The company’s sales increased by roughly JPY 60 million from 1985 to 1986, and the regional output including the spillover effect was JPY 90.04 million in Tokyo. The retail sector in Tokyo gained JPY 348,000 due to the demand increase in the inland navigation sector.

4. Conclusions

In many cities, economic development and urbanization processes progress by degrading the environment. Hence, reducing the environmental burden can protect aquatic species and maintain human well-being. Past studies have found that at certain points, economic development can contribute to environmental sustainability by adopting new technologies, and the turning point between degradation and improvement is described by Kuznets curves. Policymakers must play a leading role in reaching the turning point to change the direction of development, as this moment does not come automatically.
Cleaning up an impaired river is costly and time-intensive, but beyond the turning point, the river becomes a venue that promotes people’s well-being and preserves habitats for aquatic species. Such venues and habitats provide regional benefits. Accordingly, this study investigated the impacts of water quality improvement and changes in demand for the inland navigation sector in Tokyo on the urban economy. Several factors can be considered for the demand changes, including water quality improvement. The results of the IO analysis showed that the regional economy benefited from a demand increase in the inland navigation sector, which was previously significantly affected by river impairment. In other words, the demand for leisure activities near and in the water has the potential to contribute to the entire regional economy if the water quality is improved.
The results are underestimates because the study examined regional impacts by applying changes seen in one company among many operators in the sector. Moreover, water quality improvement has impacts beyond the inland navigation sector, as people visit the riverside for events or water sports. In addition, the value of the land near the river is also affected if the water environment attracts attention. Changes in the economy, society, and policy simultaneously affect water quality and the role of rivers. Waterfront development is probably not considered if the level of impairment is bad enough that olfactory perceptions limit leisure activities. Moreover, it should be noted that urban waterfront development to activate the underutilized water amenities of rivers and lakes is distinct from the development of dilapidated facilities such as run-down piers and ports, as water quality greatly influences amenity values.
One limitation is that this study investigated only a small part of the amenity values, and some may think that the return to the local economy is too small to allocate a limited budget for extensive sewage management. However, the return estimated in the study includes only part of the amenity values, and the results indicated that treating sewage water is not a waste of resources. Given the history and current developments of major global cities near rivers, investing in wastewater management is necessary for sustainable urban growth in the long run. In urban areas where natural resources are scarce, the water environment is a valuable resource to stimulate the local economy.
This study focused on leisure activities to investigate the economic benefits, but the restored aquatic habitats could also attract more people and thus contribute to the economy. Due to the lack of data on this phenomenon, we could not investigate it in this study. Leaving waterways as drainage systems for sewage or restoring their intrinsic worth results in different outcomes. If there is a case in which urban development succeeded when leaving waterways as drainage systems, it would be interesting to study the livelihood of residents and the status of the three types of sustainability. In conclusion, if cleaning up must be done sooner or later, it is helpful for policymakers to know the outcomes of both cases so that they can envision possible development plans to promote the livelihood of urban residents.

Author Contributions

Conceptualization, Y.I.; methodology, Y.I.; formal analysis, Y.I.; investigation, P.K. and Y.I.; data curation, P.K. and Y.I.; writing—original draft preparation, Y.I.; writing—review and editing, P.K. and Y.I. All authors have read and agreed to the published version of the manuscript.

Funding

This research received no external funding.

Institutional Review Board Statement

Not applicable.

Informed Consent Statement

Not applicable.

Data Availability Statement

Data are available upon request to authors.

Conflicts of Interest

The authors declare no conflict of interest.

References

  1. Arrow, K.; Bolin, B.; Costanza, R.; Dasgupta, P.; Folke, C.; Holling, C.S.; Jansson, B.-O.; Levin, S.; Mäler, K.-G.; Perrings, C.; et al. Economic Growth, Carrying Capacity, and the Environment. Ecol. Econ. 1995, 15, 91–95. [Google Scholar] [CrossRef]
  2. Daly, H.; Goodland, R. Environmental Sustainability: Universal and Non-Negotiable. Ecol. Appl. 1996, 6, 1002–1017. [Google Scholar] [CrossRef]
  3. Maslow, A.H. A Theory of Human Motivation. Psychol. Rev. 1943, 50, 370–396. [Google Scholar] [CrossRef] [Green Version]
  4. White, M.P.; Alcock, I.; Wheeler, B.W.; Depledge, M.H. Coastal Proximity, Health and Well-Being: Results from a Longitudinal Panel Survey. Health Place 2013, 23, 97–103. [Google Scholar] [CrossRef] [Green Version]
  5. Barton, H. Land Use Planning and Health and Well-Being. Land Use Policy 2009, 26, 115–123. [Google Scholar] [CrossRef]
  6. Wolf, K.L.; Robbins, A.S.T.T. Metro Nature, Environmental Health, and Economic Value. Environ. Health Perspect. 2015, 123, 390–398. [Google Scholar] [CrossRef] [Green Version]
  7. Costanza, R.; Daly, H.E. Natural Capital and Sustainable Development. Conserv. Biol. 1992, 6, 37–46. [Google Scholar] [CrossRef]
  8. Grossman, G.M.; Krueger, A.B. Environmental Impacts of a North American Free Trade Agreement; Working Paper 3914; National Bureau of Economic Research: Cambridge, MA, USA, 1991. [Google Scholar]
  9. Lee, C.C.; Chiu, Y.B.; Sun, C.H. The Environmental Kuznets Curve Hypothesis for Water Pollution: Do Regions Matter? Energy Policy 2010, 38, 12–23. [Google Scholar] [CrossRef]
  10. Stern, D.I. The Rise and Fall of the Environmental Kuznets Curve. World Dev. 2004, 32, 1419–1439. [Google Scholar] [CrossRef]
  11. Wong, Y.L.A.; Lewis, L. The Disappearing Environmental Kuznets Curve: A Study of Water Quality in the Lower Mekong Basin (LMB). J. Environ. Manag. 2013, 131, 415–425. [Google Scholar] [CrossRef]
  12. Tarr, J.A. The Search for the Ultimate Sink; The University of Akon Press: Akron, OH, USA, 1996. [Google Scholar]
  13. Andrews, M.J. Thames Estuary: Pollution and Recovery. In Effects of Pollutants at the Ecosystem Level; Sheehan, P.J., Miller, D.R., Butler, G.C., Bourdeau, P., Ridgeway, J.M., Eds.; John Wiley & Sons: Hoboken, NJ, USA, 1984; pp. 195–228. [Google Scholar]
  14. Tokyo Metropolitan Government. History of Sewerage in Tokyo; Tokyo Metropolitan Government: Tokyo, Japan, 2013.
  15. Kuse, H. On the Establishment of Logistics System and Its Influence on Cities during Edo-Era. Marit. Traffic Res. 2007, 56, 89–102. (In Japanese) [Google Scholar]
  16. Ishizaki, M. Could the Sumida River Be Resurrected? Water Resour. Environ. Res. 1989, 3, 9–17. (In Japanese) [Google Scholar] [CrossRef]
  17. Fujii, M. A Historical Study on the Relations between a Decline of the River Transport and a Development of the Railroad Network during Meiji Era. Hist. Stud. Civ. Eng. 1997, 17, 323–332. (In Japanese) [Google Scholar] [CrossRef]
  18. Ota, K. A Study on the Transition of Water Bus Routes and Ship Diversification in the Tokyo Waterfront Area. Int. J. Tour. Sci. 2014, 7, 37–44. (In Japanese) [Google Scholar]
  19. Mochizuki, T.; Shima, M.; Shinoda, Y. History of the Perpendicular Banking in the Sumida River. Hist. Stud. Civ. Eng. 1998, 18, 545–552. [Google Scholar] [CrossRef]
  20. Sorensen, A. Building World City Tokyo: Globalization and Conflict over Urban Space. Ann. Reg. Sci. 2003, 37, 519–531. [Google Scholar] [CrossRef] [Green Version]
  21. Sasaki, T.; Yokouchi, N.; Okada, T.; Hanano, S.; Ichihashi, S. A Study on Sea Route Setting Requirement of Urging Waterborne Traffic Infrastructure at the City: A Case Study of Waterborne Traffic in Tokyo, Chiba, and Kanagawa. Nihon Daigaku Rikou Gakubu Gakujutsu Kouenkai Kouen Rombunshuu 2005, J-63, 868–869. (In Japanese) [Google Scholar]
  22. Bunce, S.; Desfor, G. Introduction to “Political Ecologies of Urban Waterfront Transformations”. Cities 2007, 24, 251–258. [Google Scholar] [CrossRef] [Green Version]
  23. Hagerman, C. Shaping Neighborhoods and Nature: Urban Political Ecologies of Urban Waterfront Transformations in Portland, Oregon. Cities 2007, 24, 285–297. [Google Scholar] [CrossRef]
  24. Matsumoto, M.; Yokouchi, N.; Okada, T.; Hosen, T. A Study on Historical Transition of Waterfront Development 7: A Case Study of Tokyo from “Tokyo with Green under Bluesky Framework” Development to “Second Master Plan” Development. Nihon Daigaku Rikou Gakubu Gakujutsu Kouenkai Kouen Rombunshuu 2005, J-52, 846–847. (In Japanese) [Google Scholar]
  25. Shimura, H. Sustainable Community and Redevelopment Project: A Case Study of Tsukuda and Tsukishima. Urban Hous. Sci. 2007, 57, 27–32. (In Japanese) [Google Scholar] [CrossRef]
  26. Jinnai, H. Water City Edo, Tokyo; Kodansha: Tokyo, Japan, 2013; ISBN 978-4062184694. (In Japanese) [Google Scholar]
  27. Dravnieks, A.; Masurat, T.; Lamm, R.A. Hedonics of Odors and Odor Descriptors. J. Air Pollut. Control Assoc. 1984, 34, 752–755. [Google Scholar] [CrossRef]
  28. Sado-Inamura, Y.; Fukushi, K. Considering Water Quality of Urban Rivers from the Perspectives of Unpleasant Odor. Sustainability 2018, 10, 650. [Google Scholar] [CrossRef] [Green Version]
  29. Tokyo Metropolitan Government. Tokyo Statistical Yearbook; Tokyo Metropolitan Government: Tokyo, Japan. Available online: https://www.toukei.metro.tokyo.lg.jp/tnenkan/tn-index.htm#S27 (accessed on 28 August 2018).
  30. Osawa, K. River Water Transportation as an Urban Transportation: Present State and Problem of Water Bus. Kasen 1997, 613, 35–40. (In Japanese) [Google Scholar]
  31. Miller, R.E.; Blair, P.D. Input-Output Analysis: Foundations and Extensions, 2nd ed.; Cambridge University Press: New York, NY, USA, 2009. [Google Scholar]
  32. Water Environment Division, Ministry of Environment. Policies on Water Environment Conservation in Japan; Ministry of Environment: Tokyo, Japan, 2007. Available online: https://archive.iges.or.jp/jp/archive/press/pdf/07_11_20_report/1-1.pdf (accessed on 26 June 2022). (In Japanese)
Figure 1. Study area map with major location points. The map includes the 23 wards of Tokyo. Wards in dark grey belong to the Sumida River Basin.
Earth 03 00051 g001
Figure 2. (a) BOD concentration (mg L−1) and DO (mg L−1) of the Sumida River. (b) Hedonic tones of odor for the six types categorized by the TMG. Aggregated mean: aromatic = 0.29, plant = 0.37, dirt/mold = 0.64, fishy = 0.70, chemical = 0.56, foul/rotten = 0.82.
Earth 03 00051 g002
Figure 3. GDP per capita and the budget for sewerage development per capita in Tokyo. The graph was plotted using the data from 1961 to 1998 from the TMG.
Earth 03 00051 g003
Figure 5. (a) Odor score at the confluence with the Syakujii River (upstream); (b) odor score at Azuma bridge (midstream: water-bus stop); (c) odor score at the confluence with the Kanda River (downstream).
Earth 03 00051 g005aEarth 03 00051 g005b
Figure 6. Investment in sewage management and BOD concentration. Regression line: y = 0.72 x + 0.27; R2 = 0.95.
Earth 03 00051 g006
Figure 7. (a) Number of water-bus passenger and BOD con. in mg L−1. (b) Growth in the number of passengers in percentage.
Earth 03 00051 g007
Table 1. Total output in Tokyo and in all regions.
Impact within Tokyo (JPY)Impact in All Regions (JPY)
198515,006,00023,963,000
199013,503,50019,591,200
199512,608,90017,045,100
200013,735,20018,454,400
200512,561,90016,422,000
Table 2. Sectors in Tokyo that benefited from the demand increase in the inland navigation sector.
19851990199520002005
SectorJPYSectorJPYSectorJPYSectorJPYSectorJPY
1Other transportation-related1,575,000Finance643,600Finance580,700Finance969,600Finance752,000
2Finance708,000Other transportation-related399,100Petroleum products207,500Vessel service287,100Wholesale177,200
3Insurance449,000Petroleum products328,800Vessel service201,300Petroleum products246,500Advertisement151,600
4Petroleum products269,000Vessel service182,200Wholesale200,600Wholesale217,900Petroleum products129,800
5Rent on real estate166,000Insurance173,300Insurance136,600Advertisement216,700Harbor transportation97,400
6Construction/
maintenance
132,000Wholesale158,600Unidentified118,900Construction/
maintenance
112,300Construction/
maintenance
97,200
7Wholesale119,000Advertisement144,800Advertisement104,200Building maintenance107,500Coal/lignite91,700
8Travel agency119,000Unidentified107,900Retail69,400Unidentified93,000Building maintenance83,000
9Telecommunication104,000Construction/
maintenance
92,000Communication services63,600Office machine lease80,900Energy70,200
10Advertisement91,000Travel agency89,200Telecommunication60,400Insurance75,500Communication services65,700
11 and lowerRetail58,000Retail60,000 Retail73,200Retail34,800
Total of the top 10 and retail sectors 3,790,000 2,379,500 1,743,200 2,480,200 1,750,600
Publisher’s Note: MDPI stays neutral with regard to jurisdictional claims in published maps and institutional affiliations.

