Article

Estimating SDG Indicators in Data-Scarce Areas: The Transition to the Use of New Technologies and Multidisciplinary Studies

by
Angelos Alamanos
1,* and
Suzanne Linnane
2
1
The Water Forum, Centre for Freshwater and Environmental Studies, Dundalk Institute of Technology, Marshes Upper, A91K584 Dundalk, Co. Louth, Ireland
2
Centre for Freshwater and Environmental Studies, School of Health and Science, Dundalk Institute of Technology, Marshes Upper, A91K584 Dundalk, Co. Louth, Ireland
*
Author to whom correspondence should be addressed.
Earth 2021, 2(3), 635-652; https://doi.org/10.3390/earth2030037
Submission received: 19 July 2021 / Revised: 3 September 2021 / Accepted: 9 September 2021 / Published: 11 September 2021

Abstract

:
The Sustainable Development Goals (SDGs) and their indicators provide opportunities to best combine the available knowledge and data to monitor and estimate different metrics and track their progress. The overall picture can be complex as some indicators are often interconnected (e.g., rural and/or urban development with a water body’s status). Two factors can play a crucial role in achieving the SDGs: the use of new technologies for database building and multidisciplinary studies and understanding. This study aims to explore these factors, highlight their importance and provide an example as guidance of their proper and combinative use. Ireland is used as an example of a data-scarce case with poor–slow progress, especially on the environmental SDGs. Two “non-reported” SDG indicators (lack of data) are selected and estimated in this work using freely available data (remote sensing, satellite imagery) and geospatial software for the first time in the country. The results show improvements in rural and urban development; however, this is accompanied by negative environmental consequences. A more holistic approach is needed and a broader conceptual model is presented to avoid any misleading interpretations of the study of SDGs. The transition to the modern technological and multidisciplinary evolution requires respective knowledge and understanding, strongly based on complex systems analysis.

1. Introduction

The Sustainable Development Goals (SDGs) of the United Nations (UN) are 17 action-oriented goals, universal, integrated and transformative, and applicable to all nations, and that cover the whole sustainability agenda: poverty, human development, the environment and social justice [1]. The 2030 Agenda for Sustainable Development was formally adopted by 193 heads of government in 2015 [2] and in 2017 the UN Statistical Commission adopted their measurement framework comprised of 232 indicators designed to measure the 17 SDGs and their respective 169 targets. Ban Ki-moon, the former Secretary General of the UN, described them as the “to do list for planet and people” [3]. The criticism around the SDGs refers to their concise and objective character, the achievement of country-effective measurements and the difficulties for setting priorities, and the measuring, validating and communicating of 232 indicators [4,5]. On the other hand, there are several positive views justifying their optimism by the fact that SDGs mark the first time in human history that the nations of the world have reached an accord on a comprehensive vision, supported by goals and targets [6]. The SDGs provide the general recommendations, and each country best combines the available knowledge, data and techniques to achieve them through proper application, measurement and progress tracking. This creates many opportunities in terms of science and practical research to overcome the various challenges (e.g., indicators’ estimation and monitoring) and indicates a transition to more interdisciplinary studies, as SDGs involve different scientific fields [7].
In Ireland, the 17 SDGs are already being addressed through national policies (e.g., the Sustainable Development Strategy and the National Development Plan). Moreover, a stakeholder group from across the various networks (national SDG Stakeholder Forum) was developed (first half of 2018) to inform on and be engaged with the SDGs’ achievement [8]. However, recent findings show certain shortcomings in the efficient achievement of the SDGs in the country: The National Plan for the implementation of the SDGs [8] recognises that meeting all the SDGs, especially the environmental goals, is a challenging task. In fact, Ireland scored very low on the environment index and the improvement of some indicators is progressing at a much slower rate compared to other countries [9]. In fact, Ireland currently ranks 11th out of 15 in overall SDG progress and 15th out of 15 on the environmental SDGs; however, this seems not to reflect the environmental efforts of the country. Poor performance on goals relating to responsible production and consumption, clean energy and climate change are among the key factors driving the poor results [9]. The Irish Environmental Protection Agency’s (EPA) research on the issue indicates two key findings [10]: (i) Awareness of the SDGs remains low but is slowly growing within national enterprise agencies, within the private sector and among the wider public. (ii) Ireland’s key national enterprise strategies align with a number of the SDGs (mainly the economic SDGs); however, there is a lack of policy and strategy alignment with the targets of the SDGs that have been independently identified as challenging for Ireland to meet by 2030 (particularly the environmental SDGs). Data limitations complete the picture of the main challenges. According to [8]: “while data on health and education ensures we can use at least 4 indicators per goal, data for some SDGs is covered in a very limited way. Particularly some environmental SDGs have not been updated or have insufficient coverage…All countries face challenges, even the best ranked performers in the SPI (Spatial Precipitation Index). Yet, as we argued at the beginning of this report, if it counts, we must count it”.
Summarising the above, the room for improving the SDGs’ progress in Ireland refers mainly to: (a) increasing awareness, (b) building data capacity to overcome data limitations that hinder the estimation of indicators, (c) further support the environmental related SDGs, and (d) achieve the above timely, as the progress has been relatively slow so far. The database capacity refers more to the actual record keeping of basic parameters (environmental, social, economic, etc.) by the Local Authorities (usually small agencies, responsible for that). This combination of limited awareness–understanding, data and lack of strategic alignment, is risky because it can result in misleading interpretations or estimations of SDG indicators and metrics. On the other hand, as mentioned, the SDGs themselves are an opportunity to exploit new technologies, create integrated databases, and enhance understanding. Thus, this work aims to provide useful insights for improving the aforementioned challenges in Ireland by using these opportunities.
More specifically, we use Remote Sensing (RS) technology to estimate some indicative SDG indicators (relevant to the environmental issues) and give a simple example on how the results can be misleading if there is lack of multidisciplinary understanding. RS has been increasingly used for estimating SDGs. There are many examples demonstrating that RS data and satellite imagery provide essential information for monitoring directly or indirectly (through sub-indicators) the SDGs. Land cover, land cover and carbon changes [11], vegetation and integrated land use changes [12], water-related parameters [13], rural and urban development or other socio-economic factors [14], etc., have been increasingly used in the last decade [15]. Additionally, the United Nations (UN) and the partner institutions have been working extensively with RS technologies to monitor the different SDGs [16,17] and the Global Geospatial Information Management (UN-GGIM) initiative is also in place (http://ggim.un.org/ accessed on 18 July 2021). Ishtiaque et al. [18] reviewed the different RS-based research approaches that have been used for monitoring the progress of SDG 15. They noted the advantages of the advances of RS regarding their reliability and increasing quality capabilities, especially for data-scarce areas. To our knowledge, this is the first application of RS in Ireland for estimating SDG indicators. The above studies recommend that satellite observations must be used carefully in a broader context of understanding the examined problems.
Subsequently, we present a broader conceptual model that avoids any misleading interpretations from the study of SDGs, arguing that the transition to the modern technological and multidisciplinary evolution requires the respective knowledge and understanding. The analysis is performed with free and publicly available data and software, using simple techniques, in order to demonstrate a way to estimate SDG indicators in the case of facing serious data limitations. The use of satellite data, and their mapping and analysis in QGIS to estimate SDG metrics, is a novel element and, to our knowledge, it has not been applied in Ireland. Moreover, it is a preliminary exploration of the potential of satellite data to strengthen the monitoring of certain goals. Finally, the procedure and findings of this study can also be used for increasing awareness and making policymakers, analysts and practitioners more familiar with the SDGs.

2. Materials and Methods

2.1. Identifying the Need—Selecting SDG Indicators

The need for enhancing the environmental progress in Ireland has been noted, as well as the importance of following integrated approaches [8,19]. Land management SDGs call for consistent tracking of land cover metrics, including productivity, land cover, soil carbon, urban expansion, etc., and have direct impact on surface and groundwater resources. This, their study can provide a useful and indicative example for approaching them as challenging objectives. SDGs 11 and 15 relate to sustainable urbanisation, and land use and cover change, respectively. A description of the examined sets of goals, targets and indicators follows [20]:
  • SDG 15: Life on Land: Protect, restore and promote sustainable use of terrestrial ecosystems, sustainably manage forests, combat desertification, and halt and reverse land degradation and halt biodiversity loss.
    Target 15.3: Land Degradation Neutrality (LDN): By 2030, combat desertification, restore degraded land and soil, including land affected by desertification, drought and floods, and strive to achieve a land degradation neutral world. Achieving LDN will require avoiding or reducing new degradation and restoring and rehabilitating lands that were degraded in the past.
    Indicator 15.3.1: Proportion of land that is degraded over total land area. It aims to maintain or improve the sustainable delivery of ecosystem services; maintain or improve productivity, in order to enhance food security; increase resilience of the land and populations dependent on the land; seek synergies with other social, economic and environmental objectives; reinforce responsible and inclusive governance of land.
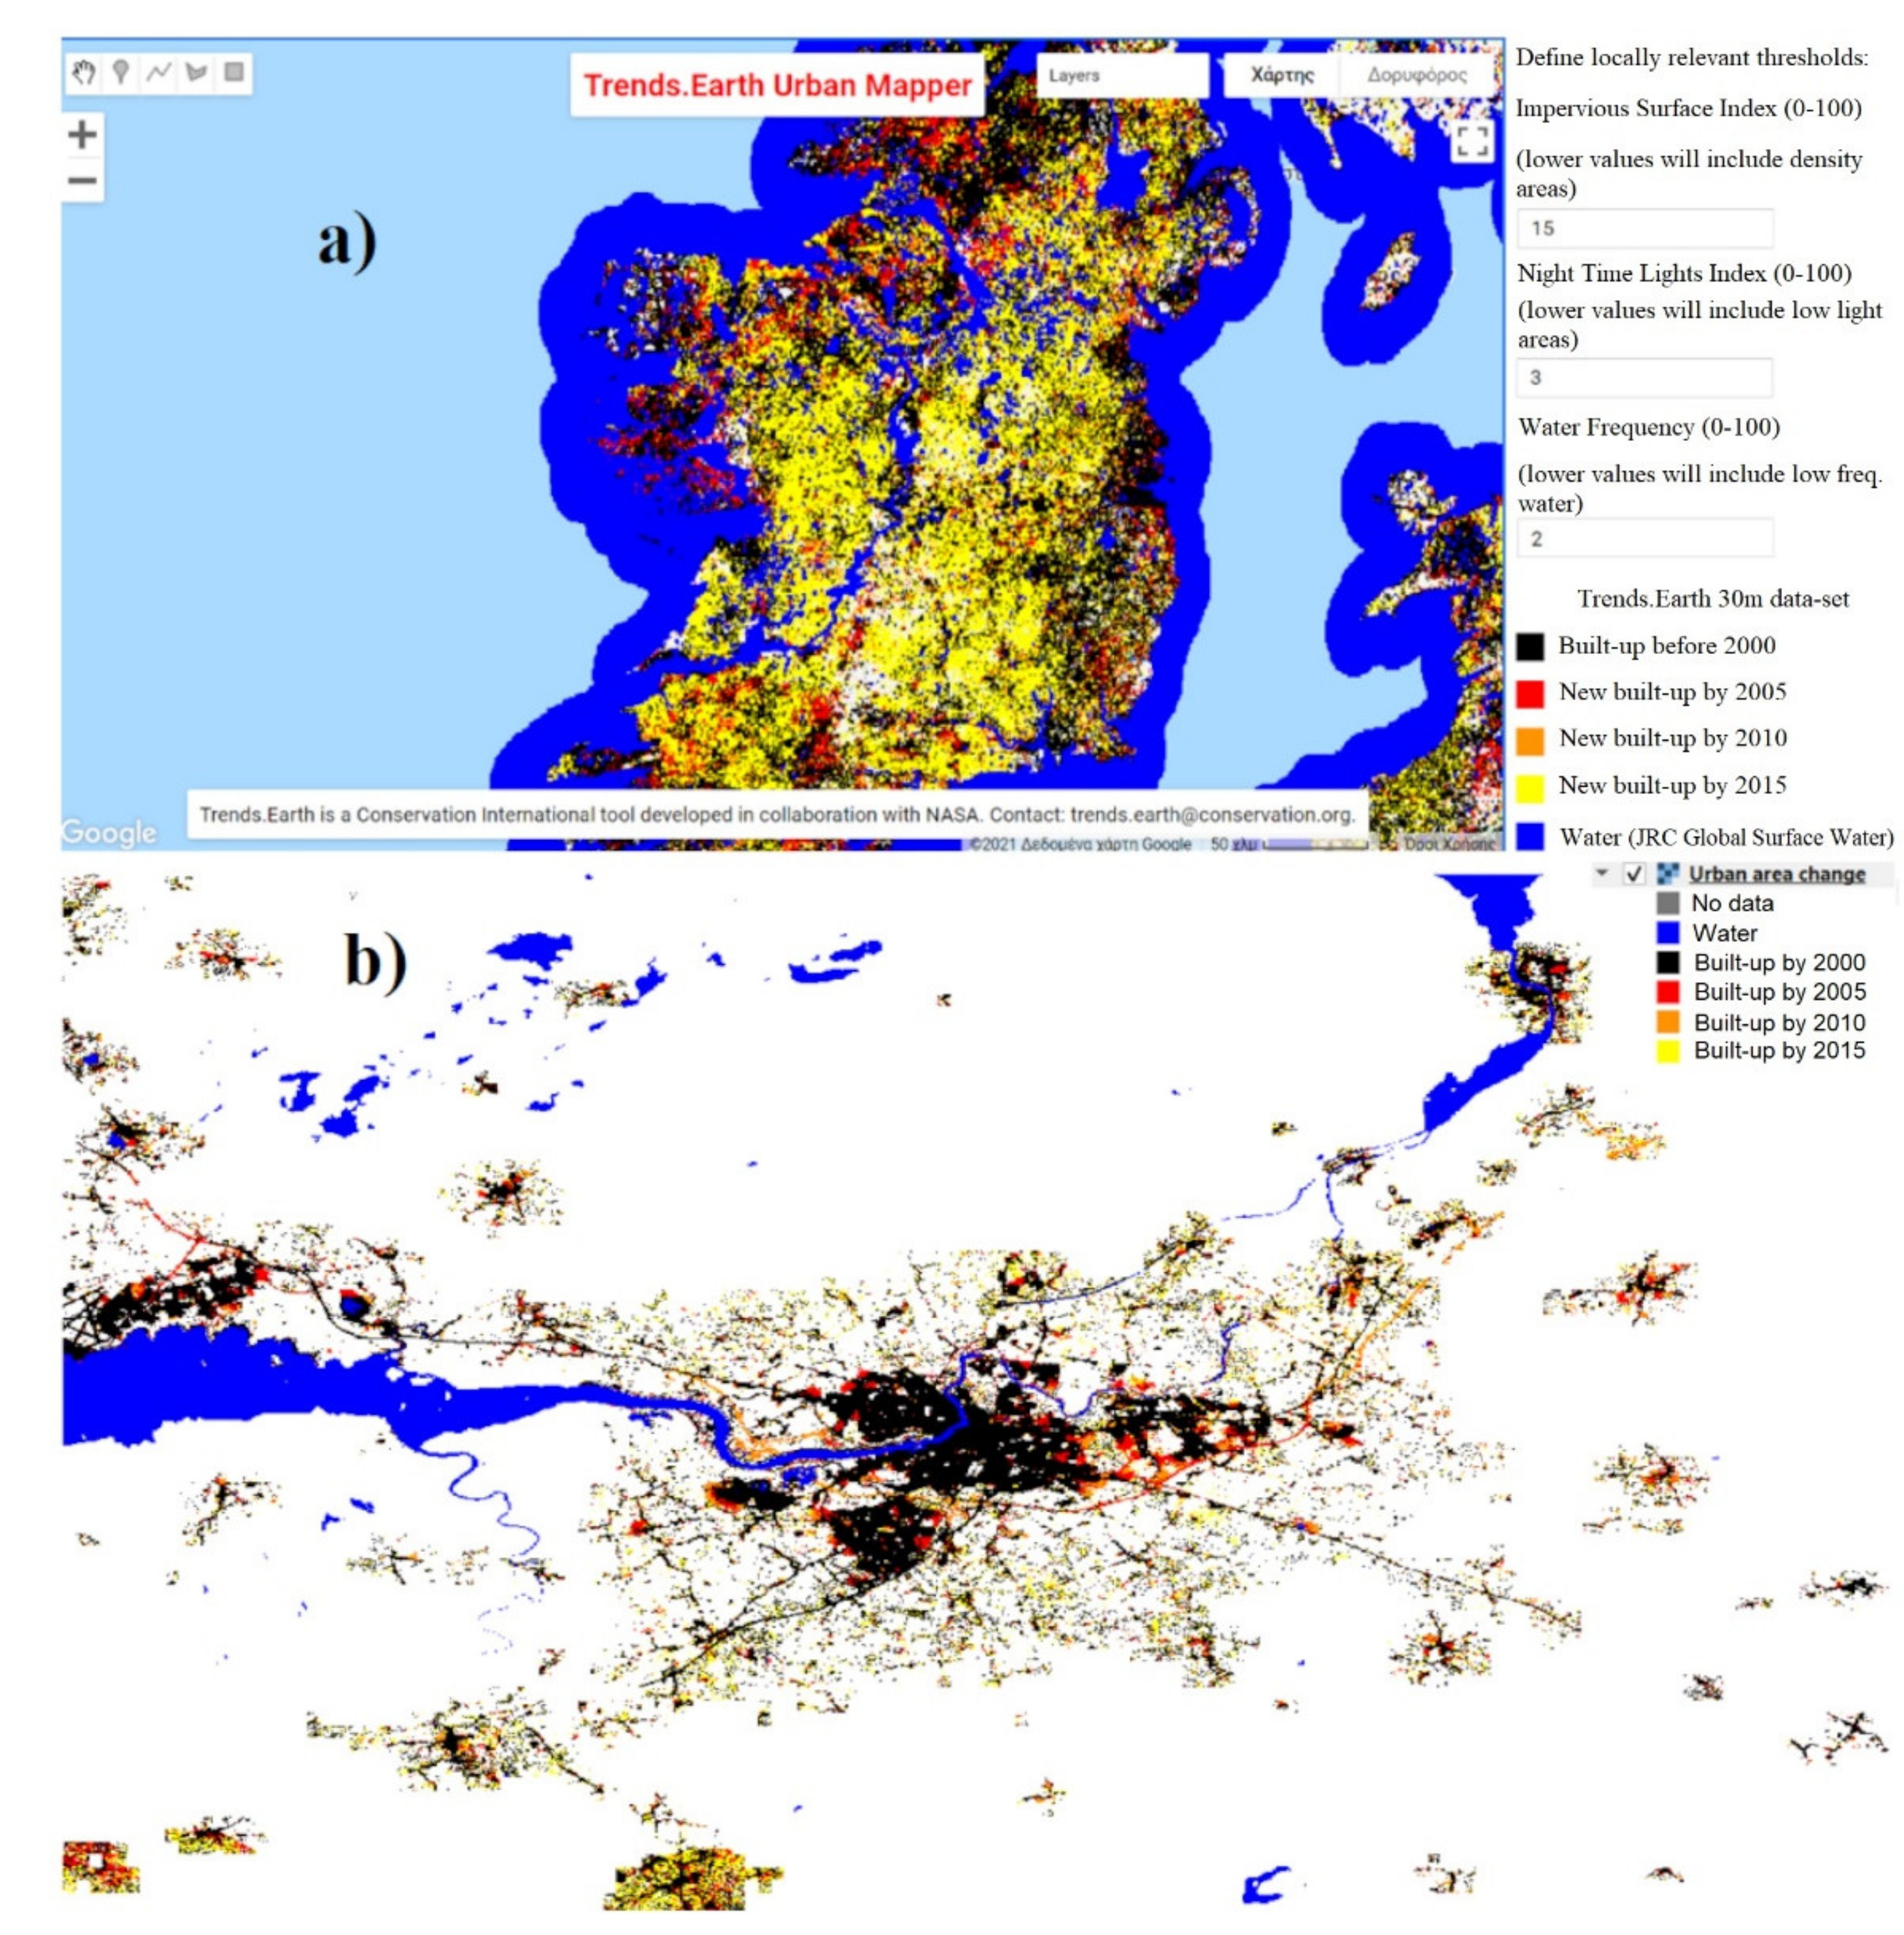
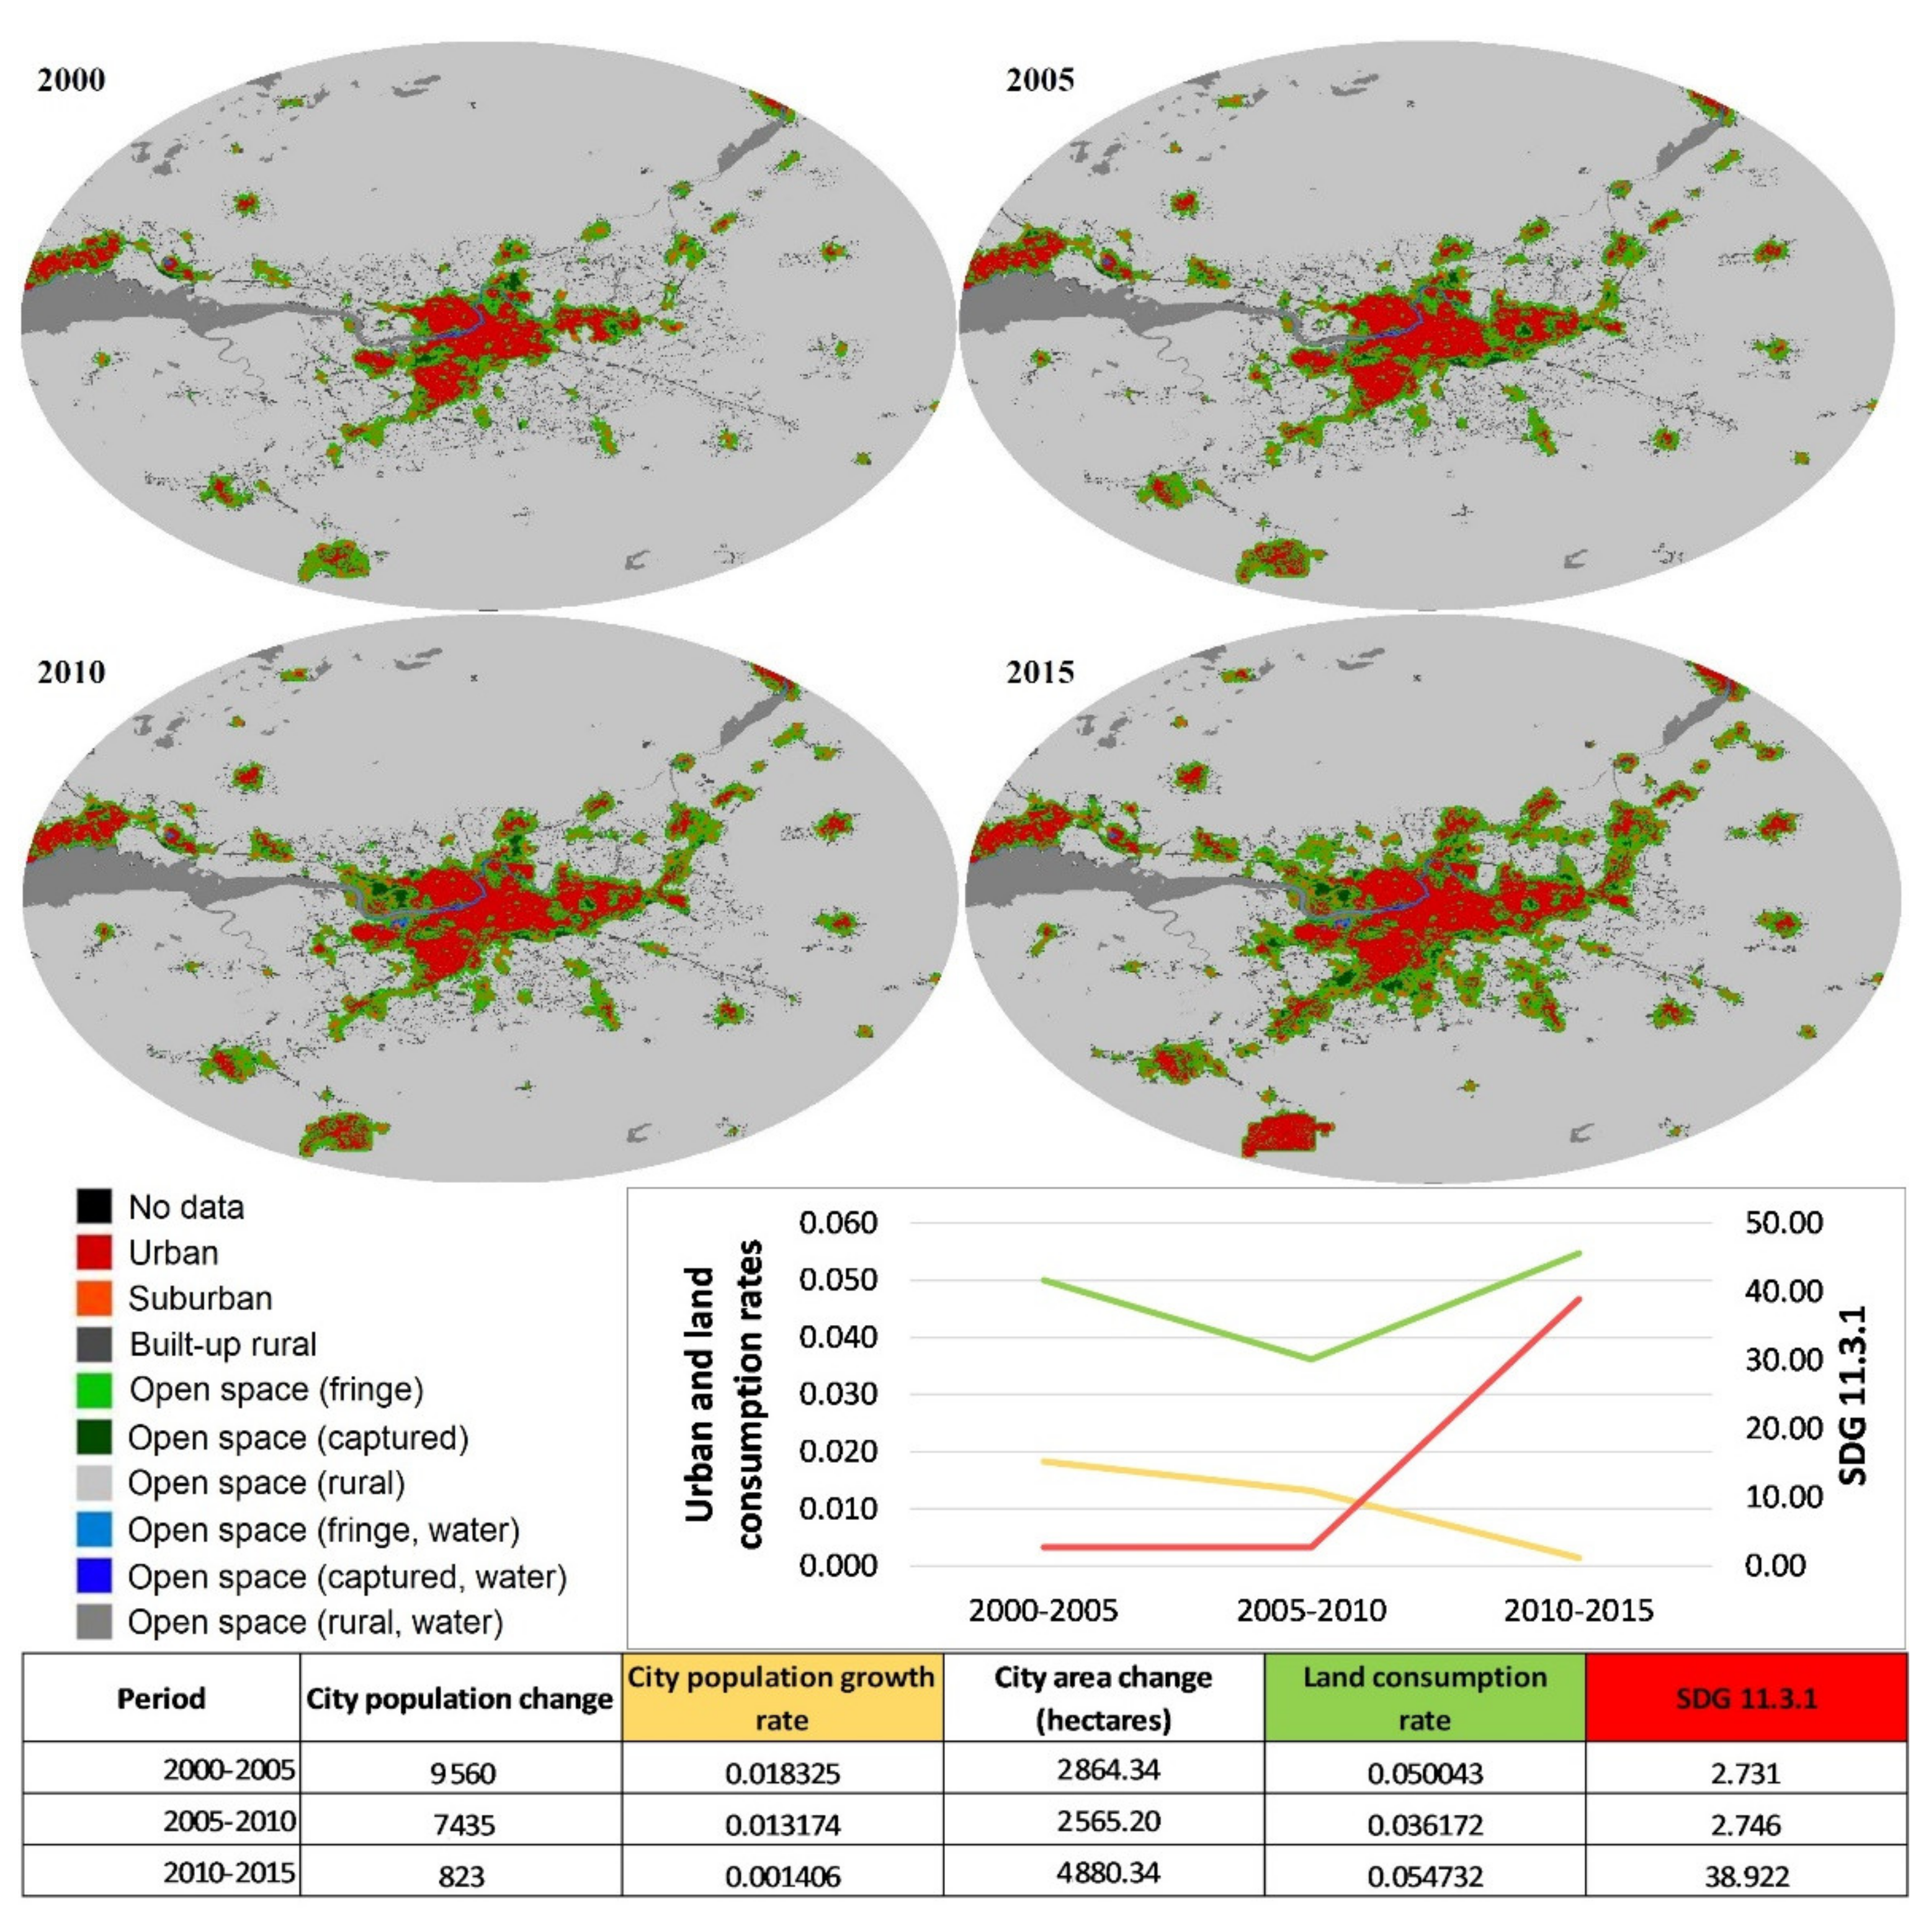
  • SDG 11: Sustainable Cities and Communities, refers to inclusive, safe, resilient and sustainable cities and human settlements. In the same way as living organisms, cities evolve, transform, adapt, innovate and change with emerging trends.
    Target 11.3: By 2030, enhance inclusive and sustainable urbanization and capacities for participatory, integrated and sustainable human settlement planning and management in all countries.
    Indicator 11.3.1: rate at which cities are expanding spatially versus the rate their population is growing. It aims to understand urban transition dynamics, enhance the study of the speed of growth for different settlements, the direction and type of growth. Understanding growth can help estimate demand for services, direct investments; support development of policies for sustainable urbanisation; support vulnerability assessment and disaster preparedness/response.

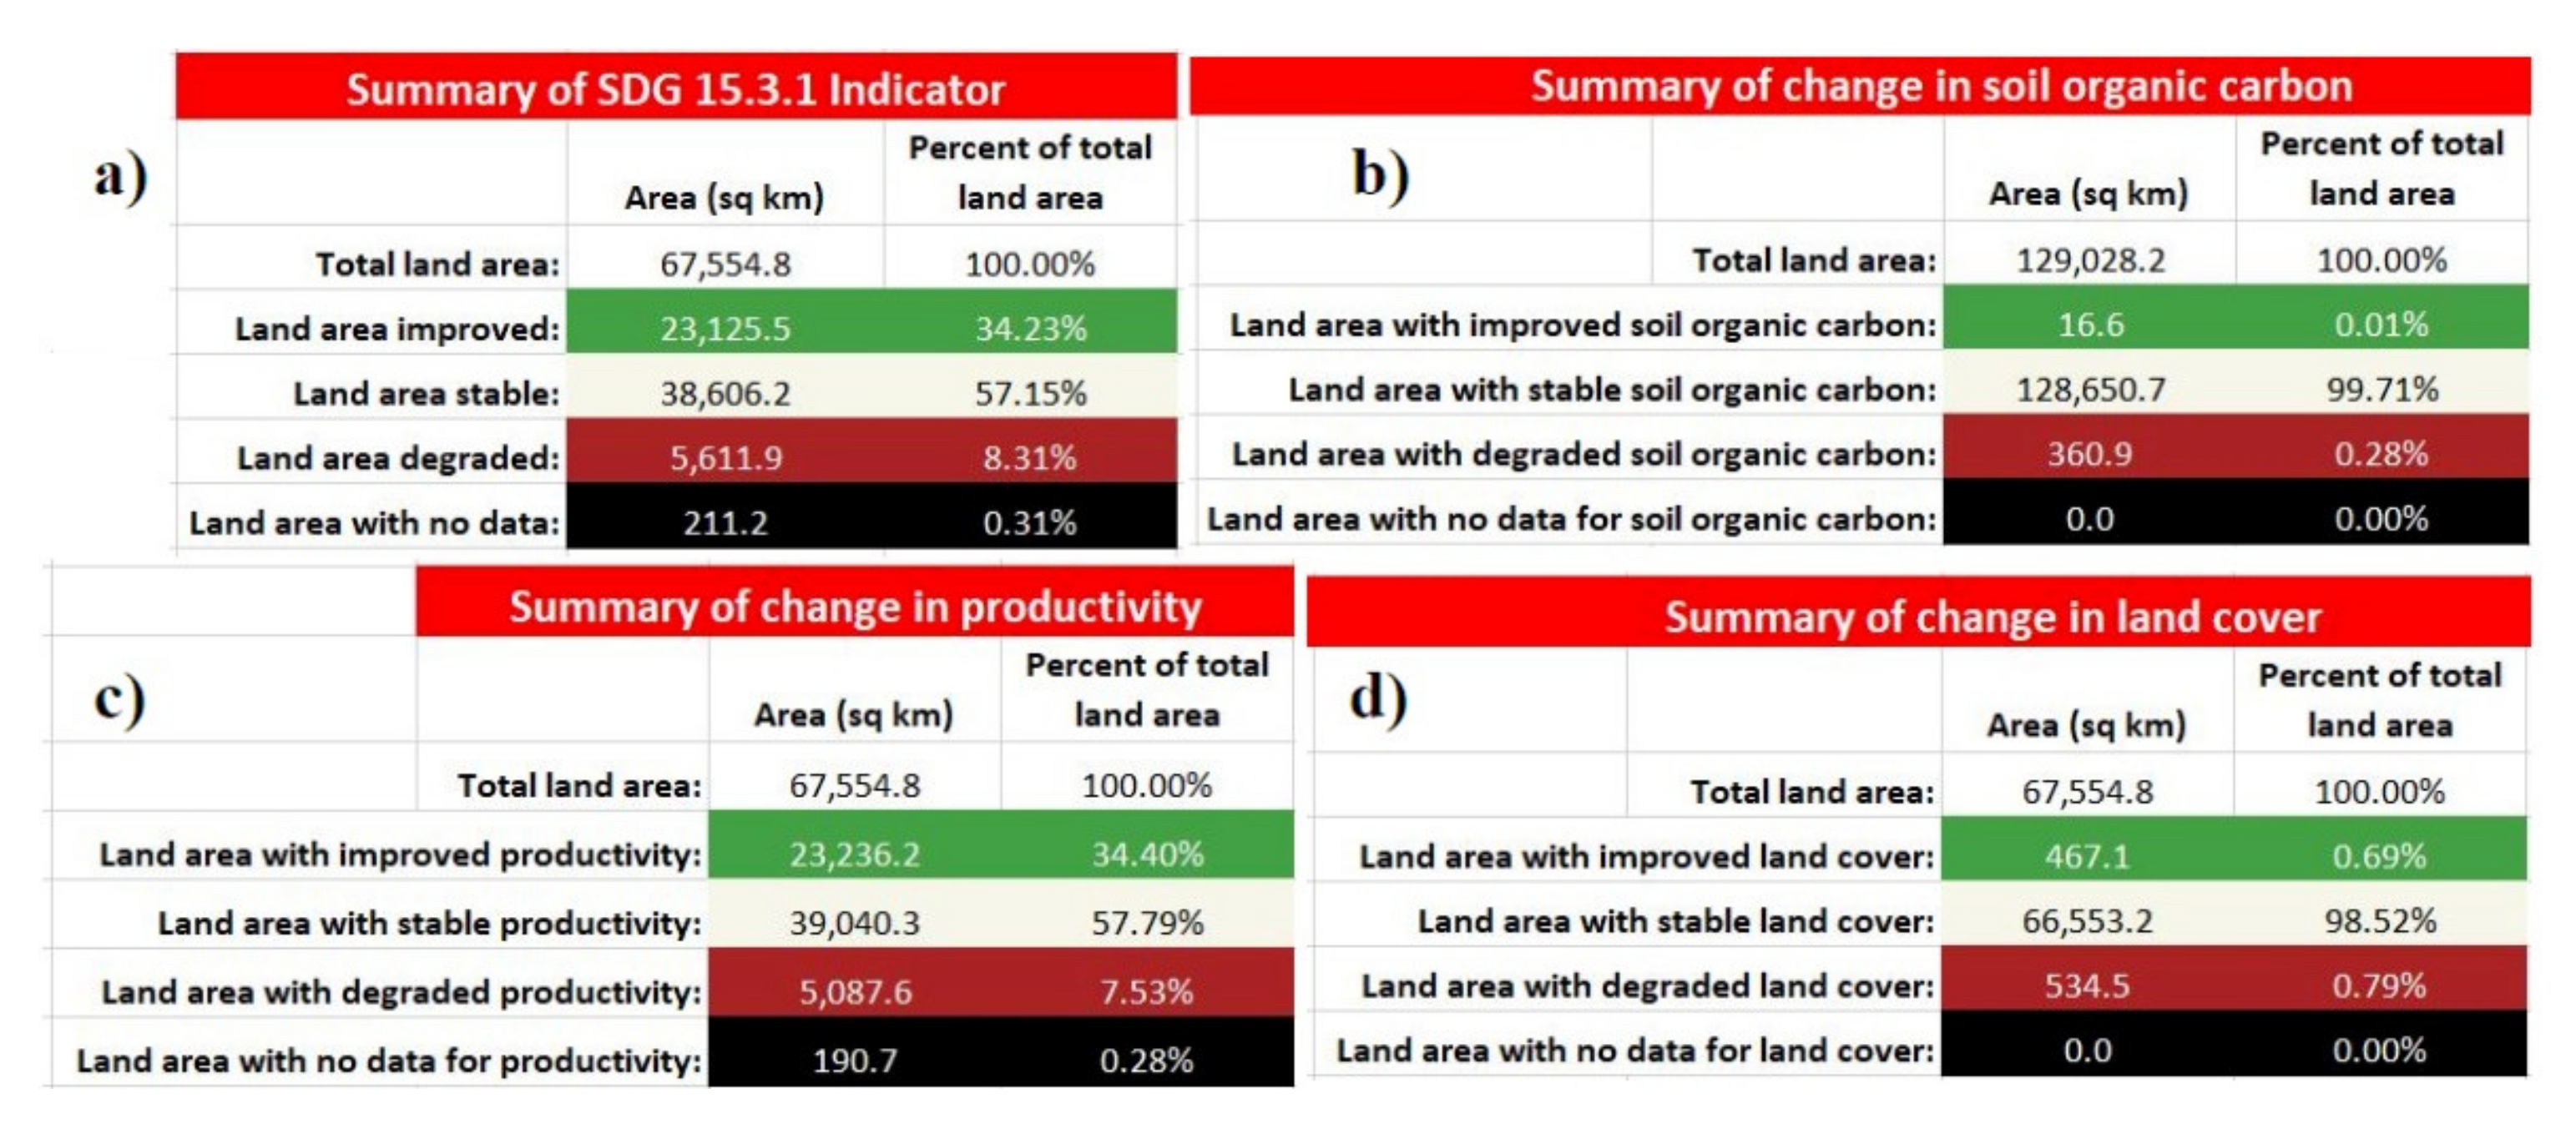
2.2. Indicator 15.3.1

SDG15.3.1 is the proportion of land that is degraded over total land area. It involves land cover and land cover change, land productivity and carbon stocks above and below ground. A combination of satellite Earth observations and site-based data were used to (a) set baselines to determine the initial status of the sub-indicators; (b) detect change in each of the sub-indicators; (c) derive the indicator by determining what areas of change are considered land degradation. Its estimation requires three basic datasets: land cover (area), land productivity (Net Primary Productivity—NPP), and carbon stock (soil organic carbon—SOC). Metrics are used for each dataset to see if they were changed or not compared to the baseline conditions (satellite data), and then if the change was positive, negative or stable. Synthesizing them, the negative and stable conditions combinations refer to a degradation, so this portion compared to the total area is the indicator SDG15.3.1. More specifically, each one of the three datasets and the criterion for evaluating its change follows:
  • Land Productivity: Τhe biological productive capacity of the land, the source of all the food, fiber and fuel that sustains humans. It is assessed through the NPP.
    NPP is the net amount of carbon assimilated after photosynthesis and autotrophic respiration over a given period of time and is typically represented in units such as kg/ha/yr [21]. In satellite imagery, NPP is assessed by the NDVI (Net Difference of Vegetation Index), which is estimated as the ratio of the “green-reflection” (healthy—higher NDVI) vegetation to the “red- reflection” (stressed—lower NDVI) vegetation. These increases or decreases in the NDVI is the metric used to evaluate the land productivity changes over time [22].
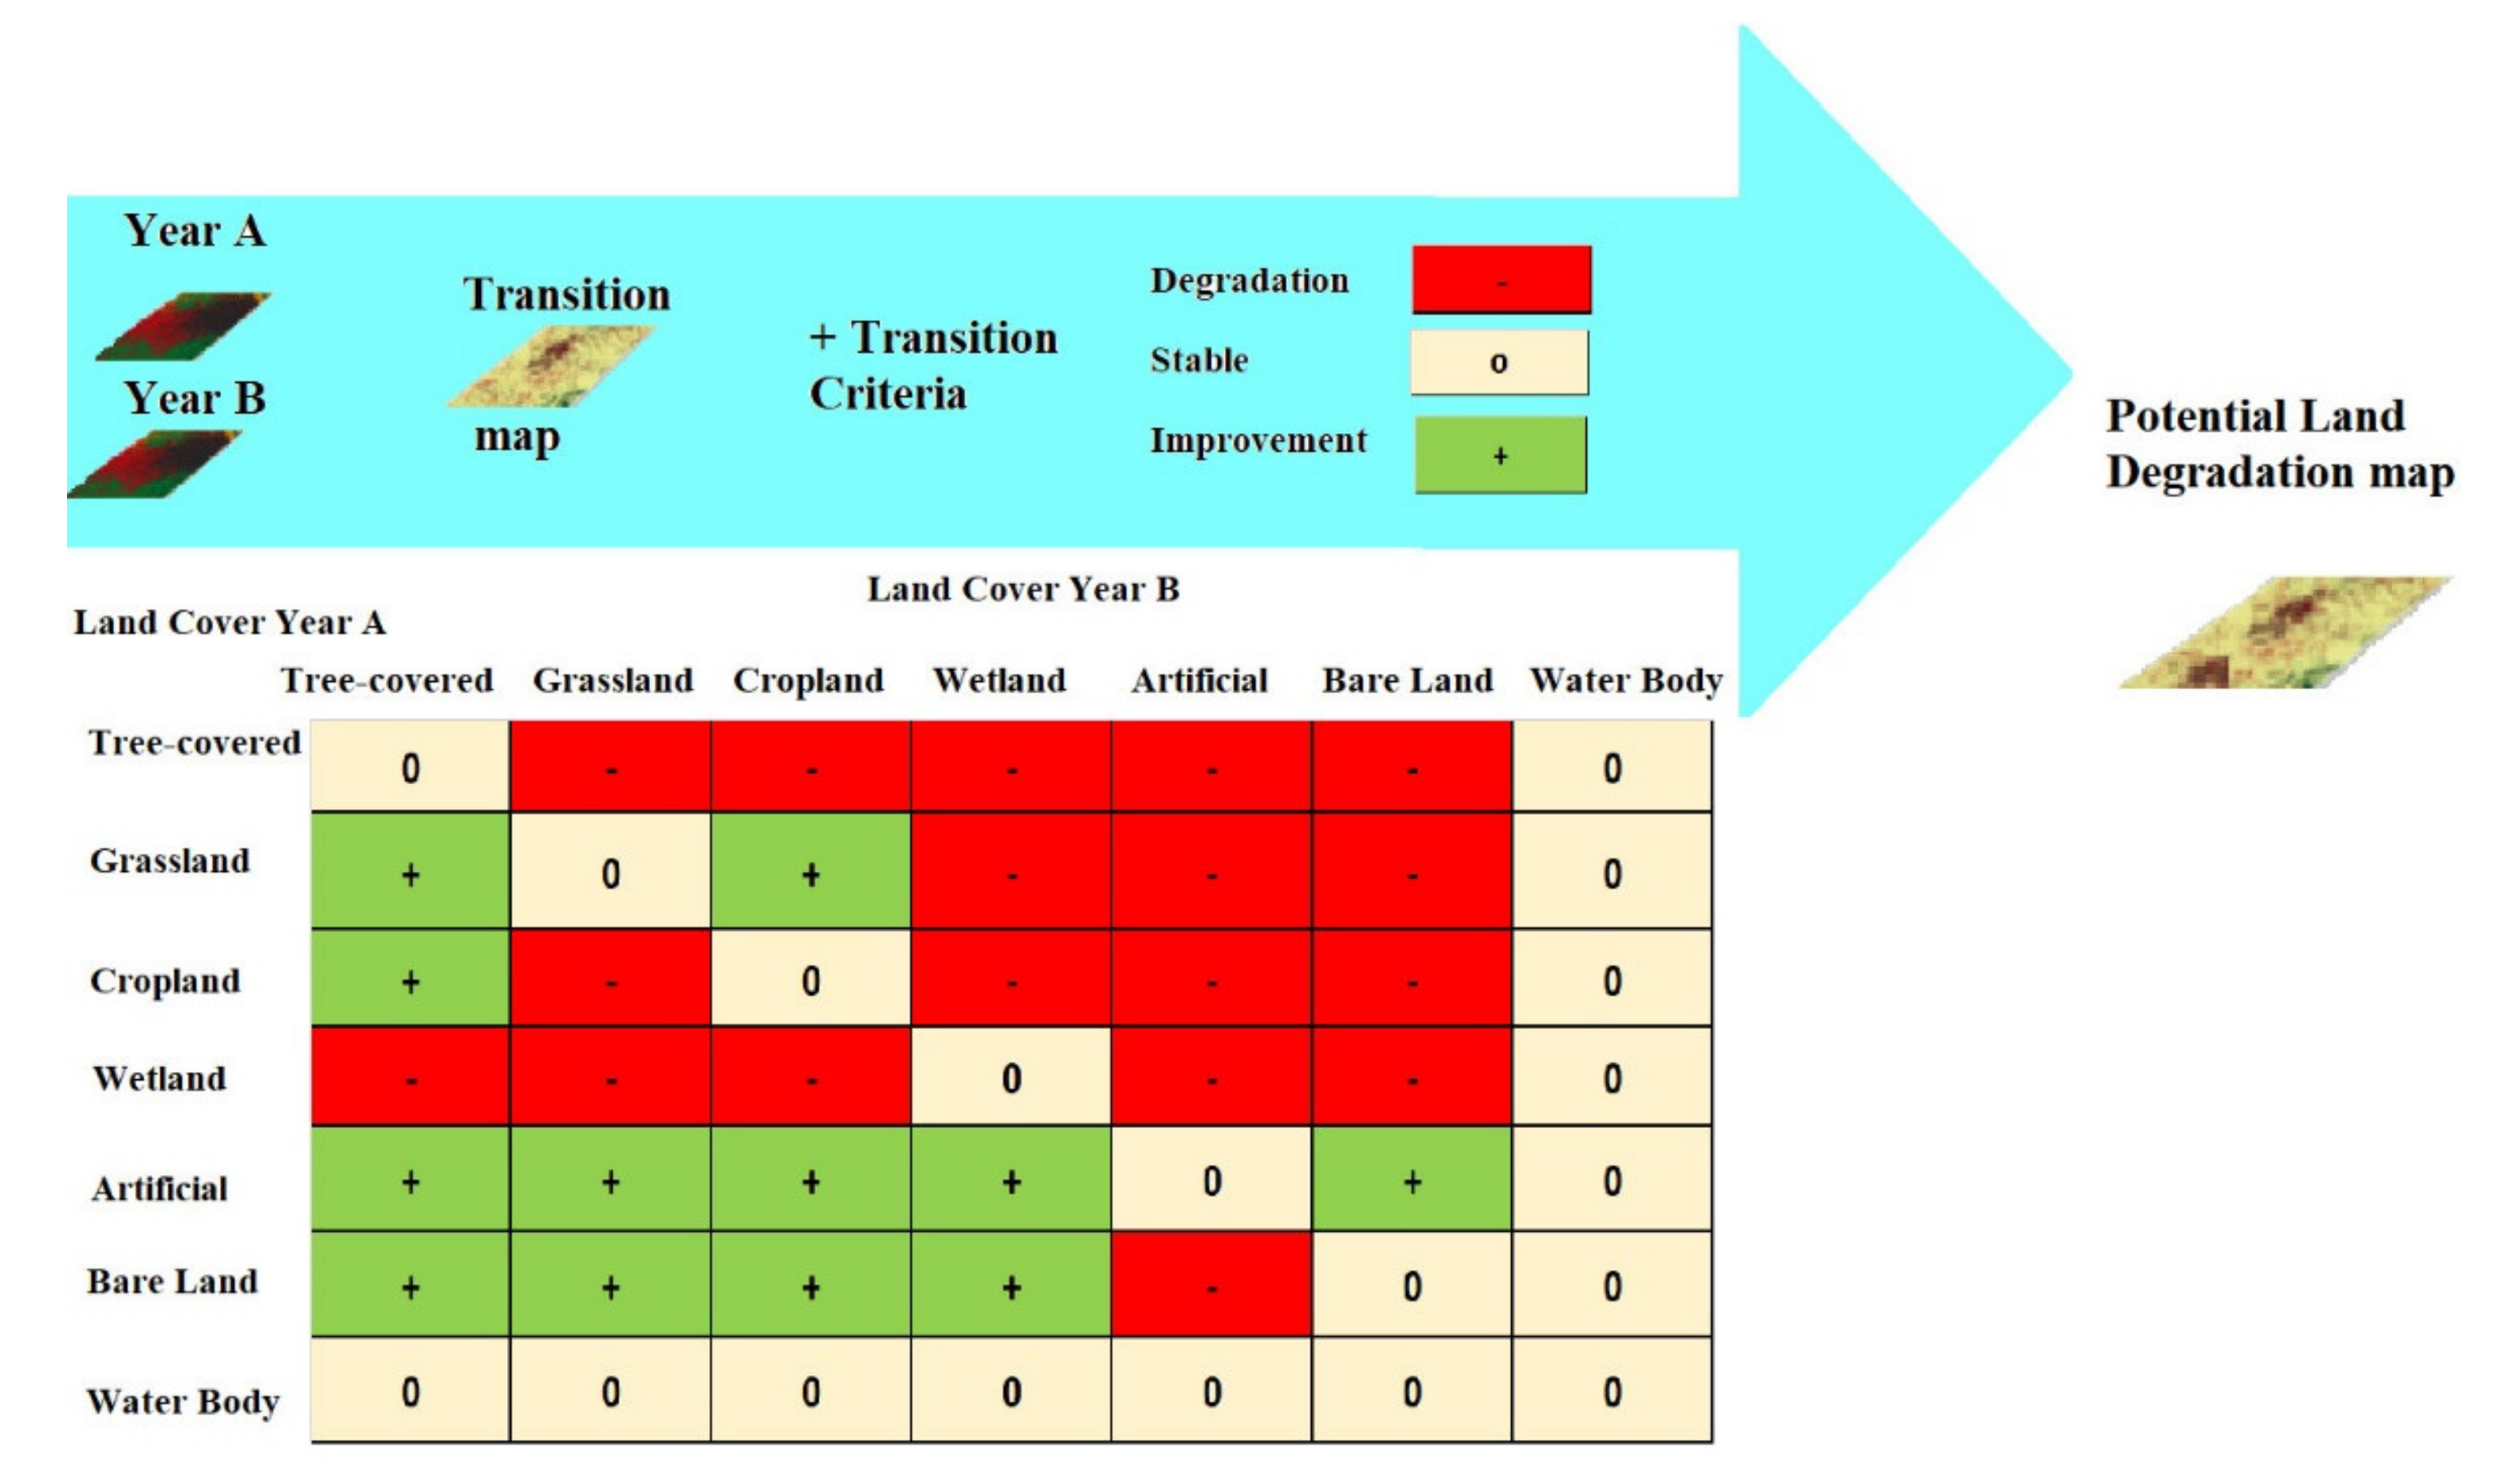
  • Land Cover Change: This describes changes in the observed biophysical character of the earth’s surface to help identify areas that may be subject to change. A transition from one land cover type to another may be considered an improvement, a neutral change or degradation, depending on the perspective of the country in question. The procedure followed was to use satellite data from different years, estimate the changes and, according to the transition criteria (Figure 1), estimate the potential land degradation map. This takes into account the various land cover types and assigns a positive, negative or neutral state for each possible change (this is the evaluation metric).
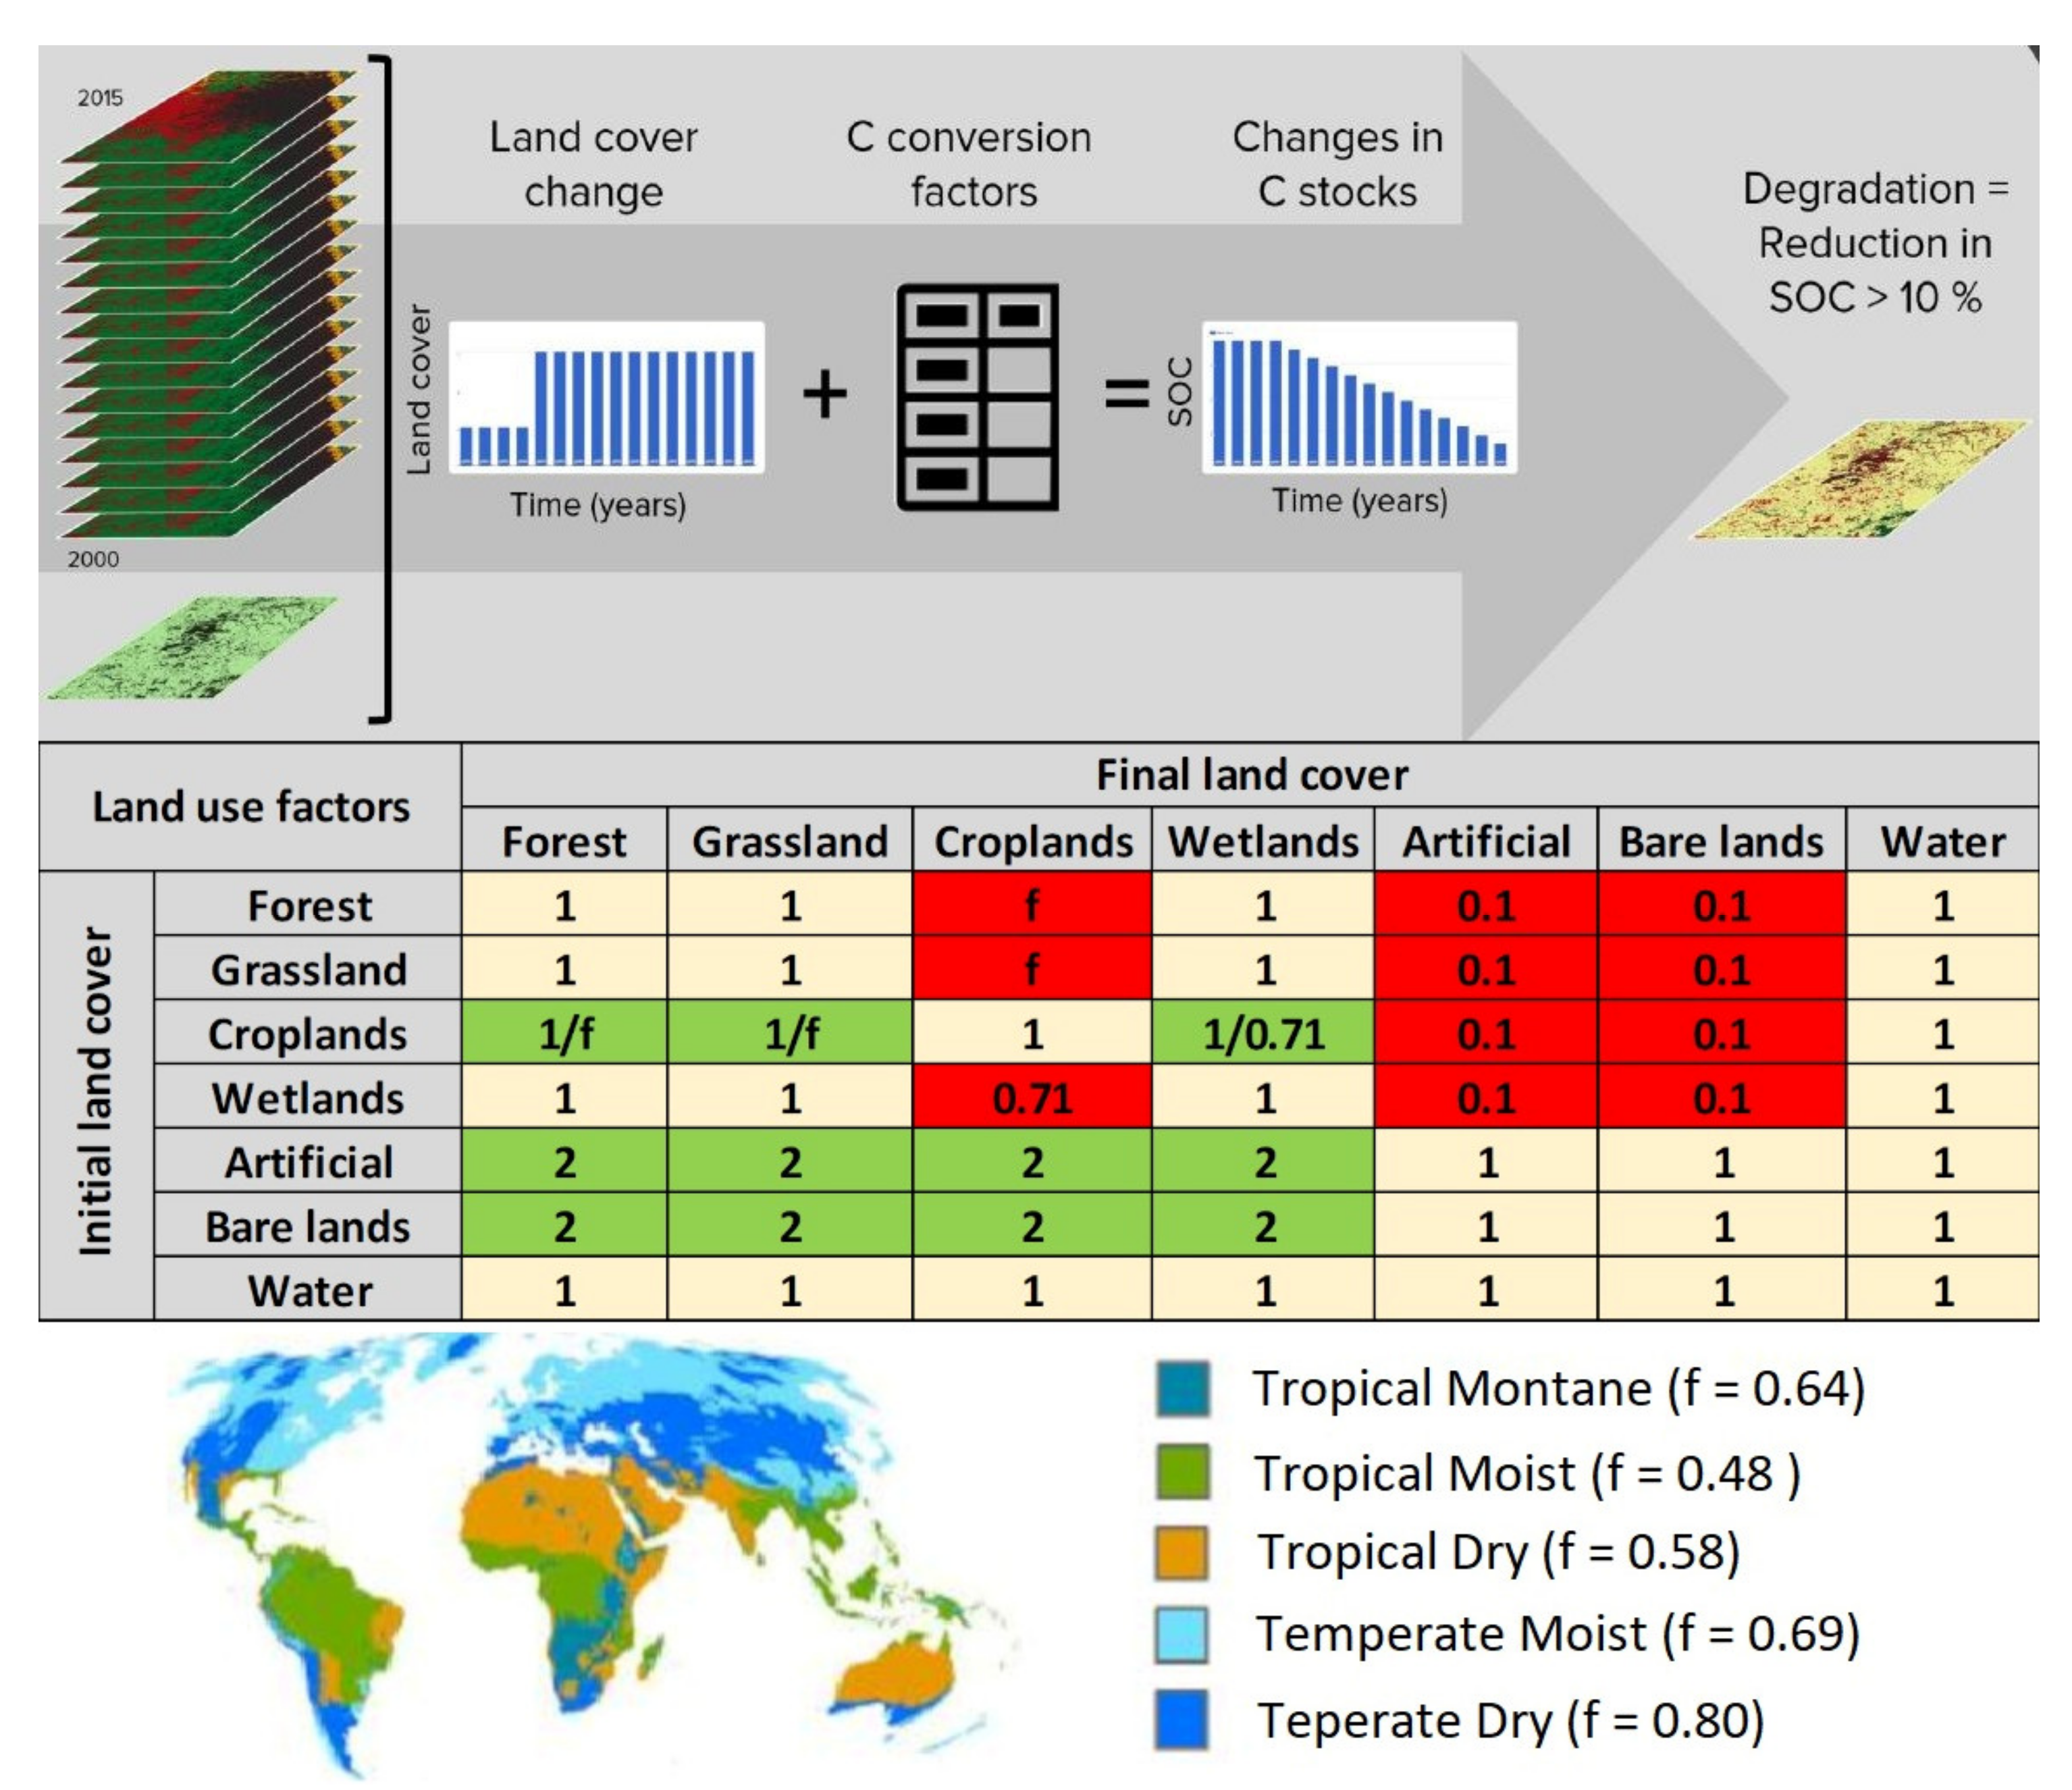
  • Carbon Stocks: Above and Below Ground Carbon (Soil Organic C)
    Carbon stocks reflect the integration of multiple processes affecting plant growth and the gains and losses from terrestrial organic matter pools. The metric used to assess carbon stocks adopted for Indicator 15.3.1 is soil organic carbon (SOC). For this, an initial measure of SOC and a time series of land cover change are needed. The data from a time series of land cover for the selected area were used to estimate the land cover change over the examined time period. The change in SOC stocks compared to the initial baseline value was estimated using the conversion factors of Figure 2 (Table), which evaluate the land cover changes in terms of C stock change. With the use of remote sensing data these calculations are performed for each pixel of the map of the area of interest. Reduction of SOC greater than 10% indicates a degradation.
In this routine, the SOC is estimated as follows (Equation (1))
S O C f i n a l = S O C r e f × F L U
where FLU is the land use factor that reflects carbon stock changes associated with type of land use.
The final estimation of SDG15.3.1 was achieved by synthesising the changes in land productivity, land cover and SOC, using a “one-out-all-out” principle. This means that if there is a degradation to just one of these sub-indicators, then the overall indicator 15.3.1 is considered to be in decline (Table 1). In the geospatial software, these estimations are translated into a different signal, e.g., green–red pixels in the map.

2.3. Indicator 11.3.1

SDG 11.3.1. This target has many aspects but portions of the indicator 11.3.1 can be monitored via remote sensing.
The measurement of the indicator 11.3.1 is achieved by the rate at which cities are expanding spatially versus the rate their population is growing. Landsat data can be used to determine the “built-up area” over multiple years. The satellite images can provide the necessary information regarding impervious index, built-up area, city extent and population, using a 5 year measurement interval. Thus, the estimation of SDG11.3.1 requires the following three parameters:
population growth rate
P R G = l n P o p t + 5 P o p t y
land use consumption rate
L C R = l n U r b t + 5 U r b t y
SDG 11.3.1
L C R / P G R = A n n u a l   L C R A n n u a l   P G R
where Pop indicates the population in different time steps (t, t + 5), for a given year period (y). The urban extent is denoted by Urb.
The estimates are not continuous but a single “point” at a given 5 year period (t, t + 5) is obtained, e.g., SDG11.3.1 for 2000–2005, or SDG11.3.1 for 2005–2010, 2010–2015, etc.
Initially, satellite images are used to define the built-up environment, depending on the perviousness (e.g., imperviousness indicates built-up). Τhen, the user inputs the customised study area, a city or urban area of interest. Three parameters influence how a map of the built-up area is produced from the map of impervious surface index: (a) impervious surface index (ISI): higher values reduce built-up areas; (b) night-time lights index (NTLI): higher values mean darker areas are excluded from built-up; (c) water frequency: higher values allow areas with more frequent occurrence of water to be included in the built-up area. Built-up density is classified within a 500 m radius: urban for >50%, suburban for 25–50%, and rural for <25%. Next, the built-up area and the city extent are identified and combined with the global population data [23], Equations (2)–(4) can be estimated. The final output is the summary maps and tables for the indicator SDG 11.3.1. Further details on these data can be found in [24,25].

2.4. Tools and Data

A freely available plugin to the open-source software QGIS, Trends.Earth, was used for the above estimations. This tool was created by Conservation International (CI) in partnership with Lund University, NASA, and with the support of the Global Environment Facility (GEF) as a decision support tool for SDGs’ reporting [22]. Trends.Earth can be used to plot time series of key spatially explicit (sub)indicators of land change (including degradation and improvement) and to produce maps and other graphics that can support monitoring and project implementation to address land degradation. The tool can also, potentially, be used to overlay other relevant and spatially explicit indicators. It uses NASA Earth Observations [26] to track land degradation and urban development; it provides an ‘urban extent series’ with population growth data from the “Gridded Population of the World V4”. Thus, a combination of satellite Earth observations and site-based data were used to set baselines to determine the initial status of the sub-indicators, detect their changes and estimate them.
Satellite data and remote sensing in Ireland have been applied so far for forest cover estimation [27], for assessing the potential for groundwater discharge to lakes [28,29], assessing the urbanisation effects on rainfall-runoff [30], and for modelling managed grassland biomass estimation (local, farm scale) [31]. Additionally, there are applications on geology and glaciation studies [32], stratiform warm clouds in marine and continental air monitoring [33], and surface water [34]. However, to our knowledge, this is the first application for SDGs’ estimation. The use of satellite data and publicly available statistics is an advantage in cases of limited data. Another advantage is the statistical database-building opportunities that the implementation of the SDGs requires [6]. A coordinated and integrated statistical system is required to enable their measurement at the national and subnational levels. In Ireland, an online SDG platform [35] was developed to provide comprehensive and accessible information on the SDGs; how Ireland is responding to them (e.g., key priorities, relevant policies, national reports, etc.) and news regarding SDG-related events taking place at the global, national and local levels. SDGs11.3.1 and 15.3.1 are not reported in national or international databases, and still, no data sources are provided (Figure 3) [36].
The Central Statistical Office (CSO) has direct responsibility for sourcing, developing and quality assuring the data for the Irish SDG Indicator set. To date, data for 211 Indicators, (86% of the total), have been sourced, of which some have a more detailed geospatial reference, either administrative County or Electoral Division [37]. A major step towards open databases and transparency is the CSO’s initiative to release online data on the UN Indicators, including an annual report, which will inform DCCAE’s (Department of Communications, Climate Action & Environment) Irish SDG Voluntary National Report (VNR). The IISDG has also provided tutorials in the use of open-source programming languages, R and Python, for the visualisation of SDG Indicators from CSO’s PxWeb Platform, StatBank [38]. However, the available StatBank tables and shapefiles refer mainly to demographic factors, some are available only at country or county scales, and SDGs11 and 15 were absent, hence, currently not allowing a complete analysis–estimation of the indicators mentioned. In this study, the StatBank data were used, where available, to cross-check and validate the used satellite data from Trends.Earth.

2.5. Towards the Integration of Database Capacity into Applicable Models and Tools

Urbanisation, urban pollution and runoff from different land uses (SDGs 15.3.1, 11.3.1) are stressing both water quantity and quality [39], which majorly defines SDG 6 “clear water and sanitation”. For the purposes of this study, the results of the estimated indicators are examined under the prism of the water issues, to provide a simple and understandable example for the paper’s point on a more spherical consideration and interpretation of the SDG indicators. Although the estimation of SDG15.3.1 is used at a country scale, SDG11.3.1 requires big data and computational power, and was therefore examined on a city-scale. Limerick was chosen for that purpose; the reason being that Limerick combines a fast population growth and potential water stress conditions. Limerick is located in the Mid-West region, covering an area of 59.2 km2. According to the 2016 census, the city has a population of 94,192 and, with the suburbs, it reaches around 105,000. It is the third most populous urban area in the state and the fourth most populous city on the island of Ireland. It has observed lower rainfall, higher temperature and higher water consumption per household (and per person) than the country’s averages [40]. As mentioned, the aim of this analysis is to highlight the importance of studying different outputs and indicators in a broader human–environmental system, ensuring the development of all factors together and not at the expense of others that may not be monitored.
In addition to the advantages and the potential of the remote sensing and statistical datasets regarding the ability to work when other data are not available, they are supporting the integrated character of databases (record keeping and validating) that will enable systemic monitoring–modelling approaches using the numerous solutions and tools available. In the context of integrated and sustainable environmental management and resilience, the National Water Forum of Ireland (An Fóram Uisce—AFU) [41] proposed the FILLM (Framework for Integrated Land and Landscape Management) [42,43]. (AFU was established in June 2018. It is the only statutory body representative of all stakeholders with an interest in the optimal management of Ireland’s water bodies/catchments (26 members/representatives from all organisations, levels and disciplines, and staff providing scientific support). AFU is required to advise the Minister on policy having regard to, among other things, water quality and conservation, domestic, marine and rural water services, optimum implementation of the National legislation and compliance with the EU legislation). The FILLM suggests a whole of environment approach (soil, water, land uses, air, climate, etc.) with stakeholder analysis and engagement, all supported from scientific excellence and education. It relates to several SDG indicators, e.g., on water (SDG6), urban (SDG11) and land use (SDG15), etc. Here, the FILLM and the expanded picture of such integrated approaches is briefly presented and discussed as a way to facilitate the environmental, socio-economic, demographic–behavioural and policy aspects towards more balanced planning.

3. Results

3.1. SDG15.3.1

The methodology described above was applied, as was the data regarding land productivity, land cover degradation, SOC degradation and the changes based on the criteria tables (indicating improvement, decline, stable, no data states). The inputs are shown in Figure 4a and the output map in Figure 4b, while Figure 5 provides further information and detail on the outputs. The output is the estimated SDG15.3.1 indicator, spatially showing the improvement, stable, degradation and no data states of land.
The tool can produce diagrams with the MODIS NDVI degradation over the years for the entire study area or for a specific pixel of the map. In the case of Ireland, the results indicate an improvement, not degradation (around 34% overall). The table in Figure 5 shows the overall changes and the summaries of the sub-indicators estimated. More detailed tables are produced with the specific land uses and changes in SOC, productivity, areas, etc. per land use, per year, allowing us to see how exactly these changes were made.
The summaries show that around 34% of land has improved over the examined period (2001–2018), according to the criteria of Table 1, for the estimation of the SDG15.3.1 as provided by the Trends.Earth tool. This happens mainly due to the increased productivity (estimated according to the NDVI as mentioned), as the land cover has been mostly stable and SOC may not have been degraded more than 10%.
According to the Irish SDG National Plan [8], regarding SDG 15 “Life on land”, “the only indicator that we can comment on over time for this SDG is the share of land under forestry. Some improvement is evident—there has been steady growth in the proportion of land covered by forestry. However, it remains very low by European standards with only 10.5% of land under forestry, implying there is considerable scope for improvement”. The official platform in Ireland to monitor SDG data and progress [35] reports just a high-level description of Targets 15.1 and 15.3 (mentioning their goal), while for the indicator 15.3.1 it reports “no results”. Thus, this work provides a method and an estimation of this indicator for the first time in the country and showcases a way to start monitoring more factors and indicators using free remote sensing datasets.

3.2. Indicator SDG11.3.1

This indicator expresses the ratio of land consumption rate to population growth rate. For the estimation of SDG11.3.1, the information on the built-up environment is readily available—the process is pre-computed from 2.3M Landsat scenes using different images and Trends.Earth applies random forest regression trees to estimate the impervious index maps.
The data in Figure 6a shows that most Irish built-up areas were developed after 2015 following the recovery from the bank crisis. In the case of Limerick, this development covers mostly the cities’ suburbs. The other input data for the analysis refers to the selection of a satisfactory scale and classification for the area of interest regarding the Impervious surface index (ISI), night-time lights index (NTLI), and water frequency. These values were set to ten, five and two, respectively, as satisfactory values to address the studied changes, providing an imagery of 30 m showing the built-up areas before 2000, by 2005, and the newer ones by 2010 and 2015, as well as the water bodies (five classes) (Figure 6).
The results refer to the urban area extent and types, population and land change rate, also available in tables per category and per year (Figure 7). Additionally, more detailed tables can be produced by Trends.Earth, regarding the specific areas, population and change over the years and per land class.
The maps in Figure 7 show the expansion of Limerick city and its suburbs, in particular for the urban class, followed by the suburban.
In Figure 7, the trends of the city population growth rate (yellow), the land consumption rate (green) and SDG11.3.1 (red) are shown in the Table and the diagram over the examined time period. The population increment is accompanied by a respective expansion of the city’s area, with an almost stable land consumption rate, which results in a “sustainable” evolution of the 11.3.1 indicator.
The Irish SDG National Plan [8] refers to SDG11 as a goal on progress “towards meeting its sustainable development objectives”. The data are more focused on the air pollution in urban areas after 2010, while there are no mentions of SDG11.3.1. In the official online SDG platform [35], the SDG11.3.1 is described (ratio of land consumption rate to population growth rate); however, its type is “not sourced”. Therefore, again, the proposed method and estimation could be helpful and novel for the country.

3.3. Towards an Integrated Approach

The results of both indicators, SDG15.3.1 and SDG11.3.1, showed an improvement. Practically, this means that: (a) there is no land degradation, rather there is improvement with respect to the overall land changes in Ireland; (b) the population growth rate of Limerick can be sustained by its observed land consumption. These could be seen as indicative examples for a comparison with the broader environmental context, and, in this work, the water bodies’ status and water services are presented as a simple example. The above results were compared with the overall picture of water resource management in order to check if the sustainable rural and urban development converges with environmental development. Water is chosen because it is a tangible environmental element with strong interconnections with land (rural) and urban changes, and with several other environmental components (e.g., soil, geosystems, air, atmosphere, etc.). Furthermore, there are known and generally acceptable issues on water, and facts that we can use here as arguments, supported both by academics and national reports, as explained below.
For the first finding on land use, the general situation in the country’s catchments can be the most acceptable comparison measure for water resources’ management. The River Basin Management Plan (RBMP) covers 46 catchment units (583 sub-catchments), with 4829 water bodies [45]. The RBMP’s assessment indicates the water deficits and quality deterioration for certain catchments and water bodies, finding land use changes and intensified agriculture as the major causes (accounting for more than 56% of the water bodies being below good status) [45]. The same findings have been reported for soil degradation, mainly from agricultural and forest land use [46,47,48]. The land cover changes as shown in SDG15.3.1 are strongly connected with the degradation of surface and groundwater quality [49,50], where agriculture is the main concern [51], while the EPA notes the need for alternative, more environmentally friendly agricultural practices [52].
On the other hand, the city of Limerick is projected to increase its population by 61% by 2040 [40,53]. Historically, according to Met Éireann’s data on climate change (for the period 1981–2010), Limerick has observed a rainfall decrease and increasing temperature [54]. Moreover, its daily water consumption per household (330 l/h/d) and per person (125 l/h/d) are increasing and are already higher than the country’s average [40]. The Irish Water Utility (Irish Water) still reports high leakage losses in Limerick (around 40–50%). Moreover, the negative impact of the suburb expansion on water quality is a general issue that has been observed in the country [55].
The situation in the broader catchment scale (relevant to the SDG15.3.1) and, specifically, for the studied case of Limerick (relevant to the SDG11.3.1), is contradictory to the improved and sustainable SDG indicators that are estimated. This indicates the necessity to move from the “narrowed” information provided by an indicator or a single metric referring to a specific discipline, to a “wider” picture of the environment or the system. As mentioned, towards that direction of integrated, sustainable environmental management and resilience, AFU adopted the FILLM [42,43] as a whole of environment approach (soil, water, land use, air, climate, etc.) with stakeholder analysis and engagement, all supported from scientific excellence and education. On that basis, several SDG indicators, e.g., on water and aquatic systems, urban and rural areas, industry and agricultural practices must be examined in their broader context. The detailed description of the FILLM concept and its technical aspects and tools can be found in [34,35], respectively. Thus, here we just outline its central ideas, which are to:
  • understand the environmental components (air, atmosphere, land, soil, water) and their interactions or cause–effect relations (becoming conscious);
  • model them with environmental and engineering models that will provide a detailed catchment characterisation, assess and optimise the different measures, and support the decision-making process;
  • provide scientific and committed stakeholder analysis (parallel process) with continuous feedback for the decision making (co-design common long-run visions) and measures’ implementation;
  • provide continuous progress tracking (inspection and re-feeding the described loop).
Part of the first bullet is the pressures on the various environmental components, hence the land use changes and urbanisation, as discussed above.

4. Discussion

This work proposed two indicative methodologies to estimate, respectively, two SGD indicators that have not been reported in Ireland so far. The methods, resources and tools are supported by NASA’s projects with an add-in of QGIS and Trends.Earth, which can work as a calculator for these SDG indicators, meaning reliability of the results can be ensured. In addition, the methods and tools are applicable globally, which is particularly useful as the considerations presented in this work are not unique to Ireland; many countries globally face issues of limited awareness on the SDGs, poor progress and data limitations [3,4,5,7].
Besides the novel elements in terms of freely-usable resources, software, calculation procedure and results interpretation within the broader environmental–systemic picture, there are certainly some limitations. These create space for future improvements, analysed below.
For the estimation of the indicator SDG15.3.1, remotely-sensed data of the vegetation index NDVI, land cover and productivity metrics were used. Although these are easily accessible and widely applied metrics, their use for monitoring production for SDGs’ assessment requires further development. A recent review [56], identified four areas of such monitoring methodologies that need to be improved; for example, the derivation of primary production from vegetation indices, their translation into goods and services, the baseline reference conditions to specify the productivity in the absence of anthropogenic degradation and distinguishing the anthropogenic causes of degradation from potentially similar effects of natural environmental processes. Such findings are further supported from the literature, with more studies doubting if the current use of certain indices is adequate to remotely sense ecosystem functions and services [12,56]. It will be important to examine this again in the future in the case of Ireland, with respect to the improvements estimated by SDG15.3.1, where land cover and SOC were actually stable. However, such a test can only be made with local scale data of finer resolution, which are currently not available. Another aspect, highly relevant to the land cover datasets improvement, is their validation [57]. Hakimdavar et al. [58] highlighted the challenging validation processes, especially for water-related indices. Fehri [59] used wetland mapping (lakes, rivers, estuaries, artificial water bodies, vegetated wetlands) as an example to emphasise the location-based data validation. The selection of validation data is a critical step to appraise map accuracy as it serves as a reference dataset and is deemed to be the “truth” for what is being mapped [60]. A combination of the remotely-sensed data, a location-based validation by users and data from Local Authorities is recommended. Such database-building processes are becoming increasingly achievable in many countries. In Ireland, a major step towards open databases, validation and transparency is the CSO’s (Central Statistical Office) initiative to release online data. The CSO has also provided tutorials in the use of open-source programming languages, R and Python, for retrieving and visualising data and shapefiles. Such databases could be helpful for demographic factors, relevant for statistical support and monitoring, e.g., for SDG11.3.1 [61], which must be further enhanced with local scale databases, monitored by Local Authorities [62]. Of course the suggested methods can be used and are encouraged to be used for data-scarce areas or areas where those parameters are not being monitored—poor record-keeping progress is the main cause for not reporting most SDG indicators. Thus, local database building is even more encouraged, as the Authorities and the stakeholders will start to understand their systems and be able to estimate various parameters (not only SDG related). Handling, working with and performing such applications is becoming more and more feasible with the recent technology and computer advances [63,64].
Overall, the qualitative analysis and the reality of the Irish context indicates the necessity to further consider its environment-related SDGs and associated policies. As mentioned, this is also a finding of the RBMPs, IW’s studies and plans, Met Éireann and academic research. Issues on water quality must be a priority, also recognised in the SDG National Plan [8]. The official results on SDG6 (availability and sustainable management of water and sanitation), target 6.4 (increase water-use efficiency) are reported by the indicators 6.4.1 and 6.4.2. These refer to “change in water-use efficiency over time” and “level of water stress—freshwater withdrawal as a proportion of available freshwater resources”, respectively. Both are under “Type: Not sourced”.
Of course, these elements can be improved in the future, together with the databases required and the tools used. However, it is very important to consider the current methods and results as a starting basis both for monitoring progress and for more integrated developmental–environmental approaches. The overall goal of future efforts should be to use the modern technological and multidisciplinary evolution under the prism of a more integrated environmental–systemic development approach.

5. Conclusions

In this work, the need to increase awareness, build data capacity, and overcome data limitations for Ireland’s sustainable development was described through the example of the SDGs. There is also a need to further support the environment-related SDGs, and progress with those tasks in a timely fashion. SDGs15.3.1 and 11.3.1 were estimated to showcase a remote sensing methodology to start monitoring and reporting on various parameters that are currently ignored. The use of free satellite data, and their mapping and analysis in free software was preferred to prove that these tasks are directly applicable in practice.
Furthermore, the interpretation of the results, that show improvement and “sustainability” in the growth and changes happening in urban and rural areas, can be misleading if not examined within the broader environmental context. Water quality, quantity, water services and broader environmental issues must be studied (as proposed with the FILLM concept). A whole of environment, and even better, a whole of systems approach is recommended, including environmental, social and economic systems and analyses. The spherical interpretation of indicators and metrics, etc., is essential and can play a huge role for more reasonable decision making and allocation of development investments. The need to proceed with careful and scientifically-supported knowledge will have significant benefits, especially in an era of technological advances and multidisciplinarity.
In the future, there is room for improving most of the aspects discussed, both as approaches and technically. Technical improvements on the quality and control of RS data, their connection to existing SDG indicators and the local database capacity are required, and several countries are already committed to these improvements. Researchers analyse ways, the technology provides the means to achieve these improvements, so achieving them will be up to the political will. The key to be on top of these advances is the right approach, as mentioned: multilevel and integrated. Increasing awareness from the public and decision makers, sensitisation on the environmental SDGs and the examination of as many factors as possible will lead to wiser and socially acceptable solutions. Such an approach is described under the principles of systemic theory, including the FILLM and its extended economic, social and behavioural sub-systems. At this point the combination of scientifically analysing these sub-systems is highlighted. The approach to the stakeholders must follow a two-way principle of “inform and being informed”. This can develop a suitable setting to unfold stakeholders’ perspectives, seeking to understand the challenges in a holistic manner, the benefits of participatory planning and the individual and group benefits of more reasonable management.
The above do not aim to criticise the SDGs as misleading; rather, we believe that they are useful measurement indices and, most importantly, provide an opportunity to increase database capacity, use new technologies and apply critical and multidisciplinary approaches.
Of course, such approaches are partially based on integrated environmental assessments but also rely on stakeholder engagement, and the importance of moving from opinion-based to knowledge-driven decision makers is recognised. This assumption is essential in order to avoid blindly-defended positions and cultivate the need of each individual to find optimal ways to reconsider and self-improve. The necessary scientific support in methodological terms (the “know-how”) guided by the necessary experience, must be ensured at every stage of the process. This process of moving to a more integrated, modern and multidisciplinary management through a stakeholder platform, scientifically supported, often reveals and addresses deeper shortcomings of the institutional frameworks, authoritarian behaviours of the State, misleading perceptions about natural resource management and the weakness of cooperation between stakeholder groups. Thus, many opportunities are created to strengthen and secure the future of sustainable development in multiple levels.

Author Contributions

Conceptualization, methodology, software, writing—original draft preparation: A.A.; writing—review and editing: S.L. All authors have read and agreed to the published version of the manuscript.

Funding

This research received no external funding.

Institutional Review Board Statement

Not applicable.

Informed Consent Statement

Not applicable.

Data Availability Statement

Data available in a publicly accessible repository that does not issue DOIs. Publicly available datasets were analysed in this study. This data can be found in the references: [22,23,26,41,44,53].

Acknowledgments

A.A. has been granted a Scholarship from the Centre of Natural Hazards and Disaster Science (CNDS) to attend and present an earlier version of this work at the 1st Socio-hydrology Conference (Delft, The Netherlands, 6–8 September 2021), entitled “Towards a unifying framework for balancing different SDGs and objectives, and achieving sustainability: new technologies, socio-hydrology, and multi-disciplinarity in data-scarce areas”.

Conflicts of Interest

The authors declare no conflict of interest.

References

  1. UN. A New Global Partnership: Eradicate Poverty and Transform Economies through Sustainable Development. 2013. Available online: https://sustainabledevelopment.un.org/index.php?page=view&type=400&nr=893&menu=35 (accessed on 10 July 2021).
  2. UN. Agenda 2030 ‘to-Do List for People and Planet’, Secretary-General Tells World Leaders Ahead of Adoption. UN Press Release. 2015. Available online: https://www.un.org/press/en/2015/sgsm17111.doc.htm (accessed on 10 July 2021).
  3. UN. Resolution Adopted by the General Assembly on 25 September 2015: 70/1 Transforming Our World: The 2030 Agenda for Sustainable Development. 2015. Available online: https://www.un.org/en/development/desa/population/migration/generalassembly/docs/globalcompact/A_RES_70_1_E.pdf (accessed on 10 July 2021).
  4. Schmieg, E. External Trade Policy and the Sustainable Development Goals. Implementing the SDGs Will Meet Justified Criticisms of Globalisation. SWP Comments 2017, 39, 5. [Google Scholar]
  5. Spangenberg, J.H. Hot Air or Comprehensive Progress? A Critical Assessment of the SDGs. Sustain. Dev. 2017, 25, 311–321. [Google Scholar] [CrossRef]
  6. MacFeely, S. Measuring the Sustainable Development Goals: What Does It Mean for Ireland? Administration 2017, 65, 41–71. [Google Scholar] [CrossRef] [Green Version]
  7. McGrath, L.; Hynes, S.; McHale, J. Linking Sustainable Development Assessment in Ireland and the European Union with Economic Theory. Econ. Soc. Rev. 2020, 51, 327–355. [Google Scholar]
  8. DCCAE (Department of Communications, Climate Action & Environment). The Sustainable Development Goals National Implementation Plan 2018–2020; DCCAE: Dublin, Ireland, 2020; p. 136.
  9. Social Justice Ireland Ireland Ranks 11th out of 15 EU Countries on UN Sustainable Development Goals|Social Justice Ireland. Available online: https://www.socialjustice.ie/content/policy-issues/ireland-ranks-11th-out-15-eu-countries-un-sustainable-development-goals (accessed on 5 June 2021).
  10. EPA. Charting Ireland’s Sustainable Future: Innovative Approaches towards Achieving the United Nations Sustainable Development Goals for Enterprises; SDGs and Enterprise: Dublin, Ireland, 2020; p. 113. [Google Scholar]
  11. Paganini, M.; Petiteville, I.; Ward, S.; Dyke, G.; Steventon, M.; Harry, J.; Kerblat, F. Satellite Earth Observations in Support of the Sustainable Development Goals: The CEOS Earth Observation Handbook; The Committee on Earth Observation Satellites and the European Space Agency: Paris, France, 2018. [Google Scholar]
  12. Giuliani, G.; Mazzetti, P.; Santoro, M.; Nativi, S.; Van Bemmelen, J.; Colangeli, G.; Lehmann, A. Knowledge Generation Using Satellite Earth Observations to Support Sustainable Development Goals (SDG): A Use Case on Land Degradation. Int. J. Appl. Earth Obs. Geoinf. 2020, 88, 102068. [Google Scholar] [CrossRef]
  13. Mulligan, M.; van Soesbergen, A.; Hole, D.G.; Brooks, T.M.; Burke, S.; Hutton, J. Mapping Nature’s Contribution to SDG 6 and Implications for Other SDGs at Policy Relevant Scales. Remote Sens. Environ. 2020, 239, 111671. [Google Scholar] [CrossRef]
  14. Watmough, G.R.; Marcinko, C.L.J.; Sullivan, C.; Tschirhart, K.; Mutuo, P.K.; Palm, C.A.; Svenning, J.-C. Socioecologically Informed Use of Remote Sensing Data to Predict Rural Household Poverty. Proc. Natl. Acad. Sci. USA 2019, 116, 1213–1218. [Google Scholar] [CrossRef] [PubMed] [Green Version]
  15. Estoque, R.C. A Review of the Sustainability Concept and the State of SDG Monitoring Using Remote Sensing. Remote Sens. 2020, 12, 1770. [Google Scholar] [CrossRef]
  16. Varotsos, C.A.; Cracknell, A.P. Remote Sensing Letters Contribution to the Success of the Sustainable Development Goals-UN 2030 Agenda. Remote Sens. Lett. 2020, 11, 715–719. [Google Scholar] [CrossRef]
  17. Teich, I.; Gonzalez Roglich, M.; Corso, M.L.; García, C.L. Combining Earth Observations, Cloud Computing, and Expert Knowledge to Inform National Level Degradation Assessments in Support of the 2030 Development Agenda. Remote Sens. 2019, 11, 2918. [Google Scholar] [CrossRef] [Green Version]
  18. Ishtiaque, A.; Masrur, A.; Rabby, Y.W.; Jerin, T.; Dewan, A. Remote Sensing-Based Research for Monitoring Progress towards SDG 15 in Bangladesh: A Review. Remote Sens. 2020, 12, 691. [Google Scholar] [CrossRef] [Green Version]
  19. Kelly-Quinn, M.; Christie, M.; Bodoque, J.M.; Schoenrock, K. Ecosystem Services Approach and Natures Contributions to People (NCP) Help Achieve SDG6. In Clean Water and Sanitation; Leal Filho, W., Azul, A.M., Brandli, L., Lange Salvia, A., Wall, T., Eds.; Springer International Publishing: Cham, Germany, 2020; pp. 1–13. ISBN 978-3-319-70061-8. [Google Scholar]
  20. United Nations. The 17 Goals|Sustainable Development. Available online: https://sdgs.un.org/goals (accessed on 26 February 2021).
  21. Clark, D.A.; Brown, S.; Kicklighter, D.W.; Chambers, J.Q.; Thomlinson, J.R.; Ni, J. Measuring Net Primary Production in Forests: Concepts and Field Methods. Ecol. Appl. 2001, 11, 356–370. [Google Scholar] [CrossRef]
  22. Trends.Earth—Trends.Earth 1.0.4 Documentation. Available online: https://trends.earth/docs/en/index.html (accessed on 9 July 2021).
  23. Trends.Earth Urban Mapper. Available online: https://geflanddegradation.users.earthengine.app/view/trendsearth-urban-mapper (accessed on 9 July 2021).
  24. De Colstoun, E.C.B.; Huang, C.; Wang, P.; Tilton, J.C.; Tan, B.; Phillips, J.; Niemczura, S.; Ling, P.-Y.; Wolfe, R.E. Global Man-Made Impervious Surface (GMIS) Dataset From Landsat 2017. Available online: https://sedac.ciesin.columbia.edu/data/set/ulandsat-gmis-v1 (accessed on 10 July 2021).
  25. Alamanos, A.; Linnane, S. Towards a Unifying Framework for Balancing Different SDGs and Objectives, and Achieving Sustainability: New Technologies, Socio-Hydrology, and Multi-Disciplinarity in Data-Scarce Areas. In Proceedings of the 1st Socio-Hydrology Conference, Delft, The Netherlands, 6–8 September 2021. [Google Scholar]
  26. NASA. Earth Observations (NEO). Available online: https://neo.sci.gsfc.nasa.gov/ (accessed on 9 July 2021).
  27. Devaney, J.; Barrett, B.; Barrett, F.; Redmond, J.; O’Halloran, J. Forest Cover Estimation in Ireland Using Radar Remote Sensing: A Comparative Analysis of Forest Cover Assessment Methodologies. PLoS ONE 2015, 10, e0133583. [Google Scholar] [CrossRef] [PubMed] [Green Version]
  28. Wilson, J.; Coxon, C.; Rocha, C. A GIS and Remote Sensing Based Screening Tool for Assessing the Potential for Groundwater Discharge to Lakes in Ireland. Biol. Environ. Proc. R. Ir. Acad. 2016, 116, 265–277. [Google Scholar] [CrossRef]
  29. Wilson, J.; Rocha, C. A Combined Remote Sensing and Multi-Tracer Approach for Localising and Assessing Groundwater-Lake Interactions. Int. J. Appl. Earth Obs. Geoinf. 2016, 44, 195–204. [Google Scholar] [CrossRef]
  30. Verbeiren, B.; Van De Voorde, T.; Canters, F.; Binard, M.; Cornet, Y.; Batelaan, O. Assessing Urbanisation Effects on Rainfall-Runoff Using a Remote Sensing Supported Modelling Strategy. Int. J. Appl. Earth Obs. Geoinf. 2013, 21, 92–102. [Google Scholar] [CrossRef]
  31. Ali, I.; Cawkwell, F.; Dwyer, E.; Green, S. Modeling Managed Grassland Biomass Estimation by Using Multitemporal Remote Sensing Data—A Machine Learning Approach. IEEE J. Sel. Top. Appl. Earth Obs. Remote Sens. 2017, 10, 3254–3264. [Google Scholar] [CrossRef]
  32. Jordan, C.J. An Holistic Approach to Mapping the Quaternary Geology and Reconstructing the Last Glaciation of West County Mayo, Ireland, Using Satellite Remote Sensing and “conventional” Mapping Techniques. Ph.D. Thesis, Queen Mary University of London, London, UK, March 2002. [Google Scholar]
  33. Preißler, J.; Martucci, G.; Saponaro, G.; Ovadnevaite, J.; Vaishya, A.; Kolmonen, P.; Ceburnis, D.; Sogacheva, L.; de Leeuw, G.; O’Dowd, C. Six Years of Surface Remote Sensing of Stratiform Warm Clouds in Marine and Continental Air over Mace Head, Ireland. J. Geophys. Res. Atmos. 2016, 121, 14538–14557. [Google Scholar] [CrossRef] [Green Version]
  34. Agarwal, A.; Taveneau, A.; Olbert, I.A. Remote Sensing of Surface Waters in Ireland. In Proceedings of the 2018 CERI, University College Dublin, Dublin, Ireland, 29–30 August 2018; p. 7. [Google Scholar]
  35. Ireland’s Hub for Sustainable Development Goals. Available online: https://irelandsdg.geohive.ie/ (accessed on 9 July 2021).
  36. FAO. Statistical Capacity Country Profile for SDG Indicators (Ireland): Statistical Capacity Assessment for the FAO-Relevant SDG Indicators 2018/19; FAO: Rome, Italy, 2019. [Google Scholar]
  37. McCormack, K.; Smyth, M. Road Map on Statistics for Sustainable Development Goals: A Review of Ireland’s Implementation of the Recommendations from the Conference of European Statisticians; Central Statistics Office, Ireland: Dublin, Ireland, 2019; p. 14. [Google Scholar]
  38. Database Tools-CSO-Central Statistics Office. Available online: https://www.cso.ie/en/databases/databasetools/ (accessed on 9 July 2021).
  39. Alamanos, A.; Rolston, A.; Linnane, S. Irish Bathing Sites Closures and Stormwater Overflows: Precipitation Forecasts, Extremes Analysis, and Comparison with Climate Change Projections. In Proceedings of the EGU General Assembly 2021, Copernicus Meetings, Online, 3 March 2021. [Google Scholar]
  40. Irish Water. National Water Resources Plan–Framework Plan; Irish Water’s 25 Year Plan for Our Water Assets; Irish Water: Dublin, Ireland, 2021; p. 184. [Google Scholar]
  41. An Fóram Uisce. Available online: https://thewaterforum.ie/ (accessed on 9 July 2021).
  42. Alamanos, A.; Rolston, A.; Papaioannou, G. Development of a Decision Support System for Sustainable Environmental Management and Stakeholder Engagement. Hydrology 2021, 8, 40. [Google Scholar] [CrossRef]
  43. The Water Forum. A Framework for Integrated Land and Landscape Management: Protecting and Enhancing Our Environment; An Fóram Uisce: Tipperary, Ireland, 2021; p. 36. [Google Scholar]
  44. Natural Earth-Free Vector and Raster Map Data at 1:10 m, 1:50 m, and 1:110 m Scales. Available online: https://www.naturalearthdata.com/ (accessed on 7 July 2021).
  45. Department of Housing, Planning and Local Government. River Basin Management Plan for Ireland 2018–2021; Government of Ireland: Dublin, Ireland, 2017.
  46. McManus, S.-L.; Coxon, C.E.; Mellander, P.-E.; Danaher, M.; Richards, K.G. Hydrogeological Characteristics Influencing the Occurrence of Pesticides and Pesticide Metabolites in Groundwater across the Republic of Ireland. Sci. Total Environ. 2017, 601, 594–602. [Google Scholar] [CrossRef] [PubMed]
  47. Graves, A.R.; Morris, J.; Deeks, L.K.; Rickson, R.J.; Kibblewhite, M.G.; Harris, J.A.; Farewell, T.S.; Truckle, I. The Total Costs of Soil Degradation in England and Wales. Ecol. Econ. 2015, 119, 399–413. [Google Scholar] [CrossRef]
  48. Aherne, J.; Alonso, M.; Araújo, C.; Arias-González, A.; Bakker, M.; Bansept, A.; Barros, N.; Bechevet, B.; Black, H.; Booth, P.; et al. Soil Degradation Risks in Planted Forests; Servicio Central de Publicaciones del Gobierno Vasco: Gasteiz, Spain, 2015. [Google Scholar]
  49. Conroy, E.; Turner, J.N.; Rymszewicz, A.; O’Sullivan, J.J.; Bruen, M.; Lawler, D.; Lally, H.; Kelly-Quinn, M. The Impact of Cattle Access on Ecological Water Quality in Streams: Examples from Agricultural Catchments within Ireland. Sci. Total Environ. 2016, 547, 17–29. [Google Scholar] [CrossRef] [PubMed]
  50. Schulte, R.P.O.; Richards, K.; Daly, K.; Kurz, I.; McDonald, E.J.; Holden, N.M. Agriculture, meteorology and water quality in Ireland: A regional evaluation of pressures and pathways of nutrient loss to water. Biol. Environ. Proc. R. Ir. Acad. 2006, 106, 117–133. [Google Scholar] [CrossRef] [Green Version]
  51. Jess, S.; Kildea, S.; Moody, A.; Rennick, G.; Murchie, A.K.; Cooke, L.R. European Union Policy on Pesticides: Implications for Agriculture in Ireland. Pest Manag. Sci. 2014, 70, 1646–1654. [Google Scholar] [CrossRef] [PubMed]
  52. O’Boyle, S. Water Quality in Ireland 2013–2018. In Proceedings of the Irish Freshwater Science Association, Online, 6 March 2020. [Google Scholar]
  53. Population Distribution-CSO-Central Statistics Office. Available online: https://www.cso.ie/en/releasesandpublications/ep/p-cp2tc/cp2pdm/pd/ (accessed on 9 July 2021).
  54. 30 Year Averages-Met Éireann-The Irish Meteorological Service. Available online: https://www.met.ie/climate/30-year-averages (accessed on 9 July 2021).
  55. Keegan, M.; Kilroy, K.; Nolan, D.; Dubber, D.; Johnston, P.M.; Misstear, B.D.R.; O’Flaherty, V.; Barrett, M.; Gill, L.W. Assessment of the Impact of Traditional Septic Tank Soakaway Systems on Water Quality in Ireland. Water Sci. Technol. 2014, 70, 634–641. [Google Scholar] [CrossRef] [Green Version]
  56. Prince, S.D. Challenges for Remote Sensing of the Sustainable Development Goal SDG 15.3.1 Productivity Indicator. Remote Sens. Environ. 2019, 234, 111428. [Google Scholar] [CrossRef]
  57. Gennari, P.; Navarro, D.K. Validation of Methods and Data for SDG Indicators. Stat. J. IAOS 2019, 35, 735–741. [Google Scholar] [CrossRef]
  58. Hakimdavar, R.; Hubbard, A.; Policelli, F.; Pickens, A.; Hansen, M.; Fatoyinbo, T.; Lagomasino, D.; Pahlevan, N.; Unninayar, S.; Kavvada, A.; et al. Monitoring Water-Related Ecosystems with Earth Observation Data in Support of Sustainable Development Goal (SDG) 6 Reporting. Remote Sens. 2020, 12, 1634. [Google Scholar] [CrossRef]
  59. Fehri, R.; Khlifi, S.; Vanclooster, M. Disaggregating SDG-6 Water Stress Indicator at Different Spatial and Temporal Scales in Tunisia. Sci. Total Environ. 2019, 694, 133766. [Google Scholar] [CrossRef]
  60. Ovienmhada, U.; Wood, D.; Mouftaou, F.; Badou, F.D.; Djihouessi, B.; Lagomasino, D.; Fatoyinbo, T.; Ashcroft, E.; Lombardo, S.; Jiang, M. Earth Observation Technology Applied to SDG 15.8 in West Africa: Multi-Data Stream Analysis and Validation Approaches. In Proceedings of the 2020 AGU Fall Meeting, Online, 1–17 December 2020; p. SY006-04. [Google Scholar]
  61. Wang, Y.; Huang, C.; Feng, Y.; Zhao, M.; Gu, J. Using Earth Observation for Monitoring SDG 11.3.1-Ratio of Land Consumption Rate to Population Growth Rate in Mainland China. Remote Sens. 2020, 12, 357. [Google Scholar] [CrossRef] [Green Version]
  62. Aquilino, M.; Tarantino, C.; Adamo, M.; Barbanente, A.; Blonda, P. Earth Observation for the Implementation of Sustainable Development Goal 11 Indicators at Local Scale: Monitoring of the Migrant Population Distribution. Remote Sens. 2020, 12, 950. [Google Scholar] [CrossRef] [Green Version]
  63. Holloway, J.; Mengersen, K.; Helmstedt, K. Spatial and machine learning methods of satellite imagery analysis for Sustainable Development Goals. In Proceedings of the 16th Conference of International Association for Official Statistics (IAOS); International Association for Official Statistics (IAOS): Paris, France, 2018; pp. 1–14. [Google Scholar]
  64. Lovelace, R.; Nowosad, J.; Muenchow, J. Geocomputation with R; CRC Press, Taylor and Francis Group: Boca Raton, FL, USA, 2021; Available online: https://geocompr.robinlovelace.net/ (accessed on 4 September 2021)ISBN 978-1138304512.
Figure 1. Potential land degradation map, using the land cover change relation to land degradation, according to the criteria matrix.
Earth 02 00037 g001
Figure 2. The methodology for the SOC evaluation metric. Carbon change relation to land degradation (up) and conversion factors with different satellite image colours (down). The parameter f converts C emissions to C stock changes, according to the international database of the routine Trends.Earth, in line with the IPCC’s guidelines. Source: Adapted from [22].
Earth 02 00037 g002
Figure 3. The statistical capacity for Ireland’s SDG Indicators (reporting and database sources), according to FAO’s statistical capacity assessment [36].
Earth 02 00037 g003
Figure 4. (a) Input Data for the estimation of the SDG15.3.1 (the disclaimer refers to the use of data from Natural Earth repository [44]). (b) The output map with the results of SDG15.3.1. Note: Northern Ireland is under a separate jurisdiction to the Republic of Ireland; thus, its data are not shown in the map.
Earth 02 00037 g004
Figure 5. Indicative summaries of the results of SDG15.3.1 indicator, as produced by the Trends.Earth, using the same colours as the map of Figure 4b. (a) Overall statistics of the indicator, and statistics of changes in (b) SOC, (c) productivity, (d) land cover.
Earth 02 00037 g005
Figure 6. (a) Preparing input data, (b) zoom in the examined scale (Limerick).
Earth 02 00037 g006
Figure 7. The evolution of Limerick’s urban expansion maps. The grey circle around the map of Limerick City indicates the buffer that needs to be applied for computational reasons (threshold of estimated area). The trends of population and land use changes are also analytically presented in a table and a diagram form, together with the results of the estimated indicator SDG11.3.1.
Earth 02 00037 g007
Table 1. The relations used for the spatial characterization of SDG15.3.1.
ProductivityLand CoverSOCOutput: SDG15.3.1
ImprovingImprovingImprovingImproving
ImprovingImprovingStableImproving
ImprovingImprovingDecliningDeclining
ImprovingStableImprovingImproving
ImprovingStableStableImproving
ImprovingStableDecliningDeclining
ImprovingDecliningImprovingDeclining
ImprovingDecliningStableDeclining
ImprovingDecliningDecliningDeclining
StableImprovingImprovingImproving
StableImprovingStableImproving
StableImprovingDecliningDeclining
StableStableImprovingImproving
StableStableStableStable
StableStableDecliningDeclining
StableDecliningImprovingDeclining
StableDecliningStableDeclining
StableDecliningDecliningDeclining
DecliningImprovingImprovingDeclining
DecliningImprovingStableDeclining
DecliningImprovingDecliningDeclining
DecliningStableImprovingDeclining
DecliningStableStableDeclining
DecliningStableDecliningDeclining
DecliningDecliningImprovingDeclining
Publisher’s Note: MDPI stays neutral with regard to jurisdictional claims in published maps and institutional affiliations.

