Review

A Review of How Building Mitigates the Urban Heat Island in Indonesia and Tropical Cities

by
Dany Perwita Sari
Research Center for Biomaterials, National Agency for Research and Innovation (BRIN), Jl. Raya Bogor Km. 46, Bogor 16911, Indonesia
Earth 2021, 2(3), 653-666; https://doi.org/10.3390/earth2030038
Submission received: 13 August 2021 / Revised: 13 September 2021 / Accepted: 14 September 2021 / Published: 18 September 2021

Abstract

:
A consequence of urbanization was the intensification of urban heat islands, especially in tropical cities. There have been rapid developments in infrastructure that have displaced open spaces. Meanwhile, Indonesia has a tropical climate directly affected by climate change. A high priority has been placed on adaptation measures to address issues such as sea-level rise, increased extreme weather, and threats to ecosystems and biodiversity. There is still a lack of specific knowledge regarding tropical climate in urban areas. In this paper, the author examines how building and urban planning affect urban heat islands in the tropics. According to the review, early planning and building based on local weather data can reduce the energy consumption and minimize the UHI effect. Furthermore, a media campaign and early education should increase awareness about adaptation measures between governments and citizens. Based on the findings from this study, some recommendations are offered for future urban planning, especially for tropical climates, to reduce UHI effects.

1. Introduction

Cities all over the world are experiencing urban heat islands (UHI). In urban environments, the phenomenon of UHI is characterized by increased temperatures at surface, sub-surface, or air levels compared to their undeveloped rural counterparts [1,2]. It has been observed that UHI phenomena are more prevalent during the summer when the weather is clear and calm [3]. UHI has been shown to directly decrease thermal comfort and healthiness among city dwellers [4]. As a result of the Paris Agreement in November 2016, both adaptation and protection have finally been recognized as equally important, thereby pushing many countries that have already developed national adaptation strategies to also adopt their own [5].
The rapid development of infrastructure has led to the replacement of open space in many developing countries [6]. As a result of urbanization and climate change, the UHI effect in tropical cities has grown [1,7]. Climate change has already created hotter summers and different patterns of rainfall in these regions [1]. An increase in the intensity of UV-induced heat stress in tropical climates can result in a significant increase in both indoor and outdoor heat stress [8]. In the long run, high temperatures in urban areas lead to inconvenient living conditions [6]. The World Meteorological Organization (WMO) has long recognized the importance of studying tropical urban climate, and commissioned a series of bibliographies on the topic in 1993 [9] and 1996 [10].
The KOPPEN-Geiger climate classification classifies Indonesia as a tropical humid country [11]. In Indonesia, climate change adaptation has placed high priority on issues such as sea level rise, extreme weather events, and threats to ecosystems. Indonesian cities are developed according to need and are rarely planned. As a result, high-rise buildings and a lack of vegetation characterize the unplanned urban configuration, raising outdoor temperatures [12]. The UHI affects existing buildings and has serious consequences; for example, an increased resource consumption and environmental footprint, detrimental health effects, and reduced occupant comfort [1,13,14,15,16,17]. Studying UHI can be used to design a healthier city.
Specific knowledge of tropical urban climate still lags behind that of temperate climate. In this article, the author discusses the state of the art in terms of global and tropical heat island intensity, its effect on building energy consumption, and the effects of urban compactness in the tropics. Moreover, this review also gathered some important information for designing a future city in Indonesia and a tropical city. Two databases were searched for the review: MDPI and SciencesDirect. This study used the following keywords: “tropics”, “urban heat islands”, “energy consumption”, and “building”. Figure 1 shows a significant increase in UHI building research from 2012 to 2021. Studies on this subject were less than 40% prior to 2017. However, this study has grown substantially in the last five years. Furthermore, this review examines the UHI research conducted in the tropics in the last five years.
In addition, the study is limited to urban and building analysis with a focus on attenuating urban heat island effects. This study explores new developments in the literature concerning tropical UHI phenomenon as it relates to human behavior, critically evaluating the following:
  • What are the causes of UHI in tropical cities and global cities?
  • How are countries adapting to and mitigating the UHI phenomenon?
  • How do UHI impact on building energy consumption?
  • How can buildings mitigate the UHI effect?
  • Which is the most effective method of adaptation and mitigation for UHI in Indonesia?

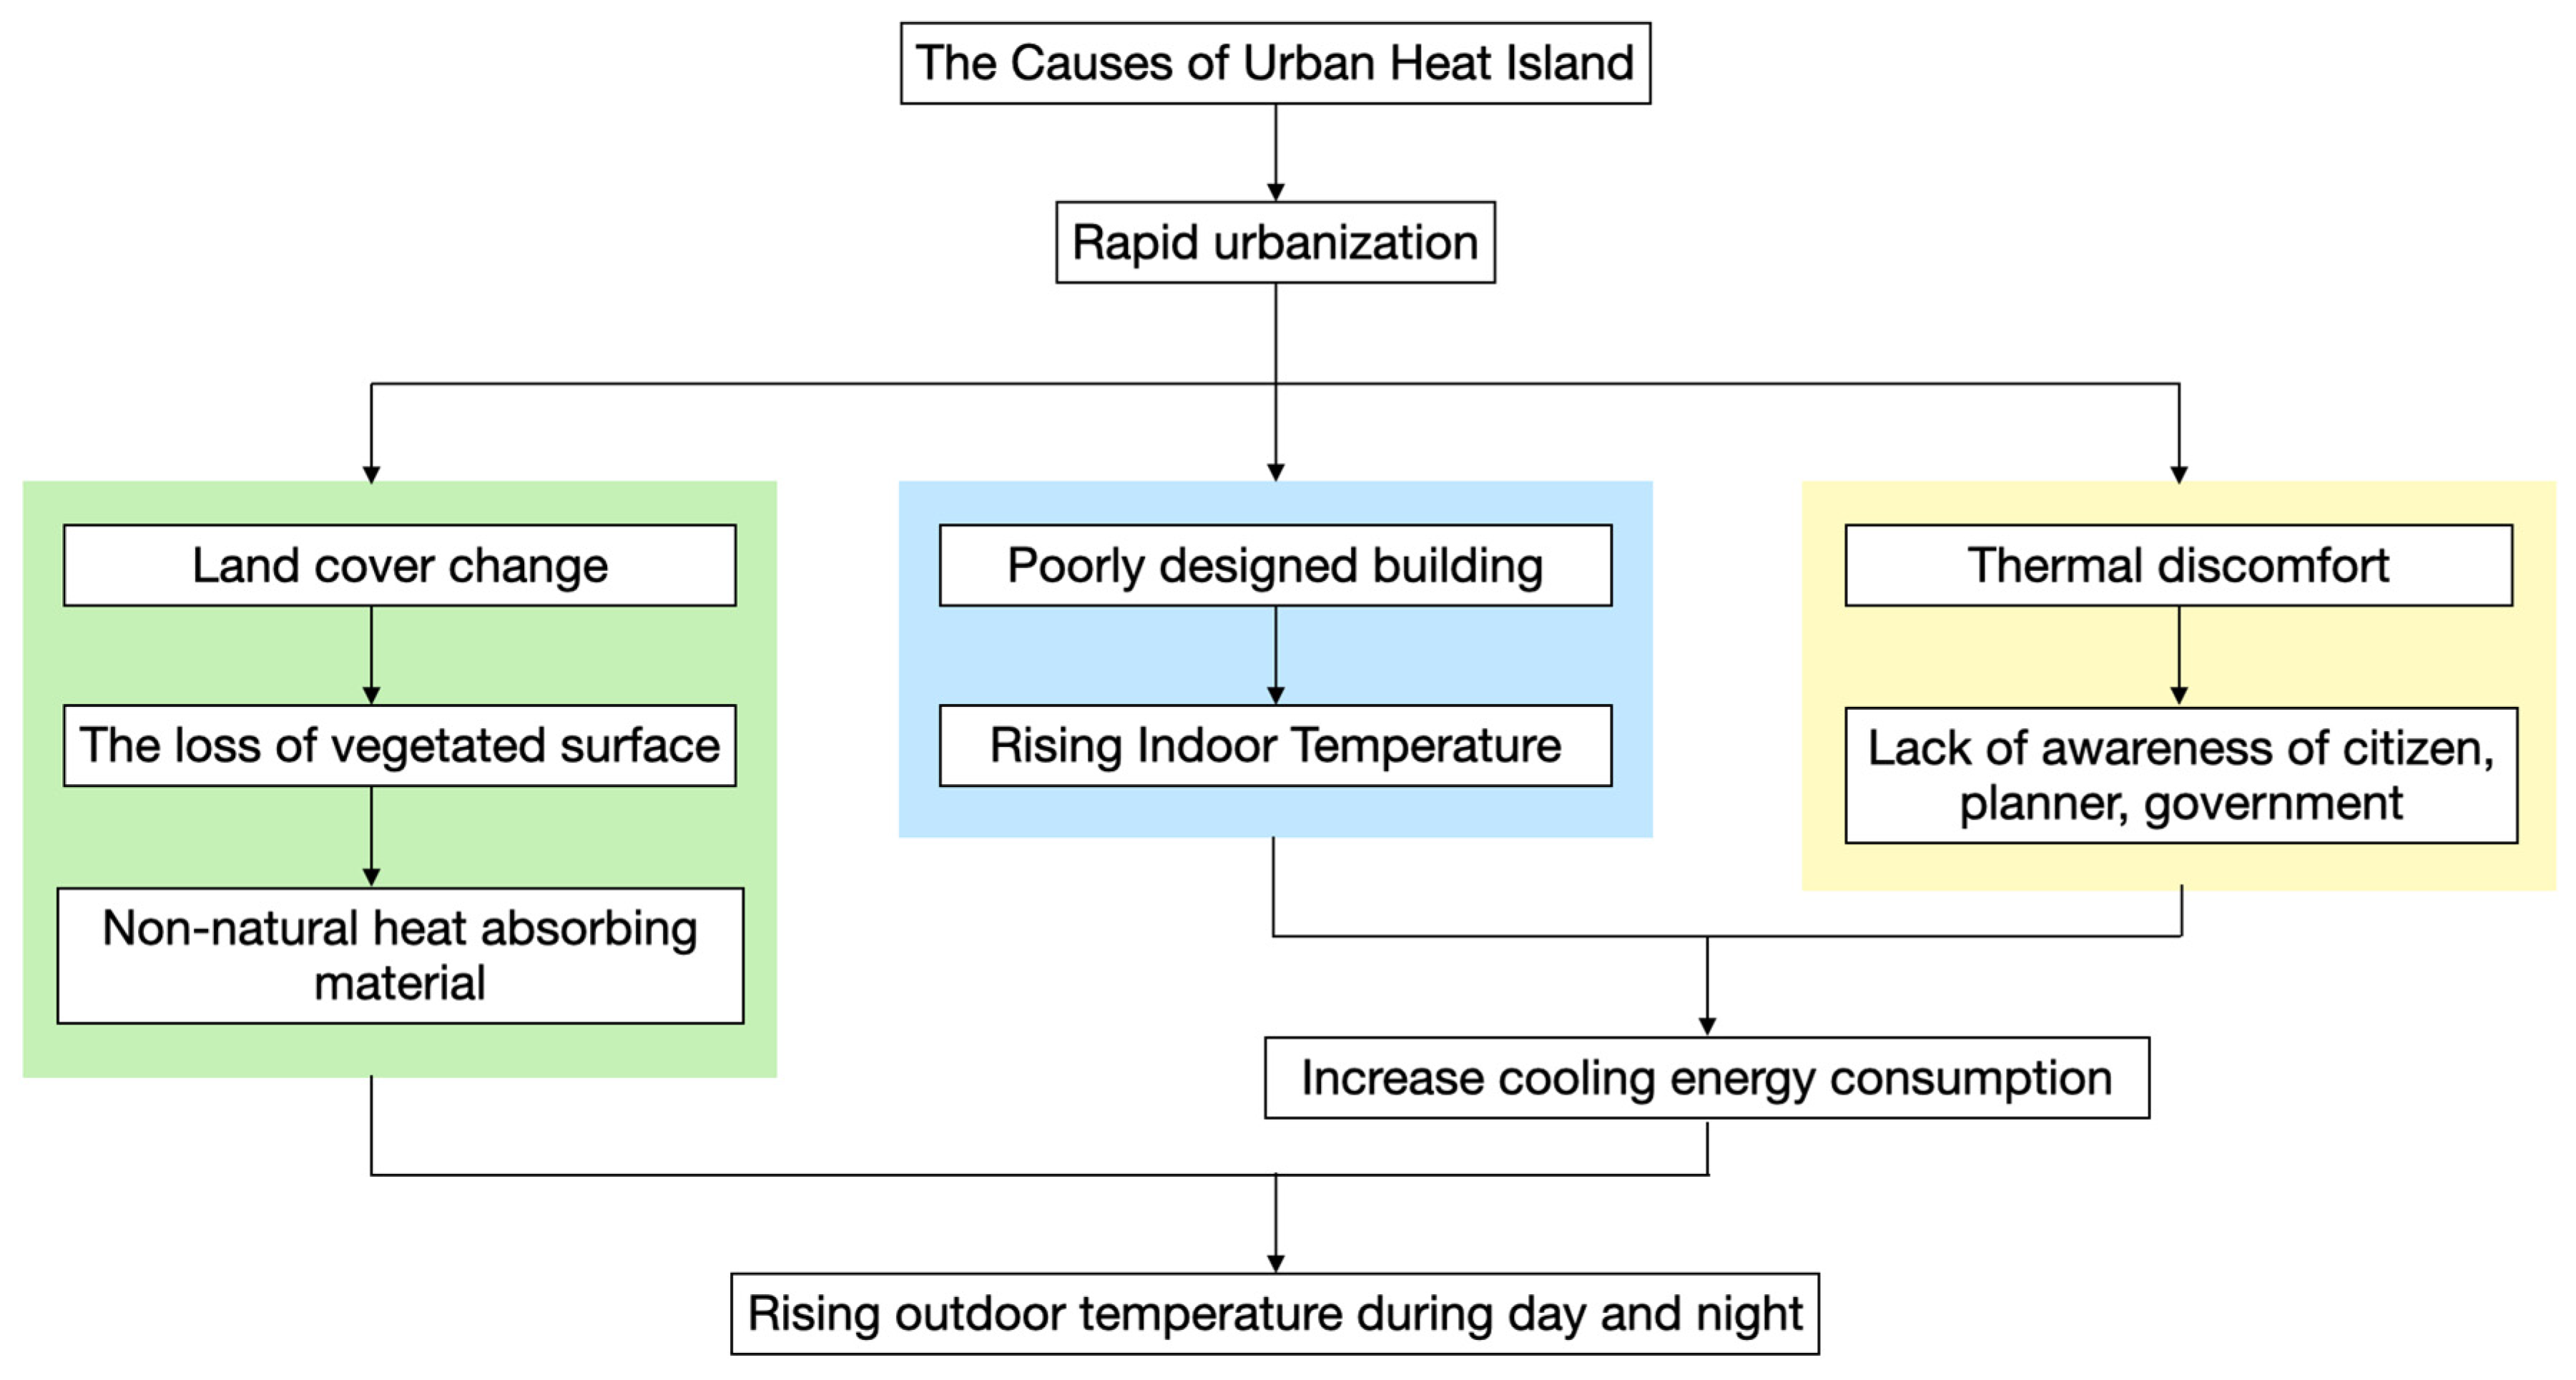
2. Causes of UHI in Tropical and Global Cities

World Urbanization Prospects (2018) published by the UN shows that the proportion of urban populations is higher than that of rural populations, reaching 55% in 2018 [18]. In 1950, this ratio was only 30%, and by 2050 it is expected to be 68% [18]. An intense urbanization process in the 20th century led to pollution-related problems and temperature increases in cities, resulting in a UHI [16]. Urban areas with dense populations and built-up areas are more likely to suffer from climate change, since natural surfaces are mostly replaced by sealed surfaces and construction sites [1,4,19]. Furthermore, UHI intensities are affected by factors such as wind speeds, cloud cover, season, city size, and time of day [4]. Typical urban climates are characterized by the presence of thermal, wind environments that can pose wind danger or serious overheating issues [20].
UHI has caused environmental changes in many cities as well as societal challenges [2]. Increasing UHI in urban areas is also influenced by human behavior. Through the activities of industrialization and transport, human beings contribute directly to urban overheating, and indirectly through air pollution that alters the radiative properties of the atmosphere [3]. Additionally, street canyons contribute to UHI in urban areas. A street canyon is a U-shaped space between two adjoining structures that can also be used to trap longwave radiation due to a reduction in sky view factors (SVFs) that increases the temperature [21]. There is an urgent need to develop urban planning guidelines that are based on the geometric parameters of urban street canyons, which have a significant effect on microclimates and thermal comfort at the pedestrian level [22].
Climate interaction with buildings has always been complex and dynamic. Buildings located in urban areas consume significantly more cooling energy than those located in rural areas [15,23,24,25]. In urban areas, air conditioners are an important cooling and adaptation strategy, especially for citizens with pre-existing medical conditions or the elderly [25,26]. The use of air conditioners, however, also increases energy consumption [1,8]. Due to the exhaust heat from an air conditioner’s outdoor unit, this could contribute to climate change and could actually raise the outdoor temperature [3,26,27]. During the night, this phenomenon is particularly strong, reducing the building’s ability to cool [3,28]. A closer look at climate-based design for reducing UHI is also essential.
Cities in the tropics are constantly hot and sunny, and heat islands can make urban areas more uncomfortable [14,29]. The highest intensity (medium magnitude) occurred during the daytime in tropical environments during the rainy season [16]. In contrast with tropical climates, temperate climates are the most intense at night and during months of greater temperatures and low precipitation [16]. Tropical climates tend to have higher UHIs, with temperature values exceeding 6 °C in intensity [16]. Planned adaptation and mitigation measures should be developed strategically by urban planners, designers, and decision makers to reduce risks associated with UHI [30]. A review of tropical cities is presented in this paper.
Sri Lanka also has high temperatures during the day in cities with industrial, commercial, and domestic activities and a huge number of people [4]. Sri Lanka’s largest city, Colombo, has experienced significant temperature increases and severe thermal insecurities during recent years [4]. Green infrastructure in urban settings has the ability to mitigate climate change, UHI effects, and flooding risks, and subsequently boost human well-being [4]. A study examining the relationship between urban heat islands and pollution concentrations in Presidente Prudente, Brazil, found that the coldest winter days and the hottest summer days with heat waves had higher concentrations of pollutants [14]. A meteorological network comprising 26 data points situated throughout the city and the surrounding areas recorded air temperature and humidity [14]. The highest and lowest magnitudes were recorded during the dry rainy season [14].
High-rise buildings in urban areas do not only cause negative effects. Due to the shading effect of high-rise buildings in Kuala Lumpur, shading is important during the day [31]. The shade can cause the temperature in the area to drop by up to four degrees. At night, the combination of shadows and green patches reduces the UHI intensity to half its value and generates a cool island during the day [31].
As illustrated in Figure 2, the causes and consequences of UHI affect global and tropical climates. These analyses show that the UHI effect is higher in tropical climates than in temperate climates. In urban areas, rapid urbanization changed the land’s function from vegetated areas into buildings and streets. Moreover, rapid urbanization led to unplanned buildings that were mainly designed without understanding the conditions of the current climate. Building owners, architects, designers, and even the government do not seem to be knowledgeable about this issue. Consequently, high cooling energy is consumed to provide indoor thermal comfort. This led to an increase in outdoor temperatures not only during the day but also at night. The need to mitigate this in tropical climates cannot be overstated. In light of these analyses, strategies for creating healthy building designs are recommended, especially in cities, to reduce UHI and increase thermal comfort in buildings.

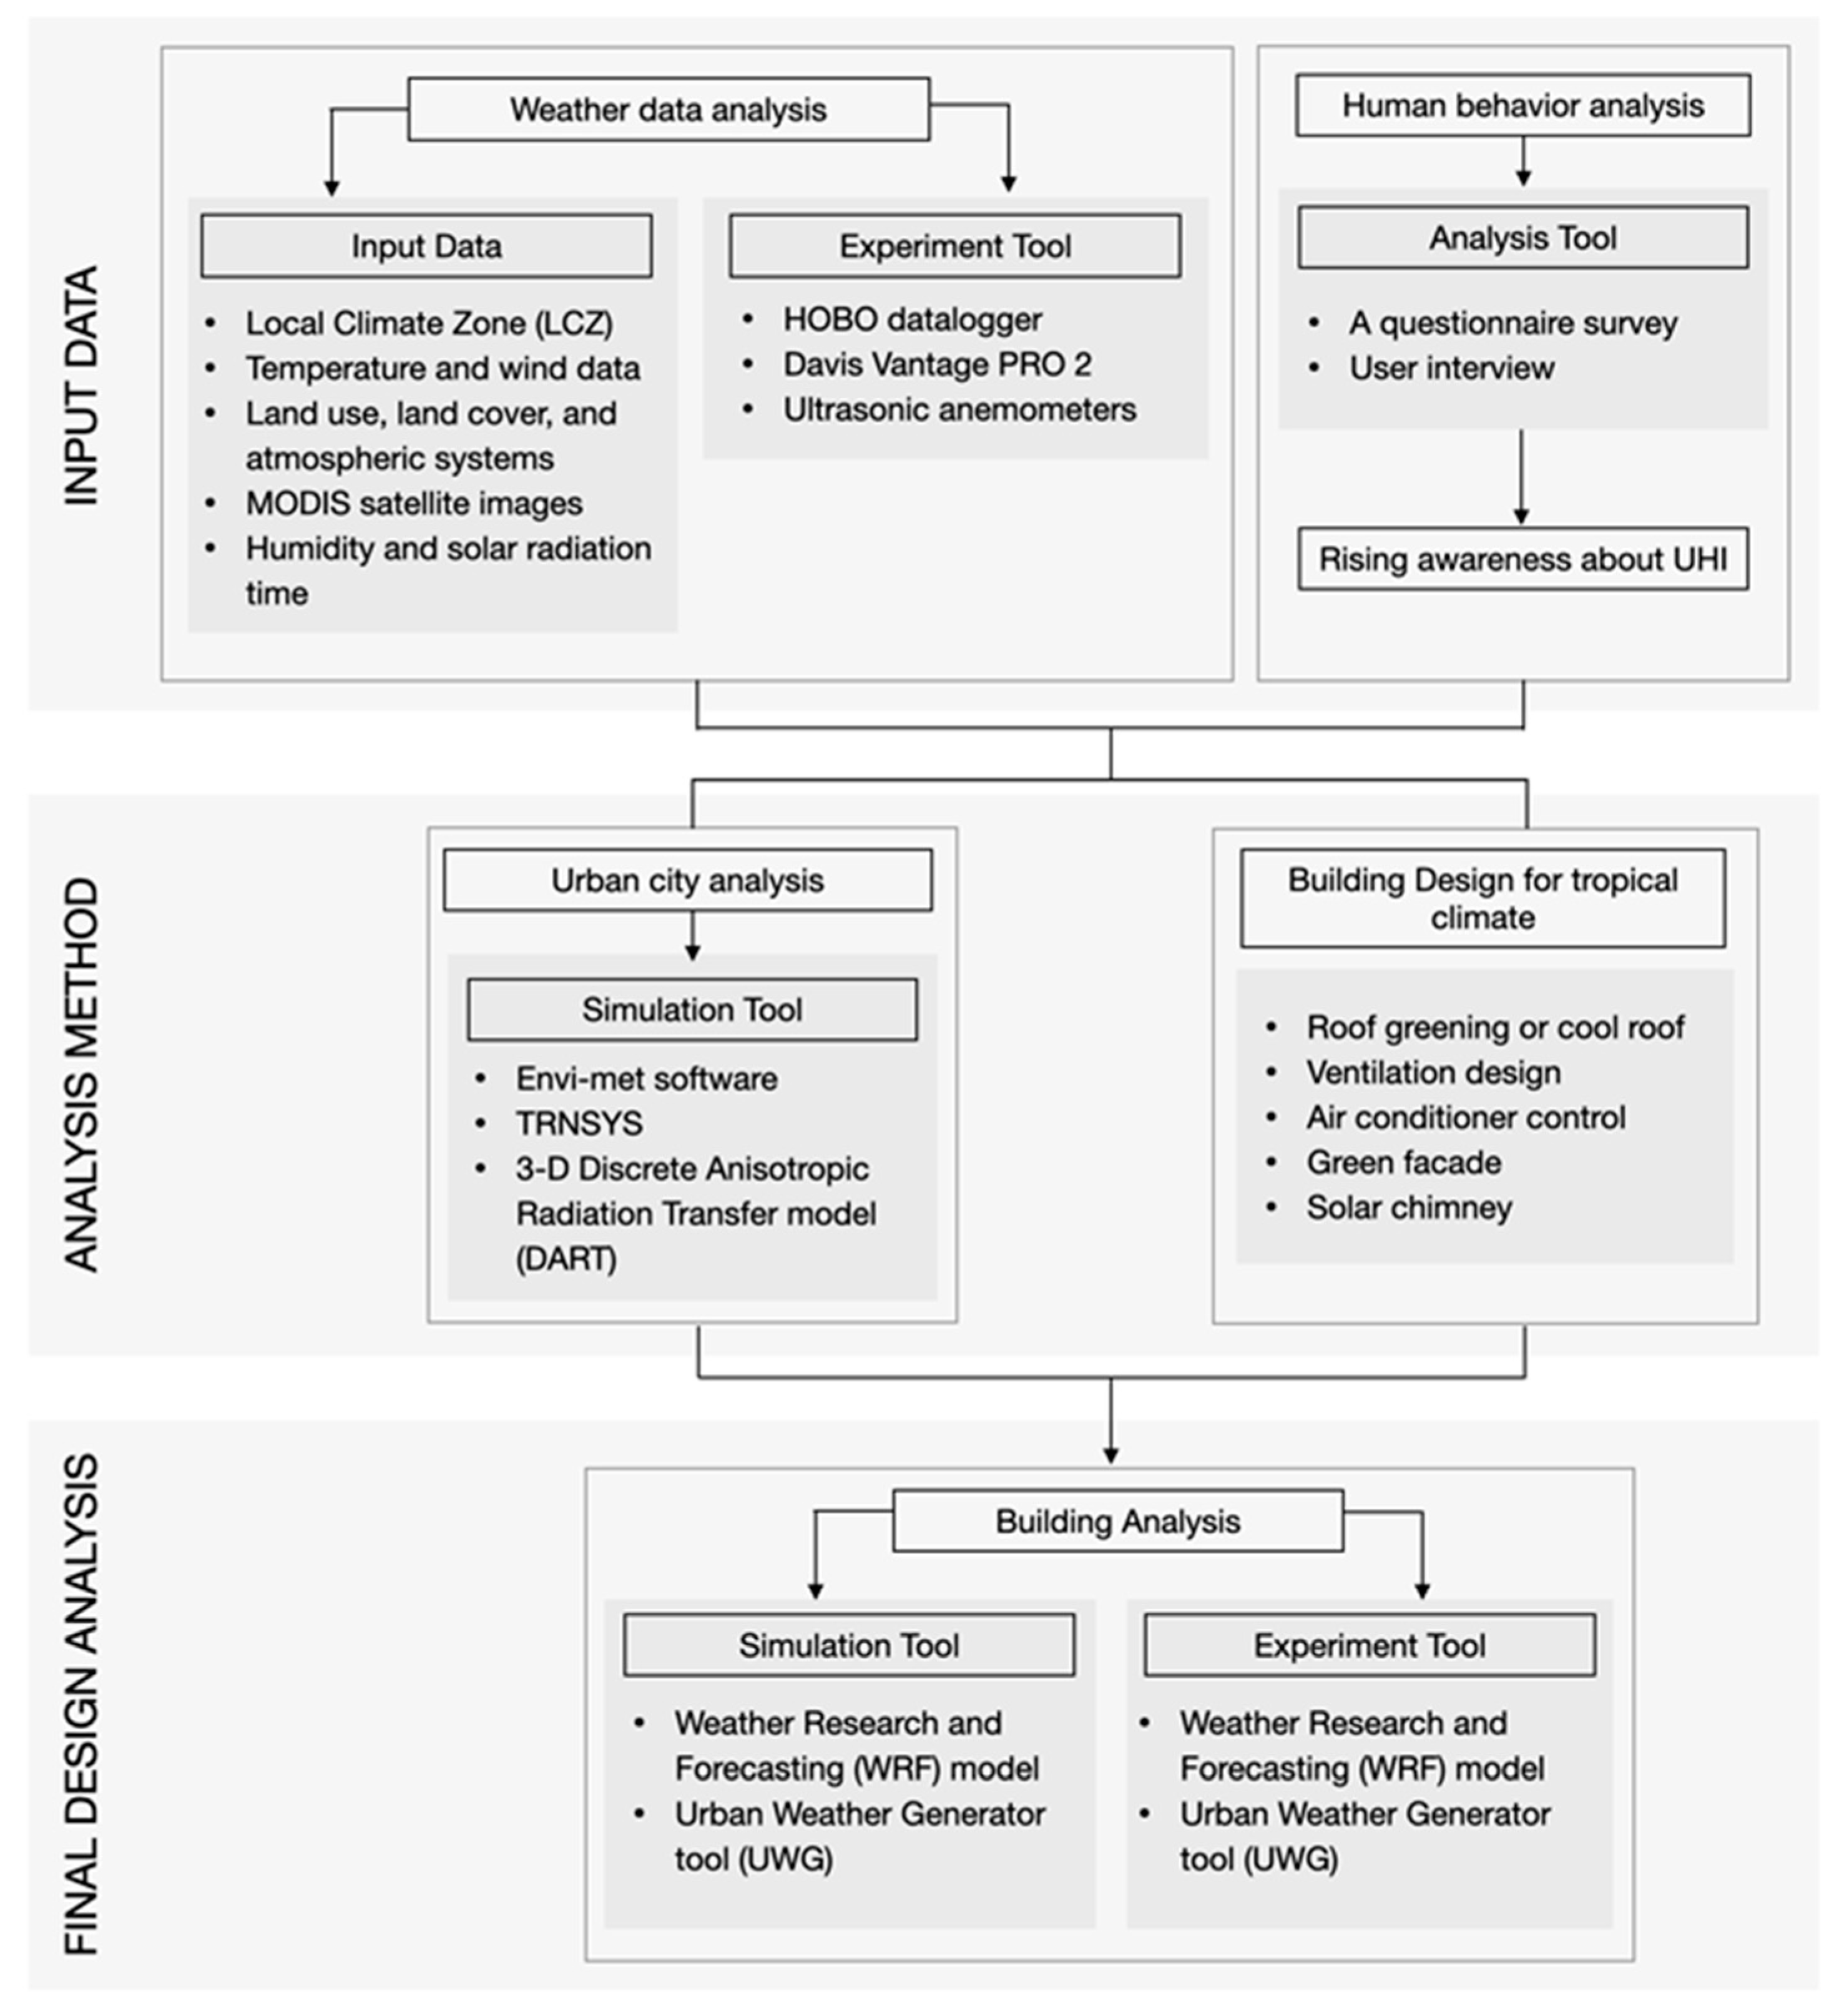
3. Mitigation of and Adaptation to UHI Phenomena

A detailed thermal map of the UHI and DI should be considered in planning and modeling the city of Valencia, Spain [32]. It is important to take measures to decrease the uncomfortable heat in the summer, such as improving the natural sea breeze to ventilate the city [32]. Brazilian cities also suggested the use of urban climate studies for urban planning [29]. Usually, in tropical cities (Brazil) the focus is on the economic factors rather than the social and environmental aspects, such as subdividing land into small lots and removing vegetation to increase ambient temperatures [29]. Due to their limited access to cooling facilities, dense urban populations are more likely to suffer from a thermal environment that affects their health, particularly the low-income population [29].
There is also evidence in Brazil to support the fact that atmospheric heat island intensity results from the interaction between the atmosphere and the surfaces [14]. For urban space planning and management, heat island maps during different parts of the day can be useful [14]. Duran, Ecuador, needs indicators that are easy to understand so they can make informed decisions [8]. Green solutions were recommended as the first option for tropical climate cities [8]; the improvement of pavements and roofs, and the reduction in vehicular traffic in densely populated cities [8]. Newly planned cities must achieve an equilibrium between horizontal and vertical dimensions, while also providing an open grid pattern to permit microclimate regulation through ventilation and avoid overexposure to radiation [8].
Urban heat islands influence the air quality outside and inside of buildings, the health of occupants, and the energy consumption of buildings by decreasing outdoor and indoor air quality. Urban forms will increase local temperatures and positively influence the number of discomfort hours. Therefore, specific analyses are required that examine the site and the associated obstacles, such as the negative impact on solar access hours. In this chapter, we discuss detailed methodology and analyses on urban planning based on climate studies.

3.1. Weather Data Research and Modeling

Weather data are one of the primary inputs used in analyzing UHI. In some studies, experimental tools were used to collect data. HOBO dataloggers (U23-002, protected under the same RS3 brand) and Davis Vantage PRO weather stations were used to measure and calculate hourly air temperature data [16]. These results calculate the hourly temperature average for both cities for 2016 and illustrate the differences in season and synoptic conditions [16]. Other than using that equipment, humidity traces and solar radiation time series were obtained from selected Malaysian sites [31]. Anemometers with ultrasonic waves were used to measure the weather [31].
In order to explore the intra-urban variability of mitigation measures, local climate zones (LCZ) maps of Singapore [30] and Bandung, Indonesia [33] were used. LCZs are considered useful concepts for investigating the relationship between urban land use type and urban heat island effects, a subject that has been extensively examined for cities [33]. In Brazil, a study was conducted during summer nights (December 2013–January 2014) [29]. Based on information about land use, land cover, and atmospheric systems, this study identified which urban areas have the highest nocturnal UHIs, distributed among densely built areas with little vegetation [29]. UHI was evaluated using two approaches in Valencia (Spain) [32]: (a) using air temperature (AT) time series from two meteorological stations and (b) using land surface temperature (LST) images from NASA MODIS products. In spite of the fact that MODIS satellite imagery provided valuable insight into heat conditions over Valencia, the differences within the city were blurred because of its moderate resolution [32]. A Discomfort Index assessment was conducted in Valencia (Spain) in the city to evaluate human thermal comfort [32]. UHI intensity and spatial pattern during three consecutive summer days were associated with a heat record [32]. The difference between the urban and rural region UHI was calculated to be the most pronounced after sunset on the record-breaking hot day (2.6 °C) [32].
As an additional step, the input weather data for urban areas have been simulated using several tools. The Weather Research and Forecasting (WRF) model was used to assess mitigation scenarios for the tropical city of Singapore during April 2016, including two heat waves [30]. Simulated results show that the canopy layer UHI intensity in Singapore can reach up to 5 °C in compact areas at night [30].
Using another simulation tool, the Urban Weather Generator Tool (UWG), exploratory UHI simulations were performed in Duran, Ecuador [8]. A sensitivity analysis was conducted on the four clusters to study the relevance of the main UHI driving factors [8]. The urban heat island profile of Duran was quite typical, based on the analysis results. At noon, the thermal inertia effect and heat emitted from traffic combined to produce a negligible effect and increased during the afternoon and night [8]. Duran appears to be strongly affected by the urban heat island effect, especially in informal settlements with a high anthropogenic heat release [8].
Research conducted in a tropical area, Kuala Lumpur, Malaysia, demonstrated the relative importance of environmental and anthropogenic factors on UHI intensity [31]. The results show that UHI intensity measured at night was 6 °C, while that measured during the day was 4 °C [31]. Among all the studied areas, areas with low-rise to medium-rise buildings displayed the poorest thermal conditions [31]. During times of low solar radiation, obvious depressions in UHI intensity can be detected in conjunction with clouds [31].
Due to these concerns, in Brazil, an analysis of three tropical cities’ heat islands was performed to identify the main factors driving the development of heat islands in small and midsize cities [29]. Brazil had higher UHI magnitudes in areas with tightly packed buildings, few or no trees, and building materials that were inappropriate for the region’s climate and thermal comfort [29]. Several procedures are involved with assessing UHI (measurement variables, time and scale definitions, instruments, data collection, reporting, etc.). The intensity of an impact is in part determined by synoptic conditions, including precipitation, cloudiness, and wind [29]. This study explores atmospheric stability in tropical cities, where temperature differences are apparent under calm conditions [29]. As a result, urban and rural land use are important factors in determining UHIs in Brazil.
Another project in Casco Antiguo, Panama City was to conceptualize and evaluate heat mitigation strategies using biomimetic strategies on an urban scale [34]. Using the problem-based approach, biomimicry-based strategies were developed [34]. A biomimetic approach is important since nature often adapts and solves problems passively and without causing harm to itself. As a result of its methodology, it can be used across many different application areas (architecture, engineering, biology) to provide energy-efficient and sustainable designs [34].
Planning and development professionals may also benefit from weather data analysis by improving building construction designs for thermally comfortable zones and by avoiding development in hotspots [30]. Medium-rise building areas are strongly affected by UHI. Due to the rising outdoor temperature as well as the heat produced by air conditioners in nearby high-rise buildings, these buildings suffered. When planning an urban area, these areas should be the main focus.

3.2. Simulation Tools for Urban Planning

Simulation tools have been helpful in analyzing the behavior of radiative cities and their effects on residents [17]. Increasing availability of urban area data has led to a more comprehensive analysis of urban microclimates and thermal comfort [17]. The Discrete Anisotropic Radiation Transfer model (DART) is used to model the spatial distributions of The Mean Radiant Temperature (TMRT) [17]. The model can simulate TMRT across a range of scales and parameters including coverage, shape, spectral signature, Leaf Area Index, and Leaf Area Density of vegetation (for example, ground, walls, and roofs) [17]. Simulations using accurate vegetation properties are therefore essential [17].
ENVI-met was used to simulate Sri Lanka’s climate [4]. The study demonstrated that ENVI-met can be used for climate simulations under hot and humid conditions in Sri Lanka.
A case study of a historic urban development near the coast of Panama with 66,896 m2 of land was evaluated using dynamic simulations during the critical summer month (March) and the critical rain month (October) using ENVI-met software [34]. A combination of zebra skin, human skin, evaporative cooling, and ant skin was used for the strategies [34]. Furthermore, ENVI-met is applicable to micro-scale interventions such as cool roofs, pavements, and vegetation and is used to examine the impact on air temperature when those interventions are applied at the canopy level [1]. The simulation was applied in Rajarghat (India), Kolkata (India), Campinas (Brazil), Hong Kong (China), Singapore and Dhaka (Bangladesh) [1]. There are some limitations in this study that relate to wind patterns caused by building orientation, urban geometry, and air pollution [1]. Site selection is based on the LCZ classification and mitigation strategies are presented [1]. Aside from ENVI, the cooling requirements for residential buildings and commercial buildings were simulated using TRNSYS v-17. A study using TRNSYS v-17 found that UHI increases cooling-related energy consumption by 30–70% in residential buildings and by 10–20% in commercial buildings [8].

4. UHI Impacts on Building Energy Consumption

In the previous section, it was highlighted that climate change poses a significant threat to buildings’ energy performance and human comfort. The building sector has played a crucial role in helping Rome design nearly zero-energy solutions in recent years [3]. The effect of different climatic boundary conditions on building energy performance, specifically a building’s heating and cooling demand, has also been evaluated by using a commonly used dynamic software application [3]. The UHI phenomenon in Rome is evaluated using the following measured meteorological parameters: dry bulb temperature, wind speed, wind direction, and relative humidity [3]. In order to evaluate the occurrence of the UHI phenomenon, dry bulb temperatures are used in order to compare urban and rural temperatures [3]. Simulated results indicate an increase in cooling energy demand of about 30% and a reduction in heating energy demand of about 11% as compared to the baseline [3]. As a consequence, an evaluation of the UHI phenomenon was conducted considering the weather differences between Rome and the surrounding area [3].
Another sample location (Turin, a temperate climate) was chosen and five more climate conditions representing European climates were examined [35]. As a consequence of these findings, the importance of analysis of urban climate early in the design process, for example during programming of a building, before specific actions are defined, has been clarified to assist in emerging bioclimatic predictions early in the design process [35]. The building energy performance can be used to analyze building consumption and its environmental impact. Building models were simulated using DesignBuilder in Malaysia [36]. Using simulation and CFD, the article investigated air flow and temperature by amending the parameters, factors, and design considerations that influence the thermal and ventilation performance of the solar chimney [36]. The percentage of deviation of the software was compared with the results of the field measurements. The study further proposed improvements to the existing case study house.

4.1. Weather Data as Input Data for Building Simulation

The standard meteorological year helps in the design of new buildings and the assessment of energy efficiency [3]. With dynamic software it is possible to simulate the energy performance of buildings based on a wide range of weather data [3]. It is desirable to have more localized meteorological data available inside big cities (affected by UHI phenomena). Data of this nature can be used to produce more accurate and consistent climatic data for improving predictions of building simulation models, as well as for improving the estimation of energy costs, internal environmental conditions, and making more rational assessments of energy conservation measures affecting existing buildings [3]. The results of this study indicate that climatic data collected from airports should not be used to assess the energy performance of buildings located at the center of cities (if possible) [3]. Moreover, standard weather information must be updated regularly to prevent air conditioning systems from being oversized during the winter and undersized during the summer [3].

4.2. The Importance of User Behavior

Data are collected via surveys and questionnaires. Human behavior can often be understood using this method. In response, one paper provides research on the relationship between residents’ mitigation and adaptation behaviors around cooling in Fukuoka, Japan, and draws lessons for communicating to encourage those behavior changes [26]. Participants were asked about issue perceptions, evaluation of mitigation measures, and behavior related to mitigation and adaptation [26]. Study findings suggest that there is a lack of information regarding how to use air conditioning appropriately in a manner that saves energy, and that energy-saving behavior is more likely to be coupled with practices such as relaxing in the shade or using a cooler [26]. Providing direct evidence of the benefits of appropriate air conditioning usage on electricity bills may be helpful for engaging citizens that may be unaware [26].
The study studied the effects of urban sustainability in ten countries worldwide using semi-structured interviews with experts in the field [37]. The results of an interview indicated that countries and different actor groups differ in their awareness of adaptation measures [37]. Politicians and citizens are less aware than urban planners and designers [37]. Public awareness must be raised through media campaigns, further education, and a display of best practices [37].
The level of education in a country can predict its sense of urgency as well as its climate experience [20]. According to survey results, urban planners and designers are aware of the problems concerning urban climate in most countries, showing that formal education places enough emphasis on this topic [20]. Various countries have urban climate experts who can also advise politicians, urban planners, and designers [20]. Urban climate phenomena are relatively poorly understood in less developed countries despite the higher urgency of adopting climate adaptation measures [20]. The most effective way to increase people’s awareness is through education and communication [20].

4.3. Experiment Tools and Calculation

In the tropical city of Mérida, Yucatán, Mexico, the NDVI values can be used as an indicator of how changes in urban land cover affect the spatiotemporal variations in surface temperatures [38]. Through remote sensing technology, this study sought to discover how weather patterns and land cover change affect land surface temperatures during the rainy and dry seasons. The NDVI data obtained suggest that vegetation vigor has decreased in the region since 1994 due to land use changes. The results suggest that the hottest temperatures are found in the Mérida urban zone, whereas they decline in peripheral areas that maintain vegetation cover [38].
Terraced housing research at Kuching University found that when air well configurations are explored with several experiment tools, natural ventilation can be maximized in single-story terraced houses [36]. HOBO U12 air temperature and air humidity were measured, and the HOBO U12 anemometer was used, as well as the Delta Ohm HD32.3 Wet Bulb Globe Temperature meter to determine the existing indoor environmental conditions and thermal performance. The purpose of this study was to investigate the thermal performance of a real-world case study house during field testing.

5. Reducing UHI through Building

The main cause of UHI is the man-made urban surfaces, which absorb, reflect, and emit a wide range of wavelengths of radiation. Urban geometry, surface materials, direct solar radiation and incident angle, and atmospheric diffusion all contribute to a city’s radiative budget [7]. The planning and design of cities and buildings should be incorporated into the resilience of a society to climate change to reduce exposure to heat during the hottest part of the year. Living in low-quality, impermeable, treeless, and air-conditioned neighborhoods that lack tree shading and have low construction standards is particularly uncomfortable. A heat island analysis of urban areas can enable a subsidizing of territorial planning and management, thus enhancing societal sustainability, as well as leading to a healthier development of cities [14]. The management of urban spaces is crucial for reducing heat islands.

5.1. Roof Greening and Cool Roof

A building’s thermal energy performance can be significantly impacted by UHI. Material in urban areas absorbs solar and infrared radiation, and in turn the accumulated heat is dispersed in the atmosphere, raising the ambient temperature [39]. Specifically, roofs are envelope components that are capable of reducing indoor temperature and providing significant energy savings in air-conditioned buildings by incorporating advanced solutions such as cool roofs and green roofs [19,39]. Approximately 20–25% of the urban surface area is covered by roofs of buildings [39]. Adding green roofs to buildings has been found to be an effective solution for improving environmental quality [40]. Typically, green roofs are covered with a layer of soil over a waterproofing membrane. The benefits of green roofs include decreased energy consumption within a building due to reduced solar absorption (as green roofs are more reflective) and evapotranspiration of plants [39]. Typically, green roofs are covered with a layer of soil over a waterproofing membrane. The benefits of green roofs include decreased energy consumption within a building due to reduced solar absorption (as green roofs are more reflective) and evapotranspiration of plants [39].
A study conducted on a detached house in Osaka, Japan, showed that evaporative space cooling and roof water showering had positive effects (decreasing sensible heat release and CO2 emissions related to space conditioning) in the summer [41]. Under free-floating conditions, the green roof, compared to cool and black roofs, can reduce heat loss from the prototype building envelope and maintain a positive heat flow during the day under highly insulated conditions [40]. The primary purpose of green roofs is to provide thermal insulation to buildings. Nevertheless, the better the insulation of the roof beneath the green roof, the less effect the green roof will have on the building’s energy demand and indoor temperatures [39].
Different from roof greening, cool roofs use natural white materials or second-generation materials such as artificial white paint to reflect most incoming solar radiation and thereby reduce the net radiation entering the building [39]. In comparison to conventional roofs, cool roofs have performed better in reducing cooling loads within buildings, resulting in lower air conditioning needs and improved indoor thermal comfort [39]. In addition, they are environmentally friendly as there is no additional waste produced, since they can be applied to existing or new roofs [39].
In Indian cities, cool roofs work better when there is a higher urban density compared to sparse settlements [1]. Cool roofs have the potential to reduce cooling loads in Singapore and anthropogenic air pollution [30]. At noon, cool roofs across Singapore reduced the heat index by approximately 2–2.5°C (mostly in the northern and western regions) [30].
A review of cool roof and green roof in Singapore was conducted utilizing a simulation [39]. Cool roofs are more effective at mitigating heat gains than green roofs for the Singapore climate, since vegetation can add to the latent heat flux produced by evapotranspiration [39].

5.2. Green Facade

A green facade has the ability to reduce indoor temperatures due to its shading ability. The first design concept is focused on the window. When window areas are not shaded by external shading devices, the window size has a greater effect than thermal mass. A building’s height should be considered in relation to shading of south- and west-facing facades through facade greening and trees, shading of rooftop extensions, and the correct orientation of buildings and streets to reduce solar irradiation and improve natural ventilation [19]. Wind directions are to be considered when planning building orientation and design [19]. Evaluation of individual wind comfort and microclimate must be required [19]. Facade greening should be considered in conjunction with renewable energy sources, since summer comfort in buildings is enhanced by shading during hot periods [19].
Researchers in Vienna are investigating the use of “plus-energy” and modern smart buildings, capable of generating, storing, and using energy conveniently within a building’s constraints, which will provide more efficient and economical solutions [27]. Architectural solutions include external shading, ventilation at night, and a large thermal mass of construction materials. According to the detailed analysis, combining these three measures provides the best results [27]. Moreover, the external shading must not be neglected at any cost. As part of this planning process, it is essential to consider shading, greening, ventilation, and densification to ensure that buildings can provide comfortable summer temperatures inside [27].

5.3. Ventilation Design

Passive cooling plays a crucial role in reducing the energy consumption during the operational period of a building, especially in tropic countries [36]. Thermal comfort can be achieved by implementing good ventilation. A natural ventilation system can provide the building with a cooling effect via airflow or air pressure differences as well as temperature differences between the inside and outside of the building, based on the design of the building at the pre-construction stage [36]. Providing fresh air to an indoor environment is essential to preventing levels of carbon dioxide (CO2) from exceeding undesirable levels [36].
A terraced house is the most common type of residence occupied by citizens in Malaysia, and its design does not consider the problem of single-sided ventilation [36]. In Malaysian terraced houses with one floor, a solar chimney was studied in order to improve natural ventilation [36]. Researchers found that the combination of a solar chimney and a louvre window geometry could enhance the stack ventilation of a residential building, resulting in a better thermal comfort for occupants [36].

5.4. Air Conditioning Control

In the tropics, ventilation is very helpful in reducing cooling loads, but the effectiveness of air movement depends on the air pollution levels [42]. As a result of a lack of quality air, the windows will be closed and internal and solar gains will accumulate. Despite shading or ventilation, the savings achieved by this scenario will be marginal because internal and solar gains will be eliminated with only air conditioning [42]. Future urban areas will need to utilize renewable energy sources, such as photovoltaic electricity generation, to power air conditioning, and other sustainable methods to reduce heat exposure [25].
Around half of the total electricity produced in Singapore goes to buildings, and for cooling alone, buildings consume about 30% of the country’s total electricity production [39]. AC systems contributed significantly to the air temperature in the urban environment during the night by releasing waste heat [30]. Increasing the thermostat setting from 21 to 25 °C can mitigate the effect [30]. Singapore could not achieve a thermally comfortable future without limiting the density of less compact areas, and measures to mitigate UHI are necessary if urban densification is inevitable [30].

6. The Most Effective Method of Adaptation and Mitigation for UHI in Indonesia

One of the largest tropical countries, Indonesia, also experiences UHI due to urbanization. Researchers in Jakarta, the capital city of Indonesia, have studied the cause of the rise in surface temperature and the phenomena known as UHI for the period of 2000–2012 [6]. One of the reasons for the increase in outdoor temperatures is the reduction in green space. During the last 12 years, 49.7% of green open space has been converted into other land uses, particularly build-up areas [6]. Surabaya’s land use is similar to that of Jakarta, another metropolitan city in Indonesia [43]. Surabaya is divided into 42% housing, 16.24% cropland, 15.20% pond, 10.76% commercial, 7.30% industries, and 5.50% open area [43]. Lastly, Bandung is a metropolitan city in Indonesia. This Indonesian city is the capital of the province of West Java, located in Indonesia’s western region. The city has experienced rapid urbanization over the past 25 years, with annual population growth rates rising from 1.35% between 1990 and 2000, to 1.49% between 2000 and 2010 [33].
There is almost no green open space in Jakarta, but some areas with green open space have lower surface temperatures of about 3.2 °C [6]. Urban forests are effective in lowering surface temperatures. Surabaya has an average UHI of 1.4 °C, due to minor differences between the urban and rural areas [43]. UHI has a significant impact on the consumption of energy and air conditioning in Surabaya [43]. Further, Surabaya’s local government has taken direct and indirect measures to address UHI, including managing zoning and building codes, green building standards, reducing CO2 emissions in the transportation sector, and promoting procurement and greenery policies [43]. In contrast to Jakarta, Surabaya provides green space in such proportions as 30% of the city’s total area [43]. A green area can lower the temperature. Green space becomes the top influencing factor because of the need to address UHI. This research can be applied not only to Surabaya’s municipality, but also to other cities with similar characteristics. In general, Indonesia’s UHI are similar to other tropical cities that have been researched already. In addition, mitigation strategies can be adjusted to the Indonesian climate.
Figure 3 outlines the conceptual and technical design process for designing in tropical climates. As a guideline, this methodology can be used to mitigate UHI in Indonesia and other tropical climates. In addition, it illustrates effective solutions that have been established based on local climate conditions. The focus on urban greening should be towards increasing evaporation and humidity at street level, as well as decreasing heat exposure through shading [19]. Planting vegetation along the streets, that is, across the entire area, is more successful than planting the same amount of vegetation in a designated green space [1]. Greening the streets can contribute to a significant reduction in radiation temperatures and the street canyon effect [44]. Planned green open space is the most commonly suggested strategy to reduce UHI in urban areas. Open spaces play a vital role in decreasing surface temperatures through the absorption of CO2 during photosynthesis. Considering that vegetation can cool surfaces effectively, these options are therefore useful in urban contexts that have already been constructed [4,6,7].
It is recommended that innovative designs of urban pavements are implemented to ensure a lower surface temperature [45]. Material with high thermal conductivity will absorb more heat, delaying cooling and increasing UHI effects [14,31]. The implementation of green infrastructure in cities can therefore improve pedestrian circulation and comfort, as well as reduce energy consumption.
UHI strongly impacts buildings, especially mid-rise buildings. Both the rising temperature outside and the heat generated by air conditioners in nearby high-rise buildings affect these buildings negatively. When planning an urban area, these areas should be the main focus.
Therefore, passive design should be considered in buildings that are currently being planned. Passive design is the most efficient way to reduce electricity, such as using cool roofs, window shadings, and cross ventilation. Shade and ventilation play a major role in reducing cooling load in tropical climates; however, air movement is dependent on the level of air pollution in the surroundings. It appears to be feasible to switch from air conditioning to passive design in modern urban and building planning. That is why it will be essential to consider design and analysis at an early stage of a new building. Design simulation tools are generally used by designers in order to analyze their designs; whether they can adapt to current or future climate change. Climate data analysis can be used to improve urban and building simulation tools by measuring temperature variations in cities. The simulation results can be modified and analyzed to determine the direct impact of UHI. It is particularly important to know the total energy consumption associated with cooling electricity.

7. Conclusions

Urbanization and changes to the landscape have affected buildings’ energy performance as well as human comfort, among other things. The growth of densely populated cities in the last couple of decades has resulted in UHI being developed in densely built areas that have higher temperatures than rural areas. In order to reduce urban heat island effects and mitigate global climate change, passive design methods must be implemented in today’s buildings.
Studies on UHI in tropical climates tend to be less extensive than those in temperate climates, but this study found some importance regarding buildings and their effects on UHI. In tropical areas, little research has been conducted on how to analyze weather data in detail. In order to understand how buildings must adapt to UHI, large variations in humidity, air movement, and terrain must be studied. The occupant schedule is another important research topic that needs to be pursued. Humans perform an important role in operating electricity in order to achieve comfort levels. Complete and detailed information will influence the UHI of a building’s design in a specific simulation setting.
Public awareness of UHI is essential. Behavioral studies and education for planners, designers, and the government also play an important role in reducing UHI. Informed citizens who may not be aware of UHI will be more likely to engage with simple information about how to use air conditioning more effectively and save energy. By analyzing heat islands, one can promote geographic planning and management, enhancing societal sustainability and creating healthier urban environments.

Funding

This research received no external funding.

Institutional Review Board Statement

Not applicable.

Informed Consent Statement

Not applicable.

Data Availability Statement

Not applicable.

Acknowledgments

This study was supported by the National Agency for Research and Innovation (BRIN), Indonesia.

Conflicts of Interest

The author declares no conflict of interest.

References

  1. Kotharkar, R.; Bagade, A.; Singh, P.R. A systematic approach for urban heat island mitigation strategies in critical local climate zones of an Indian city. Urban Clim. 2020, 34, 100701. [Google Scholar] [CrossRef]
  2. Chow, W.T.L.; Roth, M. Temporal dynamics of the urban heat island of Singapore. Int. J. Climatol. 2006, 26, 2243–2260. [Google Scholar] [CrossRef]
  3. Guattari, C.; Evangelisti, L.; Balaras, C.A. On the assessment of urban heat island phenomenon and its effects on building energy performance: A case study of Rome (Italy). Energy Build. 2018, 158, 605–615. [Google Scholar] [CrossRef]
  4. Herath, H.M.P.I.K.; Halwatura, R.U.; Jayasinghe, G.Y. Evaluation of green infrastructure effects on tropical Sri Lankan urban context as an urban heat island adaptation strategy. Urban For. Urban Green. 2018, 29, 212–222. [Google Scholar] [CrossRef]
  5. United Nations Climate Change. The Paris Agreements. 4 November 2016. Available online: https://unfccc.int/files/essential_background/convention/application/pdf/english_paris_agreement.pdf (accessed on 16 June 2020).
  6. Rushayati, S.B.; Prasetyo, L.B.; Puspaningsih, N.; Rachmawati, E. Adaptation strategy toward urban heat island at tropical urban area. Procedia Environ. Sci. 2016, 33, 221–229. [Google Scholar] [CrossRef] [Green Version]
  7. Dissegna, M.A.; Yin, T.; Wei, S.; Richards, D.; Grêt-Regamey, A. 3-D Reconstruction of an Urban Landscape to Assess the Influence of Vegetation in the Radiative Budget. Forests 2019, 10, 700. [Google Scholar] [CrossRef] [Green Version]
  8. Litardo, J.; Palme, M.; Borbor-Cordova, M.; Caiza, R.; Macias, J.; Hidalgo-Leon, R.; Soriano, G. Urban Heat Island intensity and buildings’ energy needs in Duran, Ecuador: Simulation studies and proposal of mitigation strategies. Sustain. Cities Soc. 2020, 62, 102387. [Google Scholar] [CrossRef]
  9. Jauregui, E. Bibliography of Urban Climate in Tropical/Subtropical Areas, 1981–1991; WMO/TD—No. 552, World Climate Applications and Services Programme (WCASP); World Meteorological Organization: Geneva, Switzerland, 1993; Volume 25, Available online: http://library.wmo.int/pmb_ged/wmo-td_552_en.pdf (accessed on 14 May 2021).
  10. Jauregui, E. Bibliography of Urban Climatology for the Period 1992–1995 Including a Special Section on Urban Climate in Tropical/Subtropical Areas; WMO/TD, World Climate Applications and Services Programme (WCASP)—No. 36; World Meteorological Organization: Geneva, Switzerland, 1996; Volume 759, Available online: http://library.wmo.int/pmb_ged/wmo-td_759_en.pdf (accessed on 14 May 2021).
  11. Kottek, M.; Grieser, J.; Beck, C.; Rudolf, B.; Rubel, F. World Map of the Köppen-Geiger climate classification updated. Meteorol. Z. 2006, 15, 259–263. [Google Scholar] [CrossRef]
  12. Herath, H.M.P.I.K.; Halwatura, R.U.; Jayasinghe, G.Y. Modeling a Tropical Urban Context with Green Walls and Green Roofs as an Urban Heat Island Adaptation Strategy. Procedia Eng. 2018, 212, 691–698. [Google Scholar] [CrossRef]
  13. Akkose, G.; Akgul, C.M.; Dino, I.G. Educational building retrofit under climate change and urban heat island effect. J. Build. Eng. 2021, 40, 102294. [Google Scholar] [CrossRef]
  14. Amorim, M.C.d.C.T. Daily evolution of urban heat islands in a Brazilian tropical continental climate during dry and rainy periods. Urban Clim. 2020, 34, 100715. [Google Scholar] [CrossRef]
  15. Zinzi, M.; Agnoli, S.; Burattini, C.; Mattoni, B. On the thermal response of buildings under the synergic effect of heat waves and urban heat island. Sol. Energy 2020, 211, 1270–1282. [Google Scholar] [CrossRef]
  16. Amorim, M.C.d.C.T.; Dubreuil, V. Intensity of Urban Heat Islands in Tropical and Temperate Climates. Climate 2017, 5, 91. [Google Scholar] [CrossRef] [Green Version]
  17. Dissegna, M.A.; Yin, T.; Wu, H.; Lauret, N.; Wei, S.; Gastellu-Etchegorry, J.P.; Grêt-Regamey, A. Modeling Mean Radiant Temperature Distribution in Urban Landscapes Using DART. Remote. Sens. 2021, 13, 1443. [Google Scholar] [CrossRef]
  18. United Nations. United Nations. World Urbanization Prospects; The 2018 Revision; United Nations: New York, NY, USA, 2019; ISBN 978-92-1-148319-2. [Google Scholar]
  19. Loibl, W.; Vuckovic, M.; Etminan, G.; Ratheiser, M.; Tschannett, S.; Österreicher, D. Effects of Densification on Urban Microclimate—A Case Study for the City of Vienna. Atmosphere 2021, 12, 511. [Google Scholar] [CrossRef]
  20. Lenzholzer, S.; Carsjens, G.J.; Brown, R.D.; Tavares, S.; Vanos, J.; Kim, Y.J.; Lee, K.H. Urban climate awareness and urgency to adapt: An international overview. Urban Clim. 2020, 33, 100667. [Google Scholar] [CrossRef]
  21. Singh, N.; Singh, S.; Mall, R.K. Urban ecology and human health: Implications of urban heat island, air pollution and climate change nexus. Urban Ecol. 2020, 17, 317–334. [Google Scholar] [CrossRef]
  22. Muniz-Gaal, L.P.; Pezzuto, C.C.; Henriques de Carvalho, M.F.; Mota, L.T.M. Urban geometry and the microclimate of street canyons in tropical climate. Build. Environ. 2020, 169, 106547. [Google Scholar] [CrossRef]
  23. Santamouris, M.; Cartalis, C.; Synnefa, A.; Kolokotsa, D. On the Impact of Urban Heat Island and Global Warming on the Power Demand and Electricity Consumption of Buildings—A Review. Energy Build. 2015, 98, 119–124. [Google Scholar] [CrossRef]
  24. Santamouris, M. On the Energy Impact of Urban Heat Island and Global Warming on Buildings. Energy Build. 2014, 82, 100–113. [Google Scholar] [CrossRef]
  25. Karin Lundgren and Tord Kjellstrom. Sustainability Challenges from Climate Change and Air Conditioning Use in Urban Areas. Sustainability 2013, 5, 3116–3128. [Google Scholar] [CrossRef] [Green Version]
  26. Kondo, K.; Mabon, L.; Bi, Y.; Chen, Y.; Hayabuchi, Y. Balancing conflicting mitigation and adaptation behaviours of urban residents under climate change and the urban heat island effect. Sustain. Cities Soc. 2021, 65, 102585. [Google Scholar] [CrossRef]
  27. Österreicher, D.; Sattler, S. Maintaining Comfortable Summertime Indoor Temperatures by Means of Passive Design Measures to Mitigate the Urban Heat Island Effect—A Sensitivity Analysis for Residential Buildings in the City of Vienna. Urban Sci. 2018, 2, 66. [Google Scholar] [CrossRef] [Green Version]
  28. Anjos, M.; Targino, A.C.; Krecl, P.; Oukawa, G.Y.; Braga, R.F. Analysis of the urban heat island under different synoptic patterns using local climate zones. Build. Environ. 2020, 185, 107268. [Google Scholar] [CrossRef]
  29. Cardoso, R.D.S.; Dorigon, L.P.; Teixeira, D.C.F.; Amorim, M.C.D.C.T. Assessment of Urban Heat Islands in Small- and Mid-Sized Cities in Brazil. Climate 2017, 5, 14. [Google Scholar] [CrossRef] [Green Version]
  30. Mughal, M.O.; Li, X.X.; Norford, L.K. Urban heat island mitigation in Singapore: Evaluation using WRF/multilayer urban canopy model and local climate zones. Urban Clim. 2020, 34, 100714. [Google Scholar] [CrossRef]
  31. Harun, Z.; Reda, E.; Abdulrazzaq, A.; Abbas, A.A.; Yusup, Y.; Zaki, S.A. Urban heat island in the modern tropical Kuala Lumpur: Comparative weight of the different parameters. Alex. Eng. J. 2020, 59, 4475–4489. [Google Scholar] [CrossRef]
  32. Lehoczky, A.; Sobrino, J.A.; Skoković, D.; Aguilar, E. The Urban Heat Island Effect in the City of Valencia: A Case Study for Hot Summer Days. Urban Sci. 2017, 1, 10–3390. [Google Scholar] [CrossRef] [Green Version]
  33. Simanjuntak, R.M.; Kuffer, M.; Reckien, D. Object-based image analysis to map local climate zones: The case of Bandung, Indonesia. Appl. Geogr. 2019, 106, 108–121. [Google Scholar] [CrossRef]
  34. Araque, K.; Palacios, P.; Mora, D.; Austin, M.C. Biomimicry-Based Strategies for Urban Heat Island Mitigation: A Numerical Case Study under Tropical Climate. Biomimetics 2021, 6, 48. [Google Scholar] [CrossRef]
  35. Chiesa, G.; Li, Y. Including Urban Heat Island in Bioclimatic Early-Design Phases: A Simplified Methodology and Sample Applications. Sustainability 2021, 13, 5918. [Google Scholar] [CrossRef]
  36. Leng, P.C.; Ahmad, M.H.; Ossen, D.R.; Ling, G.H.T.; Abdullah, S.; Aminudin, E.; Liew, W.L.; Chan, W.H. The Impact of Air Well Geometry in a Malaysian Single Storey Terraced House. Sustainability 2019, 11, 5730. [Google Scholar] [CrossRef] [Green Version]
  37. Lenzholzer, S.; Carsjens, G.J.; Brown, R.D.; Tavares, S.; Vanos, J.; Kim, Y.J.; Lee, K.H. Awareness of urban climate adaptation strategies –an international overview. Urban Clim. 2020, 34, 10070. [Google Scholar] [CrossRef]
  38. Palafox-Juárez, E.B.; López-Martínez, J.O.; Hernández-Stefanoni, J.L.; Hernández-Nuñez, H. Impact of Urban Land-Cover Changes on the Spatial-Temporal Land Surface Temperature in a Tropical City of Mexico. Int. J. Geo-Inf. 2021, 10, 76. [Google Scholar] [CrossRef]
  39. Yang, J.; Kumar, D.l.M.; Pyrgou, A.; Chong, A.; Santamouris, M.; Kolokotsa, D.; Lee, S.E. Green and cool roofs’ urban heat island mitigation potential in tropical climate. Sol. Energy 2018, 173, 597–609. [Google Scholar] [CrossRef]
  40. Landi, F.F.d.A.; Fabiani, C.; Pisello, A.L. Experimental Winter Monitoring of a Light-Weight Green Roof Assembly for Building Retrofit. Sustainability 2021, 13, 4604. [Google Scholar] [CrossRef]
  41. Narumi, D.; Levinson, R.; Shimoda, Y. Effect of Urban Heat Island and Global Warming Countermeasures on Heat Release and Carbon Dioxide Emissions from a Detached House. Atmosphere 2021, 12, 572. [Google Scholar] [CrossRef]
  42. Giridharan, R.; Emmanuel, R. The impact of urban compactness, comfort strategies and energy consumption on tropical urban heat island intensity: A review. Sustain. Cities Soc. 2018, 40, 677–687. [Google Scholar] [CrossRef] [Green Version]
  43. Kurniati, A.C.; Nitivattananon, V. Factors influencing urban heat island in Surabaya, Indonesia. Sustain. Cities Soc. 2016, 27, 99–105. [Google Scholar] [CrossRef]
  44. Bochenek, A.D.; Klemm, K. Effectiveness of Tree Pattern in Street Canyons on Thermal Conditions and Human Comfort. Assessment of an Urban Renewal Project in Historical District in Lodz (Poland). Atmosphere 2021, 12, 751. [Google Scholar] [CrossRef]
  45. Nwakaire, C.M.; Onn, C.C.; Yap, S.P.; Yue, C.W.; Onodagu, P.D. Urban Heat Island Studies with emphasis on urban pavements: A review. Sustain. Cities Soc. 2020, 63, 102476. [Google Scholar] [CrossRef]
Figure 1. Number of publications listed in ScienceDirect and MDPI under search terms “tropics”, “urban heat islands”, “energy consumption”, and “building”.
Earth 02 00038 g001
Figure 2. Causes of UHI in global and tropical climates.
Earth 02 00038 g002
Figure 3. Strategies for design in urban areas to reduce UHI phenomena.
Earth 02 00038 g003
Publisher’s Note: MDPI stays neutral with regard to jurisdictional claims in published maps and institutional affiliations.

