Abstract
Valuation of soil carbon (C) regulating ecosystem services (ES) at the state level is important for sustainable C management. The objective of this study was to assess the value of regulating ES from soil organic carbon (SOC), soil inorganic carbon (SIC), and total soil carbon (TSC) stocks, based on the concept of the avoided social cost of carbon dioxide (CO2) emissions for the state of New Hampshire (NH) in the United States of America (USA) by soil order and county using information from the State Soil Geographic (STATSGO) database. The total estimated monetary mid-point value for TSC stocks in the state of New Hampshire was $73.0B (i.e., 73.0 billion U.S. dollars (USD), where B = billion = 109), $64.8B for SOC stocks, and $8.1B for SIC stocks. Soil orders with the highest midpoint value for SOC were Histosols ($33.2B), Spodosols ($20.2B), and Inceptisols ($10.1B). Soil orders with the highest midpoint value for SIC were Inceptisols ($5.8B), Spodosols ($1.0B), and Entisols ($770M, where M = million = 106). Soil orders with the highest midpoint value for TSC were Histosols ($33.8B), Spodosols ($21.2B), and Inceptisols ($15.9B). The counties with the highest midpoint SOC values were Rockingham ($15.4B), Hillsborough ($9.8B), and Coös ($9.2B). The counties with the highest midpoint SIC values were Merrimack ($1.2B), Coös ($1.1B), and Rockingham ($1.0B). The counties with the highest midpoint TSC values were Rockingham ($16.5B), Hillsborough ($10.8B), and Coös ($10.3B). New Hampshire has experienced land use/land cover (LULC) changes between 2001 and 2016. The changes in LULC across the state have not been uniform, but rather have varied by county, soil order, and pre-existing land cover. The counties that have exhibited the most development (e.g., Rockingham, Hillsborough, Merrimack) are those nearest the urban center of Boston, MA. Most soil orders have experienced losses in “low disturbance” land covers (e.g., evergreen forest, hay/pasture) and gains in “high disturbance” land covers (e.g., low-, medium-, and high-intensity developed land). In particular, Histosols are a high-risk carbon “hotspot” that contributes over 50% of the total estimated sequestration of SOC in New Hampshire while covering only 7% of the total land area. Integration of pedodiversity concepts with administrative units can be useful to design soil- and land-cover specific, cost-efficient policies to manage soil C regulating ES in New Hampshire at various administrative levels.
1. Introduction
Determining the value of soil carbon is critical for achieving the United Nations (UN) Sustainable Development Goals (SDGs), especially SDG 13: “Take urgent action to combat climate change and its impacts on future climate” [1]. The ecosystem services (ES) framework is frequently utilized with UN SDGs because it is aimed at the valuation of benefits (ES) and/or ecosystem disservices (ED) people obtain from nature based on three general categories of services: provisioning, regulating/maintenance, and cultural services [2]. Soil carbon regulating ES/ED are associated with the sequestration/stocks of soil organic carbon (SOC) (derived from living matter), soil inorganic carbon (SIC) (different types of carbonates), and total soil carbon (TSC = SOC + SIC), which vary with geographic location and soil type. Soil carbon sequestration in the forms of SOC and SIC is an ES, which results in “avoided” social costs associated with the emission of carbon dioxide (CO2) to the atmosphere [3]. Release of CO2 to the atmosphere from losses of SOC and SIC is an ED, which results in “realized” social costs [3,4].
Traditionally, soil resources are primarily valued for their provisioning ES (e.g., food production) with limited consideration of regulating ES (e.g., carbon sequestration), but increased concerns over global warming require assessment of soil ED associated with greenhouse gas emissions from soils [5,6]. Soil C regulating ES/ED are dependent on soil pedodiversity, which defines a soil “portfolio” and its SOC, SIC, and TSC stocks in a geographic area under various land covers [3]. For example, the state of New Hampshire has five soil orders (Entisols, Inceptisols, Histosols, Mollisols, and Spodosols) with soil-specific characteristics and constraints related to soil ES/ED, which are all part of the intricate mosaic of land use/land covers (LULC) within the landscape [7] (Table 1, Figure 1). Soils of New Hampshire have undergone three varying degrees of weathering: slightly weathered (Entisols, Inceptisols, Histosols), moderately weathered (Mollisols), and strongly weathered (Spodosols) (Table 1). Entisols (5% of the total area) and Inceptisols (36%) contain low soil C contents with limited capacity to sequester C because of their slight degree of weathering and soil development [8]. Spodosols are common soils in New Hampshire (52% of the total area) and contain low soil C contents in their mineral horizons because of their strong degree of weathering and soil development [8]. New Hampshire selected Spodosols to be the State Soil (soil series name: Marlow) for its importance in timber production [9]. Jevon et al. [10] conducted research on soil C stocks and concentrations in an actively managed forest of northern New Hampshire and reported lower soil C in this managed forest compared to less disturbed forests in the state. In addition, Jevon et al. [10] reported “legacy” effects of previous management decisions in the vertical distribution of SOC.

Table 1.
Soil diversity (pedodiversity) is expressed as taxonomic diversity at the level of soil order and ecosystem service types in New Hampshire (U.S.A.) (adapted from Mikhailova et al., 2021 [3]).
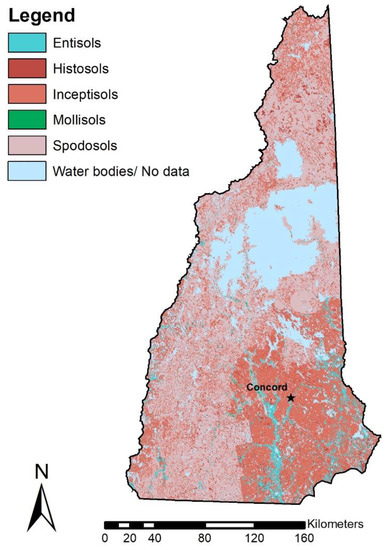
Figure 1.
General soil map of New Hampshire (U.S.A.) (Latitude: 42° 42′ N to 45° 18′ N; Longitude: 70° 36′ W to 72° 33′ W) (adapted from [11]).
Although limited in their soil C regulating ES, Entisols, Inceptisols, and Spodosols serve important cultural ES (e.g., recreation) as documented by research on soils of the White Mountains of New Hampshire and their suitability for recreational development [12].
Mollisols are nutrient-rich soils high in C, but they are almost negligible in New Hampshire. Histosols (7% of the total area) are organic carbon-rich soils commonly found in different types of wetlands and can be a large source of greenhouse gas emissions from changes in LULC (e.g., drainage, development, etc.) [13].
The ES framework is increasingly being used as “an operational framework” [14], but because of “the difficulty in relating soil properties to ES, soil ES are still not fully considered in the territorial planning decision process” [14]. Past research on avoided social costs of SOC, SIC, and TSC in the USA has been conducted at various scales using both biophysical (e.g., soil orders) and administrative accounts (e.g., states, regions, counties, farm, etc.) [15,16,17,18], and has shown the need for soil- and carbon-specific management strategies at the state level. The hypothesis of this study is that pedodiversity (e.g., taxonomic categories) overlaid with administrative units (Figure 1 and Figure 2) can be used to locate spatial patterns of soil carbon hotspots for sustainable carbon management in the state of New Hampshire.
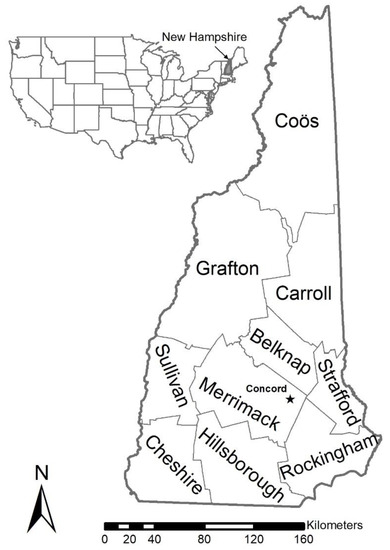
Figure 2.
Administrative map of New Hampshire (U.S.A.) (Latitude: 42° 42′ N to 45° 18′ N; Longitude: 70° 36′ W to 72° 33′ W) with 10 counties [21].
The specific objective of this study was to assess the value of SOC, SIC, and TSC in the state of New Hampshire (USA) based on the social cost of carbon (SC–CO2) and avoided emissions provided by carbon sequestration, which the U.S. Environmental Protection Agency (EPA) has determined to be $46 per metric ton of CO2, applicable for the year 2025 based on 2007 U.S. dollars and an average discount rate of 3% [19]. Our calculations provide estimates for the monetary values of SOC, SIC, and TSC across the state and by different spatial aggregation levels (i.e., county) using the State Soil Geographic (STATSGO) database and information previously reported by Guo et al. [20].
2. Materials and Methods
This study used both biophysical (science-based, Figure 1) and administrative (boundary-based, Figure 2) accounts to calculate monetary values for SOC, SIC, and TSC (Table 2 and Table 3).
Table 2.
A conceptual overview of the accounting framework used in this study (adapted from Groshans et al., 2018 [16]).
Table 3.
Soil diversity (pedodiversity) by soil order (taxonomic pedodiversity) and county in New Hampshire (U.S.A.) based on Soil Survey Geographic (SSURGO) Database (2020) [11].
The present study estimates monetary values associated with stocks of SOC, SIC, and TSC in New Hampshire based on reported contents (in kg m−2) from Guo et al. [20]. Values were calculated using the avoided social cost of carbon (SC-CO2) of $46 per metric ton of CO2, applicable for 2025 based on 2007 U.S. dollars and an average discount rate of 3% [19]. According to the EPA, the SC-CO2 is intended to be a comprehensive estimate of climate change damages. Still, it can underestimate the true damages and cost of CO2 emissions due to the exclusion of various important climate change impacts recognized in the literature [19]. Area-normalized monetary values ($ m−2) were calculated using Equation (1), and total monetary values were summed over the appropriate area(s) (noting that a metric ton is equivalent to 1 megagram (Mg) or 100 kilograms (kg)):
Table 4 presents area-normalized contents (kg m−2) and monetary values ($ m−2) of soil carbon, which were used to estimate stocks of SOC, SIC, and TSC and their corresponding values by multiplying the contents/values by the area of a particular soil order within a county (Table 3). For example, for the soil order Inceptisols, Guo et al. [20] reported a midpoint SOC content of 8.9 kg∙m−2 for the upper 2-m soil depth (Table 4). Using this SOC content in Equation (1) results in an area-normalized SOC value of $1.50 m−2. Multiplying the SOC content and its corresponding area-normalized value each by the total area of Inceptisols present in New Hampshire (6744 km2, Table 3) results in an SOC stock of 6.0 × 10¹⁰ kg (Table 5) with an estimated monetary value of $10.1B (Table 6).
Table 4.
Area-normalized content (kg m−2) and monetary values ($ m−2) of soil organic carbon (SOC), soil inorganic carbon (SIC), and total soil carbon (TSC) by soil order based on data reported by Guo et al. [20] for the upper 2 m of soil and an avoided social cost of carbon (SC-CO2) of $46 per metric ton of CO2 (2007 U.S. dollars with an average discount rate of 3% [19]).
Land use/land cover change in New Hampshire between 2001 and 2016 was analyzed using classified land cover data from the Multi-Resolution Land Characteristics Consortium (MRLC) [22]. Changes in land cover, with their associated soil types, were calculated in ArcMap 10.7 [23] by comparing the 2001 and 2016 data, converting the land cover to vector format, and unioning the data with the soils layer in the Soil Survey Geographic (SSURGO) Database [11].
3. Results
Based on avoided SC–CO2, the total estimated monetary mid-point value for TSC in the state of New Hampshire was $73.0B (i.e., 73.0 billion U.S. dollars, where B = billion = 109), $64.8B for SOC (89% of the total value), and $8.1B for SIC (11% of the total value). Previously, we have reported that among the 48 conterminous states of the U.S., New Hampshire ranked 40th for TSC [18], 40th for SOC [15], and 45th for SIC [16].
3.1. Storage and Value of SOC by Soil Order and County for New Hampshire
Soil orders with the highest midpoint monetary value for SOC were Histosols ($33.2B), Spodosols ($20.2B), and Inceptisols ($10.1B) (Table 5 and Table 6). The counties with the highest midpoint SOC values were Rockingham ($15.4B), Hillsborough ($9.8B), and Coös ($9.2B) (Table 5 and Table 6). Rockingham has the largest area occupied by Histosols (Table 3), which has a high SOC midpoint content (140.1 kg m−2; Table 4) and therefore a corresponding high monetary value of $13.8B (Table 6). Note that soil survey data can overestimate SOC contents, because SOC is extrapolated with soil depth [17]. Despite this limitation, the overall trends for soil orders and counties should be informative in sustainable soil C management.
3.2. Storage and Value of SIC by Soil Order and County for the State of New Hampshire
Soil orders with the highest midpoint monetary value for SIC were: Inceptisols ($5.8B), Spodosols ($1.0B), and Entisols ($770M, where M = million = 106) (Table 7 and Table 8). The counties with the highest midpoint SIC values were Merrimack ($1.2B), Coös ($1.1B), and Rockingham ($1.0B) (Table 7 and Table 8). Similar to SOC data, SIC is typically extrapolated with soil depth and can be overestimated by soil survey data [17]. Again, however, the overall trends for soil orders and counties are informative for sustainable soil C management.
3.3. Storage and Value of TSC (SOC + SIC) by Soil Order and County for New Hampshire
Soil orders with the highest midpoint monetary value for TSC were Histosols ($33.8B), Spodosols ($21.2B), and Inceptisols ($15.9B) (Table 9 and Table 10). The counties with the highest midpoint TSC values were Rockingham ($16.5B), Hillsborough ($10.8B), and Coös ($10.3B) (Table 9 and Table 10). These rankings are the same as for SOC and reflect the dominant contribution of SOC to TSC in the State.
3.4. Land Use/Land Cover Change by Soil Order in New Hampshire from 2001 to 2016
New Hampshire experienced changes in land use/land cover (LULC) over the 15-year period from 2001 to 2016 (Table 11, Figure 3). Changes varied by soil order and original LULC classification, with most soil orders experiencing area losses in “low disturbance” LULC classes (e.g., evergreen forest, hay/pasture) while gaining in the areas of “developed” LULC classes. The most dramatic increases in developed land areas occurred in Rockingham, Hillsborough, Merrimack, and Belknap counties, which are all in the southern part of the state and geographically closest to the urban centers of Boston, MA, and Concord, the state capital of New Hampshire. More detailed spatial and temporal analyses of land cover can identify critical locations of soil carbon regulating ecosystem services at risk.
Table 11.
Land use/land cover (LULC) change by soil order in New Hampshire (USA) from 2001 to 2016.
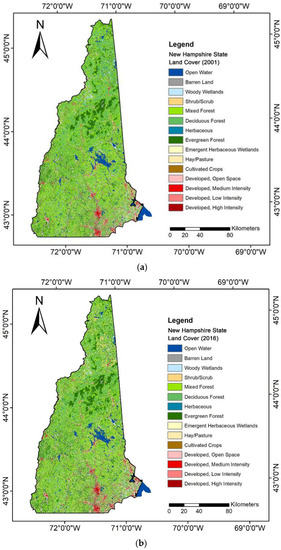
Figure 3.
Land cover maps of New Hampshire (U.S.A.): (a) 2001, (b) 2016 (Latitude: 42° 42′ N to 45° 18′ N; Longitude: 70° 36′ W to 72° 33′ W) [21].
4. Discussion
Pedodiversity (soil diversity) in New Hampshire impacts the level of various soil ES goods and services and will play a role in potential soil ecosystem disservices (ED) under certain conditions. This study demonstrates the value of regulating ES/ED at the state and county levels. The New Hampshire soil “portfolio” [3] is composed of five soil orders: Entisols (5% of the total soil area), Inceptisols (36%), Histosols (7%), Mollisols (< 0.02%), and Spodosols (52%) (Figure 1, Table 3, Figure 4a). Highly weathered Spodosols account for the largest fraction of area in the state, but they are not the largest contributor to soil C regulating ES. Rather, because of their high SOC content, Histosols are a carbon “hotspot” that contributes over 50% of the total monetary value for SOC in the state while covering only 7% of the state’s area. The relative contribution of SIC to soil C regulating ES is small at the state and county levels and is primarily associated with Inceptisols, Spodosols, and Entisols.
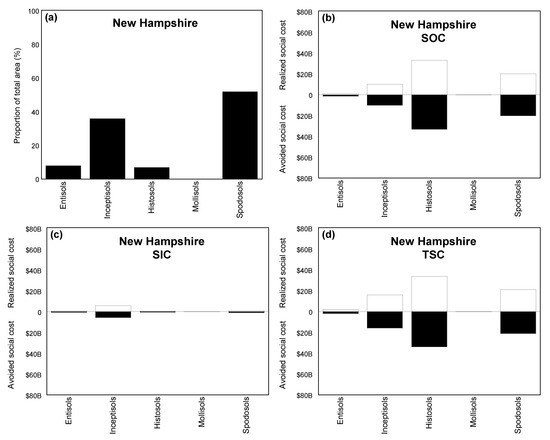
Figure 4.
Diagram showing how the “portfolio-effect” and “distribution-effect” of pedodiversity can vary within the state by soil order: (a) pedodiversity by area of soil order; (b) monetary value of soil organic carbon (SOC) storage or potential cost if all SOC is released as CO2 emissions, (c) similar value or potential cost associated with soil inorganic carbon (SIC), (d) similar value or potential cost associated with total soil carbon (TSC). Monetary valuation is based on soil C in the upper 2-m depth and a social cost of CO2 emission of $46 (USD) per metric ton of CO2 [19]. Note: B = billion = 109.
Soil “portfolios” differ within each county in New Hampshire, as illustrated by three example counties: Coös, Strafford, and Rockingham (Figure 5). In all three examples, pedodiversity influences the monetary value of regulating ES or potential ED.
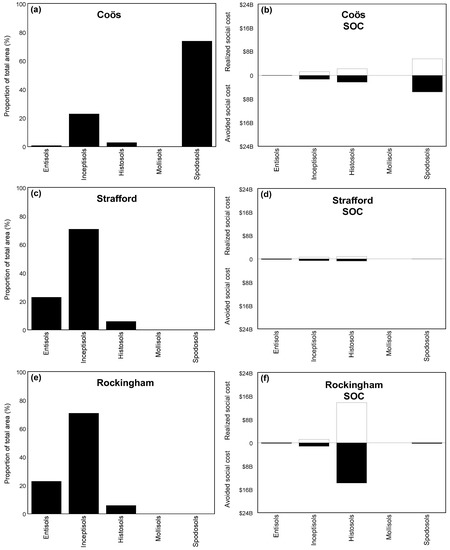
Figure 5.
Diagram showing how the “portfolio-effect” and “distribution-effect” of pedodiversity varies within counties by soil order: (a,c,e) pedodiversity by area of soil order; (b,d,f) monetary value of soil organic carbon (SOC) storage or potential cost if all SOC is released as CO2 emissions. Monetary valuation is based on soil C in the upper 2-m depth and a social cost of CO2 emission of $46 (USD) per metric ton of CO2 [19]. Note: B = billion = 109.
The concepts of “avoided” and “realized” social costs demonstrate different interpretations of the regulating ES/ED associated with soil carbon. For example, “avoided” social cost refers to the benefits of sequestered soil C, because it is not emitted to the atmosphere as CO2. Conversely, “realized” soil cost refers to damages resulting from CO2 emissions. In Figure 4 and Figure 5, “realized” is taken to be the maximum potential cost that would occur if all stocks of sequestered soil carbon were released to the atmosphere as CO2. For example, in Coös County, the soil order Spodosols make the largest contribution to the SC–CO2 because of their dominant area (Figure 5a,b). In Strafford County, the largest area is occupied by Inceptisols, but their relatively small area overall and low soil carbon stocks translate into relatively small monetary values for the SC–CO2 (Figure 5c,d). In Rockingham County, Histosols occupy a relatively small area compared to Entisols and Inceptisols but make the largest contribution to the SC–CO2 (Figure 5e,f). In New Hampshire, Histosols are particularly sensitive to climate change and LULC changes because of their relatively high soil C content. Therefore, Histosols may experience higher decomposition rates due to increases in temperature and precipitation. All soils in the State of New Hampshire have low recarbonization potential because of various reasons (e.g., high economic cost of soil C sequestration, climate change, etc.) (Table 12).
According to Bétard and Peulvast [25], soils can become carbon “hotspots” when they are disturbed (e.g., tillage, erosion, etc.) and release CO2 to the atmosphere, resulting in maximum (i.e., complete loss of sequestered C) or fractional (i.e., partial loss of sequestered C) “realized” costs because of damages associated with global warming, extreme weather events, flooding, etc. Changes in LULC can also be types of disturbance with potential for “realized” social costs. Table 13 and Table 14 provide maximum potential estimates of “realized” costs by soil order for land in New Hampshire that was developed from low- to high-disturbance LULC classes from 2001 to 2016.
Table 14.
Impacts of land development on the maximum potential realized social costs of carbon dioxide (SC-CO2) from total soil carbon (TSC) in New Hampshire (USA) from 2001 to 2016 by county.
In Table 13, the conservative assumption was made that land developed over the time period of interest had no soil carbon stocks remaining in 2016, consistent with IPCC guidelines for Tier 1 evaluations of changes in LULC [26,27]. Monetary values of maximum potential “realized” social cost depend on the area of disturbance and the soil type with its corresponding TSC content. For example, Histosols are a “hotspot” of carbon sequestration, but are vulnerable to development. From 2001 to 2016, development on Histosols in New Hampshire has resulted in a maximum potential realized social cost of over $440M (Table 13).
Integration of pedodiversity concepts with LULC classes and administrative units (e.g., counties) enable researchers and policy makers to identify locations and magnitudes of maximum potential “realized” social costs of soil carbon so that cost-effective policies for sustainable soil carbon management can be developed (Table 14). For example, land development in Rockingham County from 2001 to 2016 resulted in the highest SC-CO2 ($323M), followed by Hillsborough ($241M) and Merrimack ($25M) counties (Table 14).
Changes in LULC are available through this analysis in a spatially explicit manner, so the location and extent of these potential “hotspots” can be identified on the landscape. Furthermore, areas adjacent to locations that have been subject to development may be more vulnerable to future “contagious” development [28], which is especially dangerous for high-risk Histosols because of their high C content. In the future, identifying areas of possible hotspots, over time, using land cover change analysis will become an important tool for carbon accounting.
5. Conclusions
This study applied soil diversity (pedodiversity) concepts (taxonomic) and their measures to value soil C regulating ES/ED in the state of New Hampshire (USA), its administrative units (counties), and the systems of soil classification (e.g., U.S. Department of Agriculture (USDA) Soil Taxonomy, Soil Survey Geographic (SSURGO) Database) for sustainable soil C management. Taxonomic pedodiversity in New Hampshire exhibits high soil diversity (five soil orders: Entisols, Inceptisols, Histosols, Mollisols, and Spodosols), which is not evenly distributed within the state and counties. Spodosols occupy the highest proportion of the state area (52%) but ranked only second (after Histosols) in terms of their SOC storage and related social costs of carbon ($20.2B). Despite a relatively small area (7% of the total soil area), Histosols contribute $33.2B (51%) to the social cost of SOC, and $33.8B (46%) to the social cost of TSC. The contribution of SIC to associated social costs of carbon is small ($8.1B) at the state level and primarily associated with Inceptisols ($5.8B), Spodosols ($978.1M), and Entisols ($767.6M). In the state of New Hampshire, Histosols are particularly sensitive to climate change because of their relatively high soil C content, which is most likely to experience higher rates of decomposition due to global warming with increases in temperature and precipitation. All soils in the state of New Hampshire have low recarbonization potential [18,29]. New Hampshire experienced land cover changes between 2001 and 2016, which varied by soil order and land cover, with most soil orders experiencing losses in “low disturbance” land covers (e.g., evergreen forest, hay/pasture) and gains in “high disturbance” land covers (open, low, medium, and high intensity developed land) with most maximum potential “realized” social costs of C associated with all soil orders ($648M), but Histosols ($445M) in particular. Rockingham County generated the highest SC-CO2 ($323M), followed by Hillsborough ($241M) and Merrimack ($25M) counties. Administrative areas (e.g., counties) combined with pedodiversity concepts can provide useful information to design soil- and land-cover specific, cost-efficient policies to manage soil carbon regulating ES in the state of New Hampshire at various administrative levels.
Author Contributions
conceptualization, E.A.M.; methodology, E.A.M., M.A.S. and H.A.Z.; formal analysis, E.A.M.; writing—original draft preparation, E.A.M.; writing—review and editing, E.A.M., C.J.P., G.C.P. and M.A.S.; visualization, H.A.Z., L.L. and Z.H. All authors have read and agreed to the published version of the manuscript.
Funding
This research received no external funding.
Institutional Review Board Statement
Not applicable.
Informed Consent Statement
Not applicable.
Acknowledgments
We would like to thank the reviewers for their constructive comments and suggestions.
Conflicts of Interest
The authors declare no conflict of interest.
Glossary
| ED | Ecosystem disservices |
| ES | Ecosystem services |
| EPA | Environmental Protection Agency |
| SC-CO2 | Social cost of carbon emissions |
| SDGs | Sustainable Development Goals |
| SOC | Soil organic carbon |
| SIC | Soil inorganic carbon |
| SOM | Soil organic matter |
| SSURGO | Soil Survey Geographic Database |
| TSC | Total soil carbon |
| USDA | United States Department of Agriculture |
| U.S.A. | United States of America |
References
- Keestra, S.D.; Bouma, J.; Wallinga, J.; Tittonell, P.; Smith, P.; Cerda, A.; Montanarella, L.; Quinton, J.N.; Pachepsky, Y.; Van der Putten, W.H.; et al. The significance of soils and soil science towards realization of the United Nations Sustainable Development Goals. Soil 2016, 2, 111–128. [Google Scholar] [CrossRef]
- Wood, S.L.; Jones, S.K.; Johnson, J.A.; Brauman, K.A.; Chaplin-Kramer, R.; Fremier, A.; Girvetz, E.; Gordon, L.J.; Kappel, C.V.; Mandle, L.; et al. Distilling the role of ecosystem services in the Sustainable Development Goals. Ecosyt. Serv. 2017, 29, 701–782. [Google Scholar] [CrossRef]
- Mikhailova, E.A.; Zurqani, H.A.; Post, C.J.; Schlautman, M.A.; Post, C.J. Soil diversity (pedodiversity) and ecosystem services. Land 2021, 10, 288. [Google Scholar] [CrossRef]
- Zamanian, K.; Zhou, J.; Kuzyakov, Y. Soil carbonates: The unaccounted, irrecoverable carbon source. Geoderma 2021, 384, 114817. [Google Scholar] [CrossRef]
- Adhikari, K.; Hartemink, A.E. Linking soils to ecosystem services—A global review. Geoderma 2016, 262, 101–111. [Google Scholar] [CrossRef]
- Baveye, P.; Baveye, J.; Gowdy, J. Soil “ecosystem” services and natural capital: Critical appraisal of research on uncertain ground. Front. Environ. Sci. 2016, 4, 41. [Google Scholar] [CrossRef]
- Amundson, R.; Biardeau, L. Soil carbon sequestration is an elusive climate mitigation tool. Proc. Natl. Acad. Sci. USA 2018, 115, 11652–11656. [Google Scholar] [CrossRef] [PubMed]
- Plaster, E.J. Soil Science and Management, 4th ed.; Delmar Learning Inc.: Clifton Park, NY, USA, 2013; ISBN 0766839362. [Google Scholar]
- USDA/NRCS. State Soils. Available online: https://www.nrcs.usda.gov/wps/portal/nrcs/detail/soils/edu/?cid=stelprdb1236841 (accessed on 1 April 2021).
- Jevon, F.V.; D’Amato, A.W.; Woodall, C.W.; Evans, K.; Ayres, M.P.; Matthes, J.H. Tree basal area and conifer abundance predict soil carbon stocks and concentrations in an actively managed forest of northern New Hampshire, USA. Forest Ecol. Manag. 2019, 451, 117534. [Google Scholar] [CrossRef]
- Soil Survey Staff, Natural Resources Conservation Service, United States Department of Agriculture. Soil Survey Geographic (SSURGO) Database. Available online: https://nrcs.app.box.com/v/soils (accessed on 10 September 2020).
- Bailey, G.D.; Pilgrim, S.A.L. Soils of the White Mountains of New Hampshire and their suitability for recreational development. Mt. Res. Dev. 1983, 3, 53–60. [Google Scholar] [CrossRef]
- Wright, A.L.; Inglett, P.W. Soil organic carbon and nitrogen and distribution of carbon-13 and nitrogen-15 in aggregates of Everglades Histosols. Soil Sci. Soc. Am. J. 2009, 73, 427–433. [Google Scholar] [CrossRef]
- Fossey, M.; Angers, D.; Bustany, C.; Cudennec, C.; Durand, P.; Gascuel-Odoux, C.; Jaffrezic, A.; Pérès, G.; Besse, C.; Walter, C. A framework to consider soil ecosystem services in territorial planning. Front. Environ. Sci. 2020, 8, 28. [Google Scholar] [CrossRef]
- Mikhailova, E.A.; Groshans, G.R.; Post, C.J.; Schlautman, M.A.; Post, G.C. Valuation of soil organic carbon stocks in the contiguous United States based on the avoided social cost of carbon emissions. Resources 2019, 8, 153. [Google Scholar] [CrossRef]
- Groshans, G.R.; Mikhailova, E.A.; Post, C.J.; Schlautman, M.A.; Zhang, L. Determining the value of soil inorganic carbon stocks in the contiguous United States based on the avoided social cost of carbon emissions. Resources 2019, 8, 119. [Google Scholar] [CrossRef]
- Mikhailova, E.A.; Post, C.J.; Schlautman, M.A.; Post, C.J.; Zurqani, H.A. Determining farm-scale site-specific monetary values of “soil carbon hotspots” based on avoided social costs of CO2 emissions. Cogent Environ. Sci. 2020, 6, 1–1817289. [Google Scholar] [CrossRef]
- Mikhailova, E.A.; Groshans, G.R.; Post, C.J.; Schlautman, M.A.; Post, C.J. Valuation of total soil carbon stocks in the contiguous United States based on the avoided social cost of carbon emissions. Resources 2019, 8, 157. [Google Scholar] [CrossRef]
- EPA (United States Environmental Protection Agency). The Social Cost of Carbon. EPA Fact Sheet. 2016. Available online: https://19january2017snapshot.epa.gov/climatechange/social-cost-carbon_.html (accessed on 15 March 2021).
- Guo, Y.; Amundson, R.; Gong, P.; Yu, Q. Quantity and spatial variability of soil carbon in the conterminous United States. Soil Sci. Soc. Am. J. 2006, 70, 590–600. [Google Scholar] [CrossRef]
- The United States Census Bureau, 2018 TIGER/Line Boundary Shapefiles. Available online: https://www.census.gov/geographies/mapping-files/time-series/geo/tiger-line-file.2018.html (accessed on 10 March 2021).
- Multi-Resolution Land Characteristics Consortium (MRLC). Available online: https://www.mrlc.gov/ (accessed on 1 March 2021).
- ESRI (Environmental Systems Research Institute). ArcMap 10.7. Available online: https://support.esri.com/en/products/desktop/arcgis-desktop/arcmap/10-7-1 (accessed on 1 March 2021).
- Soil Survey Staff, Natural Resources Conservation Service, United States Department of Agriculture. Photos of Soil Orders. Available online: https://www.nrcs.usda.gov/wps/portal/nrcs/detail/soils/edu/?cid=nrcs142p2_053588 (accessed on 20 February 2021).
- Bétard, F.; Peulvast, J. Geodiversity hotspots: Concept, method and cartographic application for geoconservation purposes at a regional scale. Environ. Manag. 2019, 63, 822–834. [Google Scholar] [CrossRef] [PubMed]
- IPCC (International Panel on Climate Change). Guidelines for National Greenhouse Gas Inventories. AFOLU (Agriculture, Forestry and Other Land Use). 2006. Available online: http://www.ipcc-nggip.iges.or.jp/public/2006gl/vol4.html (accessed on 10 March 2021).
- Sallustio, L.; Quatrini, V.; Geneletti, D.; Corona, P.; Marchetti, M. Assessing land take by urban development and its impact on carbon storage: Findings from two case studies in Italy. Environ. Impact Assess. Rev. 2015, 54, 80–90. [Google Scholar] [CrossRef]
- Robalino, J.A.; Pfaff, A. Contagious development: Neighbor interactions in deforestation. J. Dev. Econ. 2012, 97, 427–436. [Google Scholar] [CrossRef]
- Schlesinger, W.H.; Amundson, R. Managing for soil carbon sequestration: Let’s get realistic. Glob. Chang. Biol. 2019, 25, 386–389. [Google Scholar] [CrossRef] [PubMed]


Publisher’s Note: MDPI stays neutral with regard to jurisdictional claims in published maps and institutional affiliations. |
© 2021 by the authors. Licensee MDPI, Basel, Switzerland. This article is an open access article distributed under the terms and conditions of the Creative Commons Attribution (CC BY) license (https://creativecommons.org/licenses/by/4.0/).