1. Introduction
With the continuous advancement of China’s “carbon peaking and carbon neutrality” strategic goals, renewable energy sources—particularly wind and photovoltaic generation—have been increasingly integrated into modern power systems [
1,
2]. While this transition promotes the low-carbon transformation of the energy structure, it has also fundamentally reshaped the dynamic characteristics of power systems. In particular, the large-scale deployment of power electronic-interfaced devices has significantly reduced system inertia and altered control interactions among system components, causing wide-band oscillations to emerge as a prominent threat to power grid security and stable operation [
3,
4]. Such oscillations typically span a wide frequency range from several hertz to several hundred hertz and are driven by highly complex and nonlinear coupling mechanisms. If not effectively mitigated in a timely manner, wide-band oscillations may propagate throughout the system, leading to equipment performance degradation, protection malfunctions, and, in extreme cases, cascading failures and large-scale blackouts [
5,
6].
To address the increasingly complex oscillation phenomena in modern power systems, data-driven techniques for oscillation detection, risk assessment, and mitigation have attracted widespread research attention in recent years [
7]. Compared with traditional model-driven approaches—such as Prony analysis, Matrix Pencil, and Hilbert–Huang Transform, which often struggle with nonlinearity and non-stationarity in modern power electronic-dominated systems [
8,
9], data-driven methods, especially those based on deep learning, exhibit superior capabilities in nonlinear modeling and adaptability to complex operating conditions. However, the effectiveness of these methods largely depends on the availability of large-scale, diverse, and high-quality scenario data [
10]. In practical power grid operation, destructive wide-band oscillation events occur infrequently due to conservative operational strategies and the presence of protection systems, resulting in a very limited number of measurable or simulated oscillation scenarios [
11]. This severe imbalance between data demand and data availability, commonly referred to as the “scenario scarcity” problem, has become a critical bottleneck that restricts the reliable application of data-driven approaches in oscillation identification, risk assessment, and control strategy validation [
12].
To alleviate the shortage of scenario data, Generative Adversarial Networks (GANs) have gradually been introduced into power system research as a powerful data generation framework [
13]. Existing studies have demonstrated the effectiveness of GANs in load profile generation [
14], wind and photovoltaic power output scenario construction [
15,
16], as well as fault and disturbance data generation [
17]. Nevertheless, directly applying conventional GAN architectures to wide-band oscillation risk scenario generation still faces significant challenges. Most existing GAN-based methods primarily focus on reproducing the time-domain waveform characteristics of oscillatory signals, treating the generation task as a simple signal reconstruction problem [
18]. Consequently, they pay insufficient attention to the accuracy of frequency-domain spectral features. For oscillation mechanism analysis and risk assessment, frequency-domain information—such as dominant oscillation modes, damping ratios, spectral energy distribution, and harmonic components—is essential for revealing the underlying physical nature and quantifying system risk. Once frequency-domain characteristics are distorted, even if the time-domain waveform appears reasonable, the credibility and practical value of the generated scenarios for engineering applications will be substantially reduced [
19,
20].
In recent years, some studies have attempted to incorporate time–frequency analysis techniques, such as the Short-Time Fourier Transform (STFT) or Wavelet Transform, into generative models to enhance the representation of non-stationary oscillatory signals [
21]. However, a critical limitation persists: in most existing works, time–frequency analysis is still treated merely as a feature extraction or preprocessing step prior to model input, rather than being fully integrated into an end-to-end generative modeling and joint optimization framework [
22]. This decoupled architecture leads to a fundamental dilemma: models optimized solely for time-domain reconstruction often fail to preserve spectral coherence, while those focusing on frequency features tend to lose temporal details. As a result, these models often achieve satisfactory performance in either the time domain or the frequency domain alone, but struggle to simultaneously preserve waveform realism and spectral accuracy. This limitation inevitably leads to performance trade-offs and restricts their applicability in practical oscillation risk analysis tasks that demand both temporal fidelity and physical interpretability [
23,
24].
Motivated by the above challenges, this paper proposes a Time–Frequency Fusion Generative Adversarial Network (TFF-GAN) for wide-band oscillation risk scenario generation in power systems. By explicitly modeling and jointly optimizing time-domain and frequency-domain characteristics, the proposed approach aims to generate oscillation scenarios that exhibit high realism in the time domain while maintaining strong physical consistency in the frequency domain. The main contributions of this paper are summarized as follows:
- (1)
Dual-path time–frequency generation architecture: A generator structure with parallel processing of time-domain signals and frequency-domain representations is designed, effectively overcoming the limitations of traditional single-structure generative models in modeling wide-band spectral characteristics.
- (2)
U-Net-based time–frequency fusion mechanism: A fusion module based on U-Net with skip connections is introduced to achieve deep integration of multi-scale features from both the time and frequency domains, ensuring coordination, consistency, and physical plausibility of the generated oscillation scenarios across the two domains.
- (3)
Time–frequency-aware composite loss function: A comprehensive optimization objective is constructed by combining time-domain similarity loss, frequency-domain distribution loss inspired by spectral losses in audio generation, and adversarial loss, guiding the model to achieve high-fidelity scenario generation simultaneously in both the time and frequency domains.
3. Time–Frequency Fusion Generative Adversarial Network (TFF-GAN)
Wide-band oscillation signals exhibit pronounced non-stationarity and multimodal characteristics, where oscillatory components may evolve dynamically across both time and frequency domains. In the time domain, such signals are characterized by oscillation cycles, damping behavior, and amplitude envelope variations; in the frequency and time–frequency domains, they manifest as multiple coexisting oscillatory modes with time-varying energy distributions. Generative models that rely solely on either time-domain waveforms or frequency-domain statistics are often insufficient to simultaneously capture these properties, leading to synthetic signals that lack waveform continuity, spectral consistency, or physical plausibility.
To address these challenges, this paper proposes a Time–Frequency Fusion Generative Adversarial Network (TFF-GAN). By incorporating parallel time-domain and frequency-domain modeling within the generator and optimizing the model using a time–frequency-aware composite loss under an adversarial learning framework, the proposed approach enables high-fidelity generation of wide-band oscillation scenarios with improved realism, consistency, and physical interpretability.
3.1. Overall Architecture
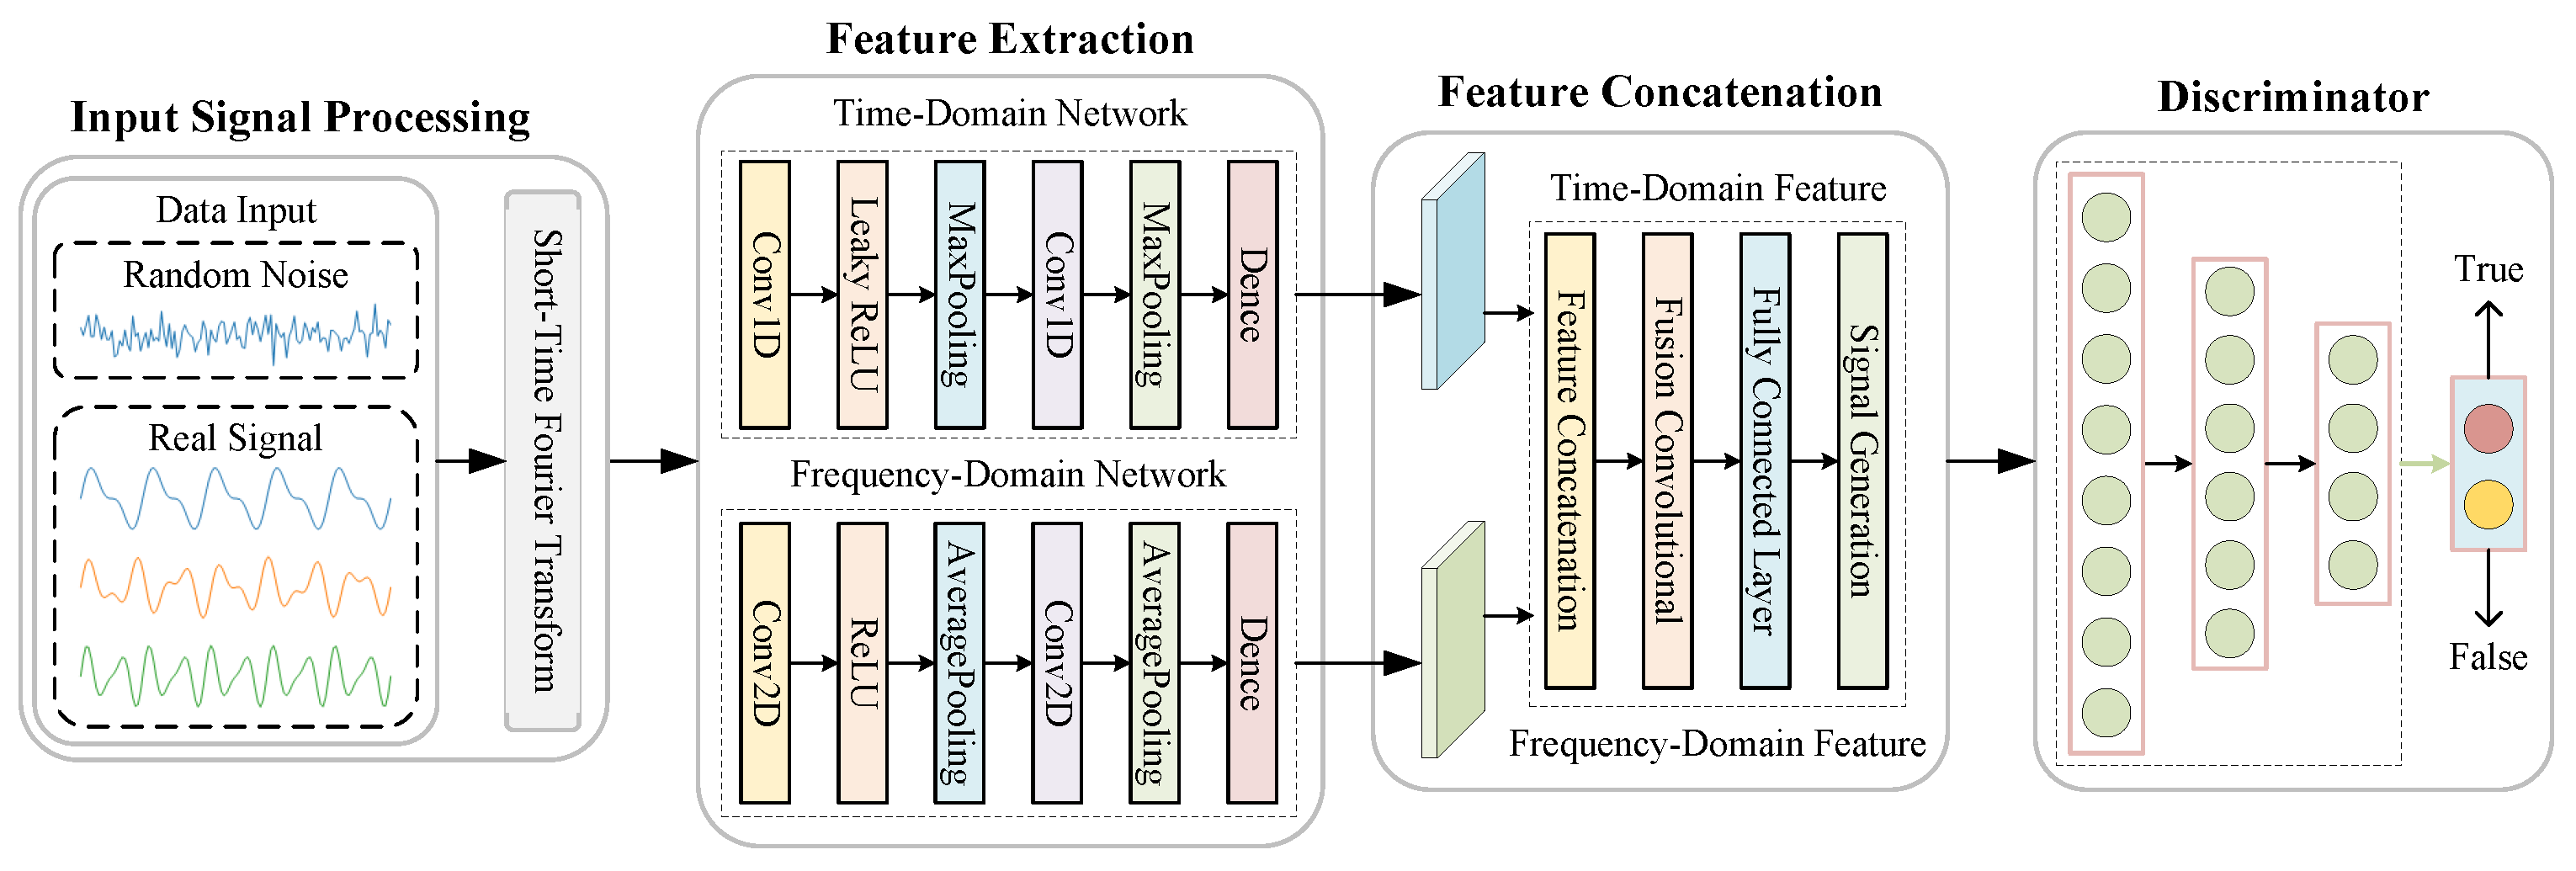
The proposed TFF-GAN consists of a generator
and a discriminator
, as illustrated in
Figure 1. The generator learns the latent distribution of wide-band oscillation signals and synthesizes realistic oscillation waveforms, while the discriminator distinguishes real signals from generated ones and provides adversarial feedback to guide the training process.
The generator takes a latent variable
where
is typically chosen as a multivariate standard Gaussian distribution. Through a sequence of nonlinear transformations, the generator maps the latent variable to a time-domain oscillation signal of length
T:
The discriminator receives either a real sample
or a generated sample
and outputs a scalar score
which measures the consistency of the input signal with the real data distribution. The generator and discriminator are trained via an alternating minimax game, gradually driving the generated data distribution toward the real distribution of wide-band oscillation signals.
3.2. Time–Frequency Joint Modeling in the Generator
To effectively capture the coupled temporal and spectral characteristics of wide-band oscillations, the generator adopts a dual-path modeling strategy that processes time-domain and frequency-domain information in parallel. For a generated signal
, its time–frequency representation is first computed using the Short-Time Fourier Transform (STFT):
where
denotes the window function,
R is the hop size, and
m and
k index the time frames and frequency bins, respectively. The resulting time–frequency representation is denoted as
with
M time frames and
K frequency bins.
Feature extraction is then performed independently in the time and frequency domains:
where
represents a time-domain feature extractor based on one-dimensional convolutional layers, capturing oscillation cycles, amplitude envelopes, and damping dynamics, and
denotes a frequency-domain feature extractor operating on the STFT representation to model dominant oscillatory modes, spectral energy distributions, and their temporal evolution.
The extracted features are subsequently fused in the feature space:
where
denotes feature concatenation and
is a fusion and reconstruction module implemented using a U-Net-style encoder–decoder architecture. Through multi-scale feature interaction enabled by skip connections, the fusion module jointly encodes local waveform details and global spectral structures, facilitating coherent signal generation across both domains.
3.3. Discriminator Structure and Discrimination Process
The discriminator
evaluates the realism of input oscillation signals by mapping them to a scalar critic score. For an input signal
x (either real or generated), the discriminator extracts high-level features
and produces the output score
where
denotes the internal feature extraction and fusion process of the discriminator, and
is a multilayer perceptron.
Through adversarial training, the discriminator progressively improves its ability to distinguish generated signals from real ones, thereby providing informative and stable gradients that guide the generator toward producing more realistic wide-band oscillation signals.
3.4. Time–Frequency-Aware Composite Loss Function
Relying solely on adversarial loss is insufficient to fully constrain the waveform structure and spectral characteristics of wide-band oscillation signals. To this end, a time–frequency-aware composite loss function is constructed by combining time-domain similarity loss, frequency-domain spectral consistency loss, and adversarial loss.
3.4.1. Time-Domain Similarity Loss
To encourage consistency between generated and real signals in terms of overall waveform shape, a cosine similarity-based time-domain loss is adopted,
where
denotes the inner product and
denotes the Euclidean norm. This loss emphasizes global oscillatory patterns rather than pointwise amplitude differences, making it well suited for non-stationary oscillation signals.
3.4.2. Power Spectral Density Loss
The power spectral density (PSD) characterizes how signal power is distributed across frequency and provides a compact representation of dominant oscillatory modes, damping characteristics, and harmonic components. Let
denote the PSD of signal
x evaluated over
K frequency bins. The spectral discrepancy between a real signal
x and a generated signal
is quantified as
This loss explicitly enforces alignment of dominant oscillation frequencies, modal bandwidths related to damping, and harmonic distributions between real and generated signals.
3.4.3. Adversarial Loss and Overall Objective
The adversarial loss is formulated based on the Wasserstein GAN framework with gradient penalty:
The overall training objective of TFF-GAN is defined as a weighted combination of the above loss terms:
Owing to the U-Net-based time–frequency fusion structure, gradients induced by the time-domain and PSD-based losses can be effectively propagated across multiple resolution levels. This enables coordinated optimization of waveform-level details and global spectral structures, resulting in physically consistent and high-fidelity wide-band oscillation scenario generation.
4. Case Study Analysis
4.1. Data and Setup
Field PMU oscillography data were collected from a provincial power grid in China over the period from 2019 to 2023. Through comprehensive data cleansing and quality control—including the removal of segments with missing values or abnormal measurements—a set of valid wide-band oscillation segments was retained for analysis. It is worth noting that the field measurements inherently contain ambient noise from the actual grid environment, which realistically reflects the operating conditions; therefore, no additional noise filtering was applied beyond suppressing out-of-band interference. The extracted events cover a wide spectrum of oscillatory behaviors, including subsynchronous (5–45 Hz), supersynchronous (55–95 Hz), and mid-/high-frequency (100–300 Hz) components, which are primarily associated with large-scale renewable energy cluster interconnections. Each oscillation segment has a duration of 10 s and is sampled at 1 kHz, ensuring sufficient temporal resolution to capture fast-varying oscillatory dynamics. To emulate the practical challenge of limited labeled oscillation events in real-world deployments, the dataset is randomly divided into a training set and an independent hold-out test set with a ratio of 7:3.
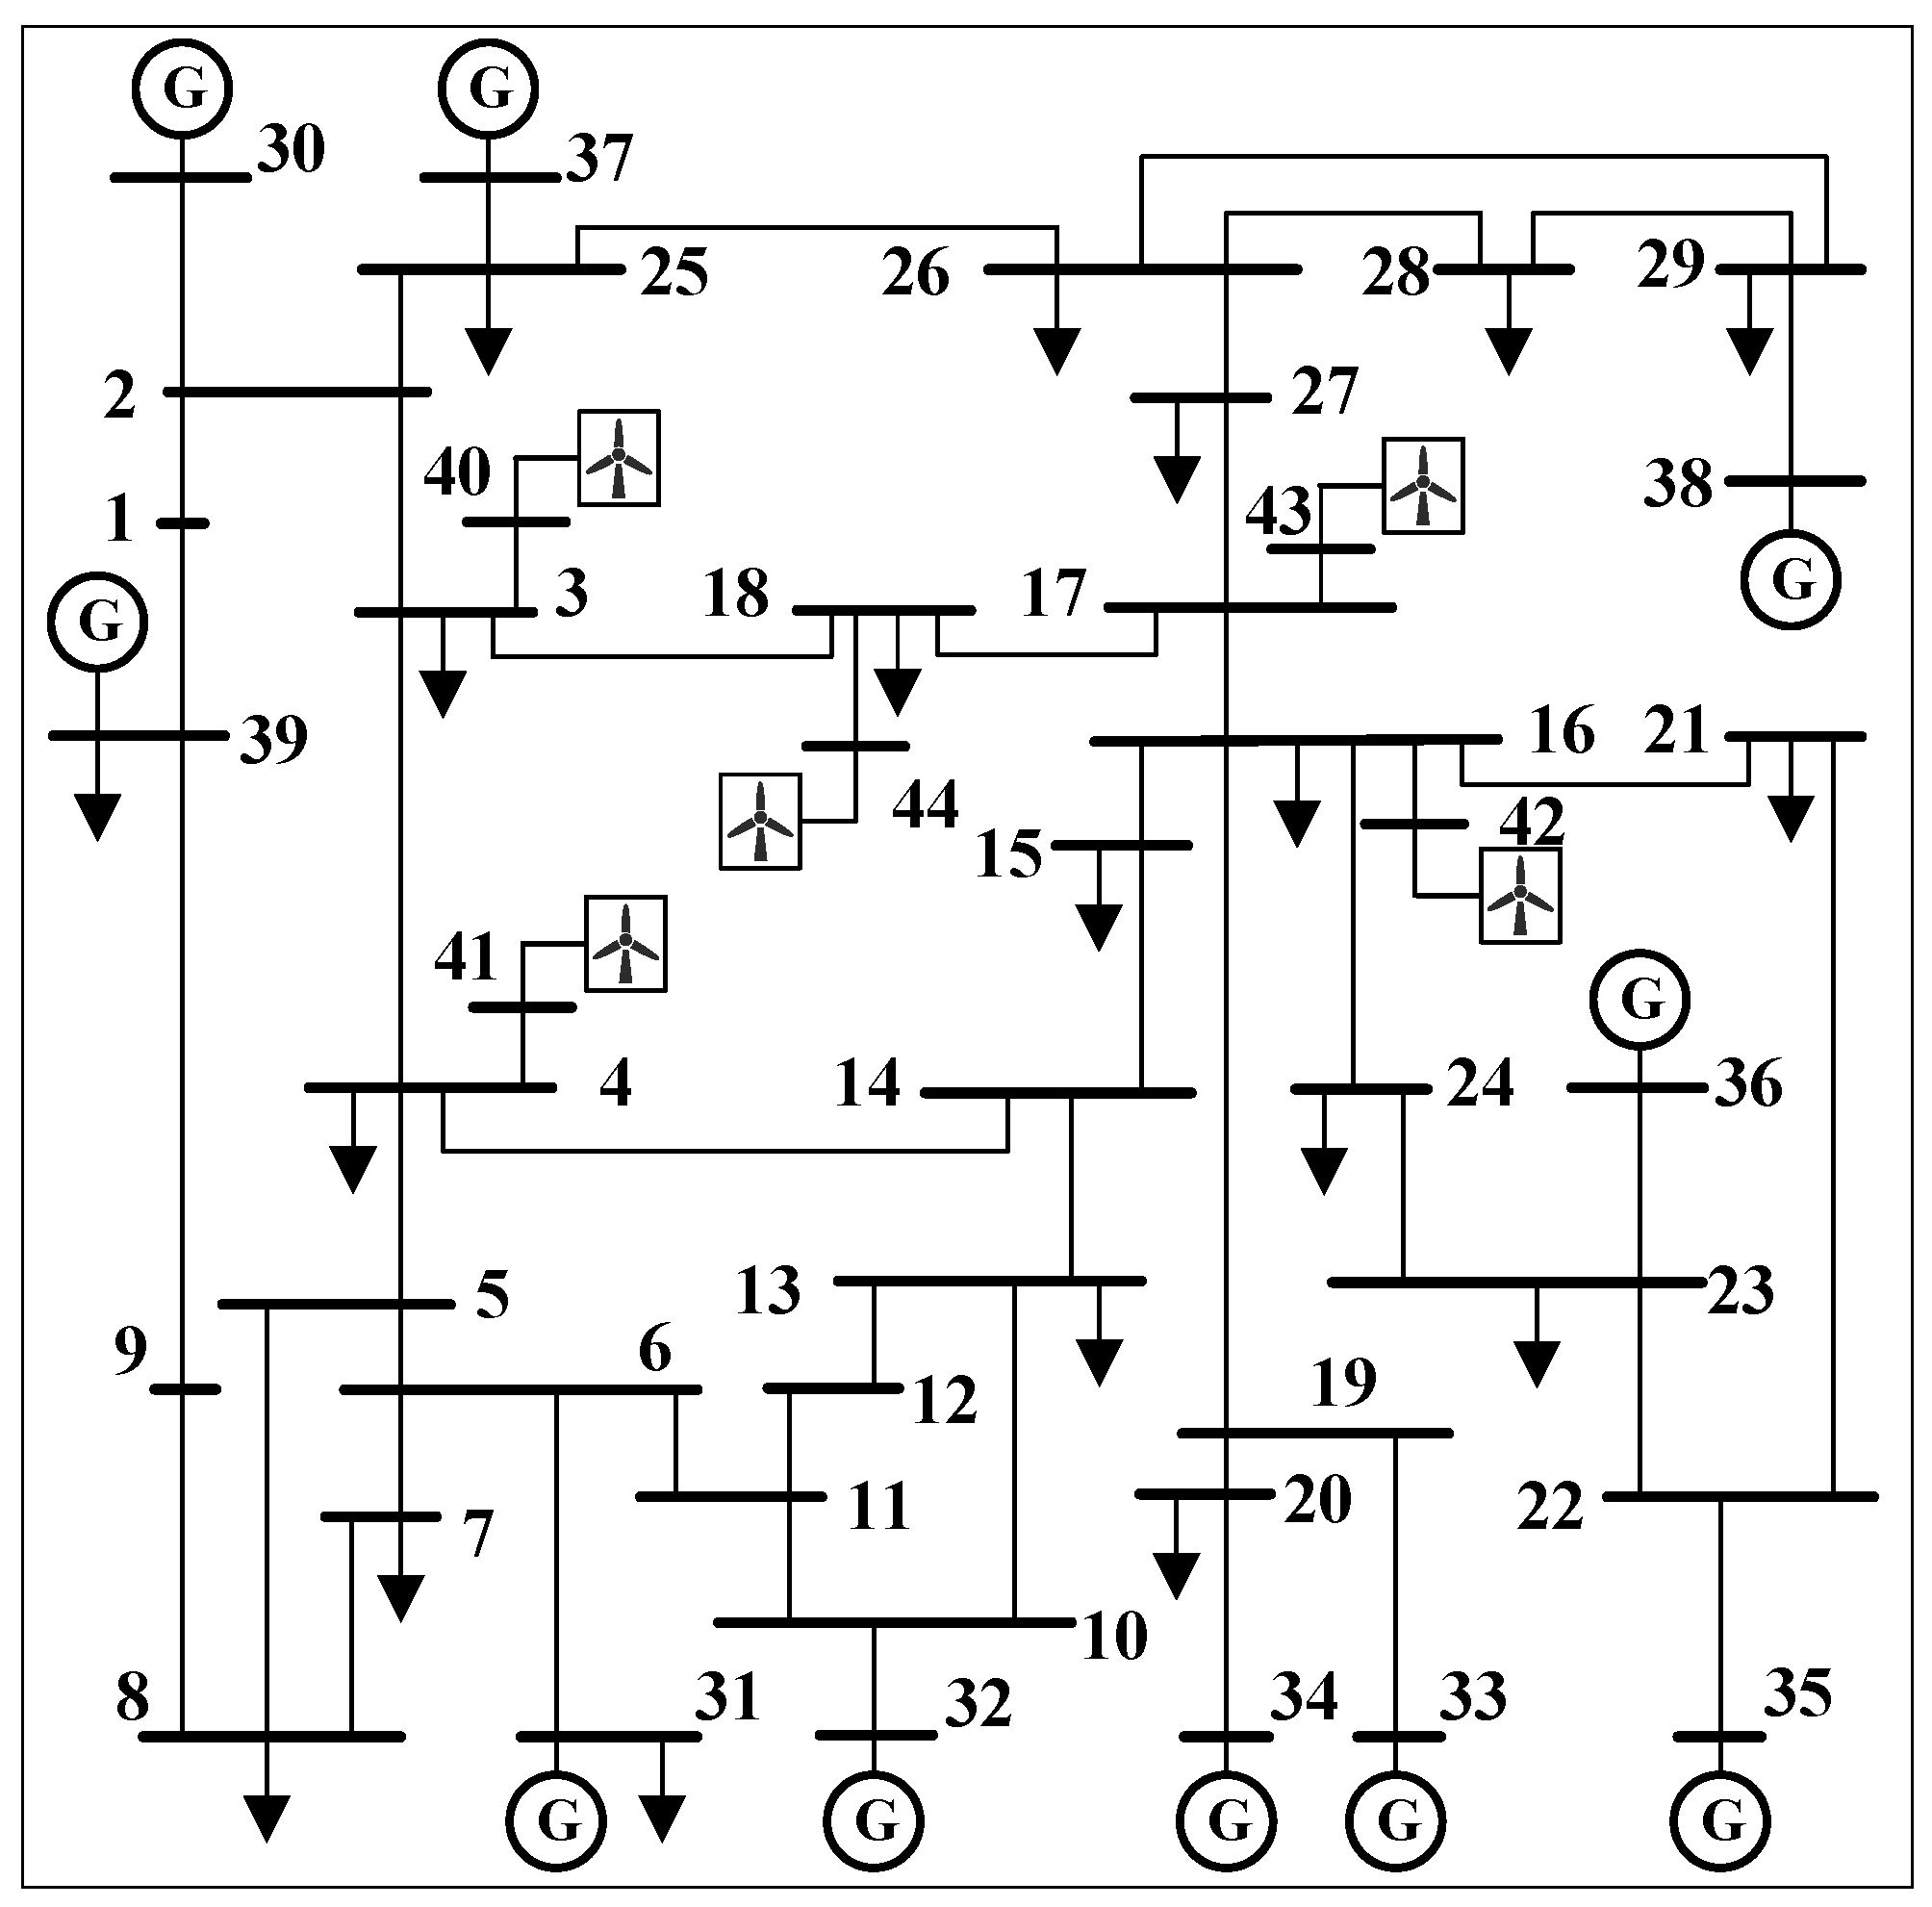
To further enrich the diversity of oscillation modes and to obtain samples with explicit physical interpretability, an IEEE 39-bus power system model with high renewable penetration was additionally developed in MATLAB/Simulink 2026, as illustrated in the system diagram in
Figure 2. By systematically sweeping operating conditions, controller parameters, and fault types, a total of 1000 oscillation records covering multiple scenarios and modal patterns were generated. To align with the noise characteristics of real-world measurements, we analyzed the typical signal-to-noise ratio (SNR) of the field PMU data and found it to be approximately 30 dB. Accordingly, Gaussian white noise with an SNR of 30 dB was added to the simulated signals to mimic realistic measurement conditions. Owing to the ideal simulation environment, the synthetic data contain no missing values or outliers. These physics-consistent simulated signals are incorporated to augment model training and to stress-test the generalization capability of the proposed method under unseen operating regimes.
To ensure comparability across different samples and to improve numerical stability during training, all raw signals are preprocessed using min–max normalization, which scales signal amplitudes to the interval
. Let
denote the original signal and
its normalized counterpart. The normalization process is defined as
where
and
represent the minimum and maximum values within the signal segment (or a specified time window), respectively. This preprocessing step mitigates amplitude-range discrepancies among different events and channels, alleviates gradient imbalance during adversarial training, and facilitates stable learning of oscillatory patterns under multi-condition data distributions.
All models were implemented using TensorFlow 2.6 and trained with CUDA-enabled GPU acceleration. Experiments were conducted on a workstation equipped with an Intel Core i7-12700K CPU (3.60 GHz) and an NVIDIA GeForce RTX 3090 GPU with 24 GB memory.
4.2. Baselines and Metrics
To ensure a fair and comprehensive evaluation, the proposed TFF-GAN is compared with three representative generative baselines. Specifically, WGAN-GP is adopted as a benchmark that optimizes the Wasserstein distance and employs gradient-penalty regularization to enhance training stability. DCGAN, a widely used convolutional GAN architecture for signal and sequence synthesis, is included to represent classical convolution-based generative models. In addition, TimeGAN, which is specifically designed for time-series generation and explicitly enforces temporal consistency constraints, is selected as a strong task-oriented baseline.
Time-domain fidelity is quantitatively assessed using two complementary metrics. First, the Dynamic Time Warping (DTW) distance is computed to measure waveform-shape similarity while tolerating nonlinear temporal misalignment, thereby reflecting the overall reconstruction accuracy of oscillatory patterns. Second, the Pearson Correlation Coefficient (PCC) is calculated to evaluate the linear correlation between generated signals and real counterparts in the time domain, capturing consistency in both trend evolution and amplitude dynamics.
4.3. Qualitative Time-Domain Waveform Evaluation Across Frequency Bands
After completing model training, qualitative evaluations are conducted to visually examine the generalization capability, output quality, and adaptability of the proposed method for wideband oscillation scenario generation under different operating conditions. Specifically, representative event segments are selected from the independent test set, and the signals generated by TFF-GAN are displayed alongside the corresponding real PMU recordings along the time axis. This visual comparison facilitates an intuitive assessment of waveform morphology, amplitude evolution, and phase variation.
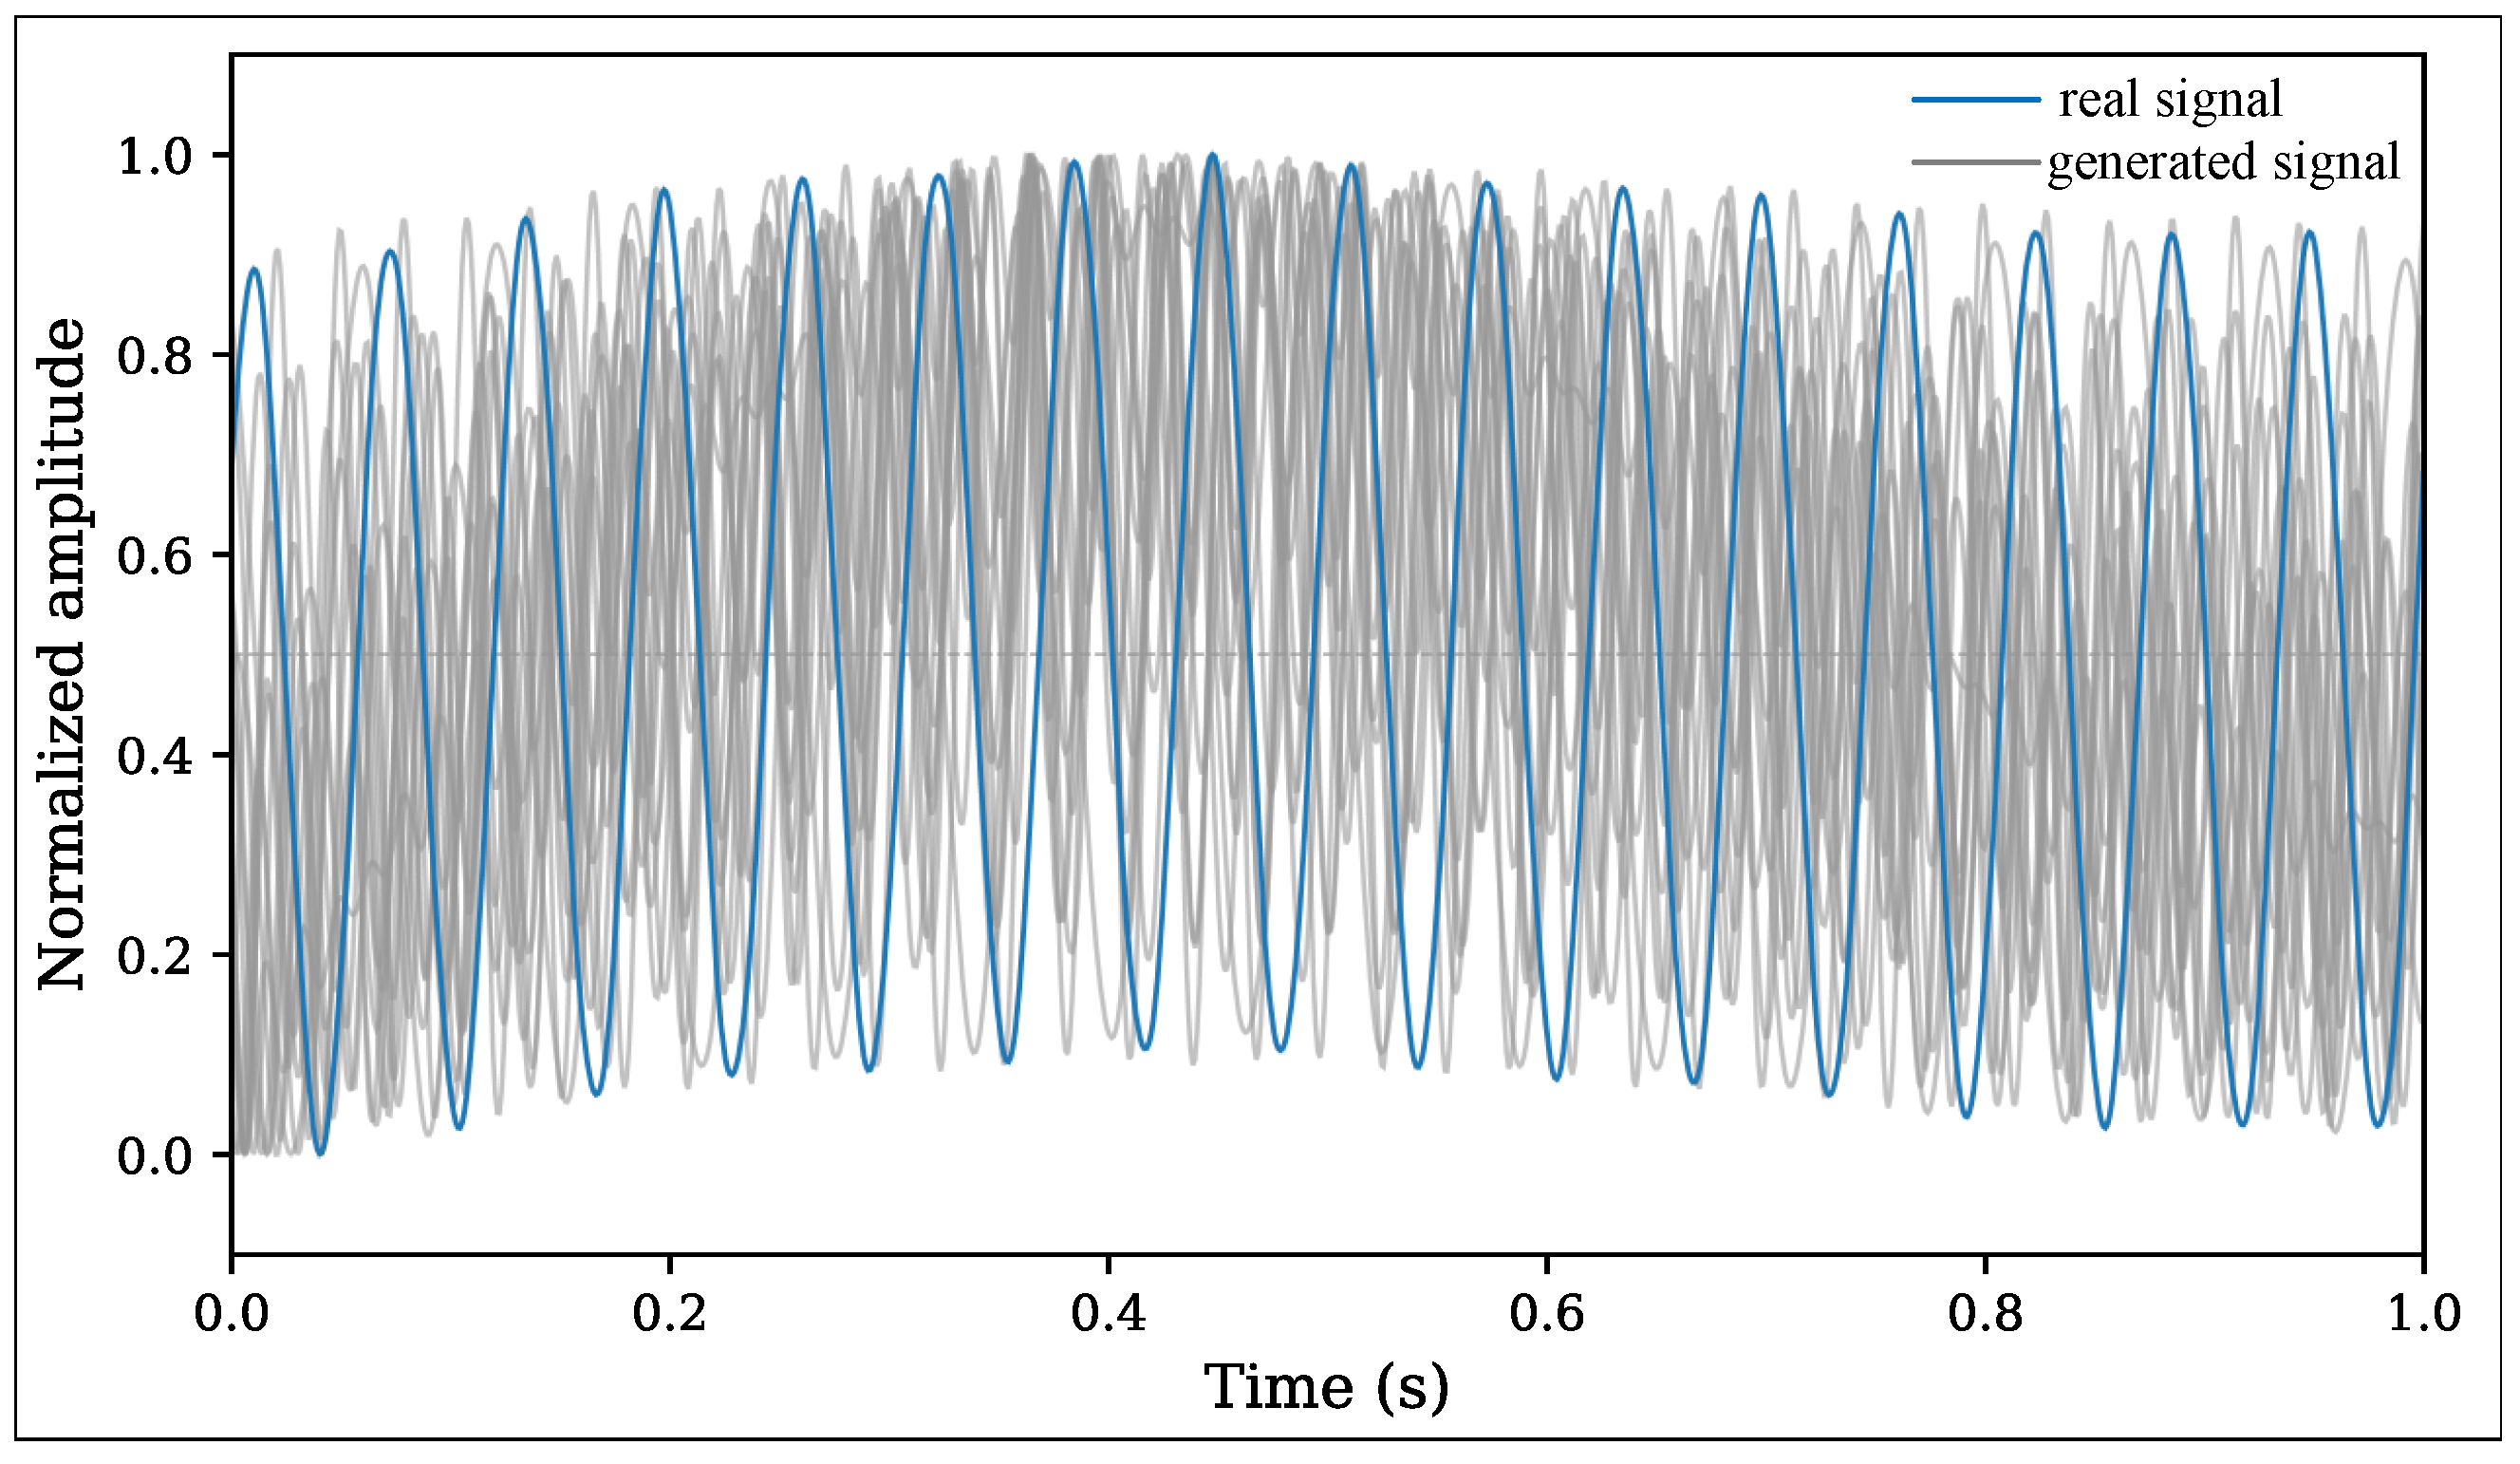
Based on the above setup, this section takes the subsynchronous oscillation band (5–45 Hz) as a representative example. The corresponding time-domain waveform comparison between TFF-GAN-generated signals and real test signals is illustrated in
Figure 3. This visual comparison provides intuitive evidence of the model’s ability to accurately reconstruct global waveform structures while preserving local dynamic details, thereby complementing the subsequent quantitative evaluations based on DTW and PCC.
The results indicate that the generated oscillation scenarios exhibit a high degree of agreement with real data in terms of overall trend, fluctuation magnitude, and peak–valley characteristics. This observation demonstrates that the proposed TFF-GAN possesses strong generalization capability and is able to effectively capture the essential dynamic features embedded in wideband oscillation signals, enabling the generation of high-fidelity and diverse oscillation risk scenarios.
4.4. Time-Domain Quantitative Evaluation of Generated Signals
To objectively and quantitatively assess the realism of the generated signals, this subsection conducts a rigorous comparison between the proposed TFF-GAN and the baseline models based on the time-domain evaluation framework defined in
Section 4.2. The evaluation focuses on time-domain fidelity as the core criterion, aiming to numerically verify each model’s capability to reproduce the key dynamic characteristics of wideband oscillatory waveforms and to provide quantitative evidence of the superiority of TFF-GAN in high-fidelity scenario generation.
Table 1 summarizes the quantitative time-domain evaluation results of different models. Two metrics are employed, namely, Dynamic Time Warping (DTW) distance and Pearson Correlation Coefficient (PCC), which characterize the similarity between generated and real signals from the perspectives of temporal-shape matching error and linear correlation consistency, respectively. Specifically, smaller DTW values indicate reduced waveform discrepancies after alignment and more accurate time-domain reconstruction, while PCC values closer to unity imply stronger agreement in overall variation trends and amplitude dynamics. All results are computed on the independent test set, and the values reported in
Table 1 correspond to mean statistics.
Considering both quantitative metrics (DTW and PCC), the results in
Table 1 show that the proposed TFF-GAN consistently outperforms the compared mainstream generative models in terms of waveform-shape similarity and trend consistency. In particular, TFF-GAN achieves the lowest DTW and the highest PCC among all methods, indicating superior temporal alignment accuracy and stronger correlation with real signals. These findings quantitatively confirm that, benefiting from the designed time–frequency fusion generation mechanism and the joint optimization strategy, TFF-GAN is capable of effectively learning and reproducing the key time-domain dynamic characteristics embedded in wideband oscillation signals. As a result, it can generate high-fidelity and physically plausible oscillation risk scenarios, providing a reliable and high-quality sample basis for subsequent data-driven analyses.
4.5. Robustness Analysis
To comprehensively evaluate the stability and reliability of the proposed TFF-GAN in practical applications, this subsection further investigates its robustness with respect to training data size and measurement noise. All experiments are conducted on the independent test set, using DTW and PCC as evaluation metrics. The results are compared against three baseline models: Time-GAN, WGAN-GP, and DCGAN.
4.5.1. Robustness to Training Data Size
To simulate the scarcity of labeled oscillation events commonly encountered in real-world scenarios, we randomly sampled subsets of the original training set at proportions of 20%, 40%, 60%, and 80%. These subsets were used to retrain TFF-GAN and the baseline models from scratch, with all hyperparameters kept identical. The trained models were then evaluated on the full test set.
Table 2 presents the quantitative results under different training data proportions. As the amount of training data decreases, the generation quality of all models degrades to varying extents. However, TFF-GAN consistently achieves the best DTW and PCC across all data proportions. Notably, when trained with only 20% of the data, TFF-GAN attains a DTW of 33.124 and a PCC of 0.915.
4.5.2. Robustness to Measurement Noise
Field PMU measurements inherently contain ambient noise from the actual grid environment, with a typical signal-to-noise ratio (SNR) of approximately 30 dB. To assess the model’s tolerance to stronger noise levels, we superimposed additional Gaussian white noise onto the test set signals, constructing noisy test samples with SNR levels of 25 dB, 20 dB, and 15 dB (with 30 dB serving as the baseline). The pre-trained TFF-GAN and baseline models were then used to generate corresponding signals, and the DTW and PCC between the generated signals and the noise-corrupted real signals were computed.
Table 3 summarizes the evaluation results under different SNR conditions. As the SNR decreases (i.e., noise increases), the generation quality of all models degrades to a certain extent. However, TFF-GAN exhibits the smallest degradation. Under the severe noise condition of 15 dB, TFF-GAN achieves a DTW of 36.218 and a PCC of 0.884.
4.6. Data Distribution Similarity Verification
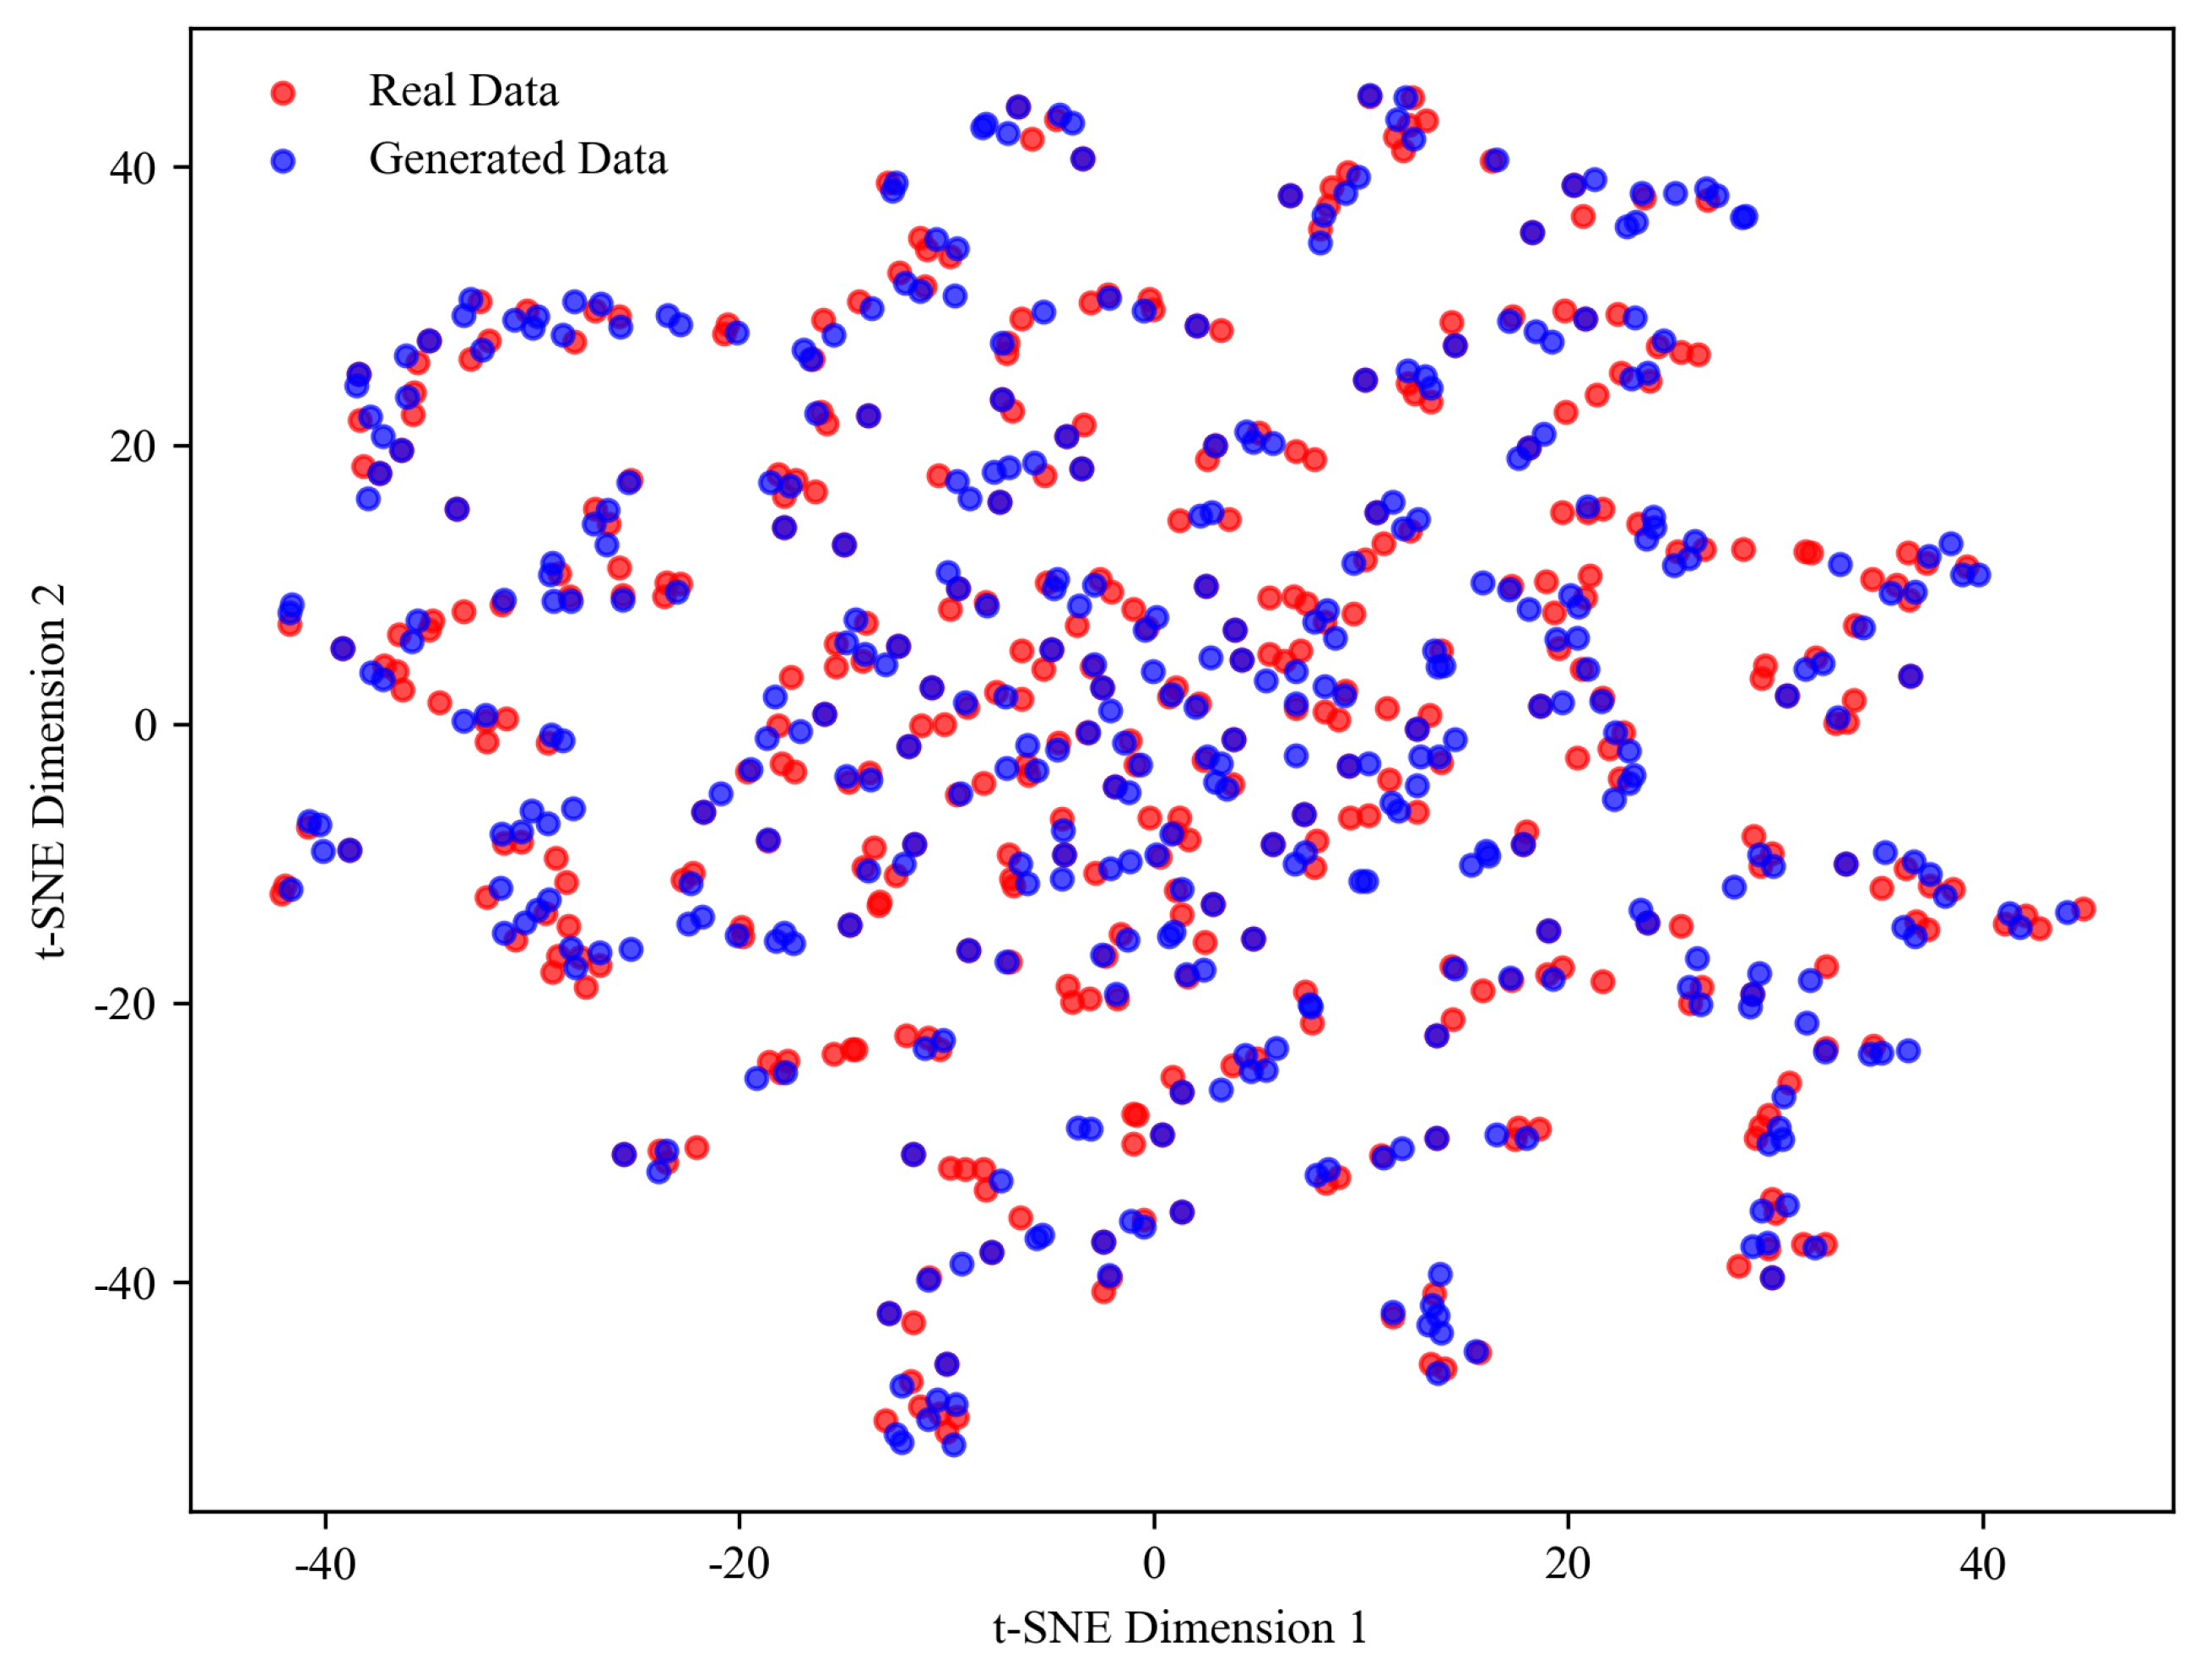
To verify the distributional consistency between the TFF-GAN–generated data and the real data from the perspective of a high-dimensional feature space, we employ the t-distributed stochastic neighbor embedding (t-SNE) technique to conduct a qualitative visualization analysis of their latent-feature distributions. The purpose of this analysis is to intuitively examine whether the generated samples can adequately cover the feature manifold spanned by real samples, thereby alleviating the risk of mode collapse and ensuring both diversity and realism of the generated scenarios.
Specifically, we randomly select 500 samples from the real dataset and 500 samples from the TFF-GAN–generated dataset. Under the same feature-extraction setting, the corresponding high-dimensional representations are obtained and then projected onto a two-dimensional plane using t-SNE for visualization.
Figure 4 illustrates the resulting feature distributions, where red circles denote real signals and blue circles denote signals generated by TFF-GAN.
As shown in the figure, the two sets of points are highly mixed and intertwined without forming clear clustering boundaries or separable regions, and their overall coverage ranges on the two-dimensional plane are largely overlapped. This observation indicates a high degree of similarity between the generated and real signals in the deep feature space, suggesting that TFF-GAN can effectively capture the intrinsic structure of the real data distribution while maintaining adequate diversity.
Overall, the t-SNE visualization provides qualitative evidence that the proposed TFF-GAN yields a feature-space distribution that is highly consistent with that of the real wideband oscillation data. As shown in
Figure 4, the real and generated samples are strongly intermixed and intertwined in the two-dimensional embedding, without exhibiting clear cluster boundaries or separable regions, and their overall coverage ranges largely overlap. This suggests that TFF-GAN can effectively learn the intrinsic structure and statistical characteristics of the real-data manifold in a deep feature space, rather than producing a limited set of repetitive patterns. Combined with the preceding time-domain qualitative comparisons and quantitative evaluations, these results indicate that the designed time–frequency fusion mechanism and joint optimization strategy enable TFF-GAN to generate diverse and high-fidelity wideband oscillation scenarios that are suitable for supporting subsequent data-driven analyses such as oscillation risk assessment and control-strategy validation.
5. Conclusions
This paper has proposed a Time–Frequency Fusion Generative Adversarial Network (TFF-GAN) to address the scenario scarcity problem in wide-band oscillation analysis. By designing a dual-path generation architecture, a U-Net-based fusion mechanism, and a time–frequency-aware composite loss function, the proposed method achieves joint optimization of temporal fidelity and spectral accuracy. Extensive experiments on field PMU data and simulated IEEE 39-bus system data demonstrate its effectiveness: TFF-GAN achieves a DTW of 30.392 and a PCC of 0.932, significantly outperforming baseline models such as Time-GAN, WGAN-GP, and DCGAN.
Future work will focus on extending TFF-GAN to multivariate oscillation signals with spatial correlations, incorporating physical knowledge into the generative process to enhance interpretability, and exploring the application of generated scenarios in downstream tasks such as oscillation risk assessment and control strategy validation. In addition, we will devote efforts to collecting longer-term and more diverse real-world PMU data, as well as exploring transfer learning approaches, to further enhance the representativeness and diversity of the generated scenarios.