1. Introduction
The increasing incorporation of variable renewable energy (VRE) sources such as solar and wind, connected via power electronics converters (inverters) or Inverter-Based Resources (IBRs), is posing challenges to maintaining frequency stability in electrical grids. Unlike traditional generating plants that contribute natural inertia to the system, renewables can cause rapid changes in injected power due to the variability of the primary resource (sun, wind). The inherent absence of inertia in most VRE technologies connected through inverters is a critical factor. When solar radiation rapidly decreases due to cloud passage or wind speed fluctuations, the power injected into the grid can change abruptly. Without inertia to counteract these changes, the system frequency becomes more susceptible to rapid and significant variations, jeopardizing the safe operation of connected equipment and complicating the response to unexpected events. This problem highlights the need to investigate how these variations manifest and what technologies and regulations can mitigate these effects in this new energy scenario.
It is clear that the significant integration of VRE generation based on IBRs leads to a decrease in the number of operational synchronous generators (SGs) available in the electrical system. Therefore, the interconnection of VRE to the grid must be carefully evaluated from two perspectives: (i) the problems caused by IBRs and (ii) the problems arising from the reduction in the number of synchronous generators connected to the electrical system. A large body of recent work has identified two crucial issues: (i) Low (or zero) provision of total system rotational inertia and (ii) reduced and limited fault levels affecting the short-circuit ratio [
1].
It is crucial to emphasize that the inertia traditionally provided by the rotating machines of conventional plants (thermal, hydroelectric) acts as a natural buffer against imbalances between generation and demand. This inertia allows the system frequency to remain relatively stable during disturbances, as the kinetic energy stored in these large rotating masses can be temporarily released or absorbed, slowing down rapid changes in system frequency, which are quantified by the Rate of Change of Frequency (RoCoF) in Hz/s [
2]. A system with high VRE integration exhibits a higher RoCoF than the same system with low VRE presence. A large RoCoF can push the system to its operational limit, leading to the activation of under-frequency protections and, consequently, load shedding to restore power balance unless additional generation is rapidly integrated [
3]. Furthermore, the response to unexpected events, such as the sudden outage of a generation plant or the disconnection of a significant load, becomes more complex. With lower inertia, the RoCoF can be much more pronounced, demanding significantly more agile and sophisticated protection and control systems to prevent grid collapse. In areas with significant VRE integration, power system operators face serious problems with power, frequency, and voltage control. These critical aspects in the operation of current energy systems have led to updates in grid codes to ensure the security and reliability of the electrical system, so VREs are expected to provide grid support through ancillary services for regulation and control, including contributions to frequency control.
To reduce the impacts of low inertia and enhance the system stability, particularly frequency stability, the emulation of additional inertia in the power system without using actual rotating mass is positioned as one promising solution [
4]. Several proposed topologies for virtual inertia emulation exist, as summarized in [
3,
5]. However, all these topologies share the same primary objective: to virtually provide additional inertia to the power system using different inverter control strategies.
The grid-connected converters for renewable generation sources are classified as Grid Following (GFL) converters and Grid Forming (GFM) converters. Wind and solar energy sources are connected to the power grid through power-electronic converters. These converters generally cannot provide the same inertial or damping as the traditional synchronous generators [
6,
7]. GFL and grid-supporting inverters operate as dispatchable power sources, prioritising the injection of current into the grid, while other functionalities are secondary [
8]. Unlike GFL, GFM control is designed primarily to provide a stiff voltage, while meeting the power demand through voltage source operation to intrinsically maintain its voltage output level, which represents an attractive feature for weak power systems [
8]. Currently, most IBR generation is controlled through the GFL mode, which can be represented as a controlled current source in PQ mode, injecting active power
and reactive power
into the grid, as illustrated in
Figure 1a. The primary control strategy is based on a structure with two nested loops (outer and inner), utilizing PI controllers aligned with the
axes. The angular reference for these axes is the phase angle
of the grid voltage
, obtained through phase-locked loops (PLLs), whose function is to synchronize the converter to the grid. The outer loop of the control system is responsible for regulating the injected active power (
P) by manipulating the current in the d-axis (
), in addition to regulating the injected reactive power (
Q) or the magnitude of the voltage at the Point of Common Coupling (PCC) through the current in the q-axis (
). The reference currents (
,
) calculated by the outer loop are used by the inner loop to control the current injected by the converter.
Although Frequency-Power droop control could be developed for GFL inverters to provide rapid grid frequency regulation support, it cannot actively establish the grid frequency when transitioning to islanded operation. In contrast, GFMs can actively establish the frequency and voltage at the local inverter level, making them widely used in microgrids, large-scale distribution systems, and even transmission systems [
9]. This mode of operation and control of GFMs, in addition to forming the grid by establishing voltage and frequency, also primarily involves emulating certain characteristics similar to synchronous generators, such as black start capability, frequency and voltage support, and synchronization capabilities, among others [
5,
10]. The integral control structure for a GFM converter is shown in
Figure 1. The inputs to the control system include the grid current (
), and the voltage at the PCC (
); reference inputs also include powers
,
as well as reference voltage and angular frequency
and
, respectively. The Power Control system internally consists of two control loops: outer and inner. While the outer loop is responsible for calculating the angle, frequency, and amplitude of the voltage, the inner loop is responsible for determining the modulation signal for the inverter switching blocks [
11]. Furthermore, a study and summary of the different control strategies and applications for a GFM are reported in [
12].
2. GFM Inverter Modelling and Control
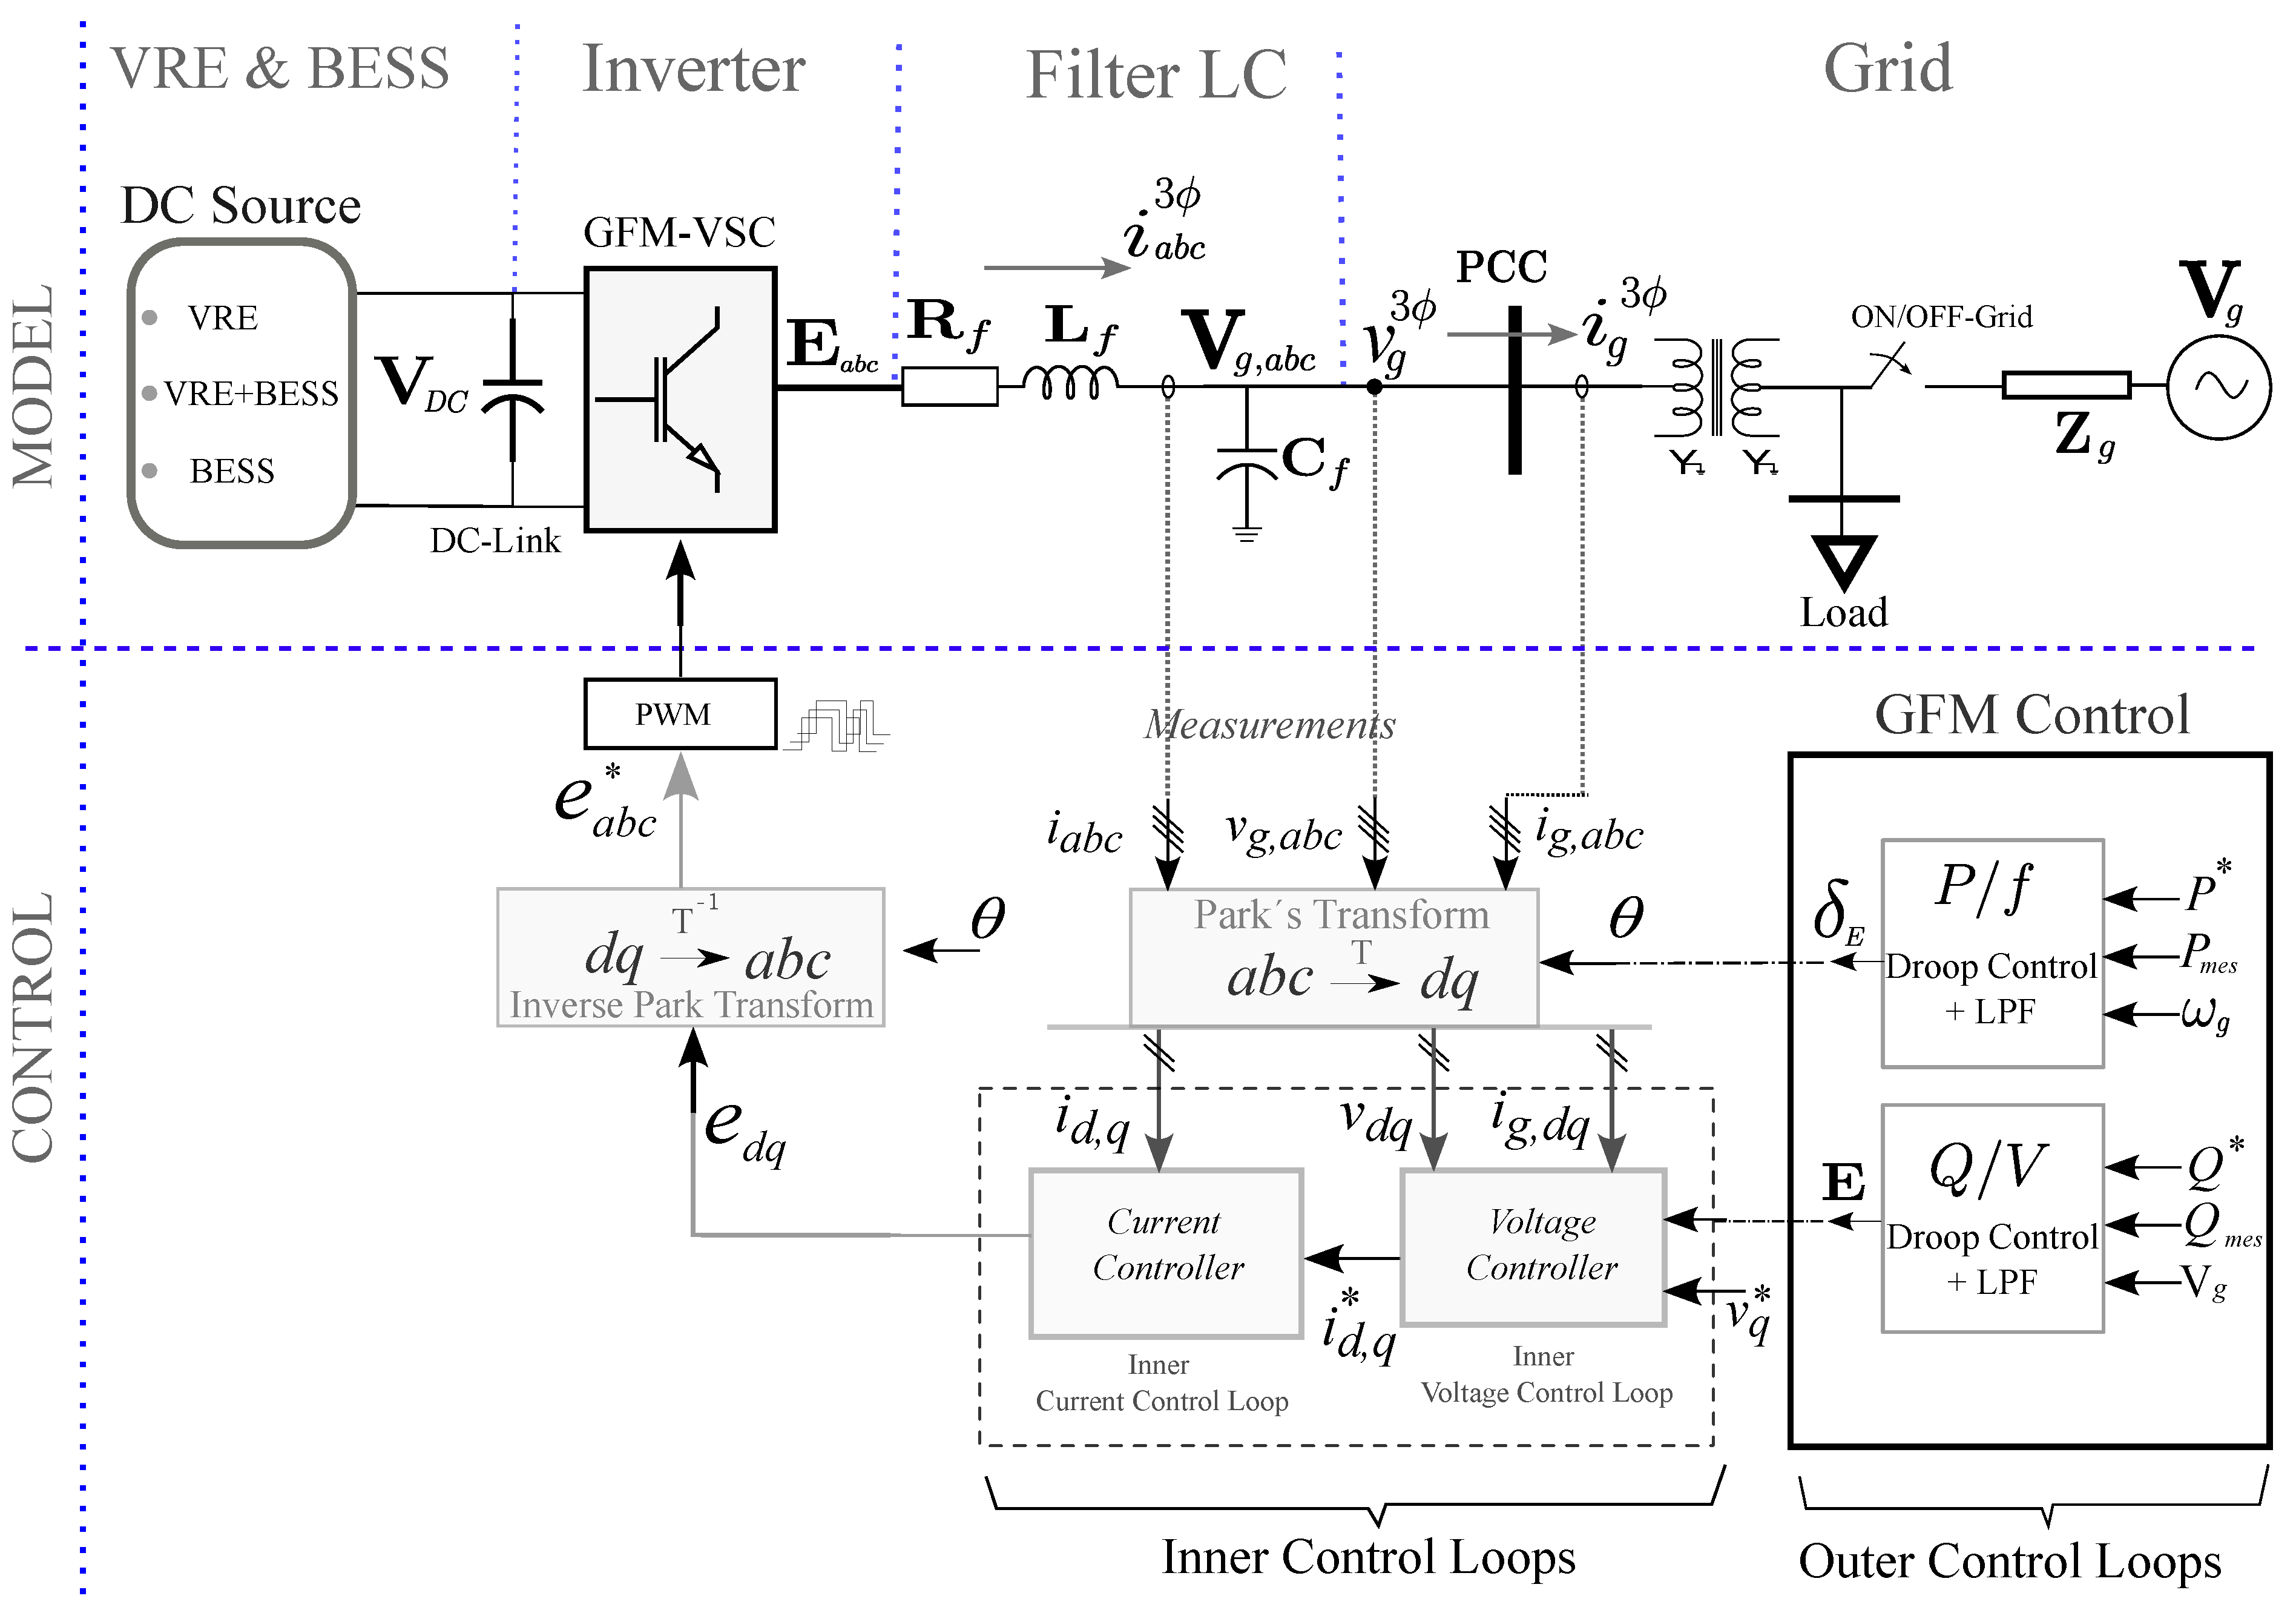
The diagram of the VRE model and control based on IBRs with grid interconnection is represented in
Figure 2. The circuit model of the GFM Inverter consists of a DC voltage source representing the power supply and an output LC filter to filter switching harmonics.
When modeling a Grid-Forming Voltage Source Converter (VSC-GFM), the DC-side dynamics are often neglected due to the separation of timescales. The large capacitance of the DC link results in a significantly larger time constant compared to the fast dynamics of the AC-side switching and control loops.
For short-term transient analysis, the DC-link voltage can be considered an ideal or constant voltage source. This simplification drastically reduces model complexity and computational burden, enabling faster and more efficient simulations of high-frequency phenomena relevant to grid-forming behavior, such as stability, fault ride-through, and synchronization with the AC grid.
GFM control allows an IBR to behave as a controlled voltage source with a defined output impedance. This technique enables the converter to emulate the dynamic behavior of synchronous generators, within the inherent limitations of power electronics technology.
GFM Modeling on the AC Side
For the operation and control of the VSI, measurements of the converter’s output variables are required. Observing
Figure 2, the output variables are the current
at the inverter output, the voltage
at the capacitor terminals, and the output current
at the Point of Common Coupling (PCC). These three variables are expressed in (
1) and (2) [
13].
Equations (
1) and (
2) are transformed to the synchronous
reference frame via Park’s transformation (
T). The electrical system under study is modeled as a balanced three-phase system and the zero component is equal to zero (
) [
14]. If dq frame has its
q-axis aligned with phase a initially, or d-axis lagging phase a by 90 degree, Park’s transformation is as follows [
15]:
where
is a column vector of the sinusoidal three phase quantities,
is a column vector of the d and q axis quantities. It is important to mention that the angle
employed for the transformations of the measured variables to the
frame is the same angle of the voltage at the GFM inverter terminals,
, as detailed subsequently. For converters to have a specific behavior, different control loops are required, which translate measured values and reference values into signals used to control the inverter in order to achieve a desired output [
4].
The resulting in the
frame are:
The instantaneous active and reactive powers,
P and
Q, at the PCC, in steady state and in
, are determined by (
5) and (
6) respectively.
The variables in Equations (
4)–(
6) are used for the VSI control.
3. GFM Inverter Control
For converters to exhibit a specific behavior, different control loops are required, which translate measured values and reference values into signals used to control the inverter to achieve a desired output [
4].
As shown in
Figure 2, the external control loops calculate the angle, frequency, and amplitude of the voltage at the PCC, and the internal control loop is responsible for determining the modulation signal for the inverter switching blocks. These two control loops will be explained in subsequent sections.
From a fundamental model perspective of the VSI-GFM with grid interconnection (see
Figure 3), Equations (
7)–(
9) can be employed to modify the power injected into the grid. Since the magnitude and angle of the grid voltage V,
, as well as the system reactance
cannot be modified, the approach involves modifying the voltage and angle E,
of the GFM inverter to control powers P and Q [
16].
This linearization is valid for a small .
3.1. Outer Control Loops
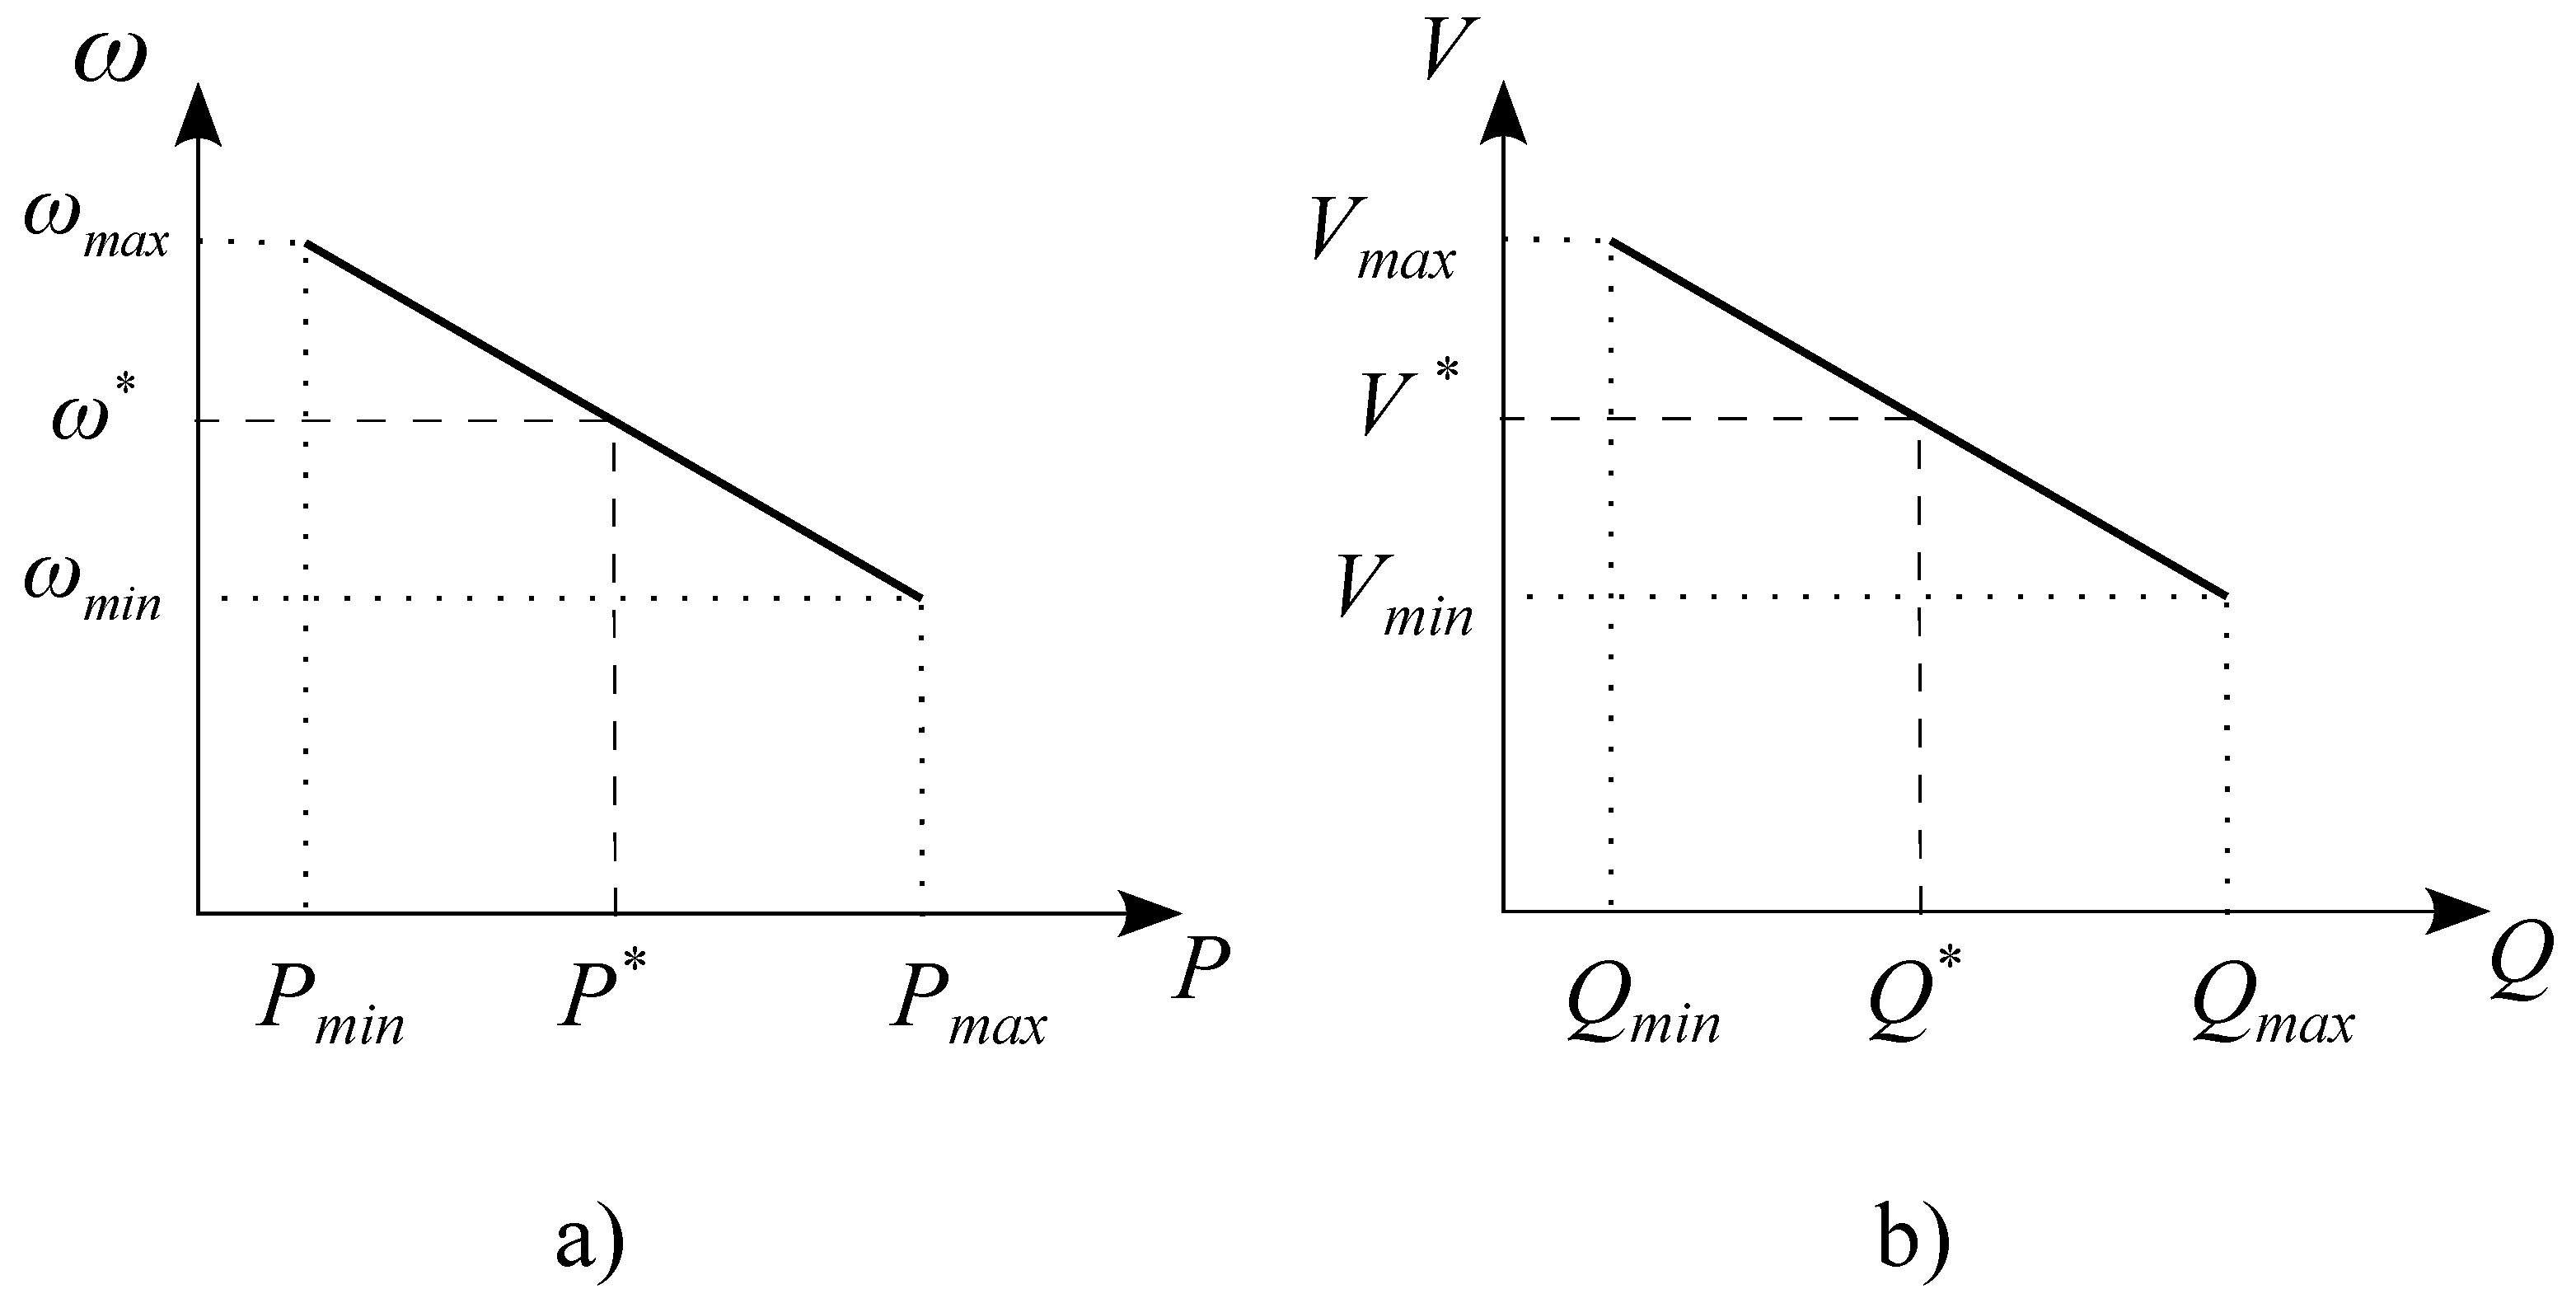
These outer control loops constitute the Grid Forming control and are implemented through the P/f and Q/V Droop Control technique; their characteristics can be seen in
Figure 4. One objective is to enable the inverter to respond by injecting active power in response to a change in the system’s power balance; this action has a direct effect on the frequency.
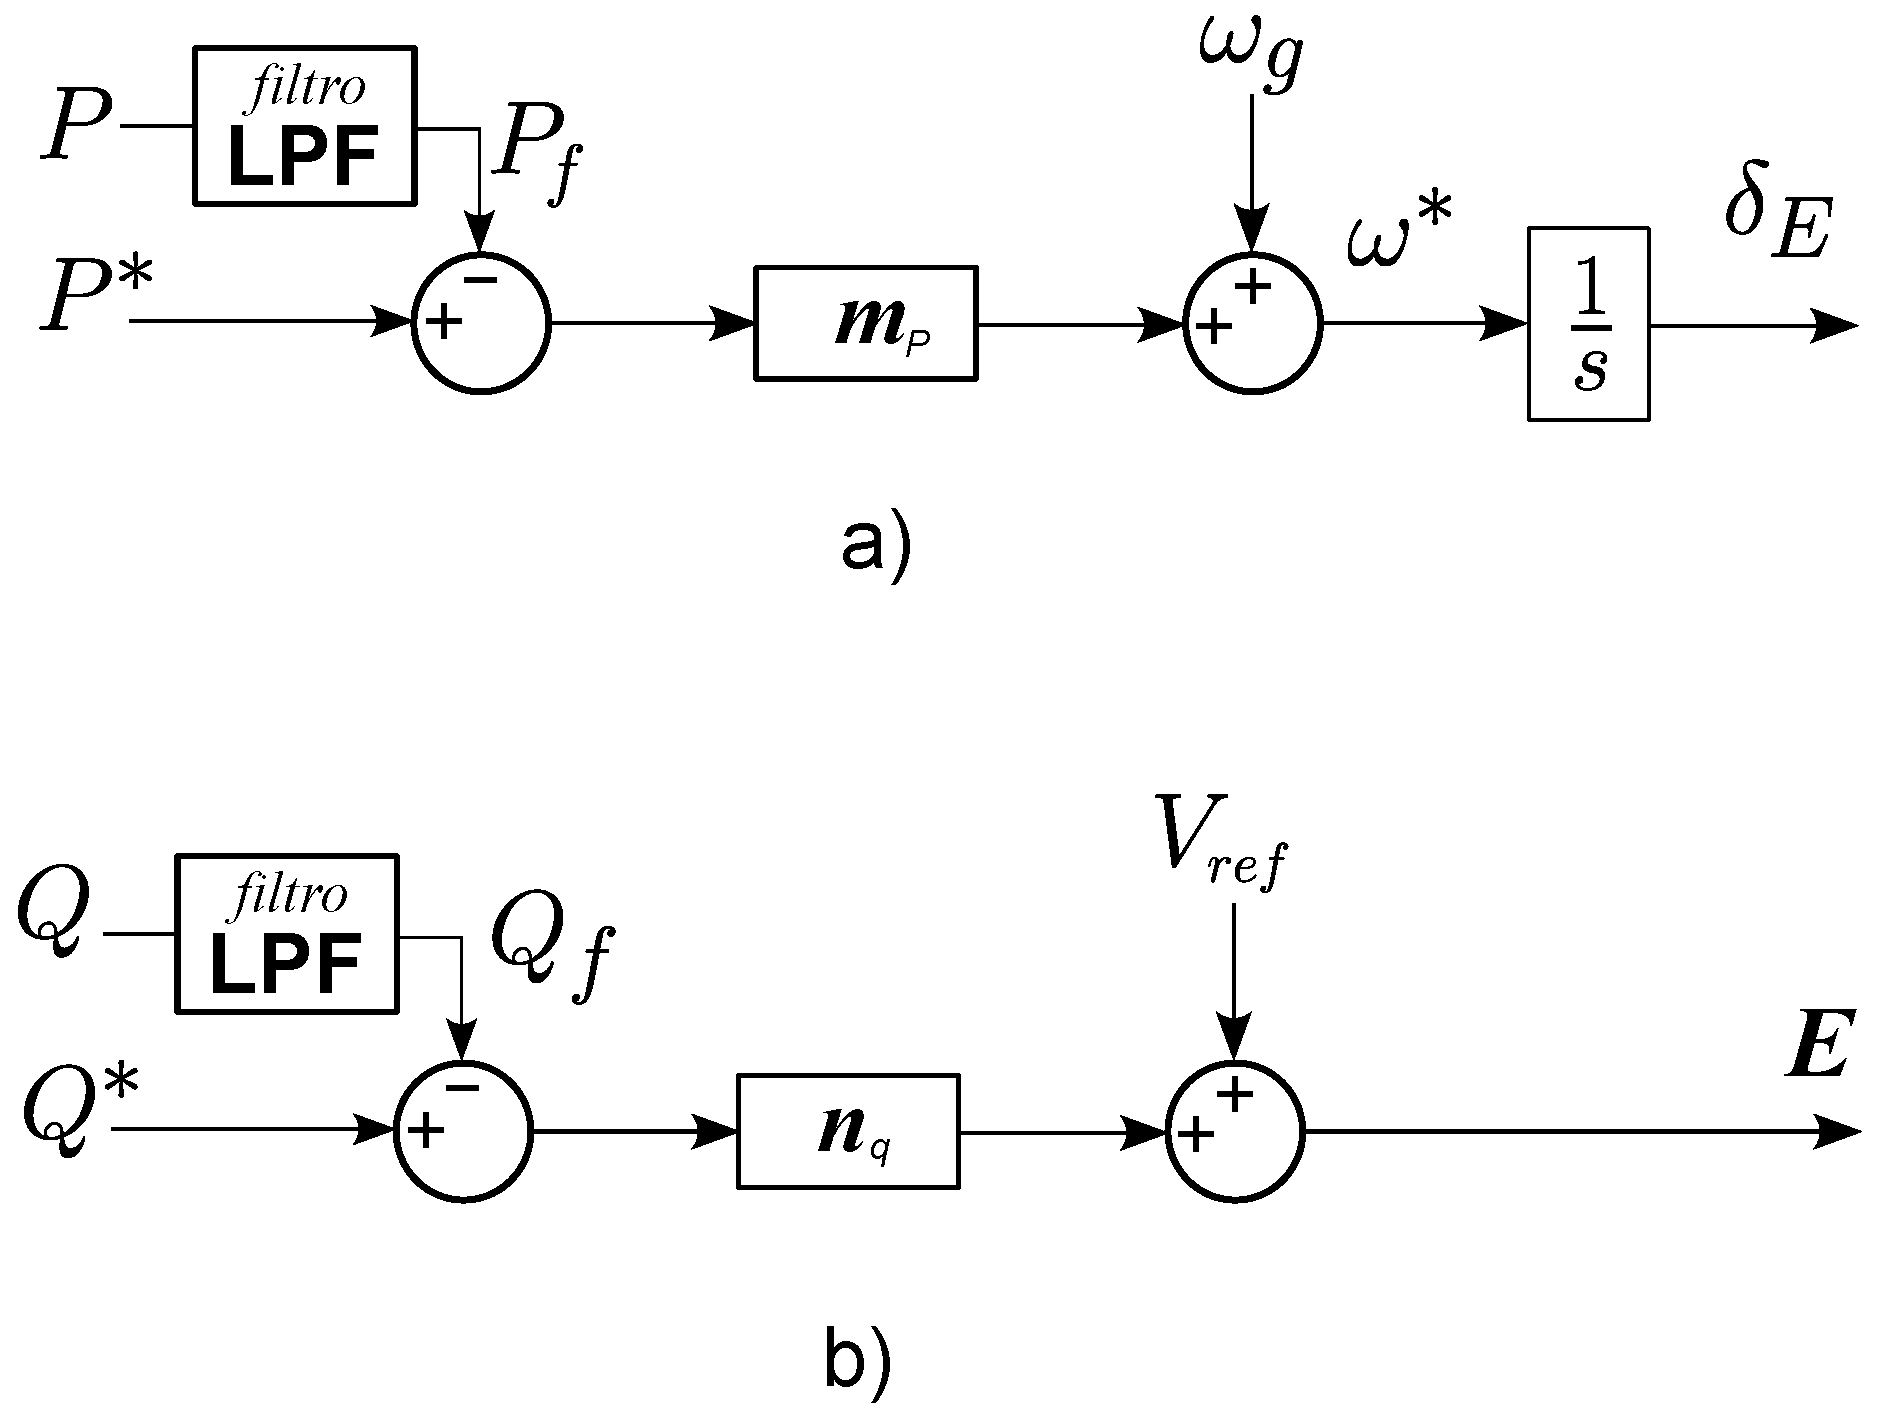
Figure 5 shows a block diagram of the droop controls for managing the voltage and angle profile for power synchronization at the GFM inverter terminals.
3.1.1. GFM Angle Control
Control of angle
for real power synchronization to the grid. In this outer control loop, as seen in
Figure 4 the power is controlled using the
droop control, where
and
are the nominal grid angular frequency and the angular frequency of the GFM internal voltage respectively, related through (
10), where
is the droop coefficient, which represents changes in frequency based on the difference between the reference active power
and the measured and filtered converter power
. Finally, the output of this block is integrated to obtain the angle
, according to (
14). This method does not require the additional use of a phase locked loop (PLL) for grid detection and synchronization under normal operating conditions by the converter.
In real applications, to suppress sampling ripple in power measurements, adding a low-pass filter (LPF) to the measured active power gives the inverter the ability to emulate inertia [
11]; furthermore, it filters oscillations present in the powers, allowing for better energy quality. The expressions for
and LPF(s) are given by:
where
is the measured active power and the cutoff frequency
or filter frequency, is usually designed as 10% of the fundamental frequency [
10].
Through an analysis of models for GFM control, VSM (virtual synchronous machines) control, and droop + LPF control are equivalent [
11]; the block diagram representation of this equivalence is shown in
Figure 6. Therefore, the virtual inertia coefficient
and the virtual damping constant
for providing frequency support to the grid are determined by:
Finally, the voltage angle
is calculated as [
11]:
3.1.2. GFM Voltage Control
Control of Voltage Amplitude. In this second outer control loop, through a Q/V droop control the amplitude of the GFM voltage is established, as shown in
Figure 5. The voltage regulator is implemented based on a droop-type controller, meaning that the reactive power contribution of the GFM model depends on the deviation of the system voltage with respect to the reference voltage value. This control is determined through (
15) [
11], where
represents changes in voltage as a function of the difference between the reference reactive power
and the measured and filtered reactive power
of the converter.
3.2. Inner Control Loop
The inner control loop is developed to calculate the modulation signal and regulate the inverter’s output voltage.
For the voltage and current controllers, a cascaded loop has been used; the current loop must have a faster response than the voltage loop and it must be fast enough to ensure that the system operates correctly.
The
inner current control loop is obtained from (
16) [
17]:
where:
and are the d- and q-axis components of the voltage modulation signals, respectively.
and are the values of the inductance current for the d- and q-axis components, respectively.
is the angular frequency, and represent the proportional and integral gains, respectively, of the PI control and represents the inductance of the inverter-side filter.
The
inner voltage control loop is designed to control the AC voltage of the capacitive filter, and is obtained from (
17) [
17]:
where:
and are the d- and q-axis components inductance current references, respectively.
and are the voltage references.
is the angular frequency, and represent the proportional and integral gains, respectively, of this PI control. For voltage control, represents the capacitance of the filter and is the feedforward current gain.
This work focuses on the external GFM control of the inverter. For the correct determination, calculation, and validation of the PI constants in the internal voltage and current controls, the reader is referred to the information provided in [
17,
18,
19,
20] for more details.
4. Simulation Results
This section presents numerical simulations performed in MATLAB/Simulink (version R2020b) with a 5 µs integration step to validate the control performance of a GFM inverter based on the control strategy presented in
Section 2. All electrical and electronic elements within the studied power system, including the inverter, switching devices, filters, grid model, and load components, were implemented using pre-built blocks from the Simscape Electrical™ library (part of the Simscape Power Systems toolbox) within MATLAB/Simulink. All simulation parameters and system constants used in this work are detailed in
Table 1.
The power interface stage in this study is implemented using a Voltage Source Converter (VSC) with a two-level Full-Bridge topology. This converter utilizes IGBTs (Insulated-Gate Bipolar Transistors) as switching devices. For generating the AC output voltage, the Unipolar Sinusoidal Pulse Width Modulation (SPWM Unipolar) technique is employed for pulse width modulation. This specific technique is chosen for its advantages in harmonic content reduction, as it effectively doubles the perceived switching frequency at the load without requiring a split DC-link configuration.
4.1. Model Assumptions and Simplifications
The current simulation model focuses exclusively on the AC side control dynamics of the GFM inverter. The 20 MW converter corresponds to an aggregated representation of multiple converters operating in parallel at the LV interface. Such aggregation is a standard modeling practice that maintains equivalence in terms of power capability, dynamic response, and grid interaction, while enabling a simplified representation and a substantial reduction in computational burden. Also, for simplicity and to isolate the frequency stability contribution, the DC link voltage source was modeled as an ideal constant voltage source. Consequently, the fast dynamics and constraints of the full system—including specific Voltage-Source Converter (VSC) models for Variable Renewable Energy (VRE) sources (e.g., solar or wind) and Battery Energy Storage Systems (BESS)—were not considered in this scope. These integration aspects remain the subject of future work.
The base parameters utilized for the grid model were selected to represent a generic, balanced distribution system and may not accurately reflect the complex physical characteristics (e.g., line impedances, transformer tap settings) of a real-world power grid. While this simplification allows for a clearer analysis of the GFM control strategy’s core function, the overall performance under physically realistic, highly asymmetrical, or unbalanced grid conditions will be investigated in subsequent studies.
4.2. Test Case 1: Islanded Mode
This test is intended to verify the GFM’s ability to establish and regulate grid voltage and frequency without a connection to the grid. The goal is to demonstrate its role as a “grid-former”.
Scenario Description: A GFM inverter is connected to a local load system with no connection to the main power grid. The load can be fixed or variable.
Actions to Perform:
Initiate the GFM inverter.
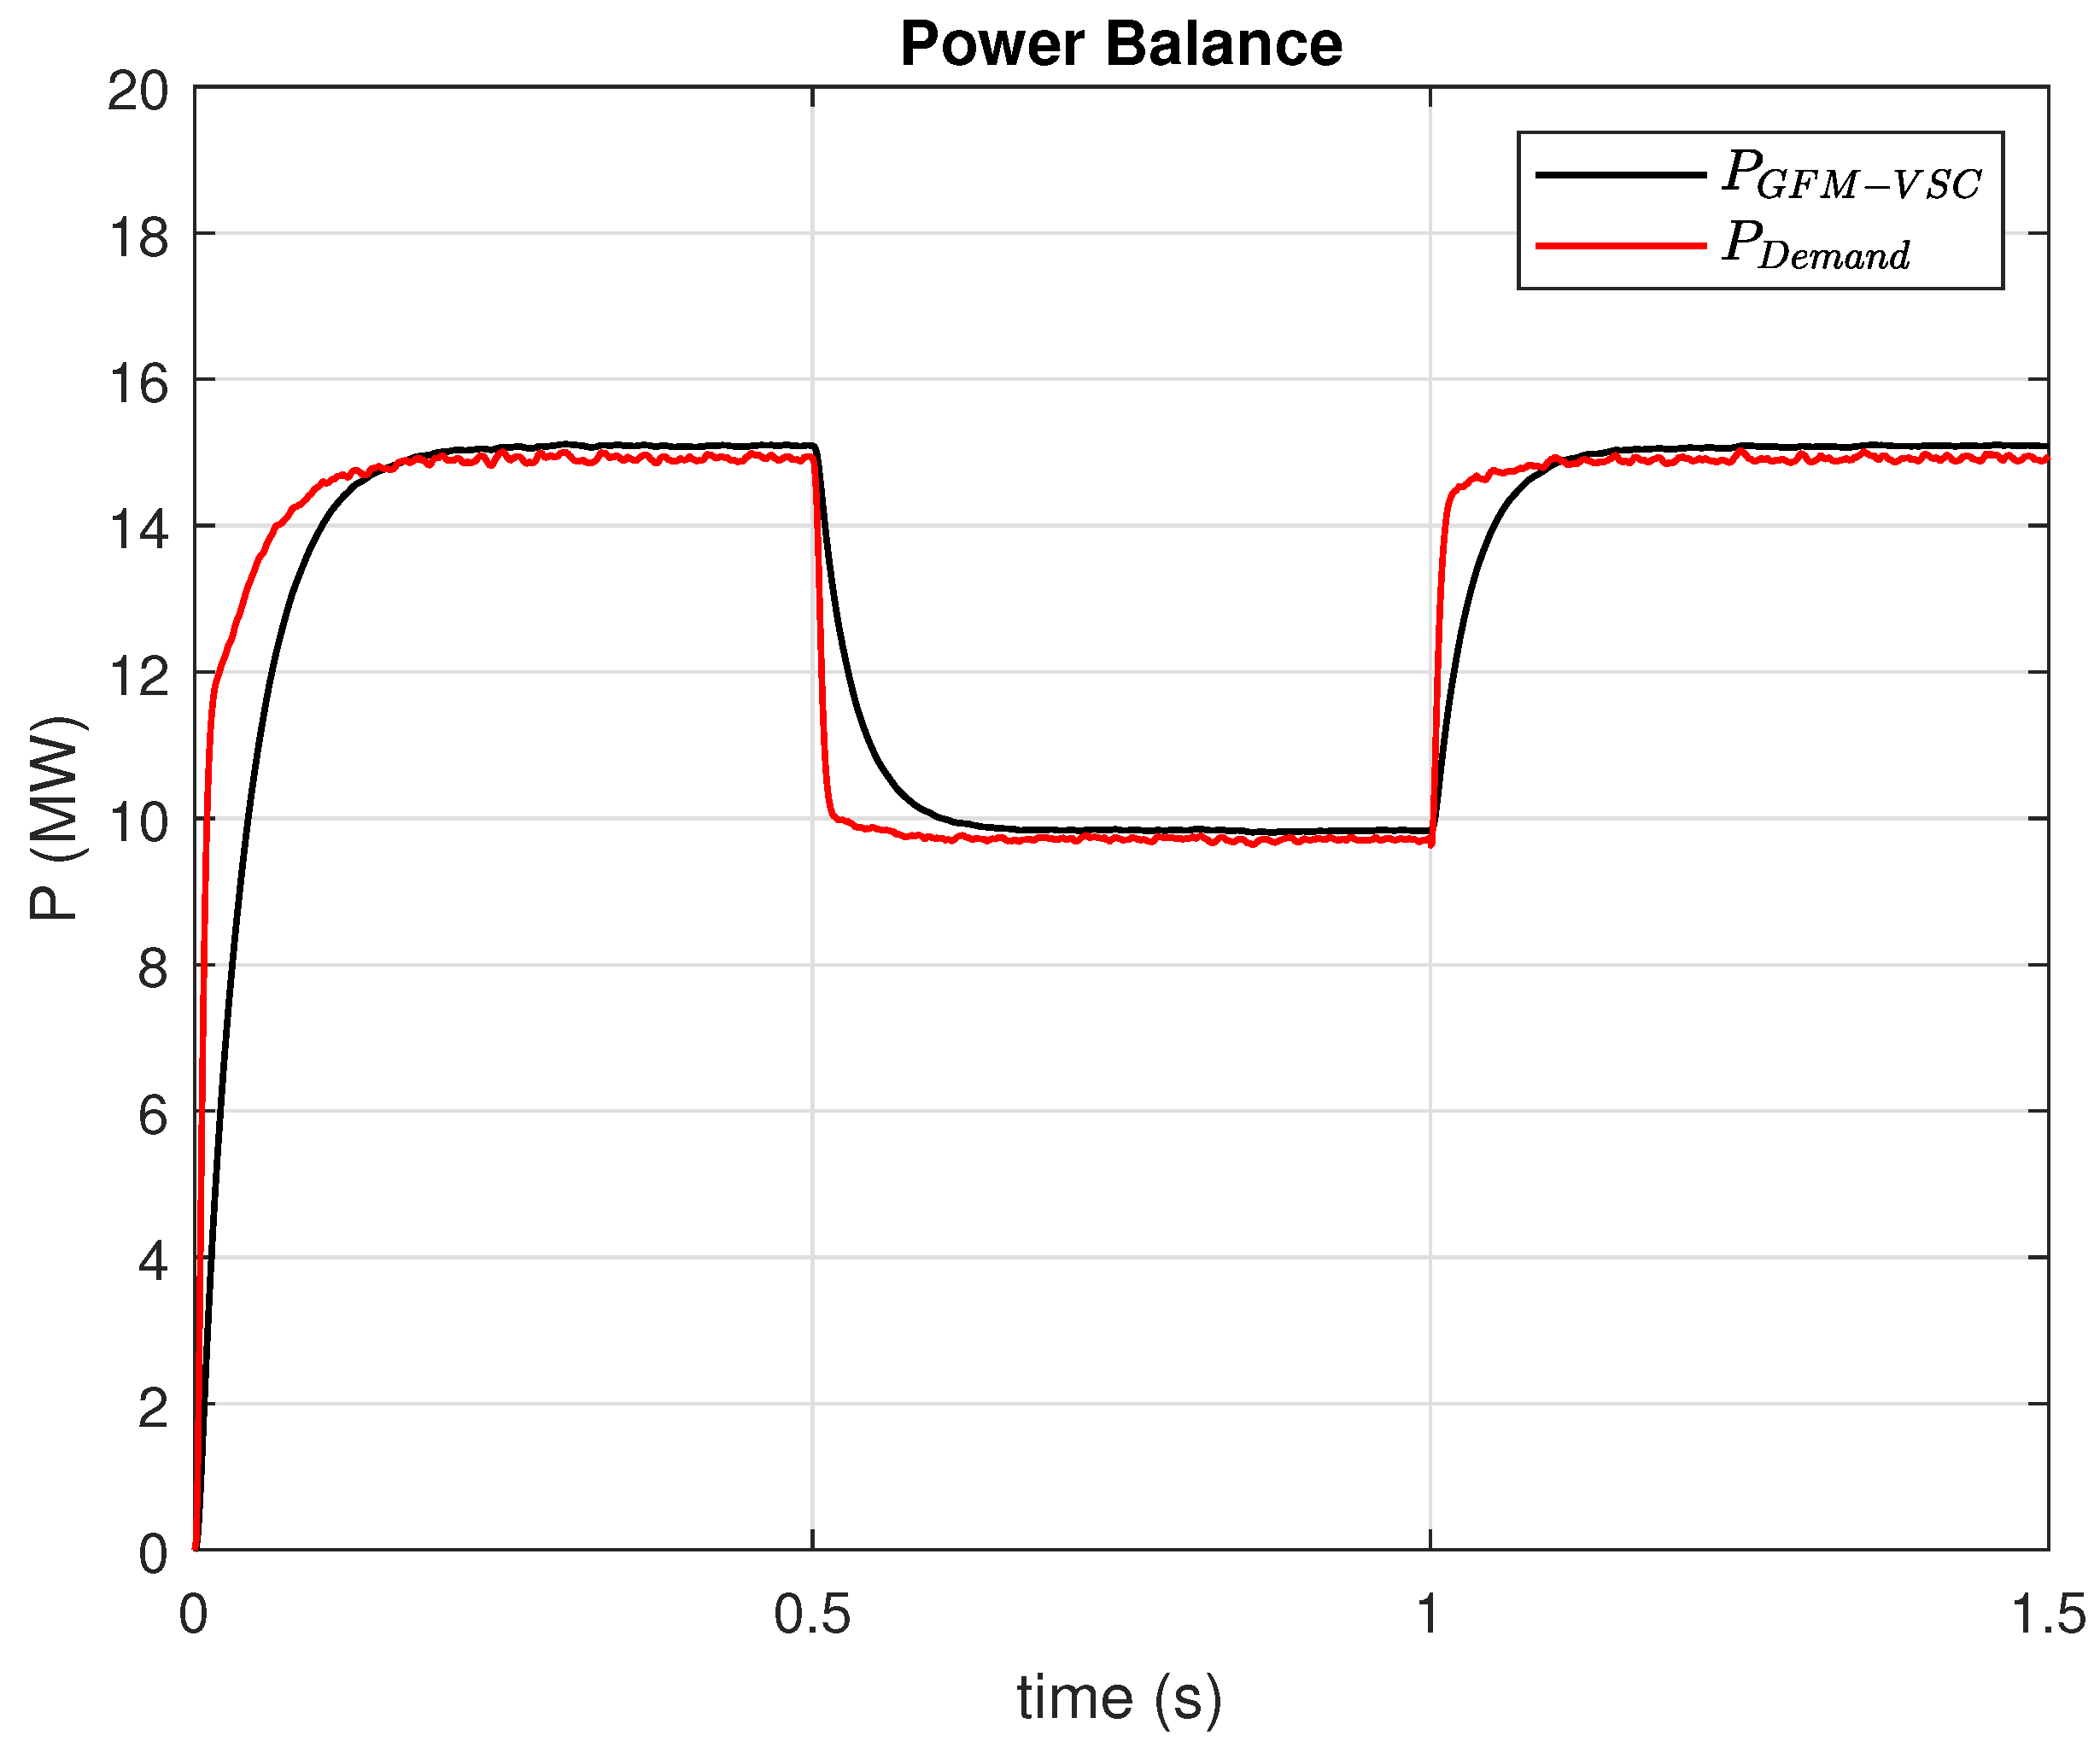
Apply a sudden load change (e.g., a load step) to the system. The connection of a 15 MW load is initiated, then a sudden removal of 5 MW occurs at 0.5 s, and at time 1 s, the load is increased back to its maximum.
Measure the output voltage and frequency at the inverter’s terminals.
Record the voltage and frequency response over time.
Expected Results:
The inverter must establish the nominal grid voltage and frequency.
During a load change, the GFM should quickly regulate the voltage and frequency, ensuring they remain within acceptable limits, thus demonstrating effective inertia support and regulation.
Maintain the active power balance while keeping the frequency within recommended limits.
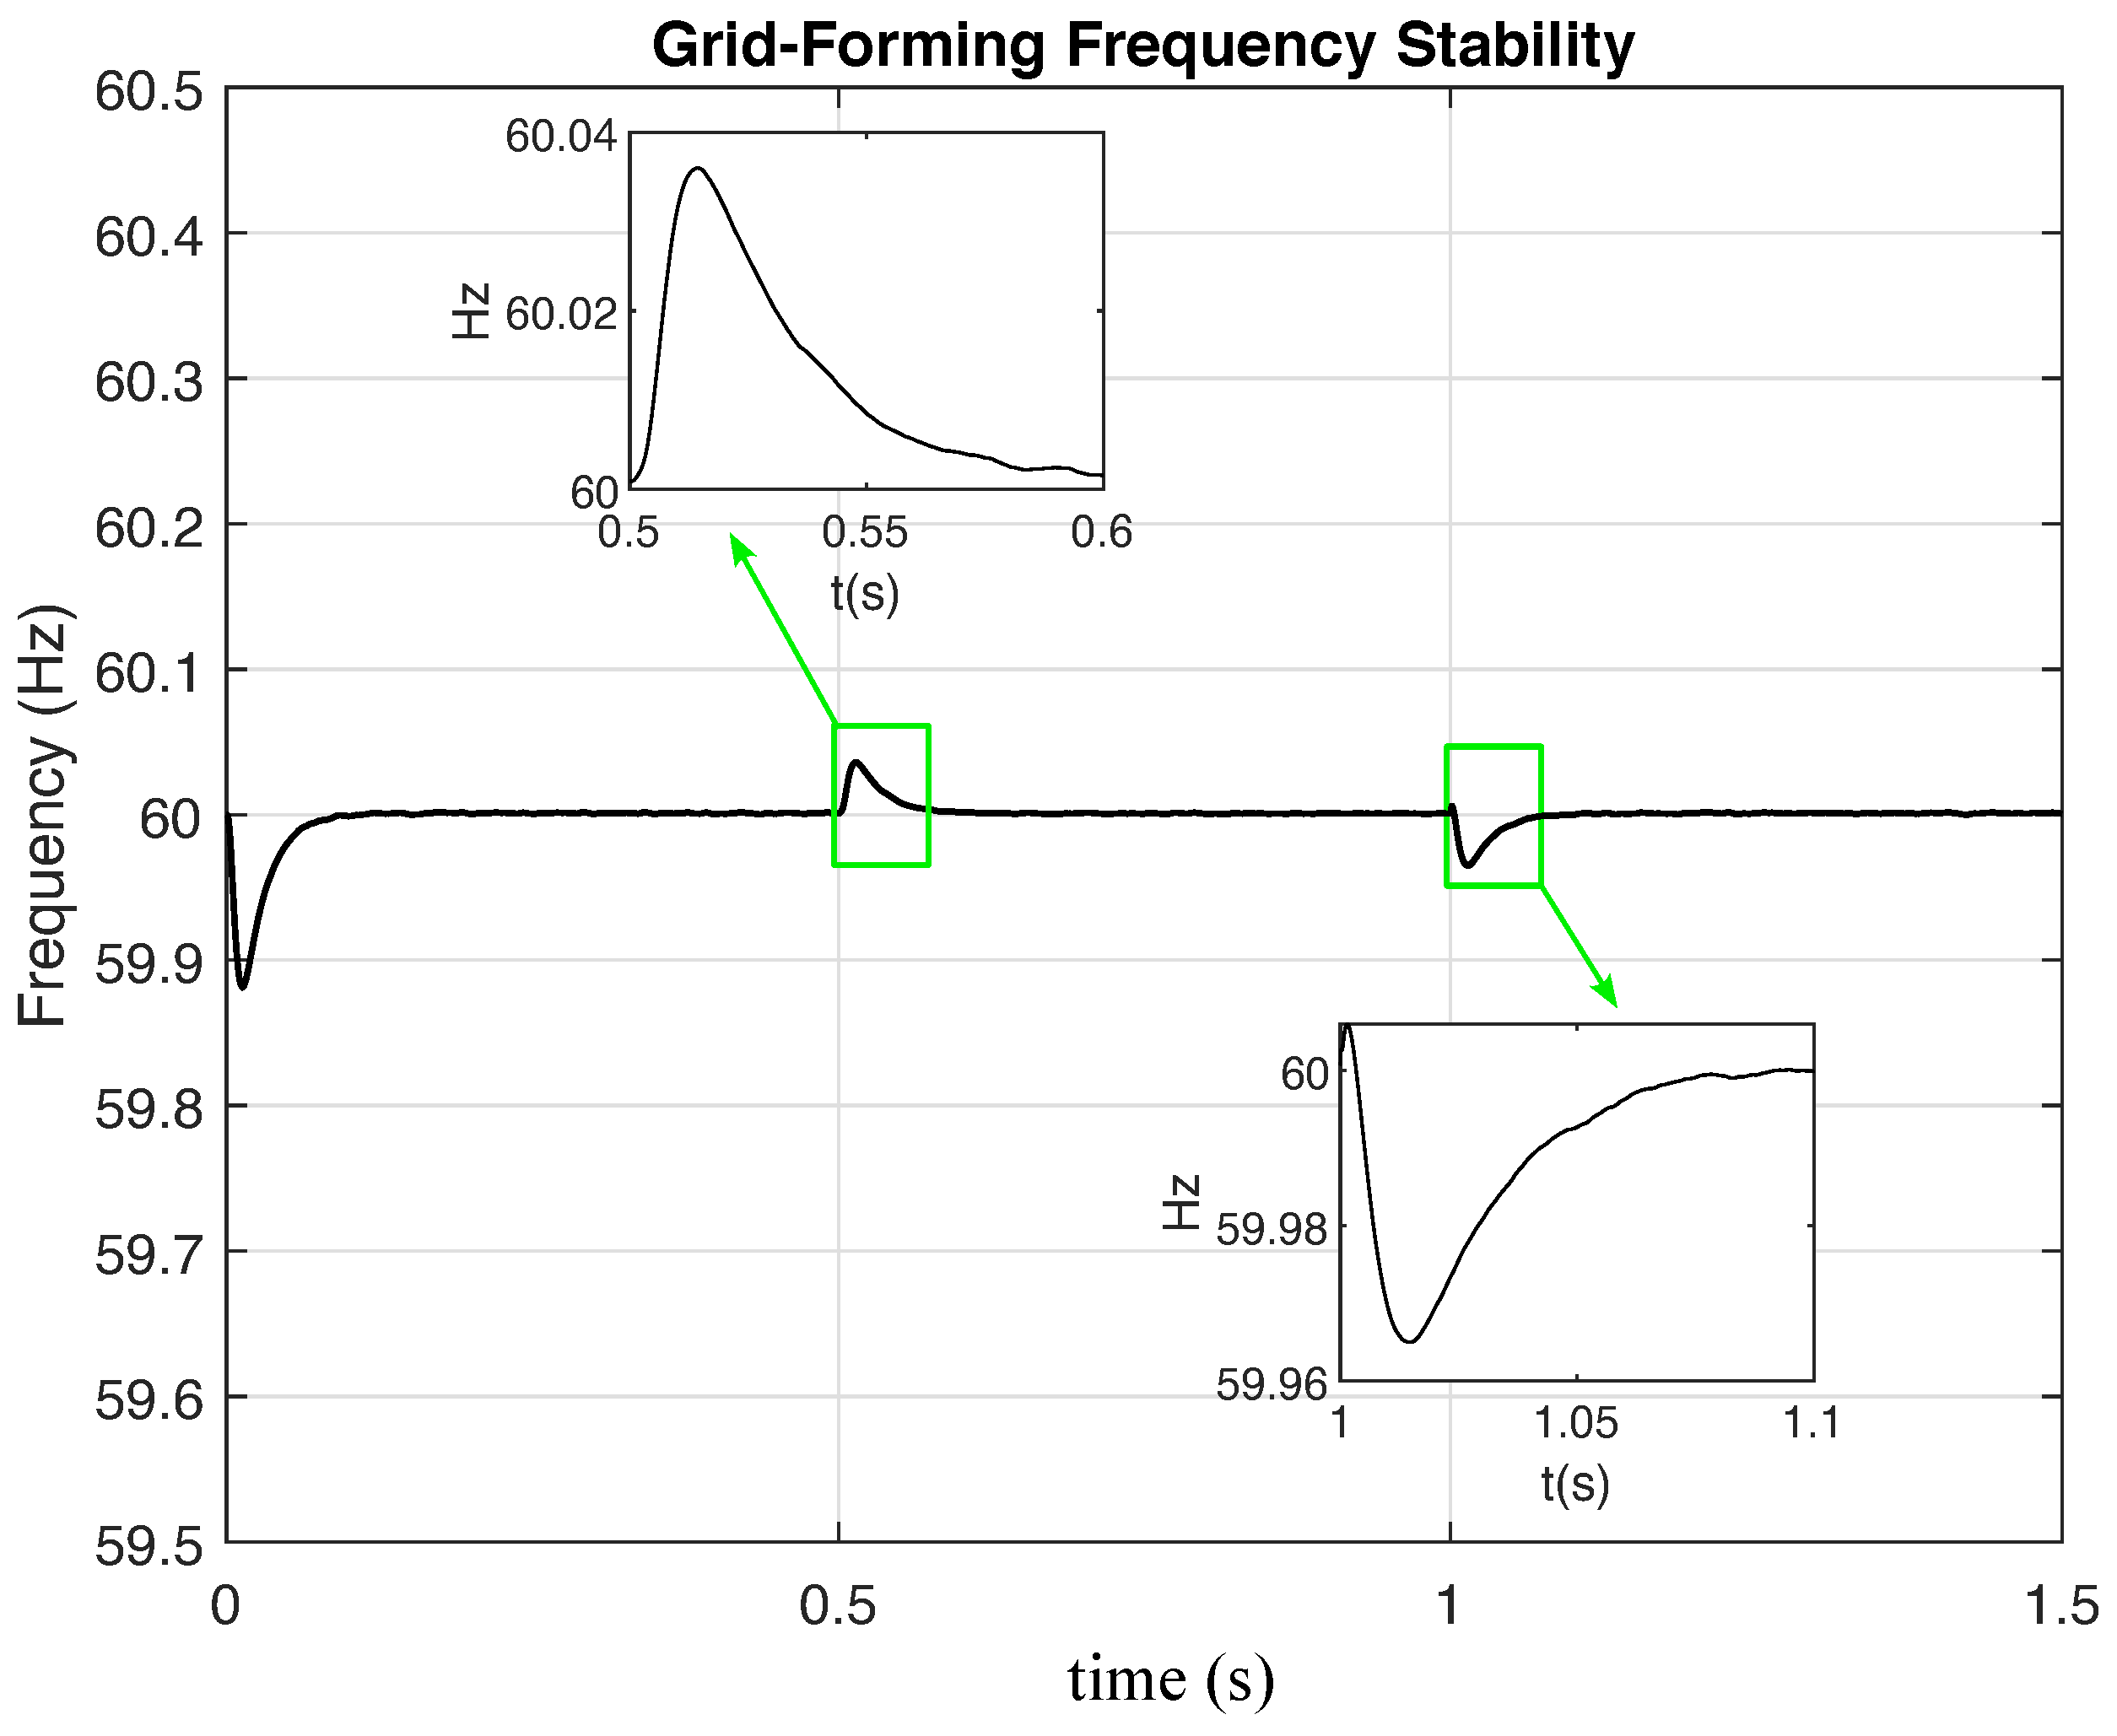
Power imbalances between generation and demand, as illustrated in
Figure 7, cause frequency deviations from the nominal value (
Figure 8). The sudden increase in load to approximately 18 MW is attributed to the transient produced during a load change, where an ideal switch and an additional RL load were employed.
However, during the GFM’s test in islanded mode, excellent frequency stability is observed, which is achieved through the inverter’s droop + LPF control technique. At the 0.5 s and 1 s time instances, in response to an abrupt load change of MW, the GFM’s controller adjusts its active power output in a matter of milliseconds.
This adjustment of the power output allows it to quickly reach the given reference value, which in this case is the power measured at the terminals of the RL load. This action, driven by the GFM’s virtual inertia and primary control, not only minimizes frequency deviations but also automatically activates a secondary control to restore the frequency to its nominal value of 60 Hz, as evidenced in the close-ups of
Figure 8.
This behavior is fundamental for the microgrids stability, as it shows that the GFM can autonomously and rapidly respond to load variations. Unlike grid-following converters, the GFM does not depend on external grid frequency signal; instead, it actively regulates frequency itself, thereby assuming functions traditionally performed by synchronous generators.
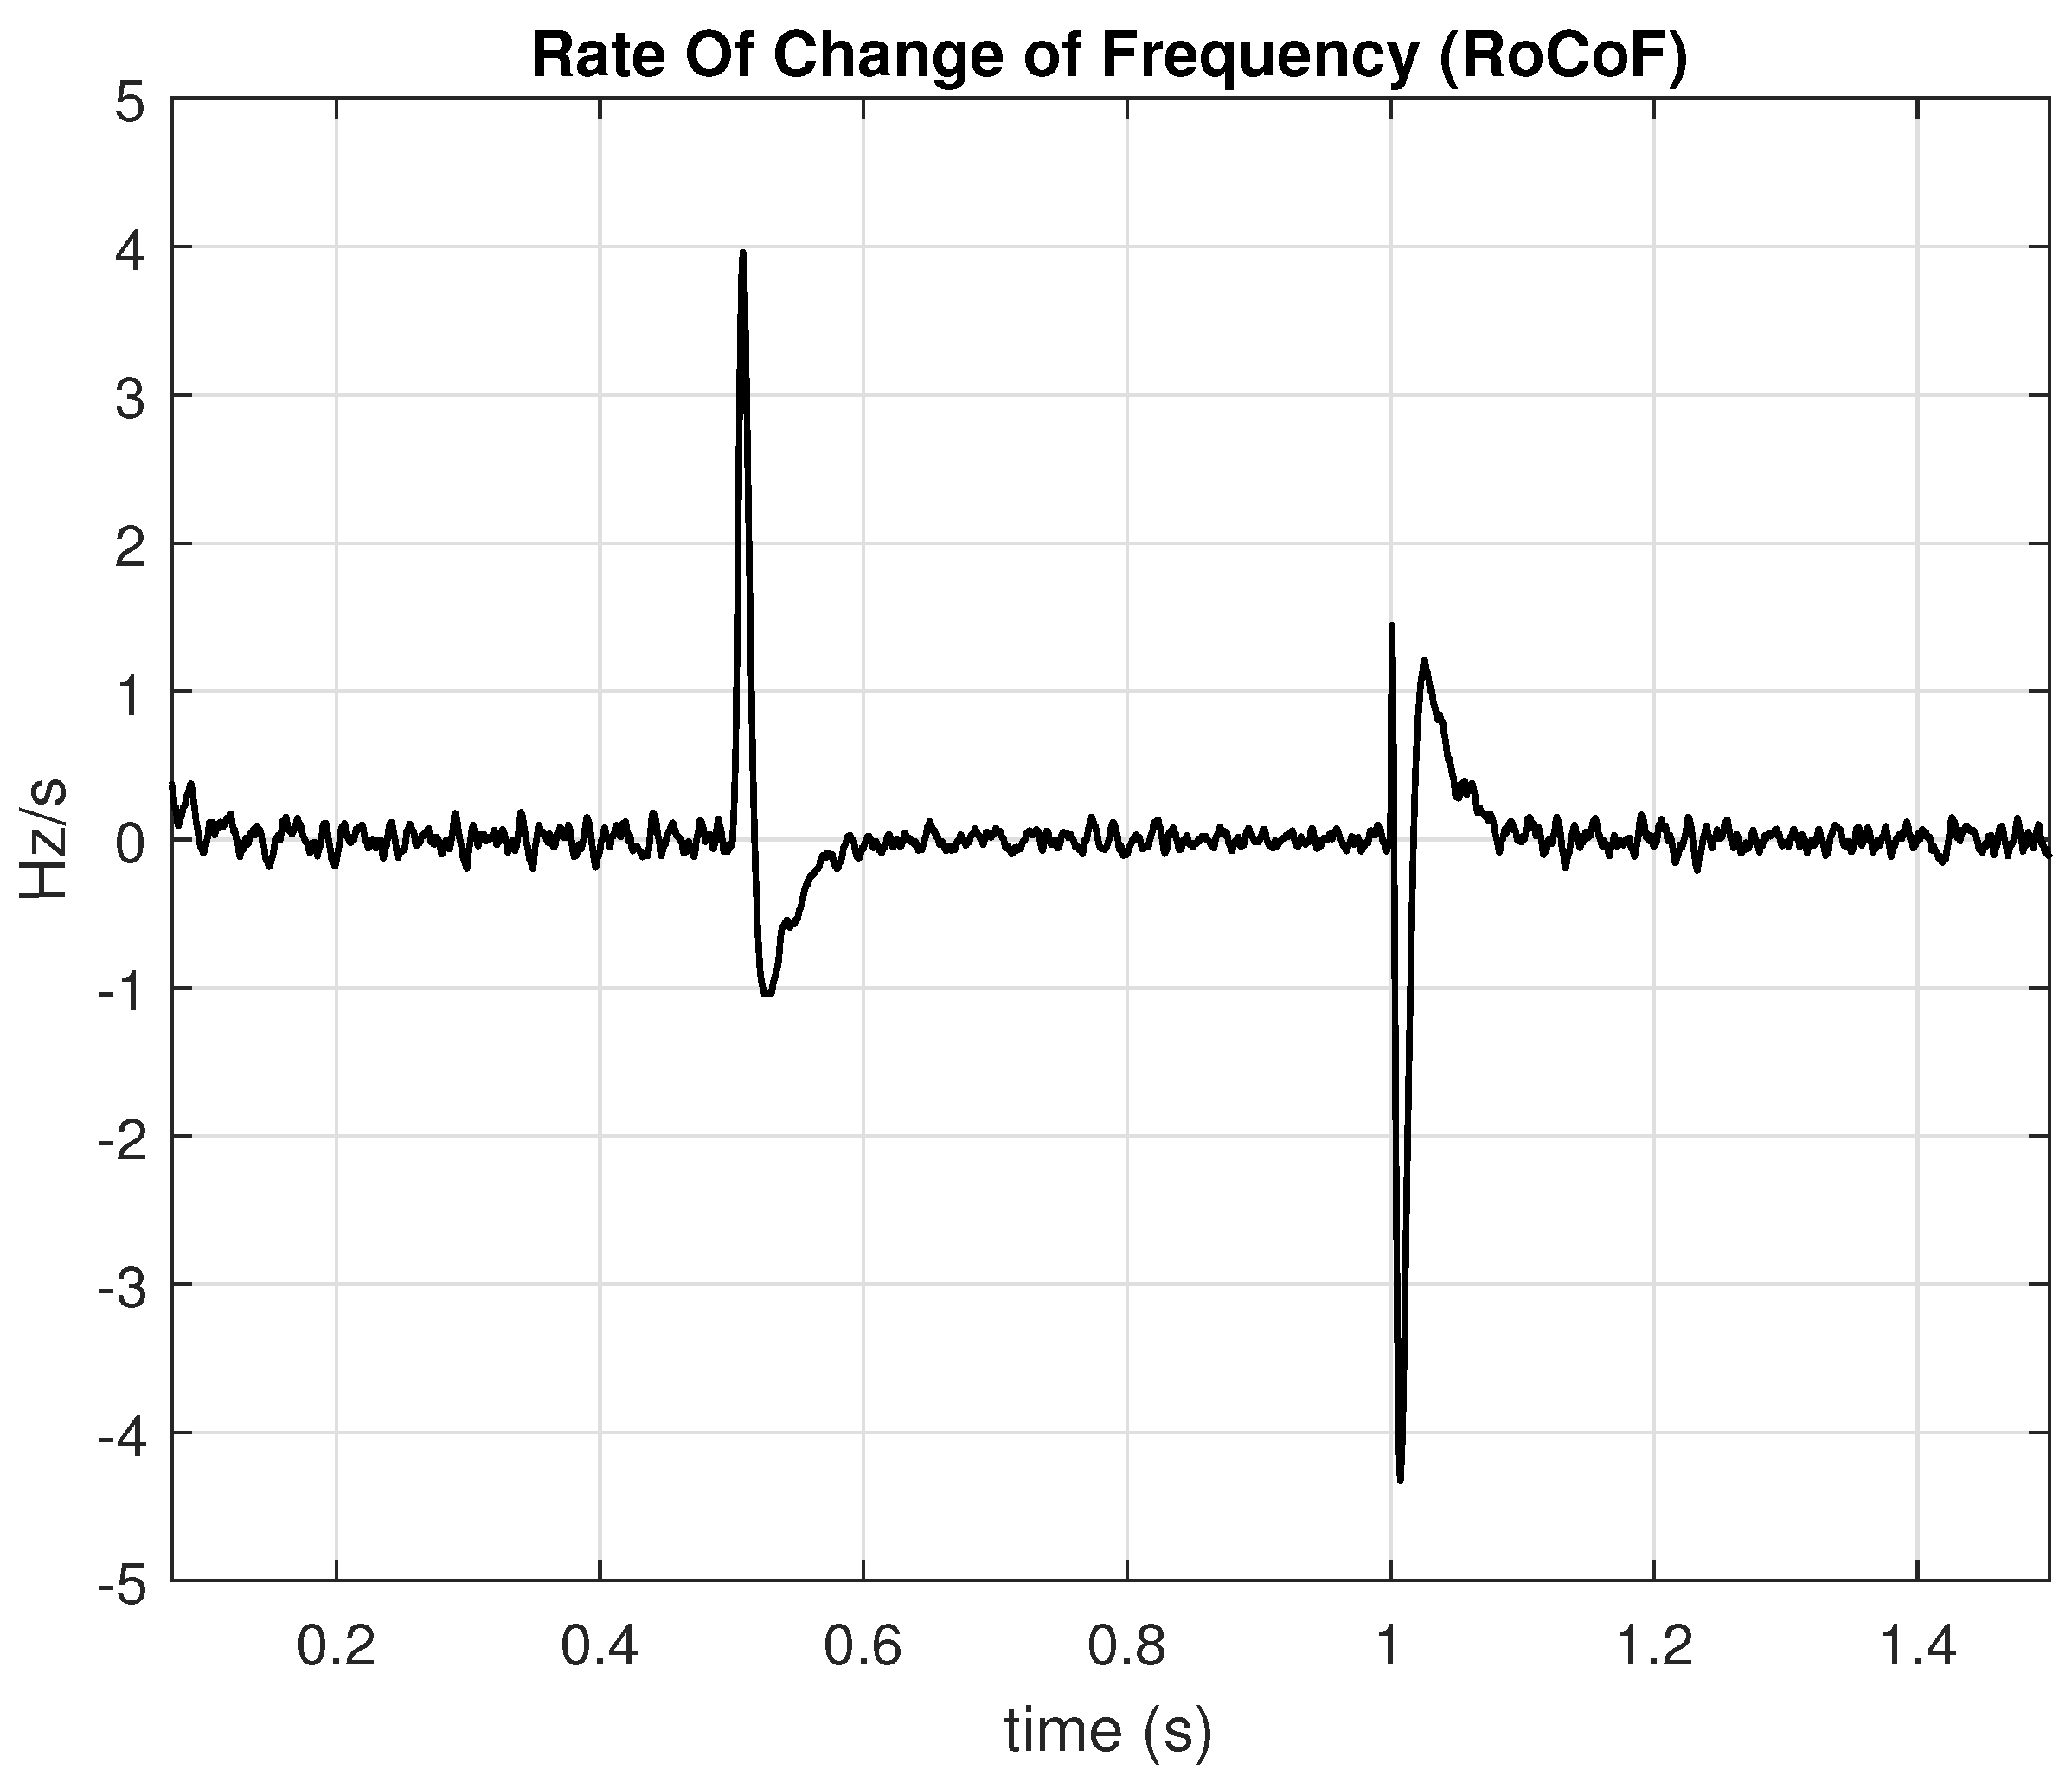
Figure 9 shows the variation of the RoCoF during the operation of this case study.
The study was carried out in a electromagnetic transient environment to evaluate the power quality of the system given that the power electronics of renewable sources are a primary source of power quality issues.
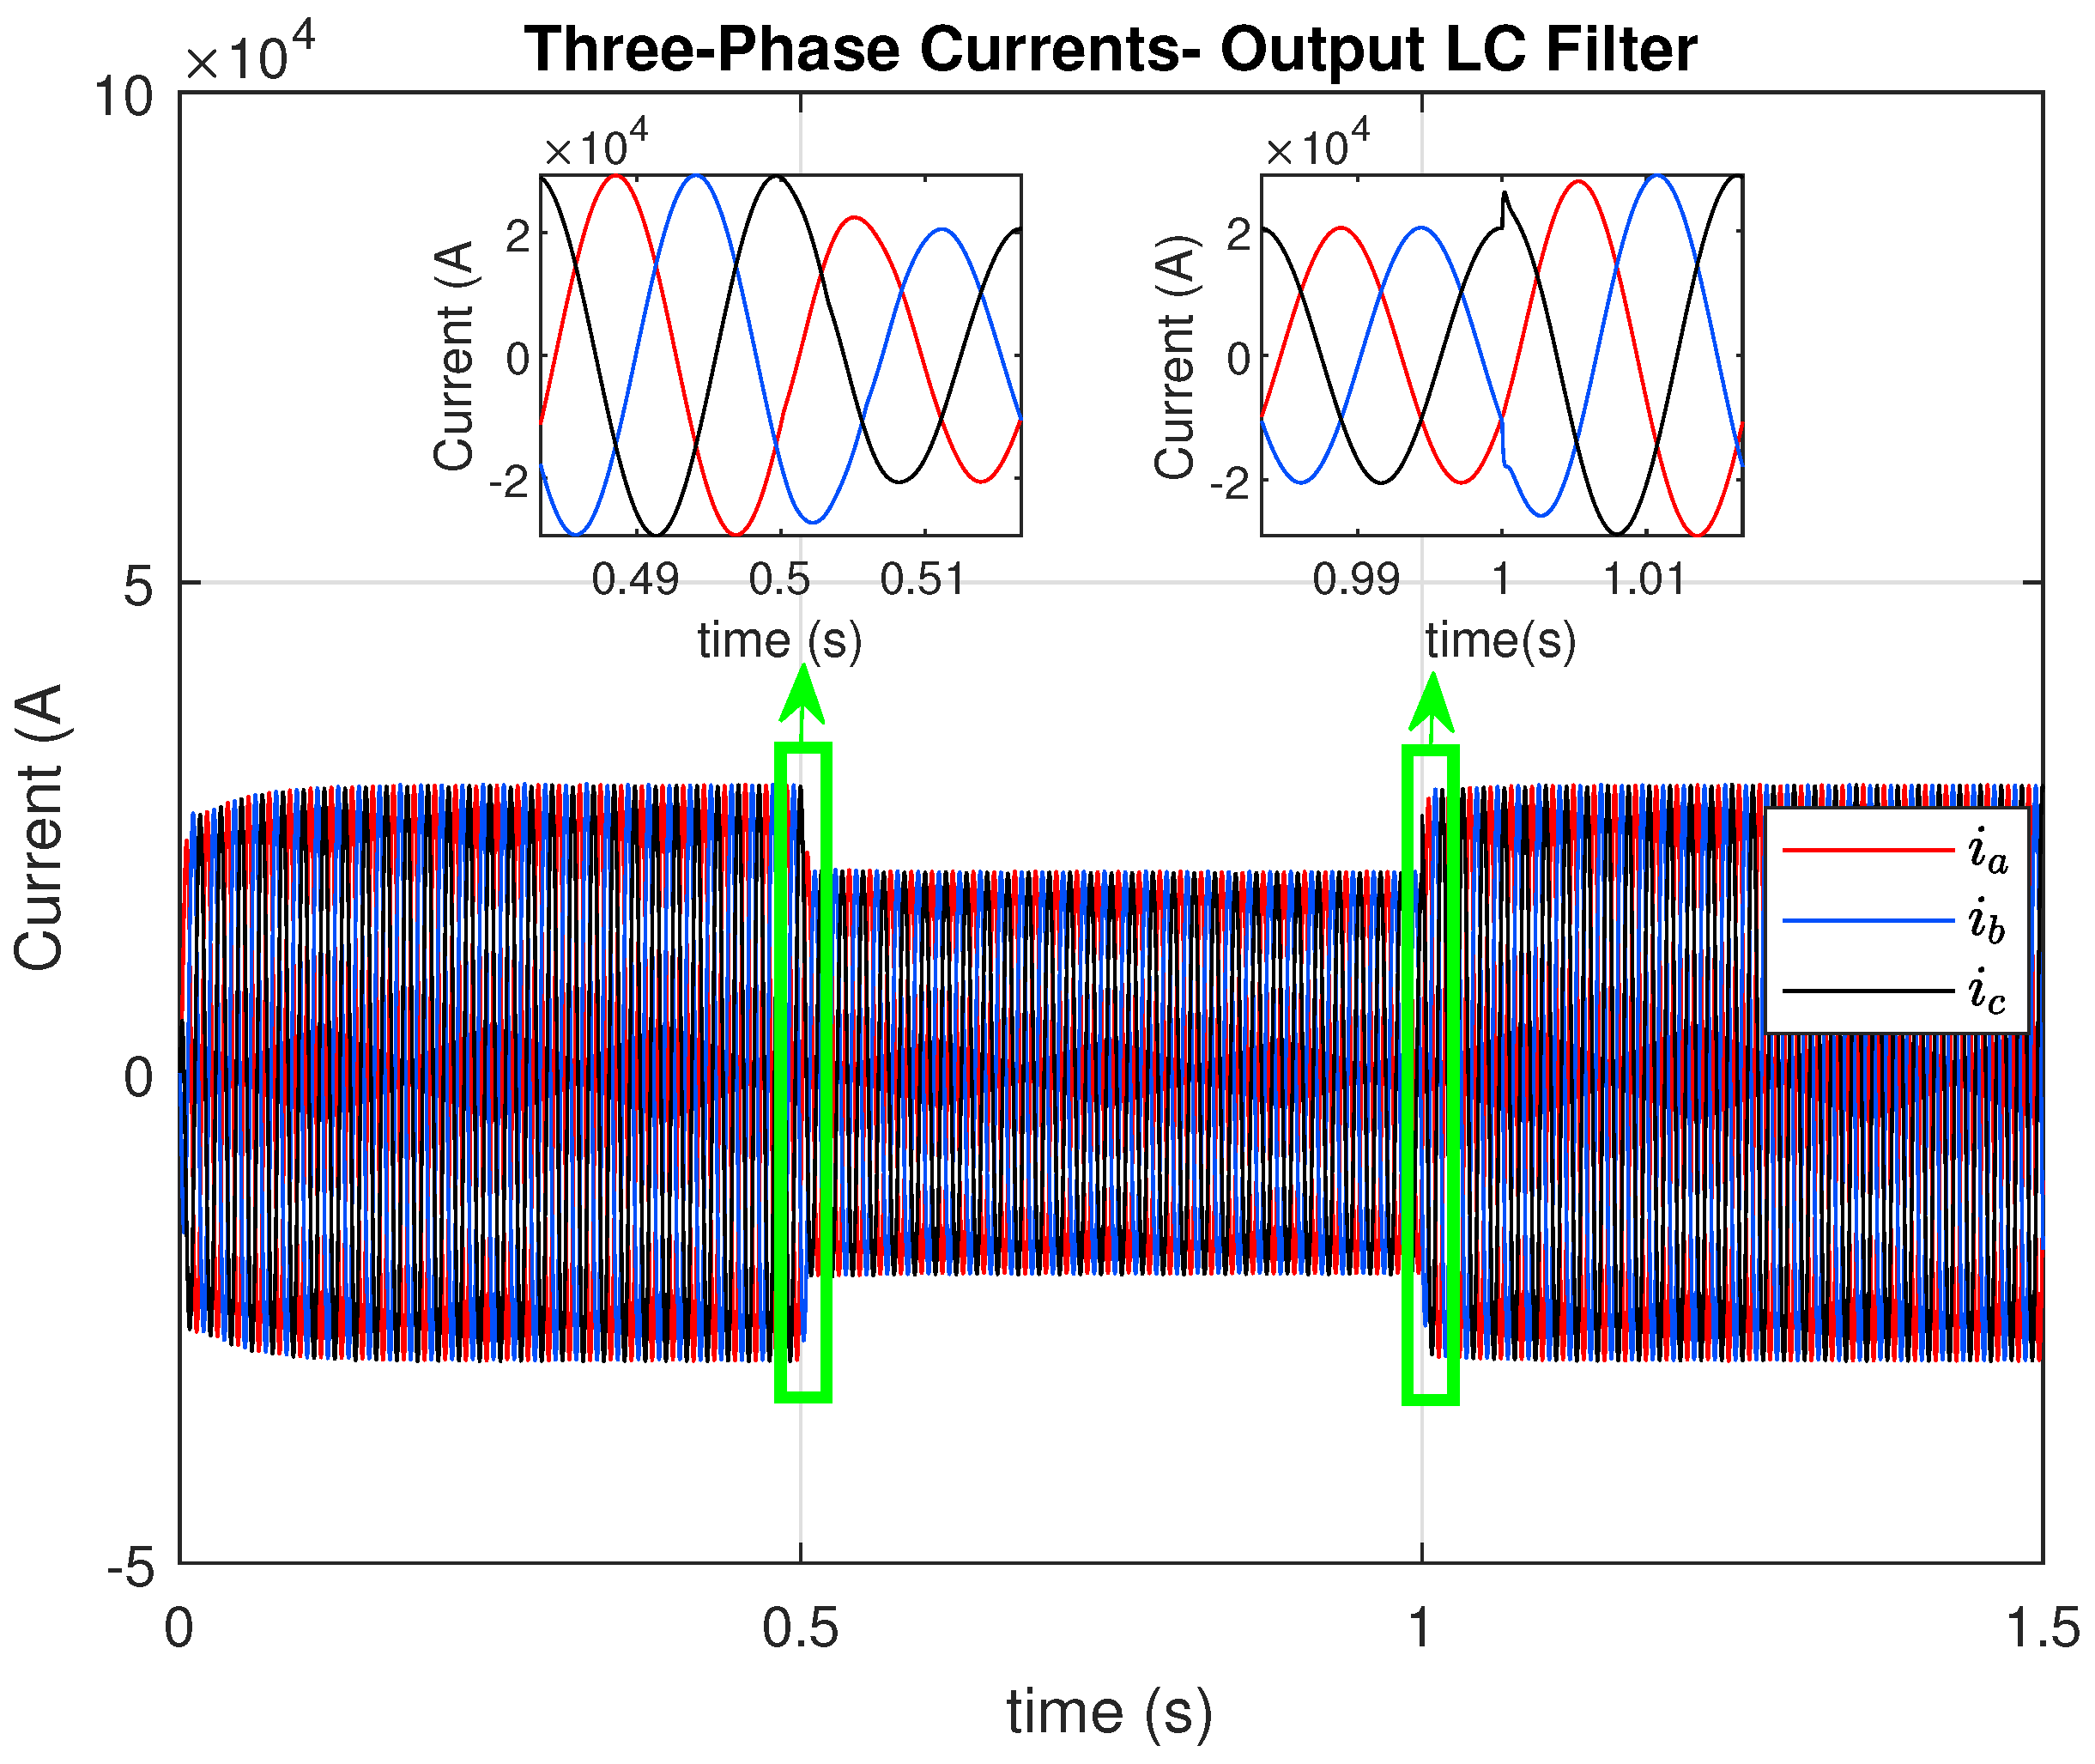
Figure 10 shows the current waveform at the GFM inverter’s LC filter output, and
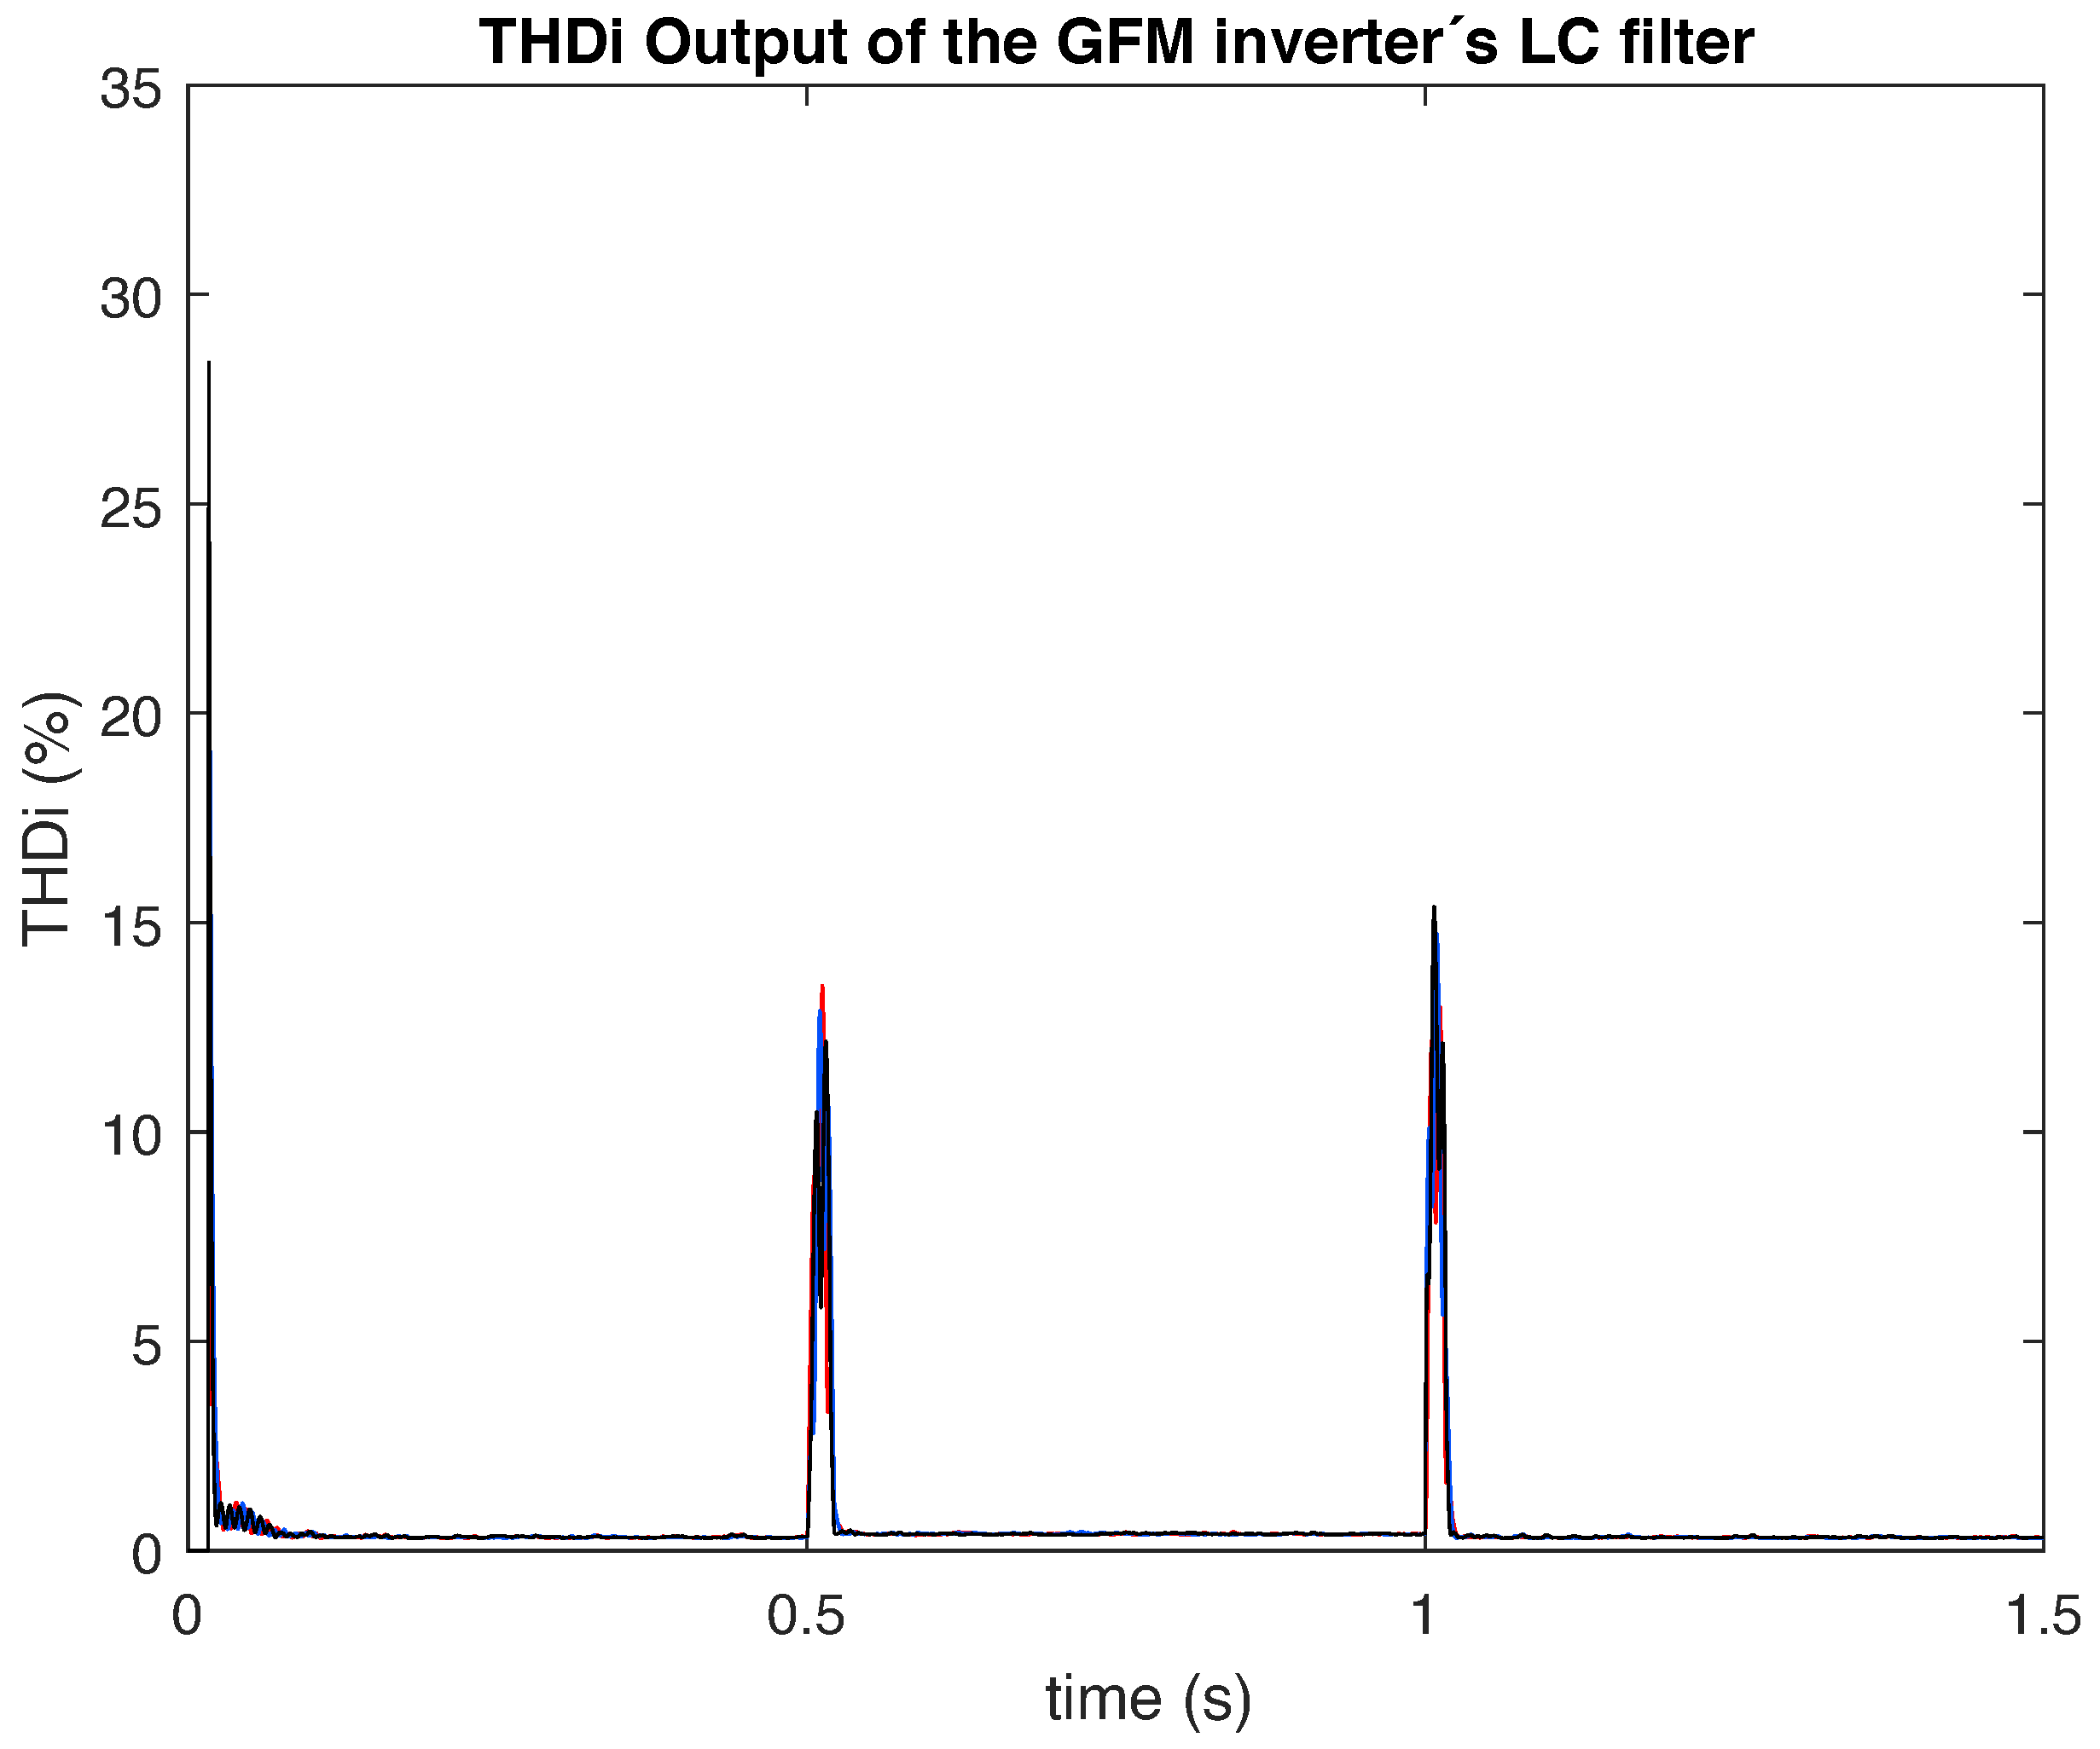
Figure 11 the corresponding total harmonic distortion (THD).
Figure 12 and
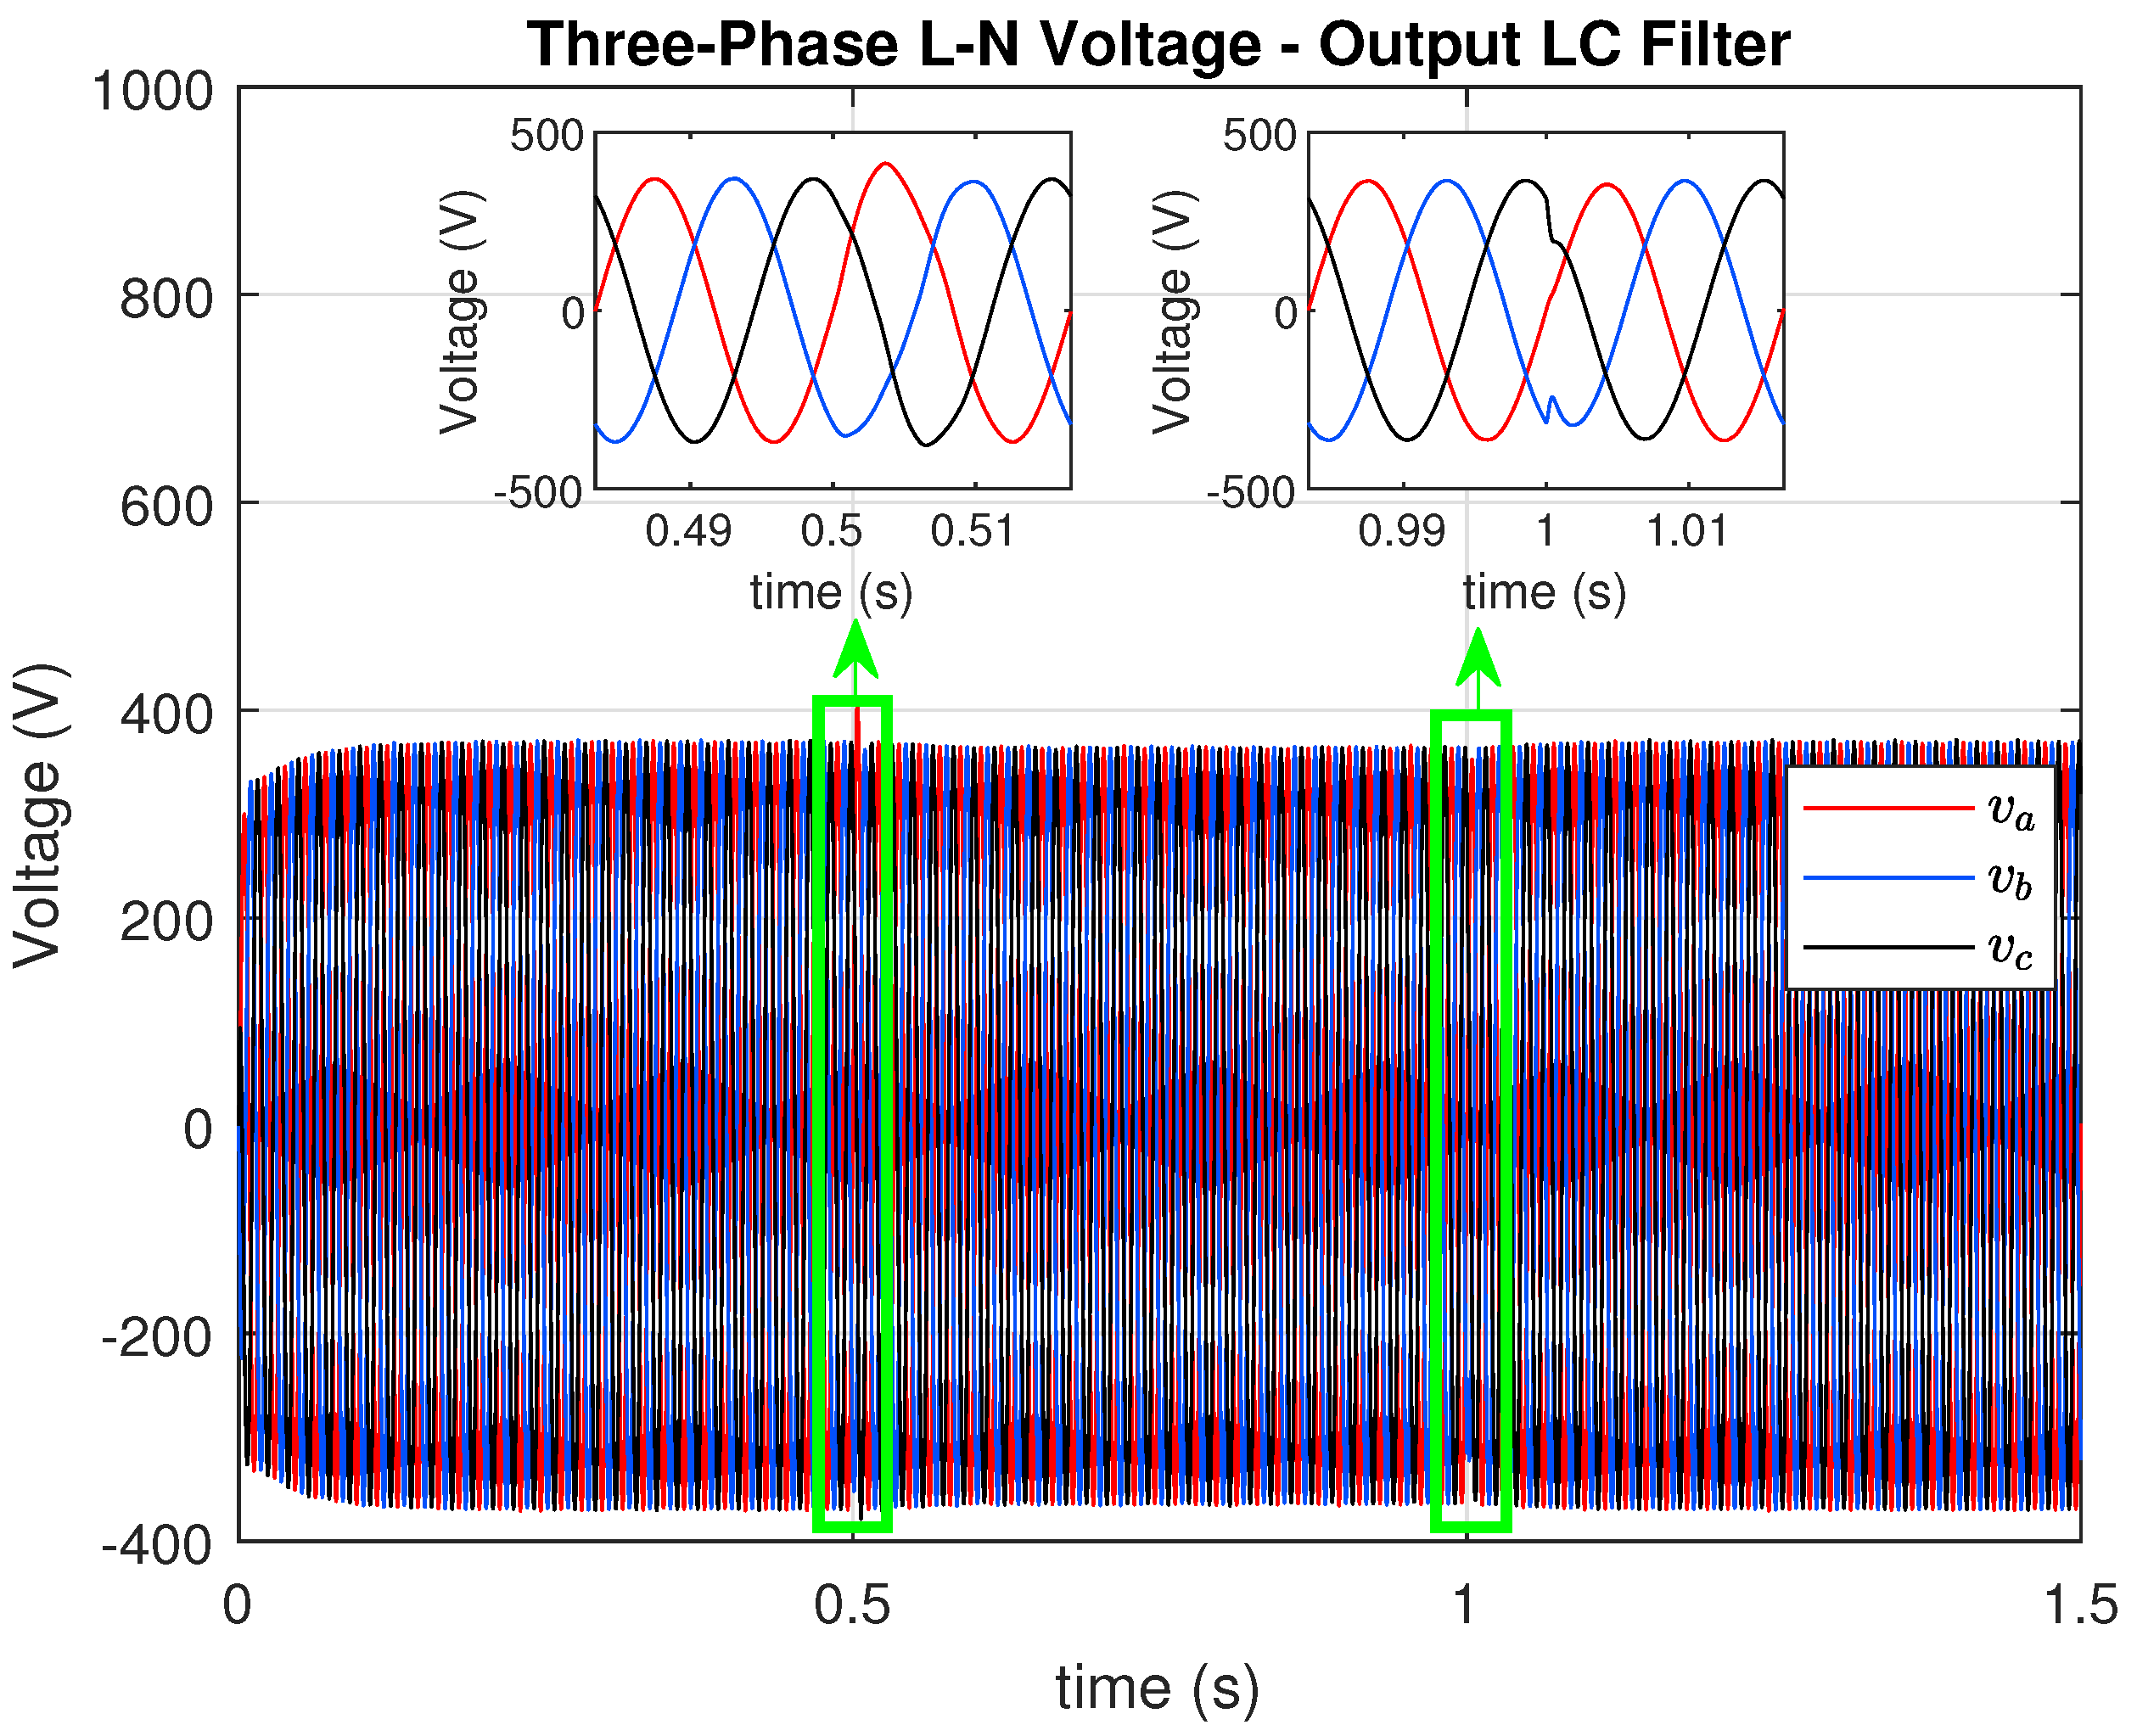
Figure 13 correspond to the voltage waveform and their THD, respectively.
GFM control establishes the island’s three-phase AC voltage
of 359.2 V peak and frequency at 60 Hz (see
Figure 12), delivering a stable AC current to the three-phase RL loads (see
Figure 10). The controller also maintains a constant load voltage and increases the AC load current in a few milliseconds when the load increases. The load-side converter also provides black start functionality. The power quality from the proposed isolated GFM control, in terms of AC voltage and current THD, is experimentally measured and found to be below the limit of 5% (see
Figure 11 and
Figure 13).
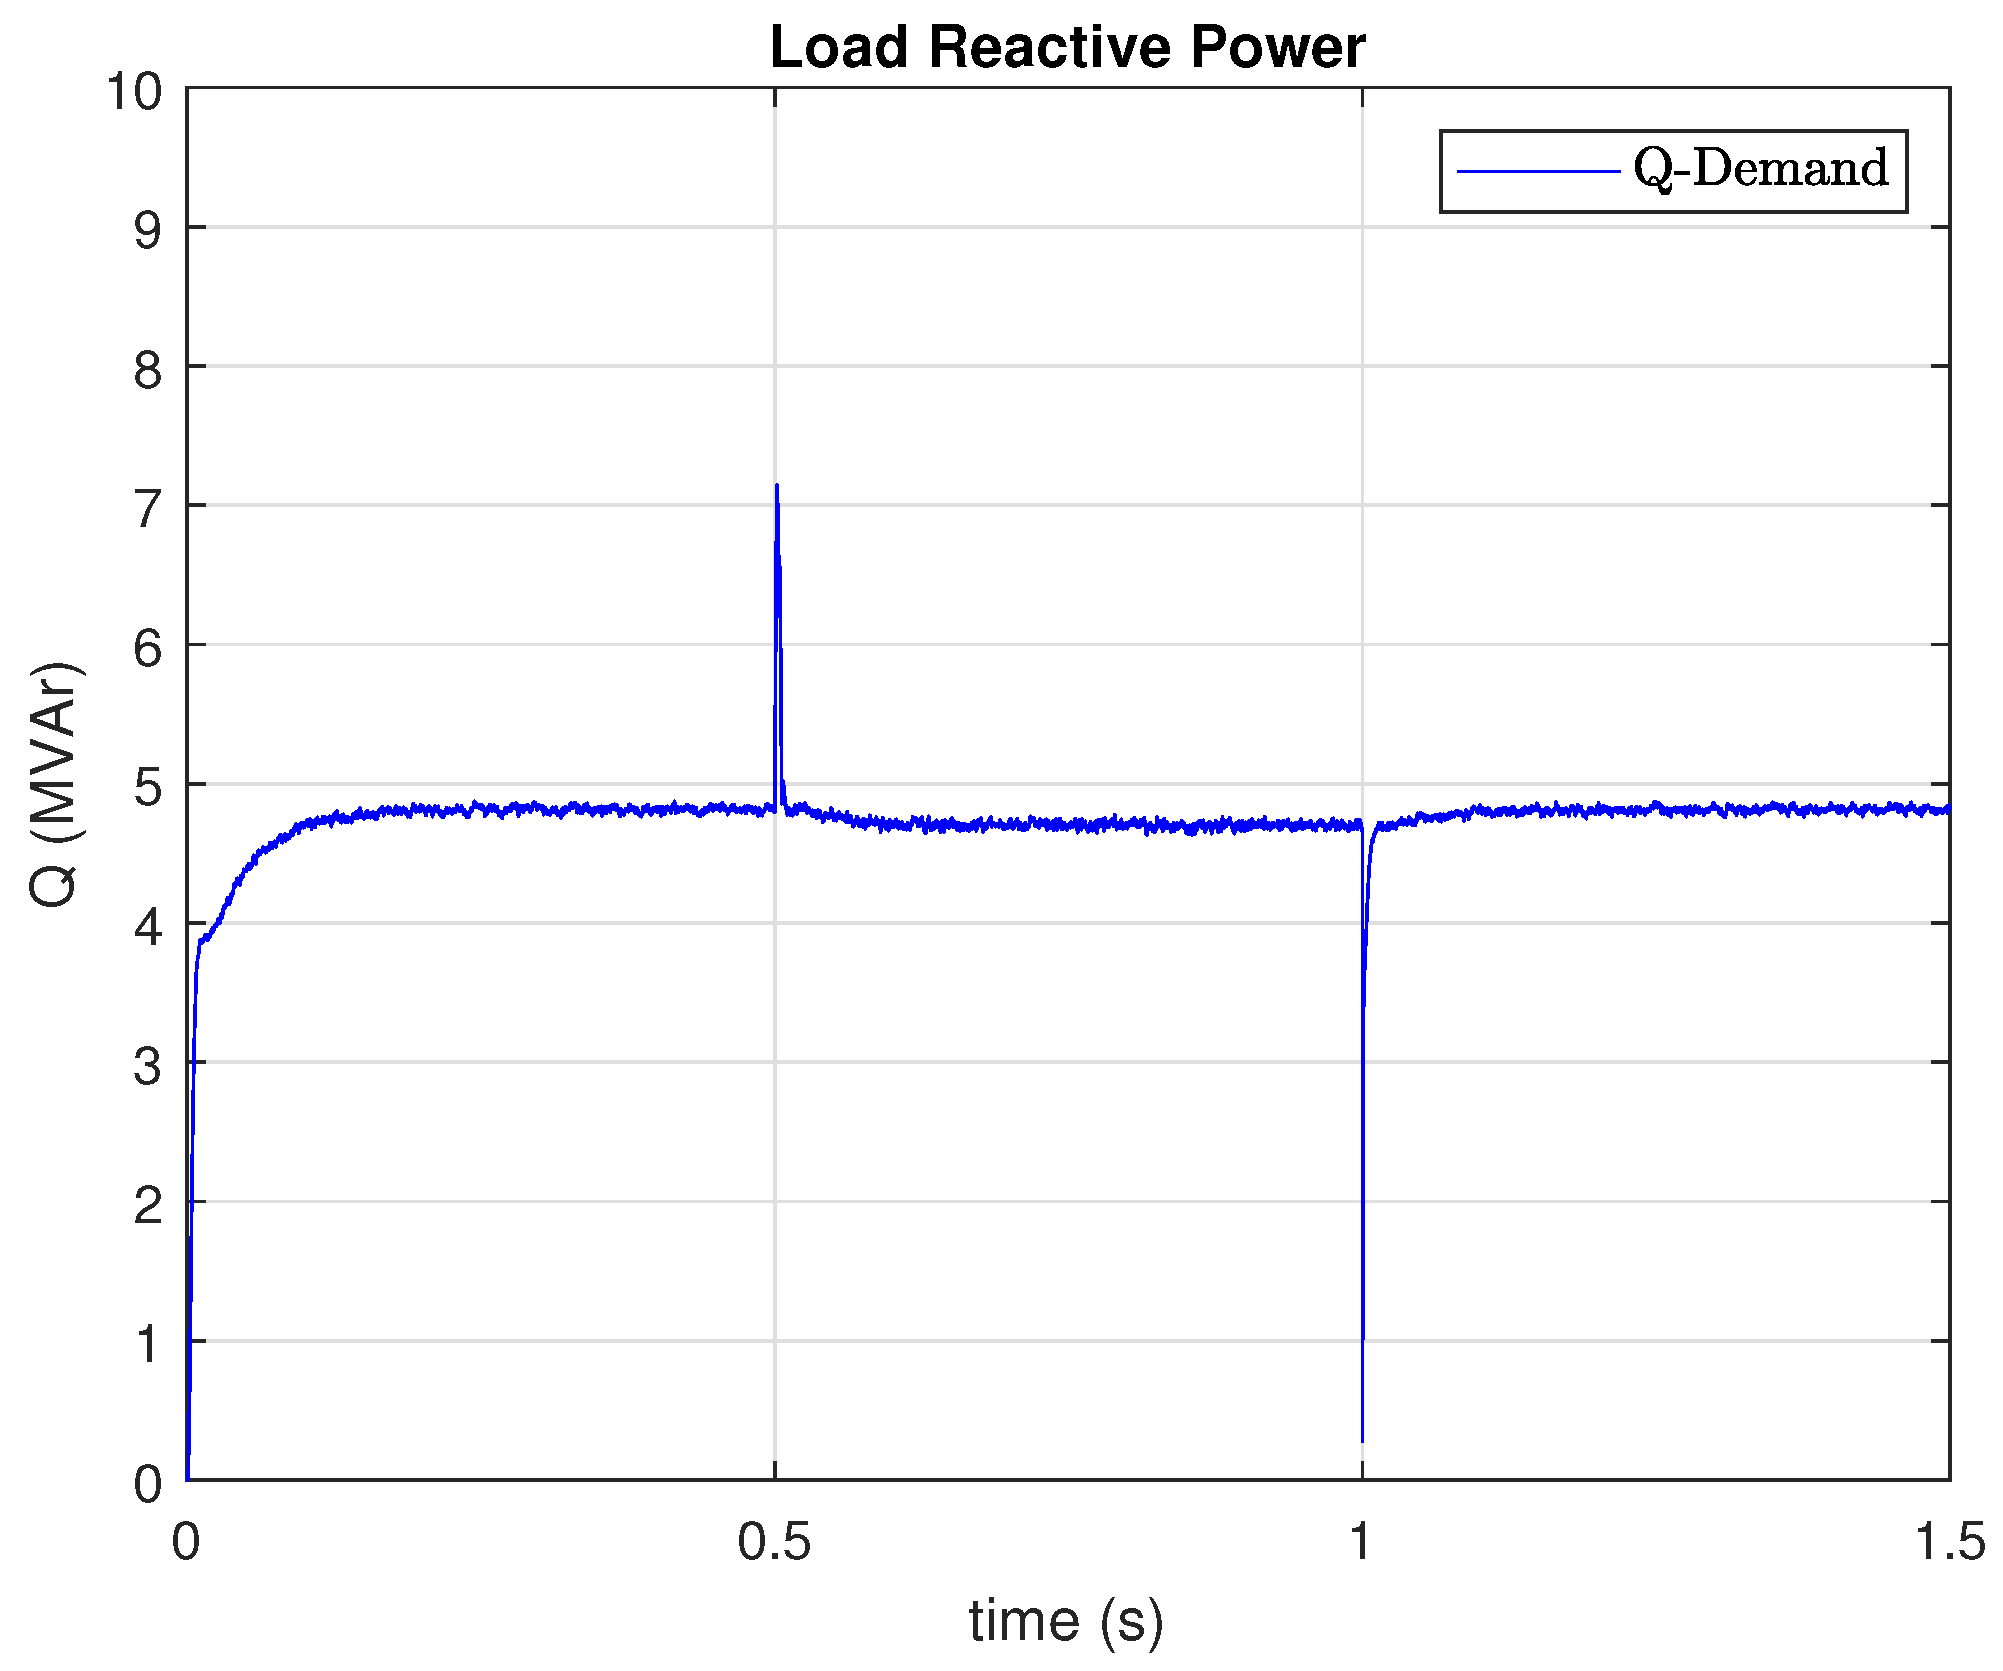
Figure 14 illustrates the dynamic behavior of the reactive power consumed by the load.
The converter operates with a switching frequency of 15 kHz, and THD the load’s three-phase AC voltage and current was analyzed under this condition. According to IEEE Standard 1547, the harmonic distortion limits for both voltage and current are defined under steady-state operating conditions at PCC. In this study, although transient events produced values of up to 15% for current and 8% for voltage, the steady-state results remained well within the standard’s requirements, with both current and voltage THD measuring below 1%. These findings confirm that the microgrid complies with IEEE 1547 under normal operation, while transient excursions highlight the need for robust control and mitigation strategies to minimize short-therm harmonic impacts. Furthermore, this analysis underscores the importance of evaluating power quality using detailed electromagnetic transient models, since averaged models are unable to capture the harmonic distortion phenomena observed in this case. This level of modeling fidelity is essential for microgrids, where the interaction of renewable sources and power electronic converters plays a critical role in overall system stability and compliance with standards.
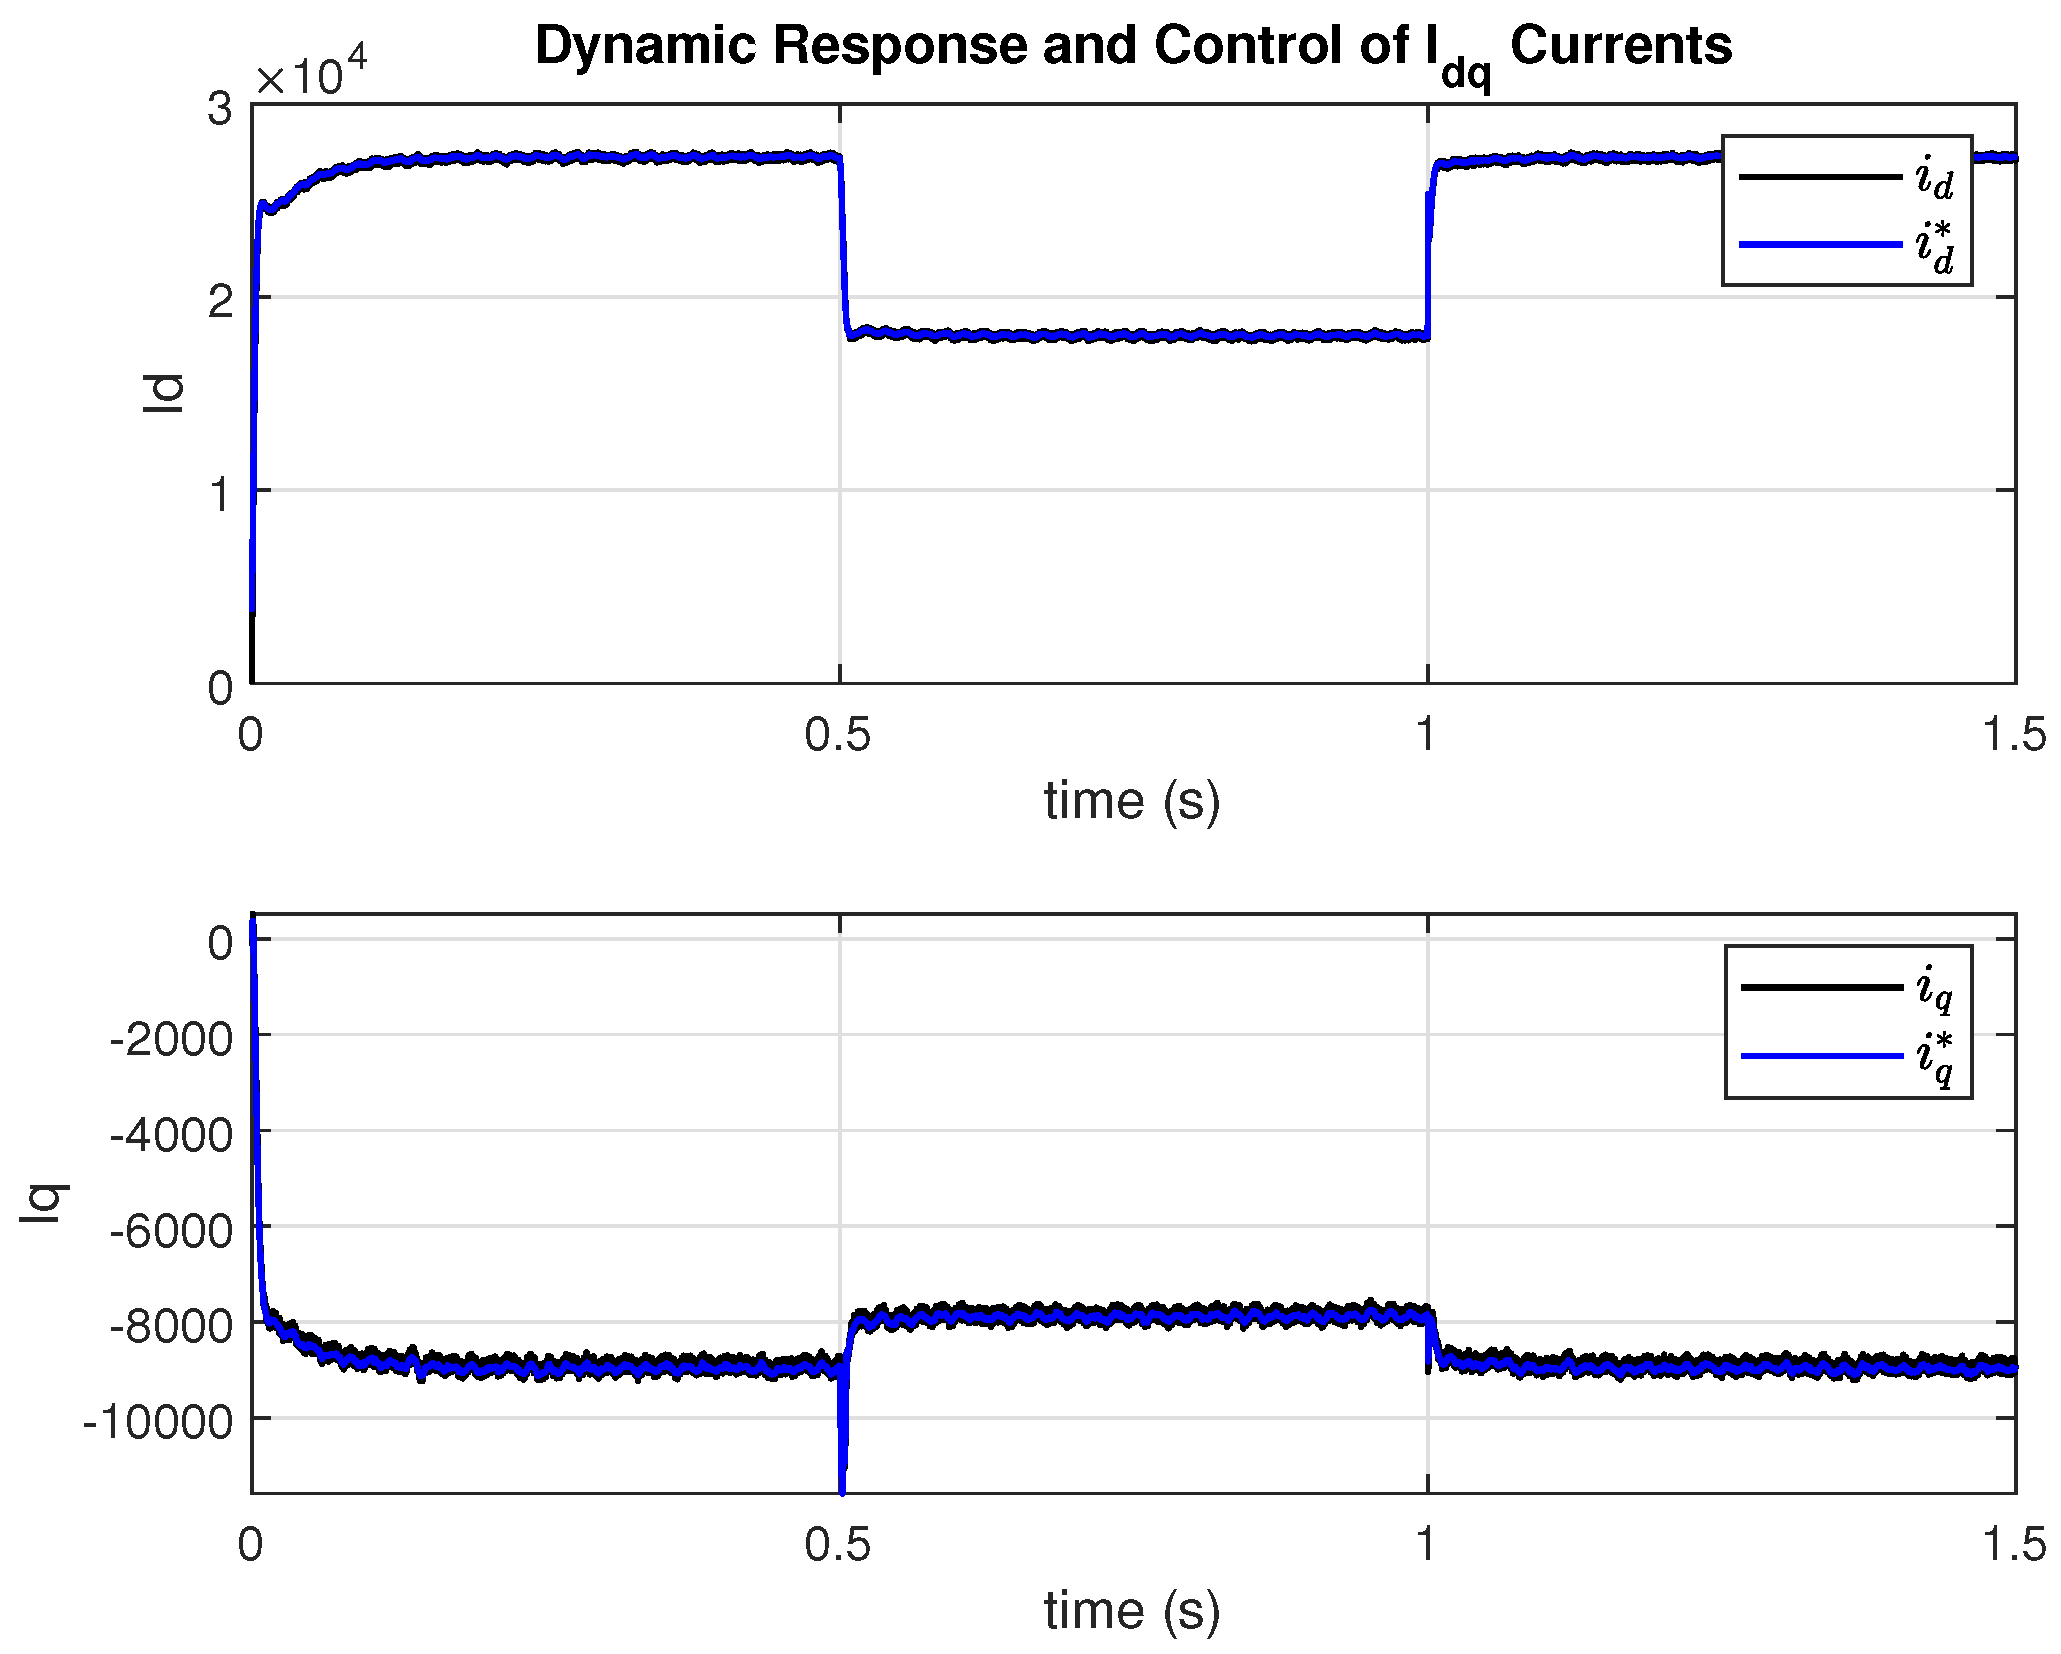
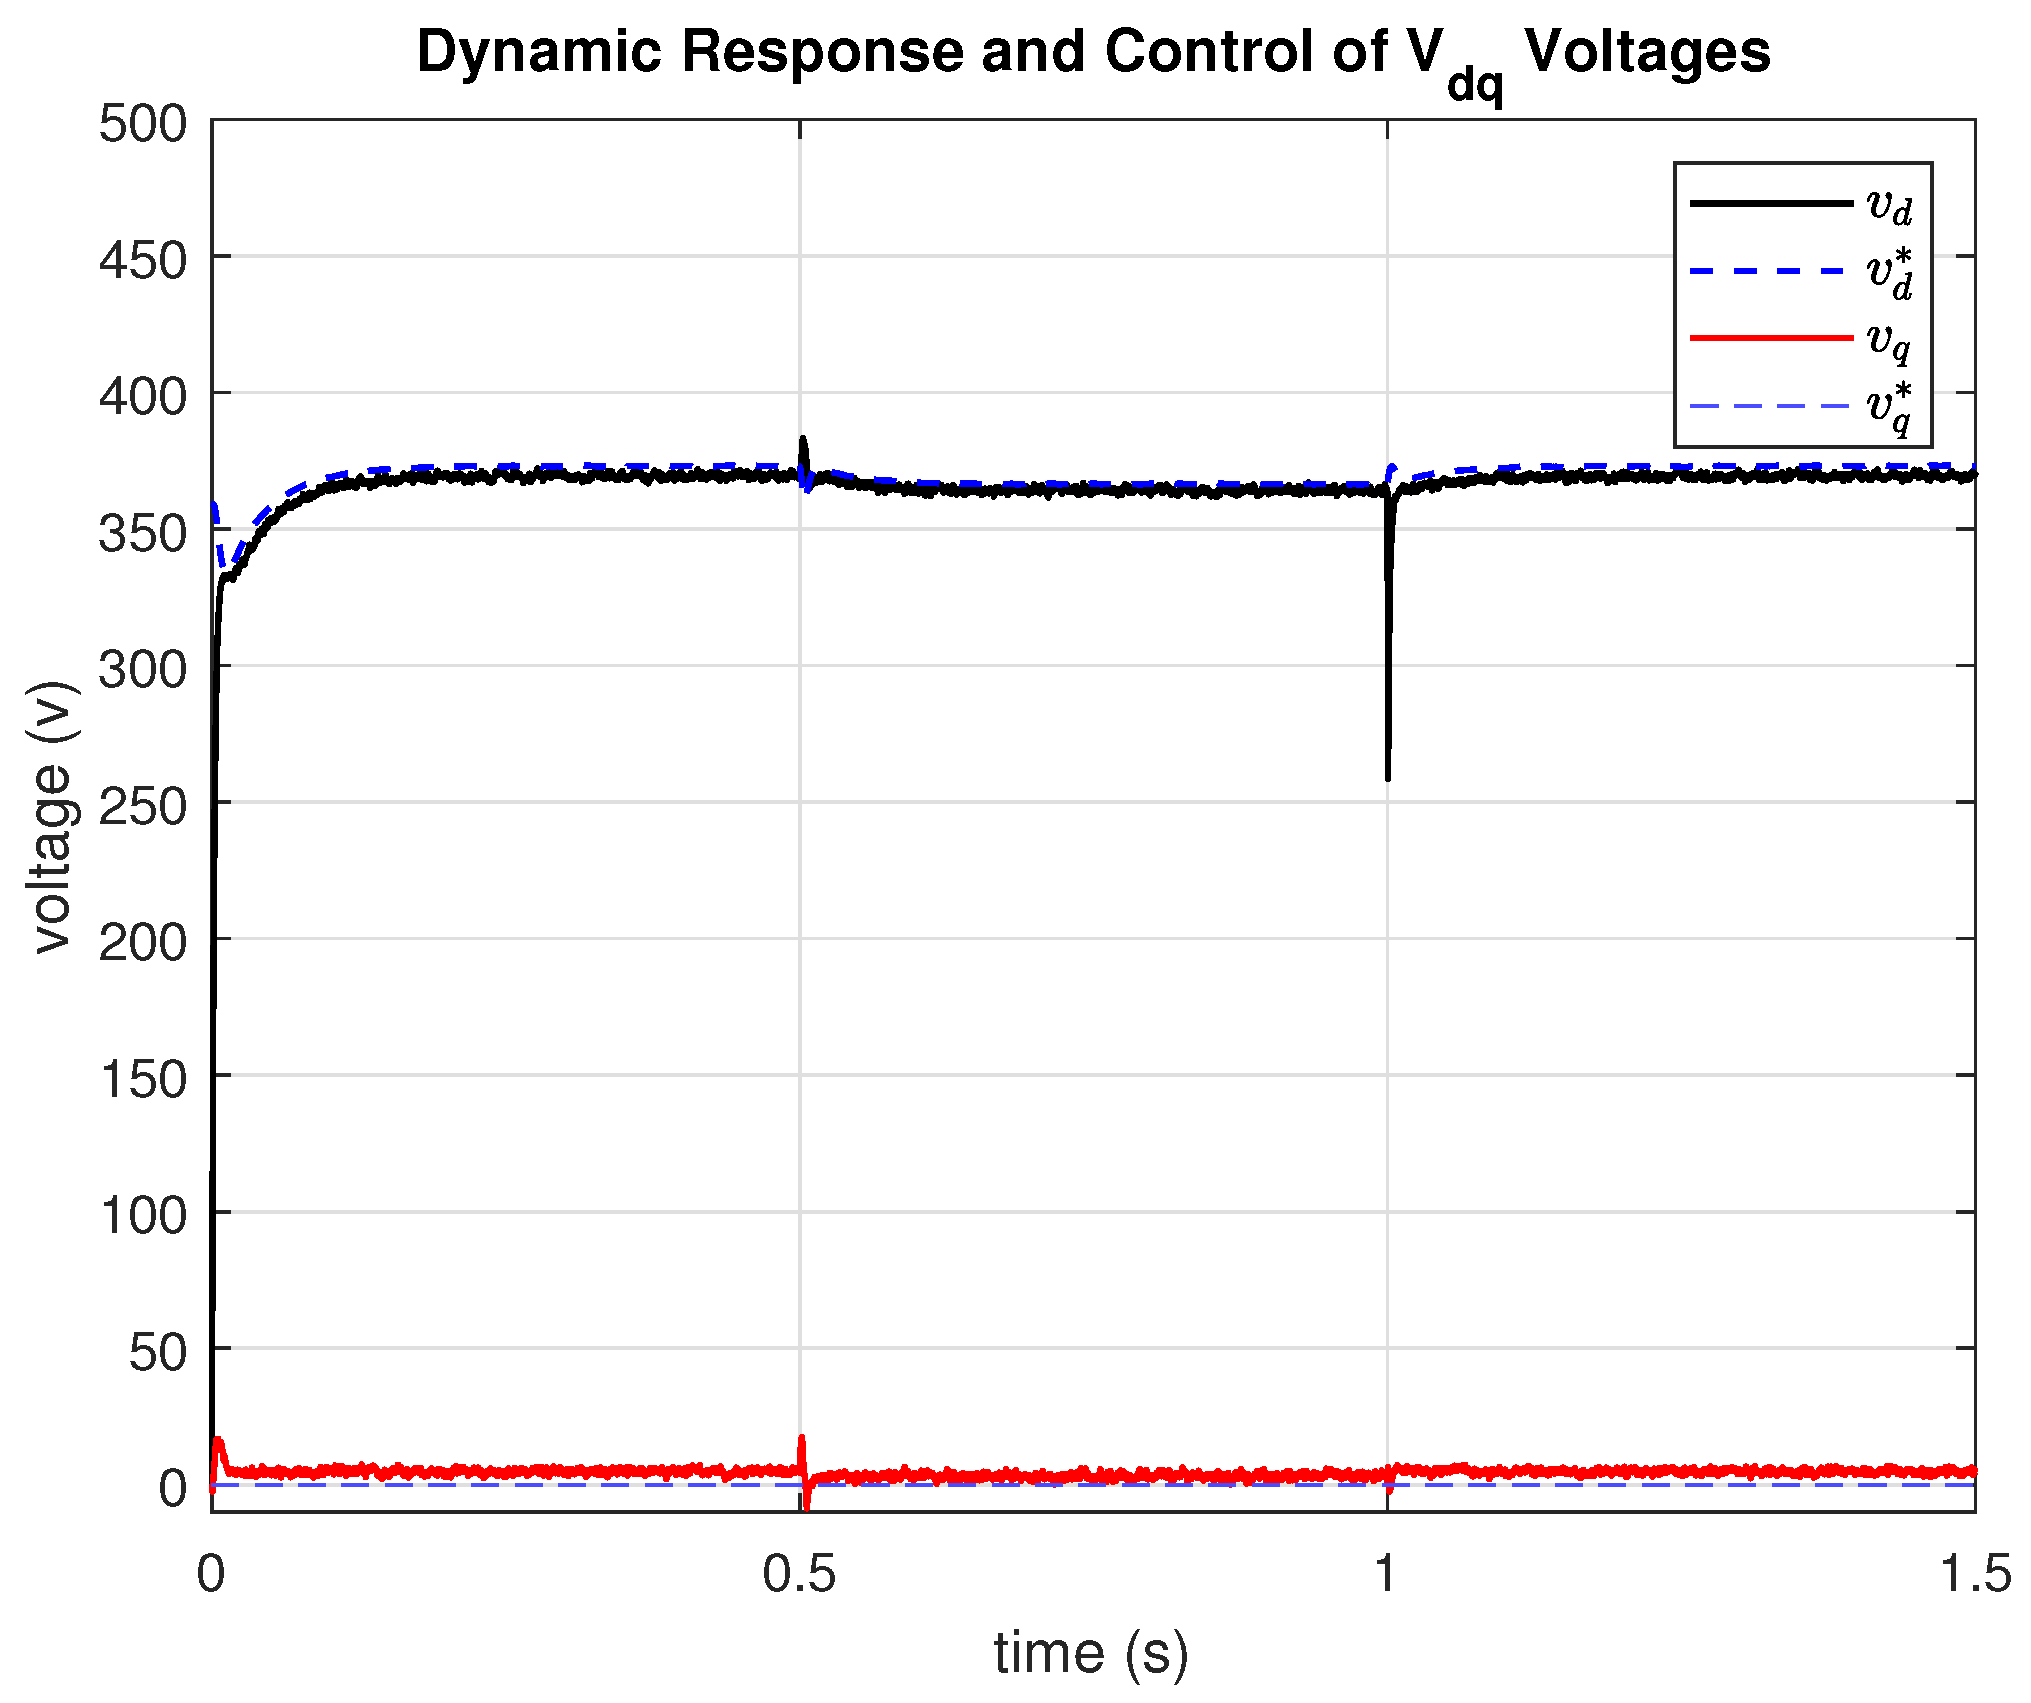
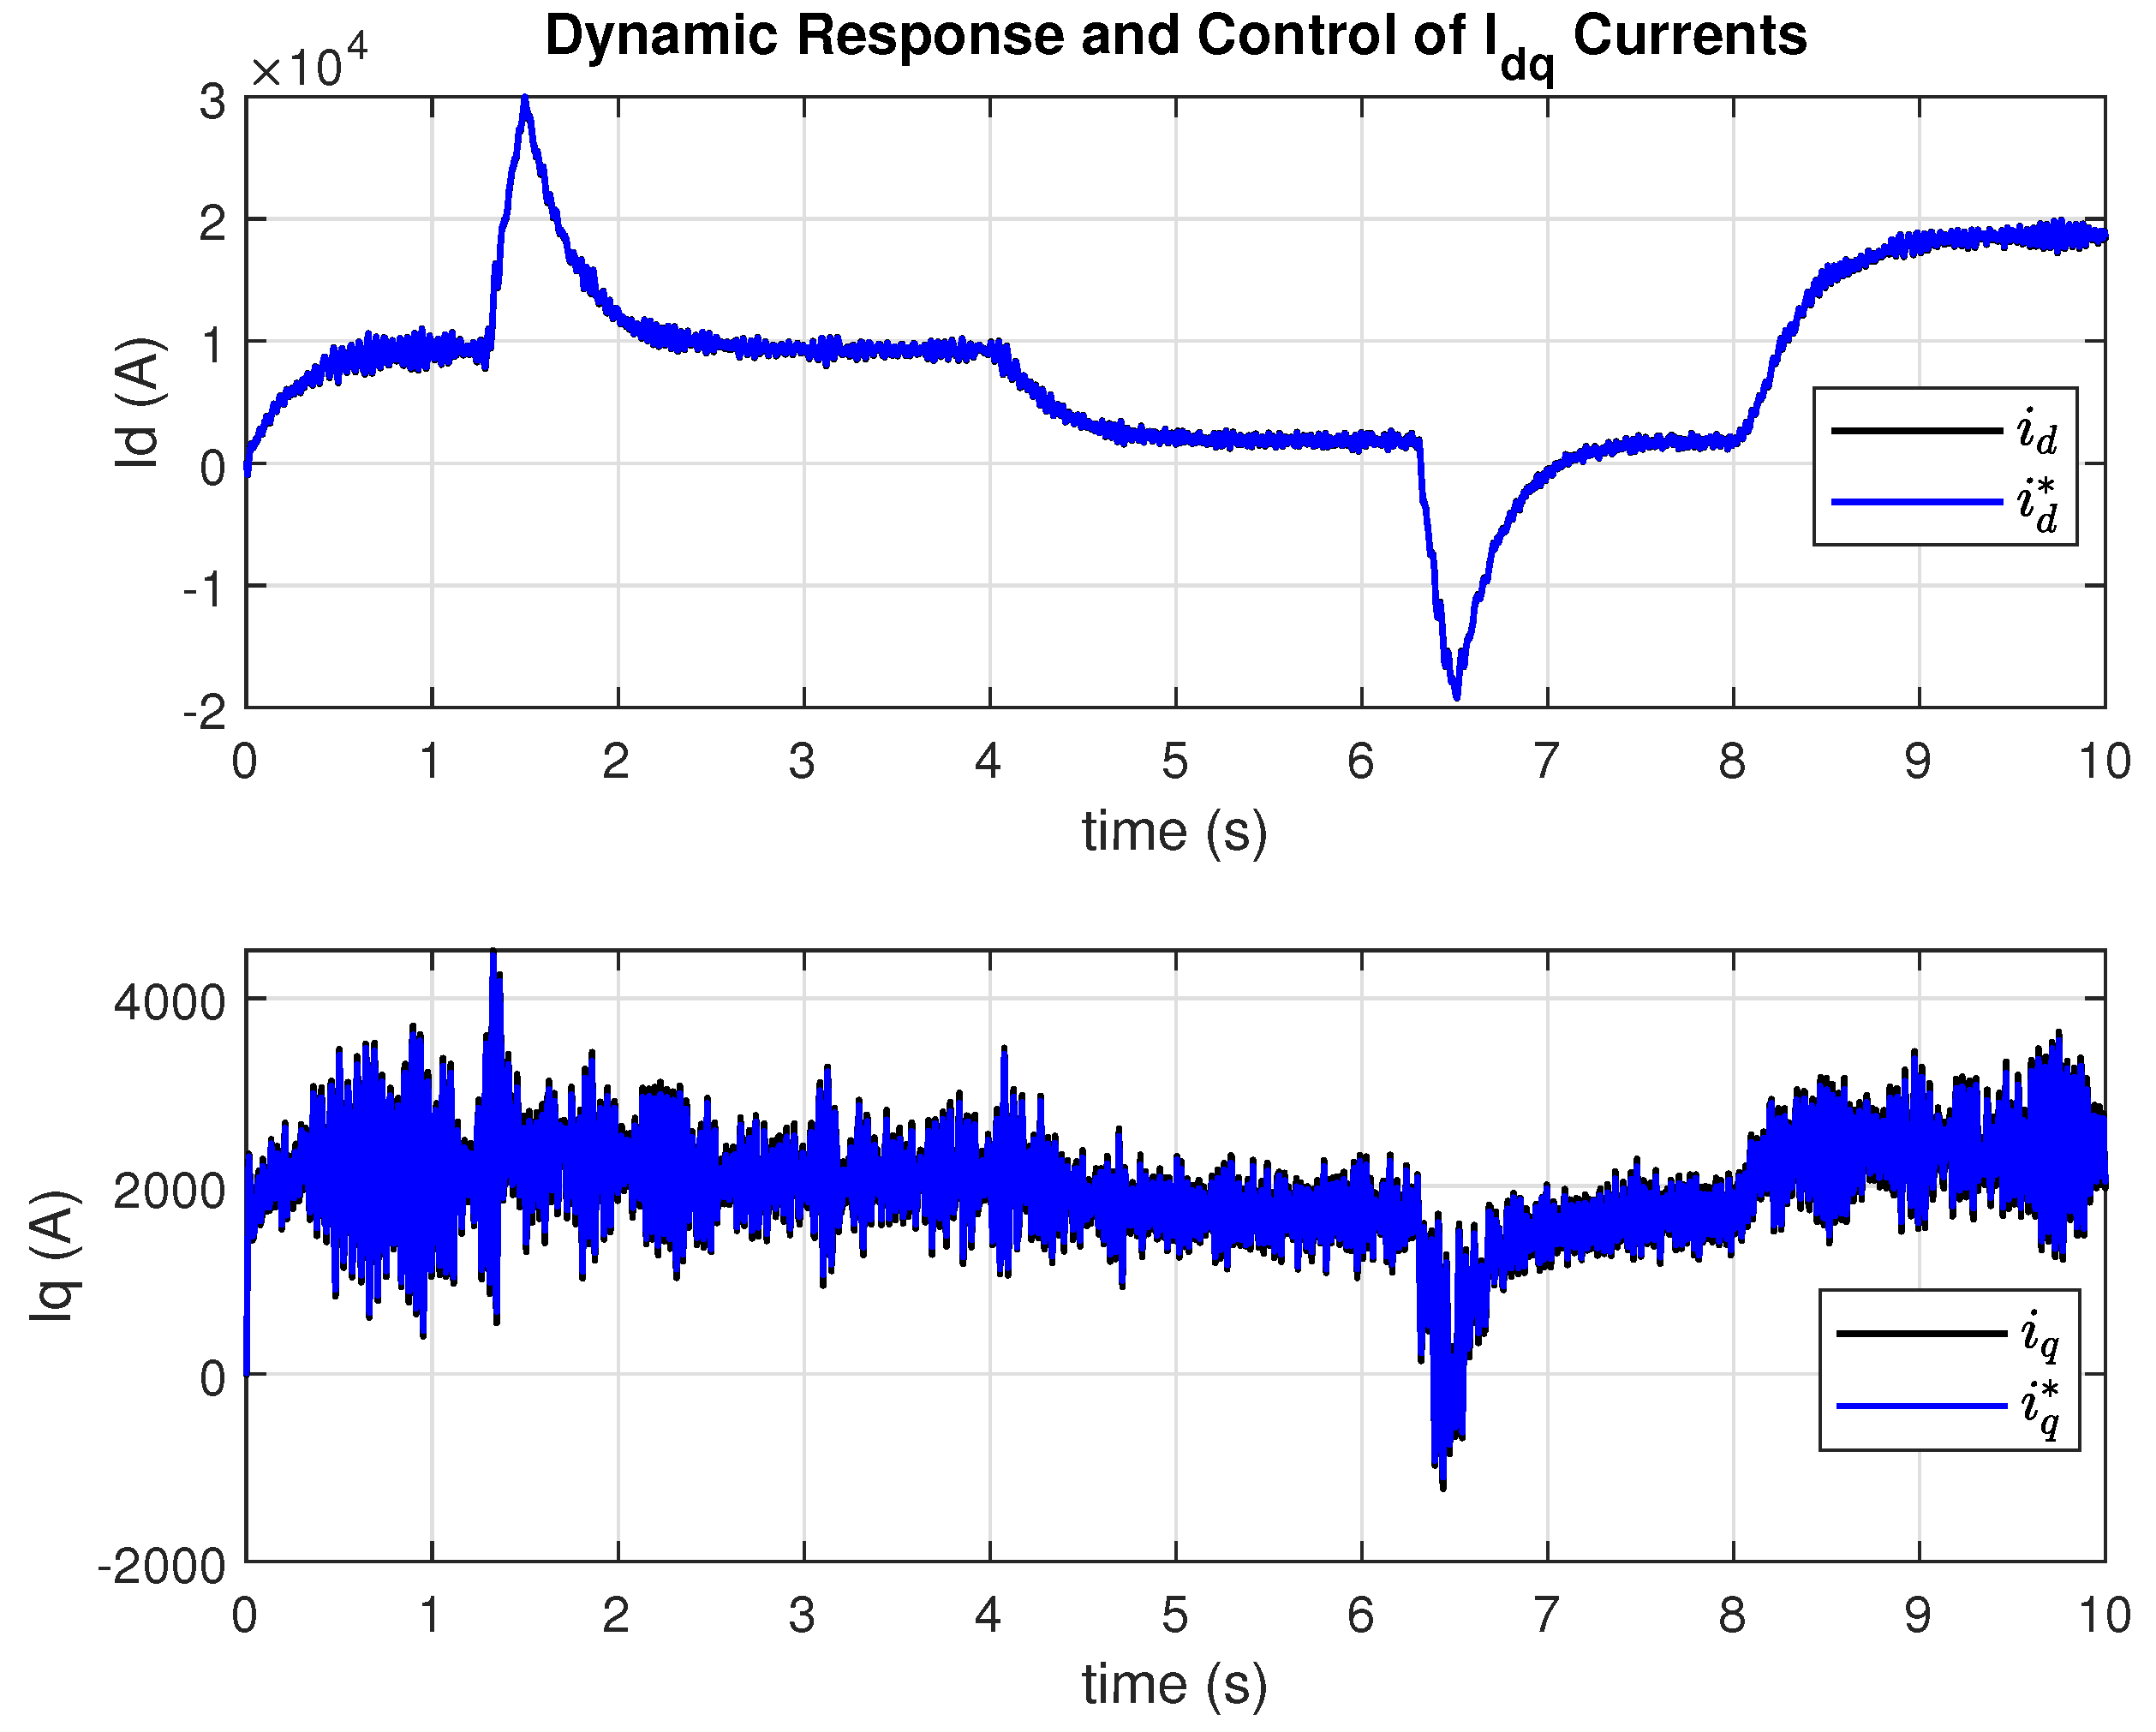
Figure 15 and
Figure 16 display the dynamic and transient behavior of the currents and voltages in the
reference frame, demonstrating the robustness and agility of the PI controllers implemented in the internal current and voltage control loops.
4.3. Test Case 2: Grid Connected Mode
The aim of this test is to evaluate the behavior of the GFM when it is interconnected with an external grid. Specifically, it examines its synchronization capability and its ability to provide virtual inertia to support the grid during frequency fluctuations. To achieve this, and to see how the GFM responds to grid disturbances (such as a tripping generator or sudden load changes), distinct frequency deviations are introduced into the grid voltage source during the test.
Scenario Description: The GFM inverter is operating and connected to support the main power grid.
Actions to Perform:
Connect the GFM inverter to the main power grid.
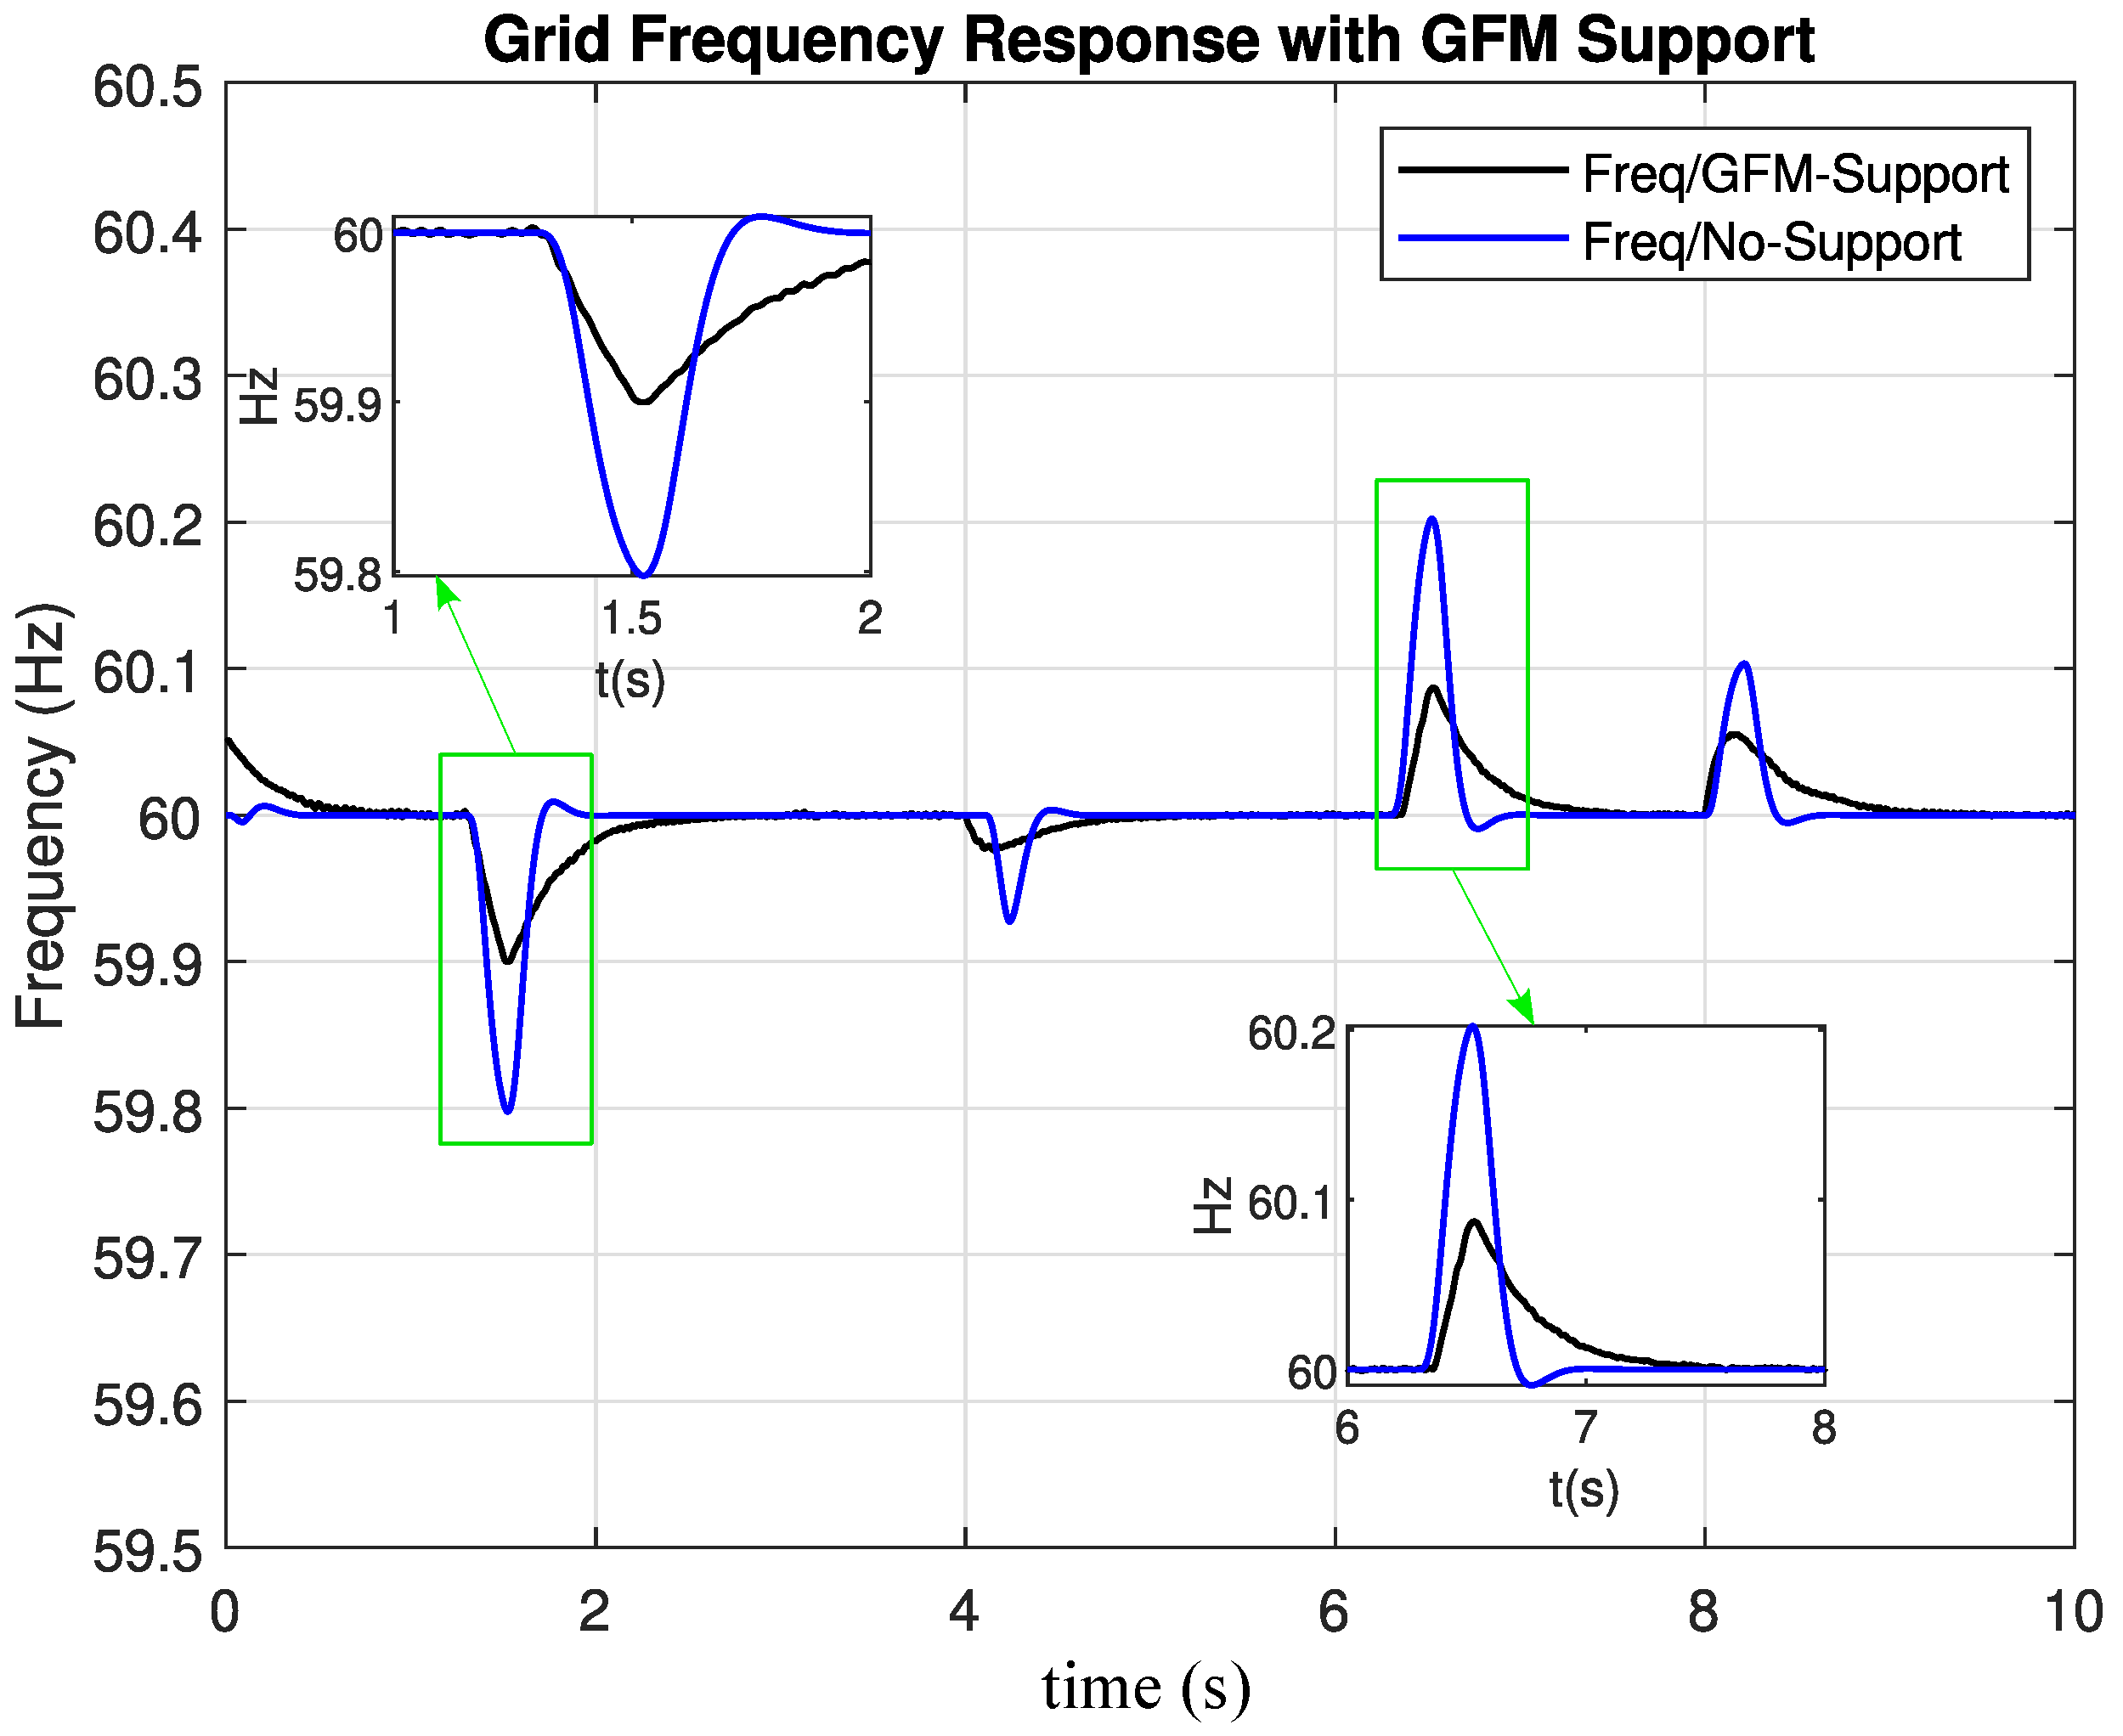
Simulate a frequency deviation of −0.2 Hz (droop) at time 1.3 s and +0.2 Hz (overshoot) at time 6.3 s.
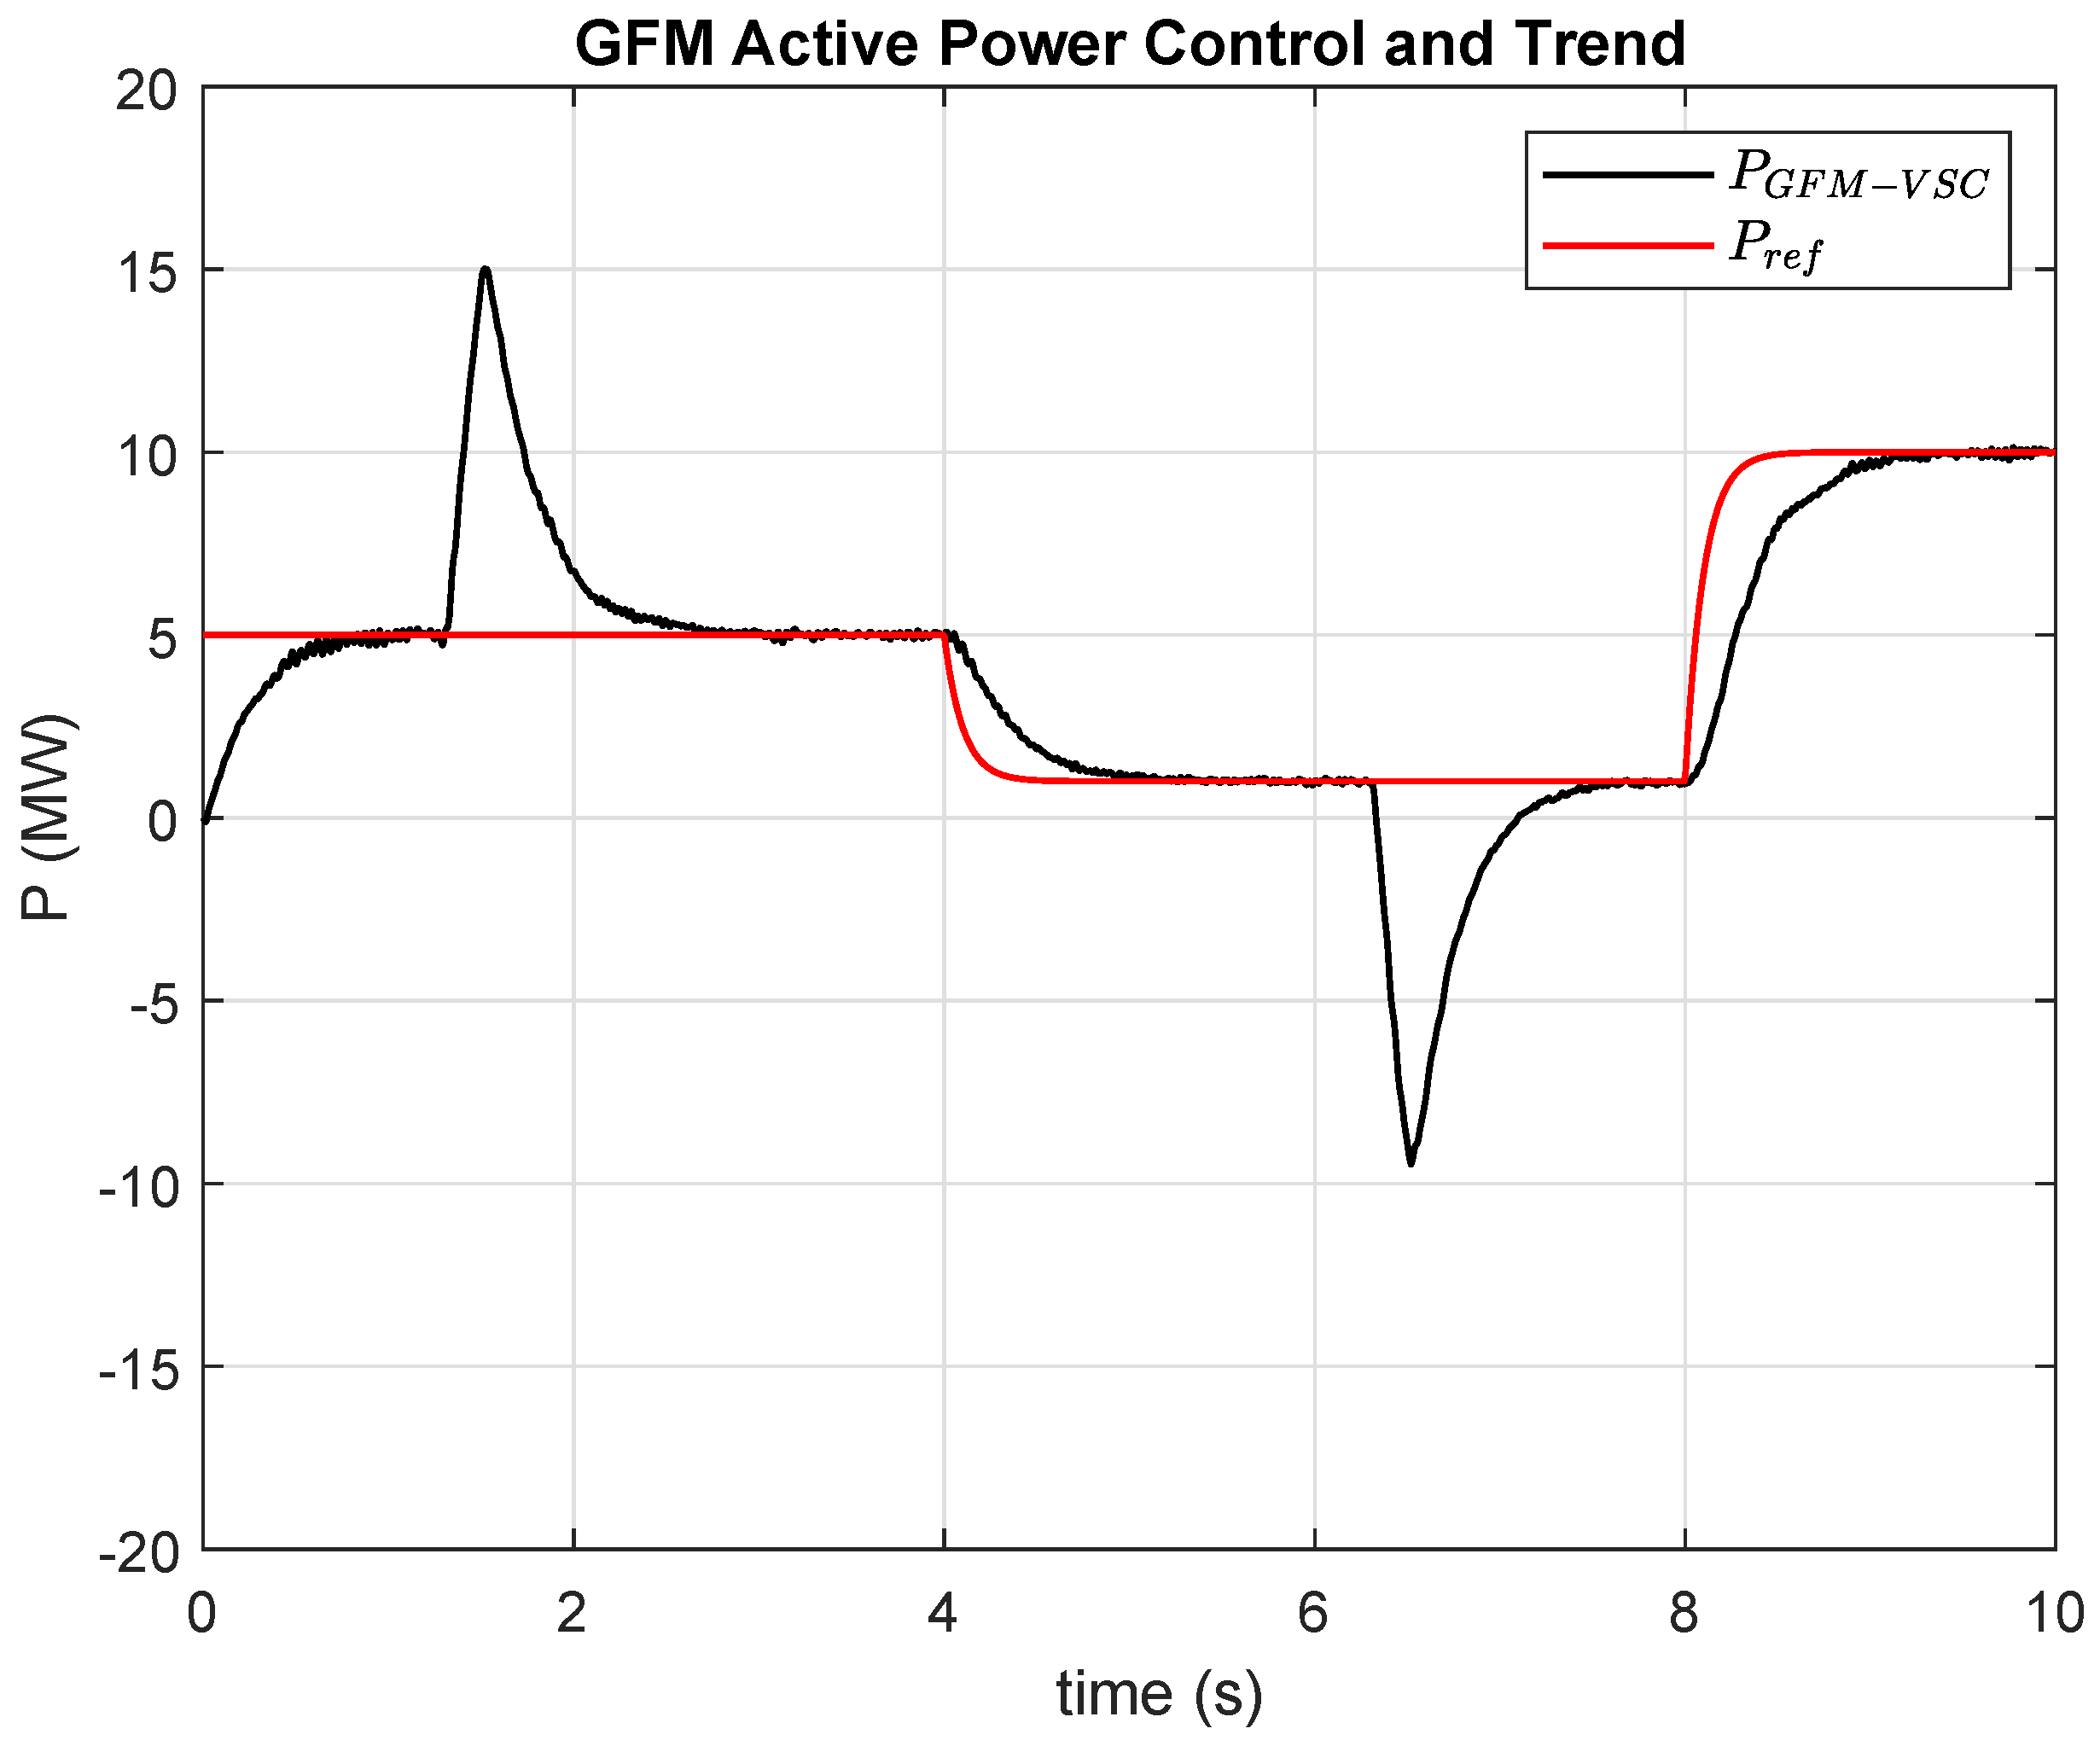
Synchronize the GFM to the grid at 5 MW, then adjust the power reference to 1 MW at time 4 s to observe the performance of the droop control, and finally increase the output reference to 10 MW at time 8 s.
Expected Results:
The GFM should synchronize correctly with the grid and operate without instability.
When a frequency deviation occurs in the main grid, the GFM should provide virtual inertia to decrease the RoCoF and, at the same time, reduce that deviation from the nominal frequency value.
The correct performance of the P/f droop + LPF control should be observed, adjusting correctly to the power reference that the GFM inverter must deliver and providing frequency support to the interconnected grid.
It should then be able to recover and return to normal operation after the disturbance is cleared.
The performance of the GFM inverter on-grid mode is evaluated during the grid frequency change and the corresponding results are presented in
Figure 17.
From 1.3 s to 1.5 s, the grid frequency is decreased from 60 Hz to 59.8 (
Hz), with the power support from the GFM at this frequency deviation, the GFM’s virtual inertia control technique is activated and generates the inertial power during this transient state, resulting in a lower RoCoF and a lower
and therefore the active power of the inverter increases from the initial value (
) of 5 MW to a peak of 15 MW, before returning to its reference value, as shown in
Figure 18.
From 6.3 s to 6.5 s, when the grid frequency increases from 60 Hz to 60.2 Hz (
Hz), as shown in
Figure 17, the GFM’s virtual inertia response is activated and begins absorbing active power. This causes the inverter’s active power to decrease from 1 MW to a minimum of −10 MW (see
Figure 18), resulting in a lower RoCoF and a smaller frequency overshoot.
The frequency deviations observed at 4 s and 8 s (
Figure 17) are attributed to changes in the reference power (
) applied to the GFM controller. These changes are designed to simulate variations in the generation from a VRE source connected to the DC bus that feeds the inverter (
Figure 18).
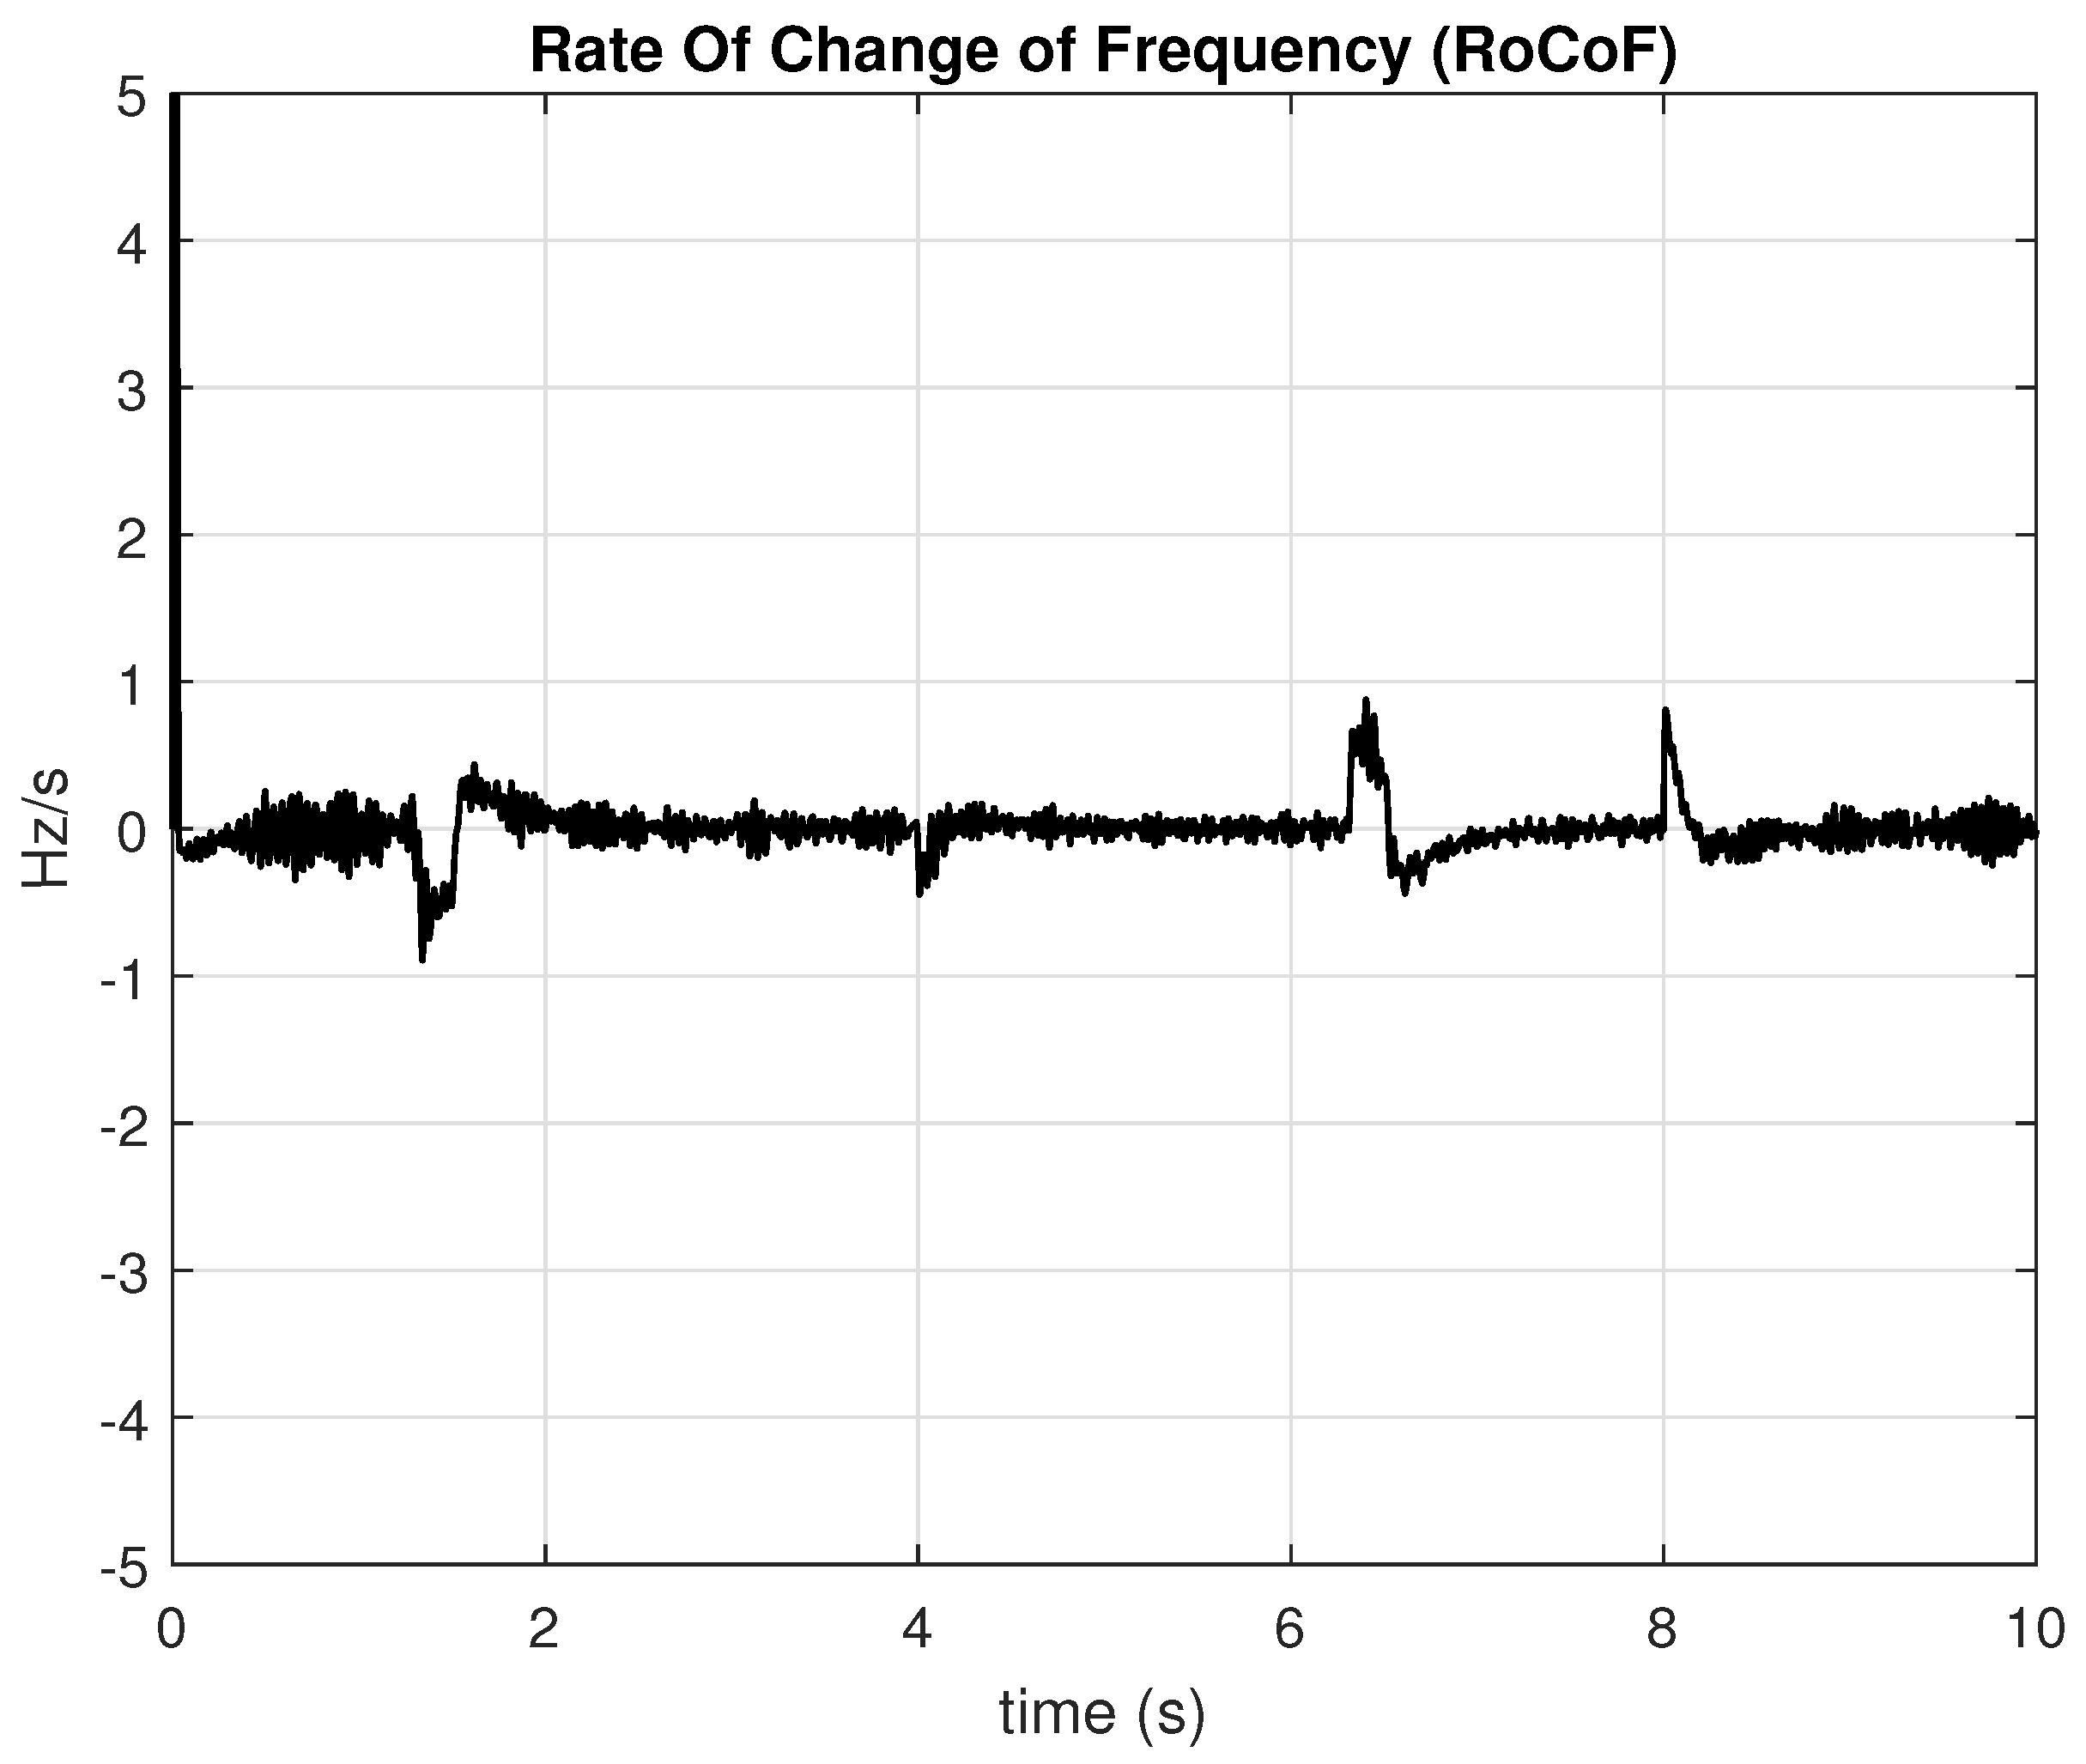
Figure 19 shows the dynamic behavior of the RoCof estimated over a 1 ms window. Furthermore,
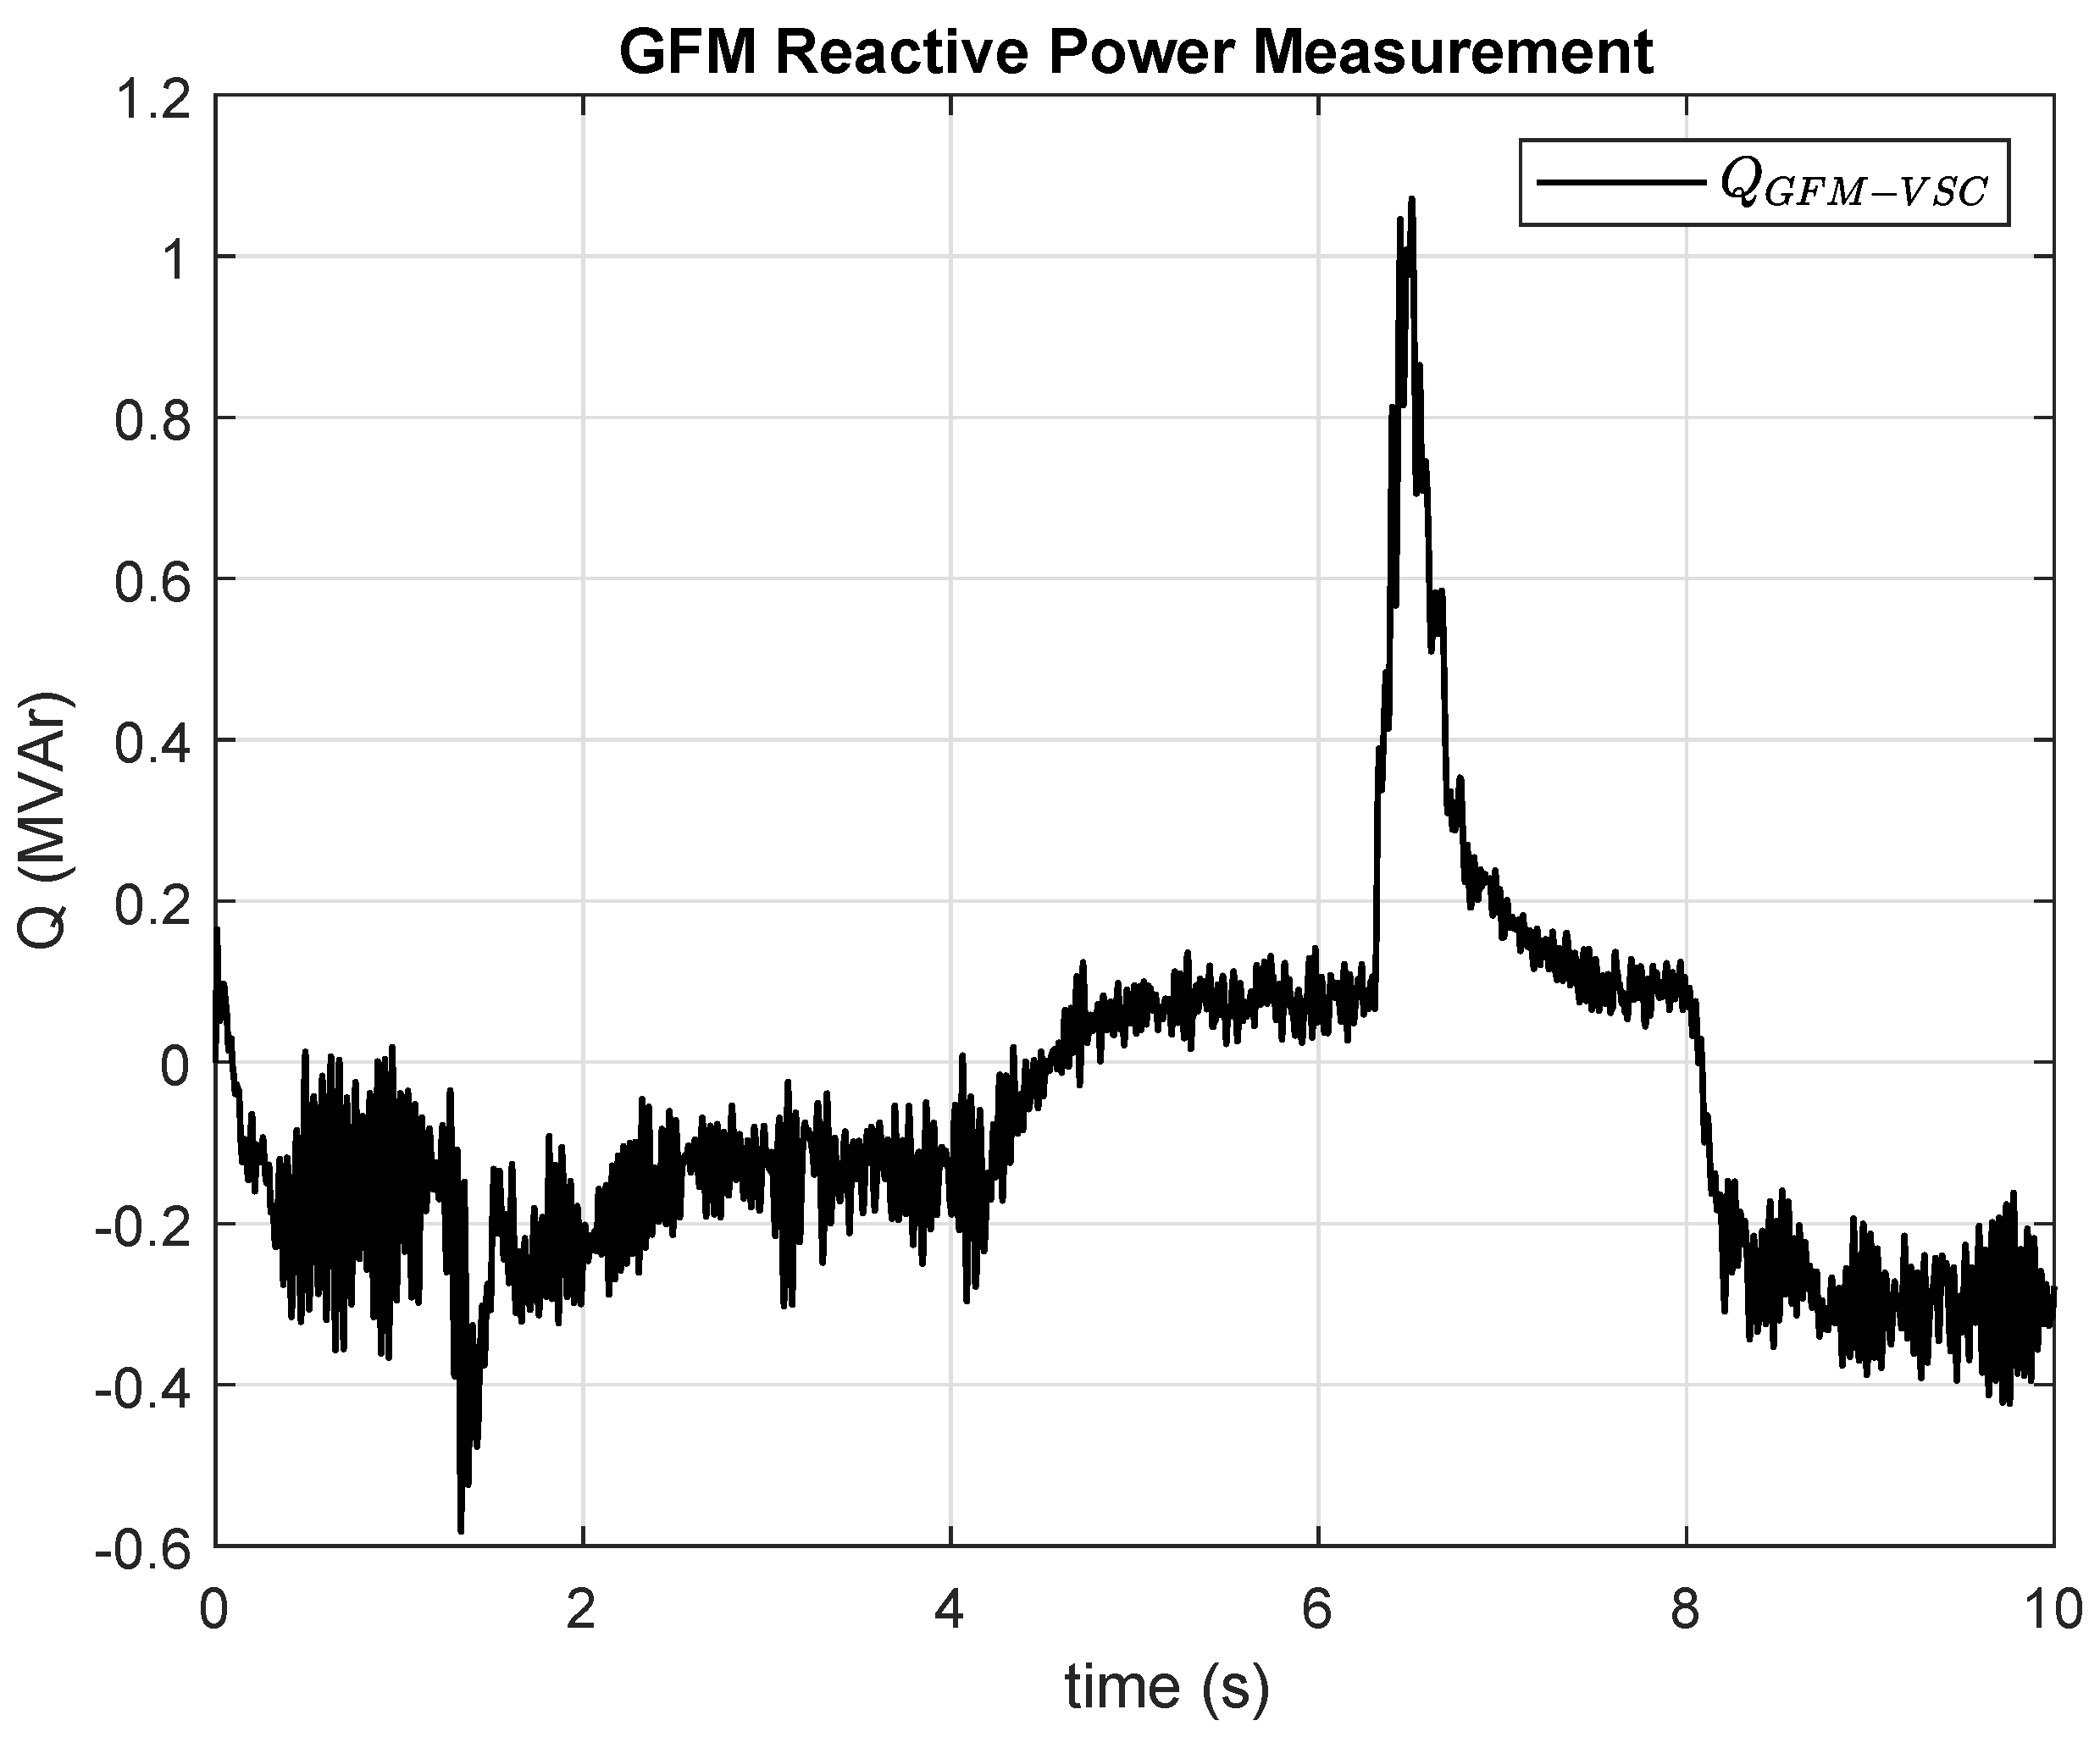
Figure 20 illustrates the reactive power injected or absorbed by the GFM to the grid.
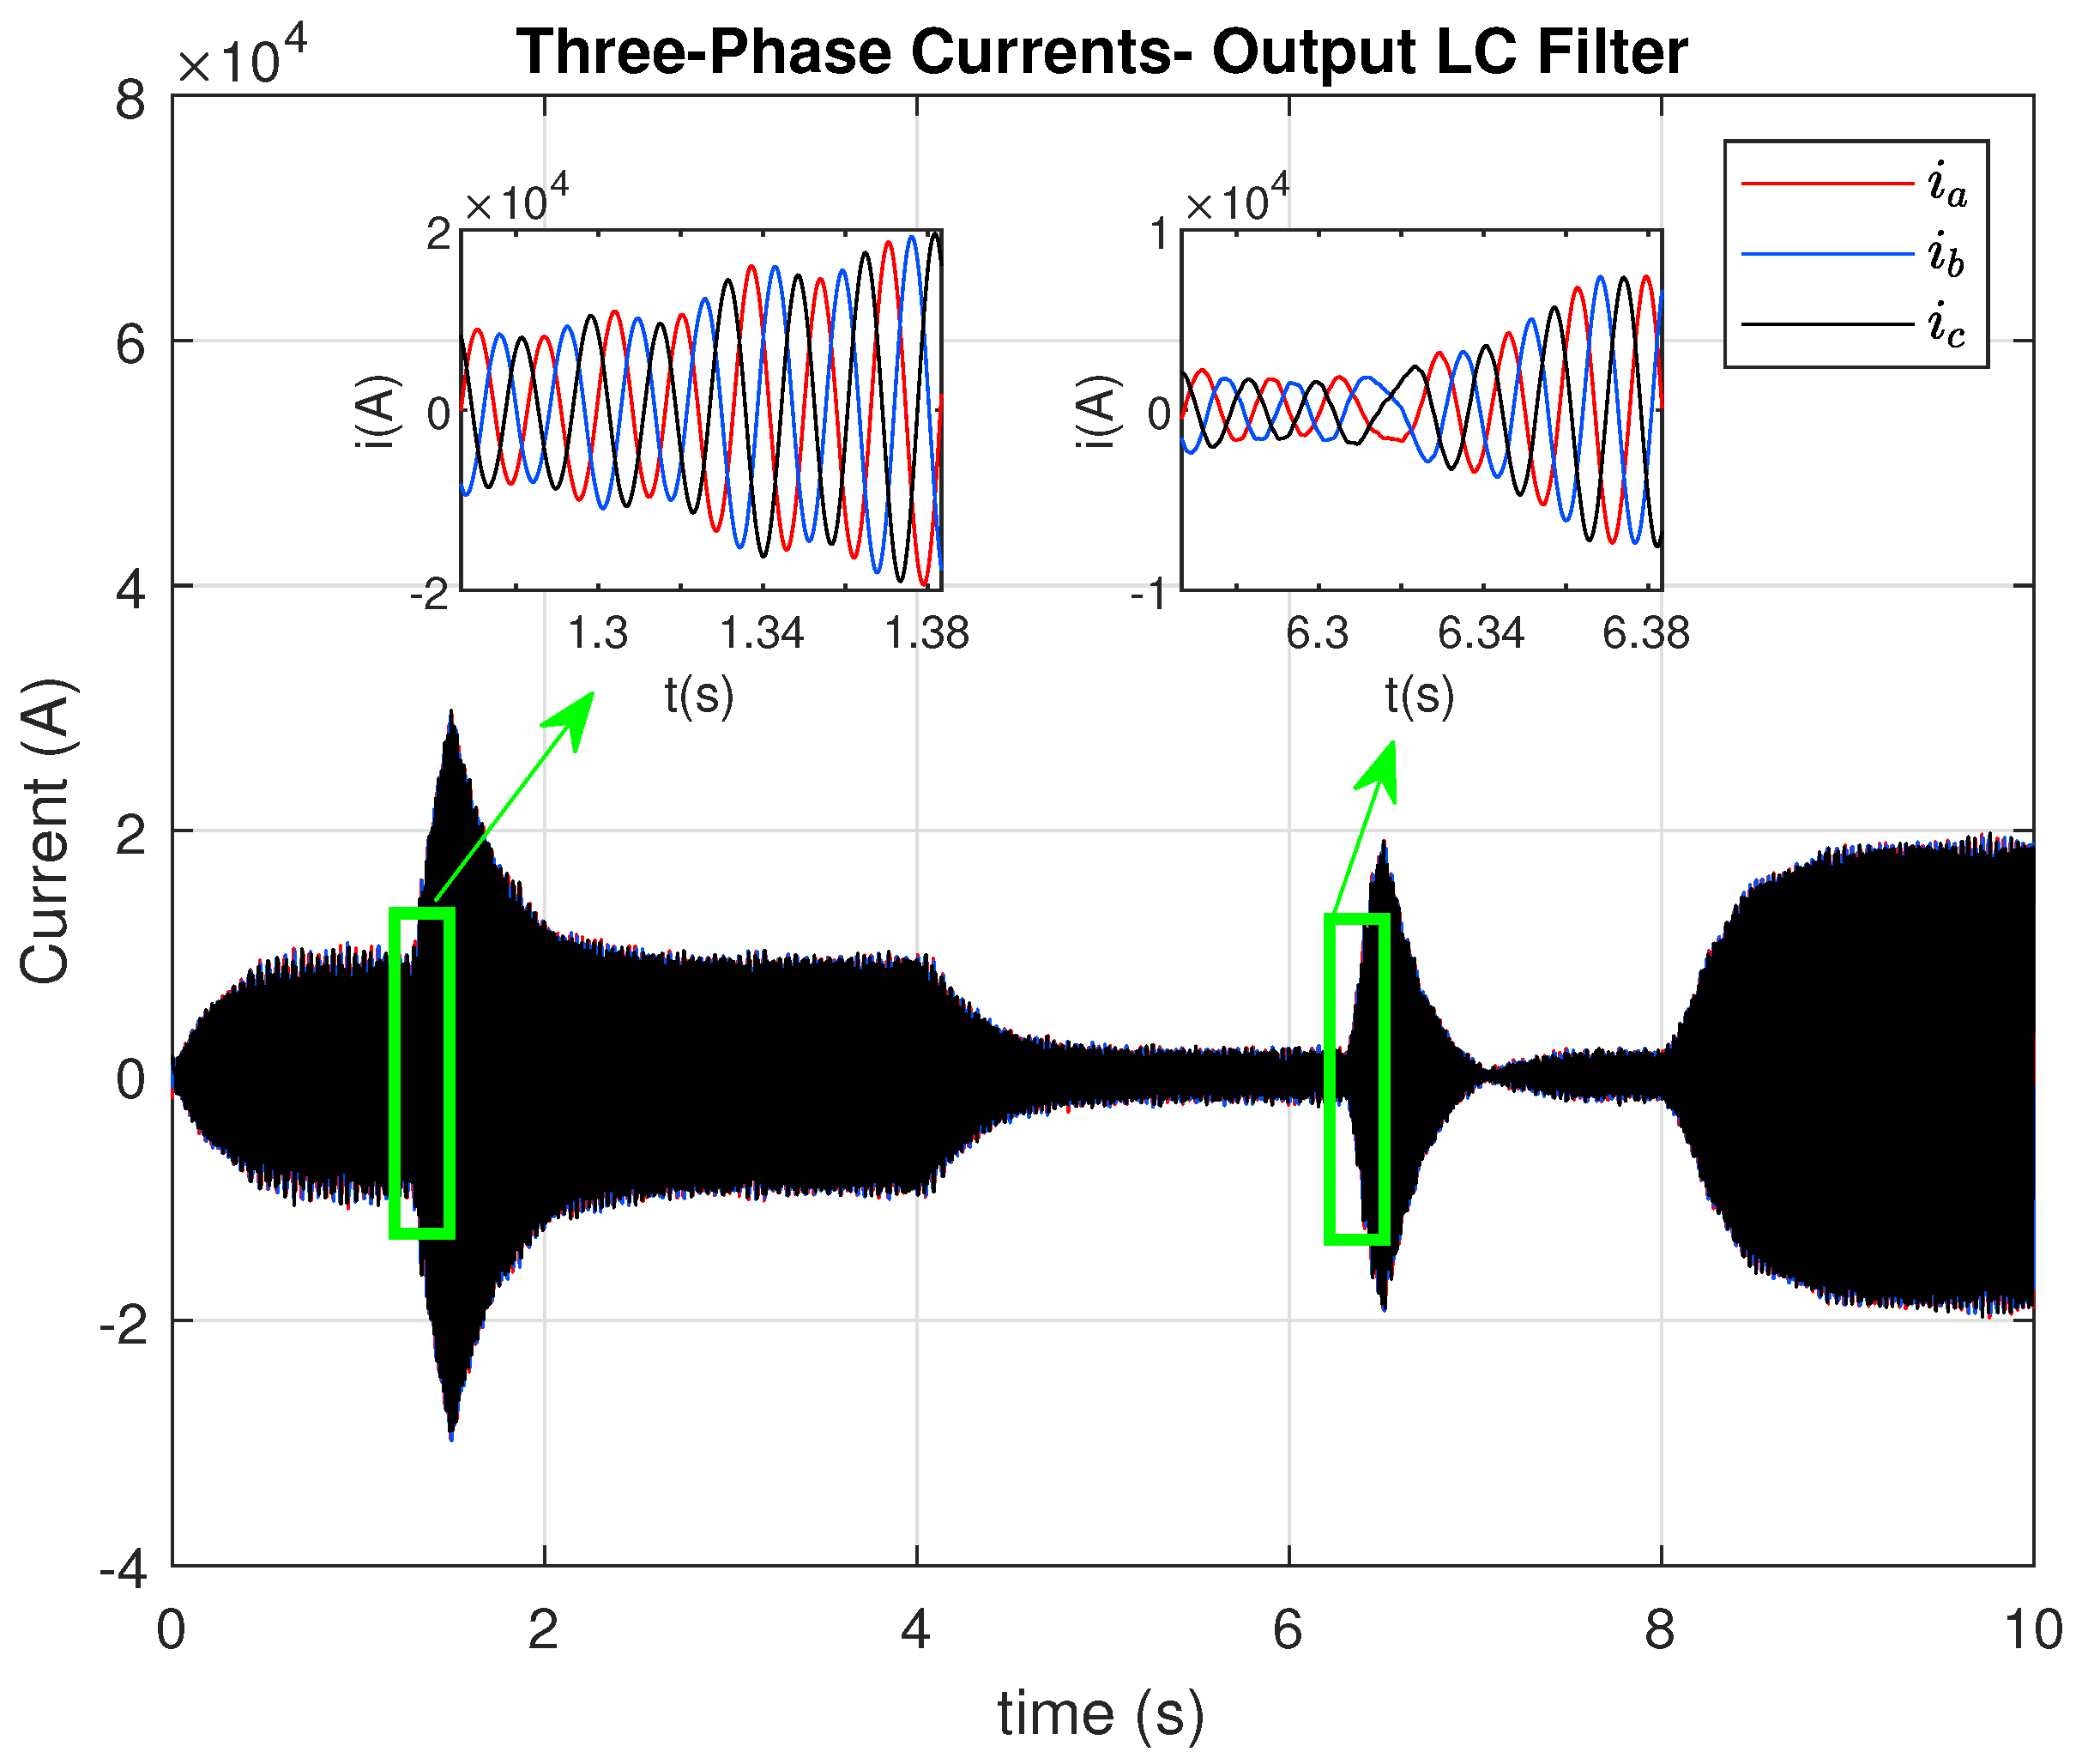
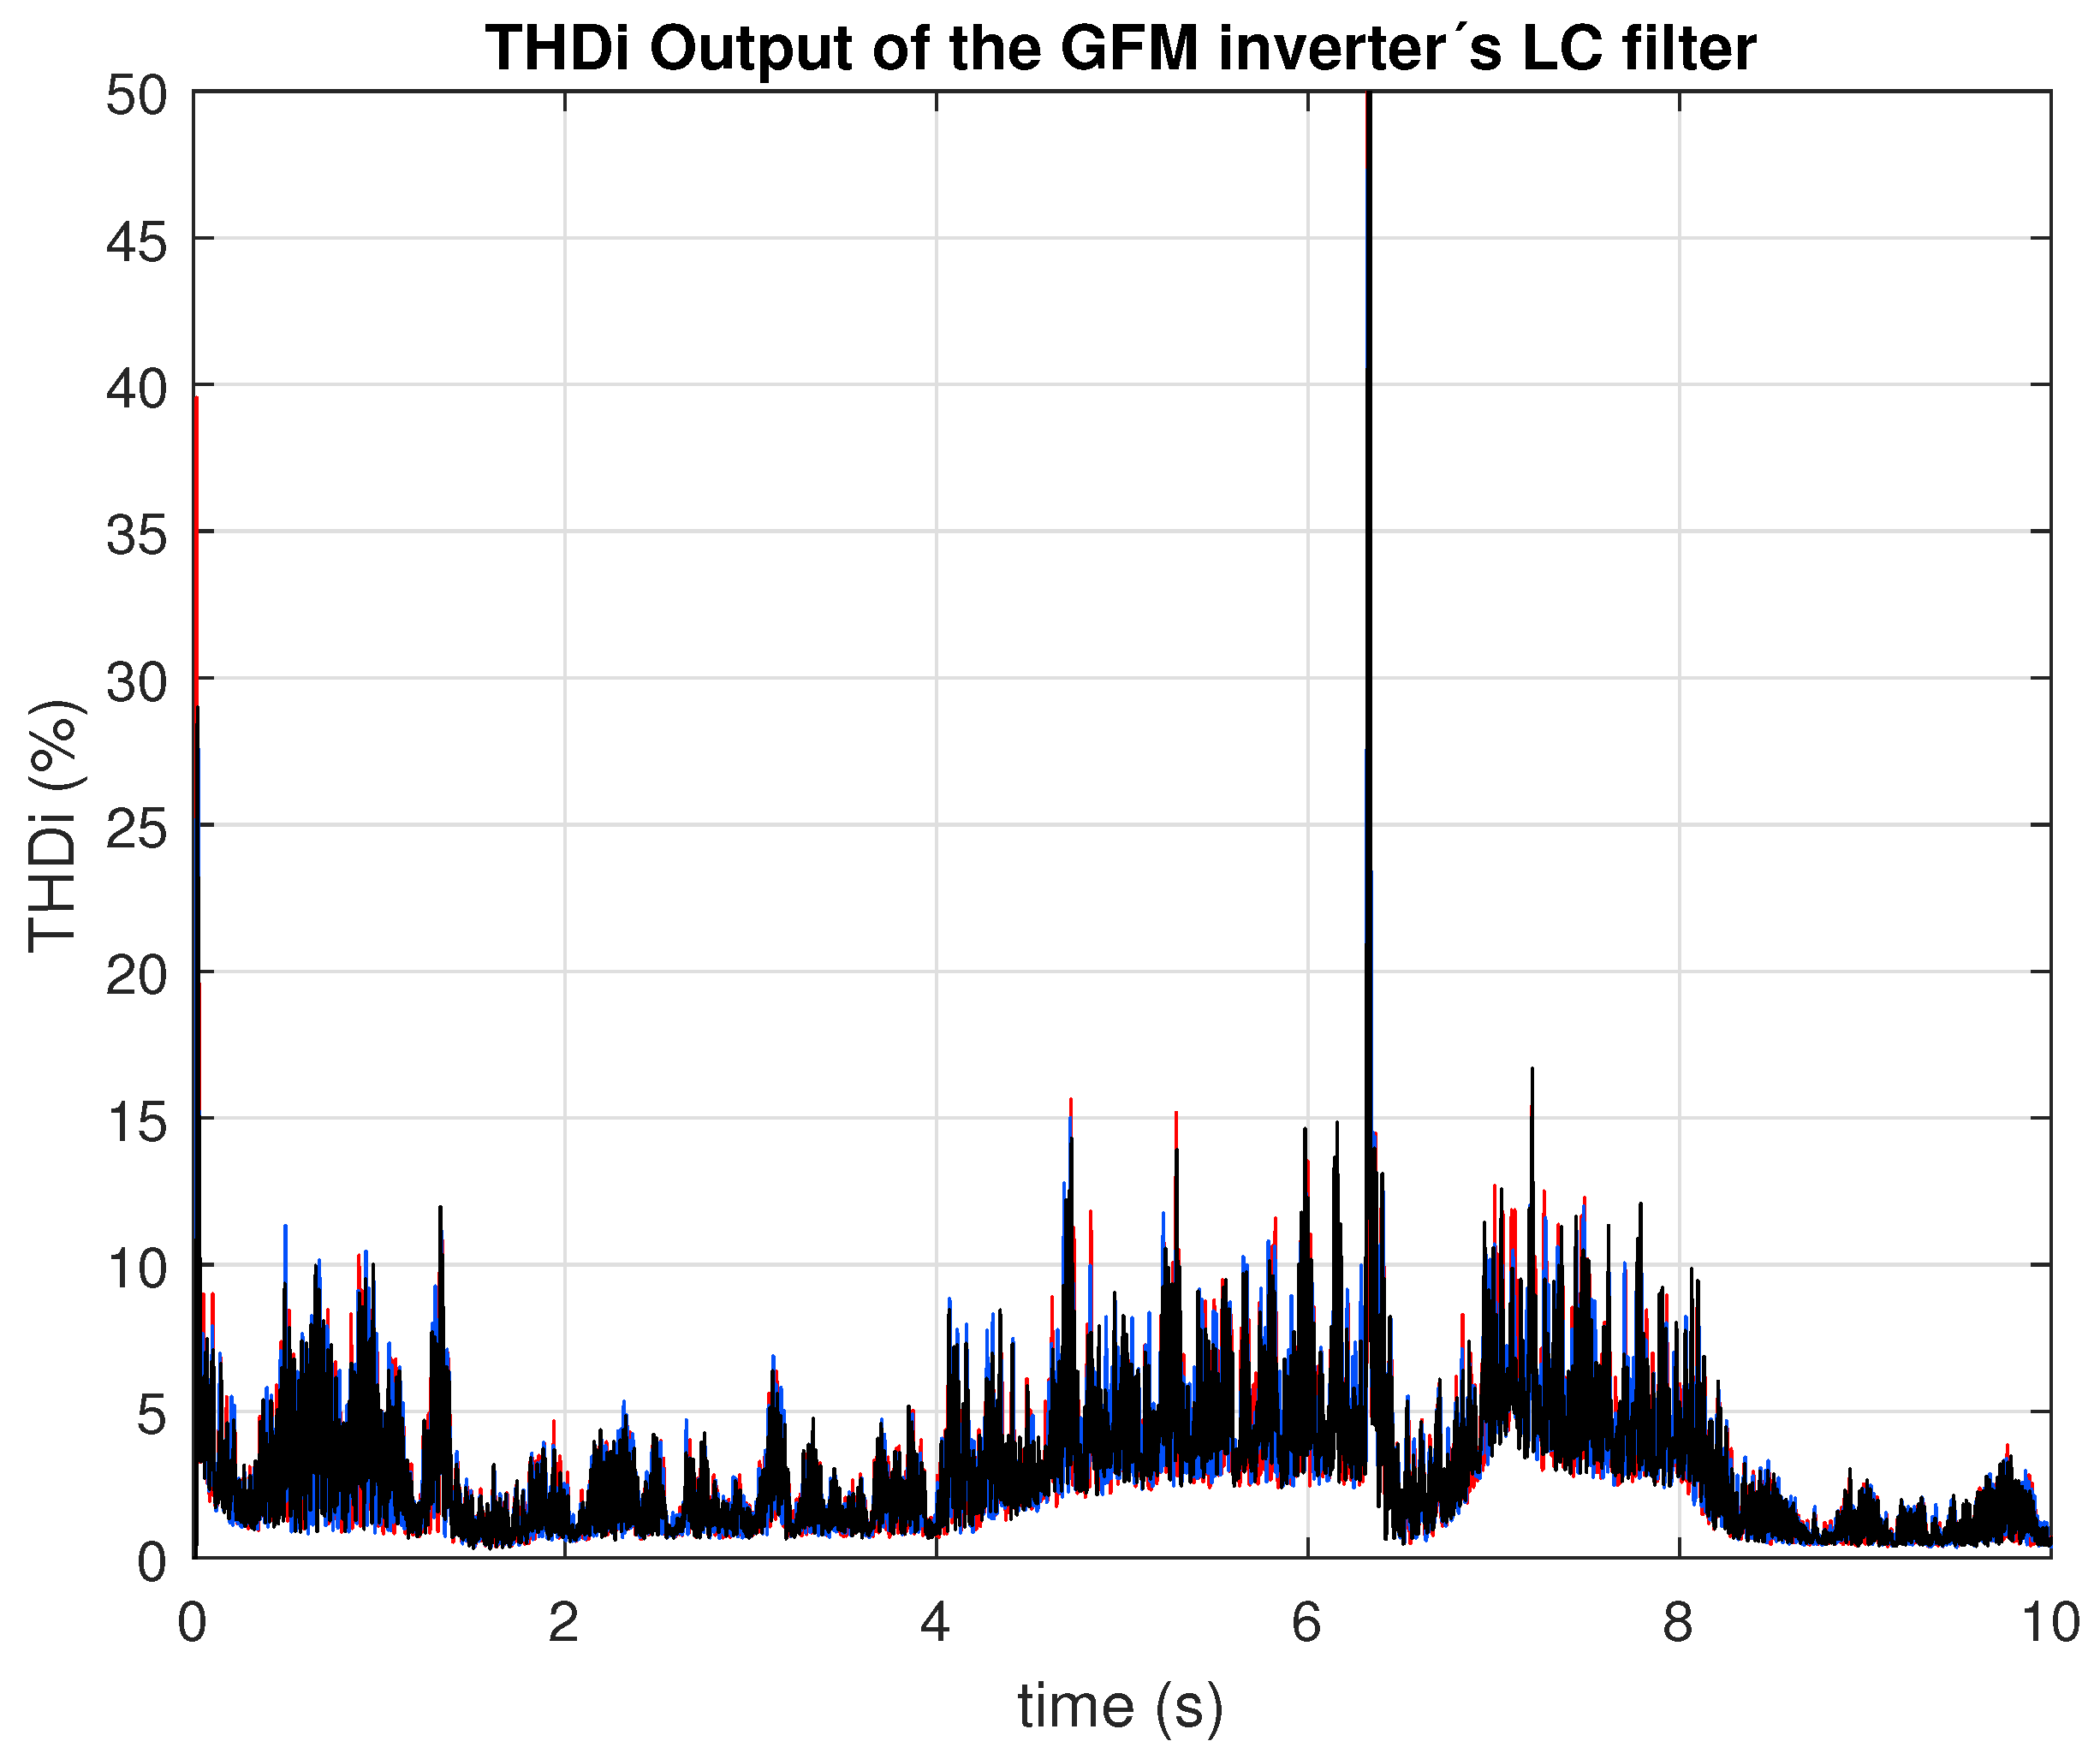
Figure 21 and
Figure 22 illustrate the converter response at the PCC under frequency deviations. The current magnitude adapts rapidly to support system frequency, while the corresponding THD remains below 15% throughout the disturbance. This confirms that the proposed control strategy ensures both dynamic frequency support and acceptable current quality under realistic transient conditions, which cannot be fully observed with averaged converter models. After 6 s, when the system frequency increases, the converter must absorb power in order to contribute to frequency regulation. During this transition, the current at the PCC changes from delivering to absorbing power, resulting in a brief interval where the fundamental current reaches a very low magnitude (as can be seen in
Figure 21). Although the harmonic content does not significantly increase during this interval, the reduction in the fundamental component causes the calculated THD to momentarily rise to a very high value. This explains the sharp peak observed in
Figure 22. Despite this numerical effect, the current waveform itself does not become severely distorted, and the converter control remains stable throughout the transition.
Under these conditions, with the GFM inverter interconnected to the main grid and subject to frequency variations, the control strategy operated correctly.
Figure 21 shows the inverter current at PCC, while
Figure 22 presents its THD. As expected, during transient operation of the converter (compensating for both frequency and power), the current THD remained below 15%.
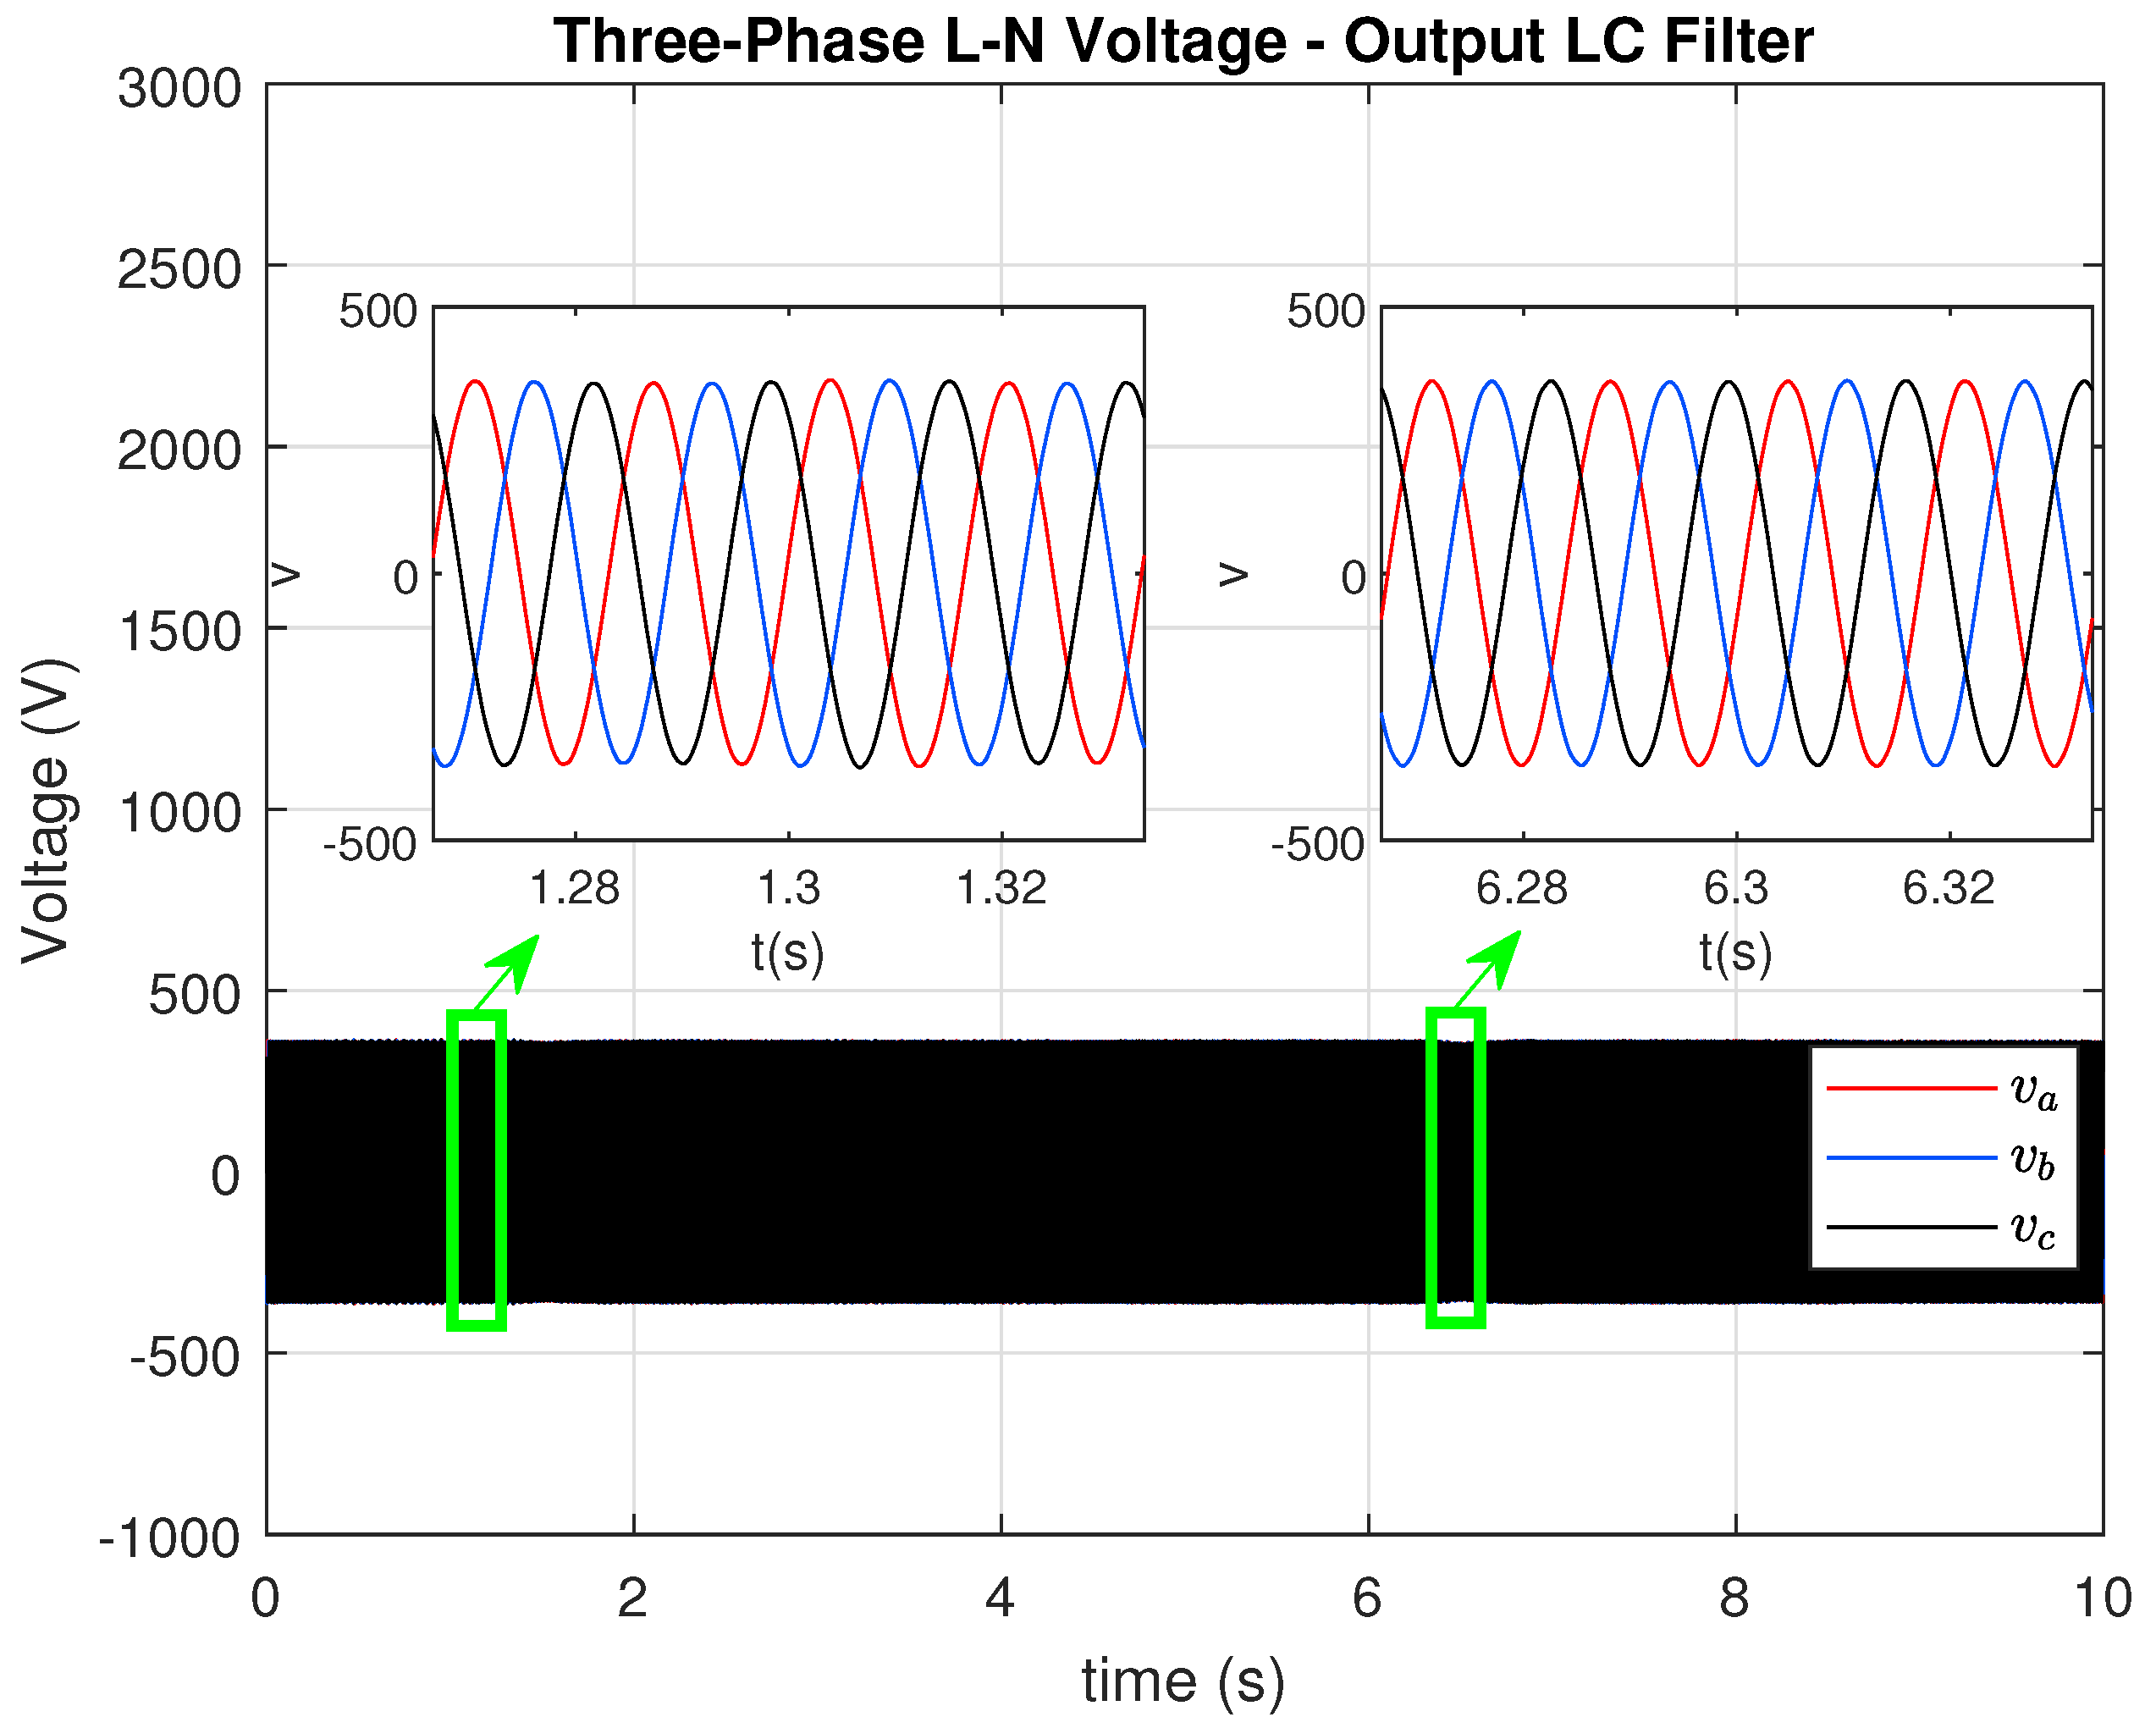
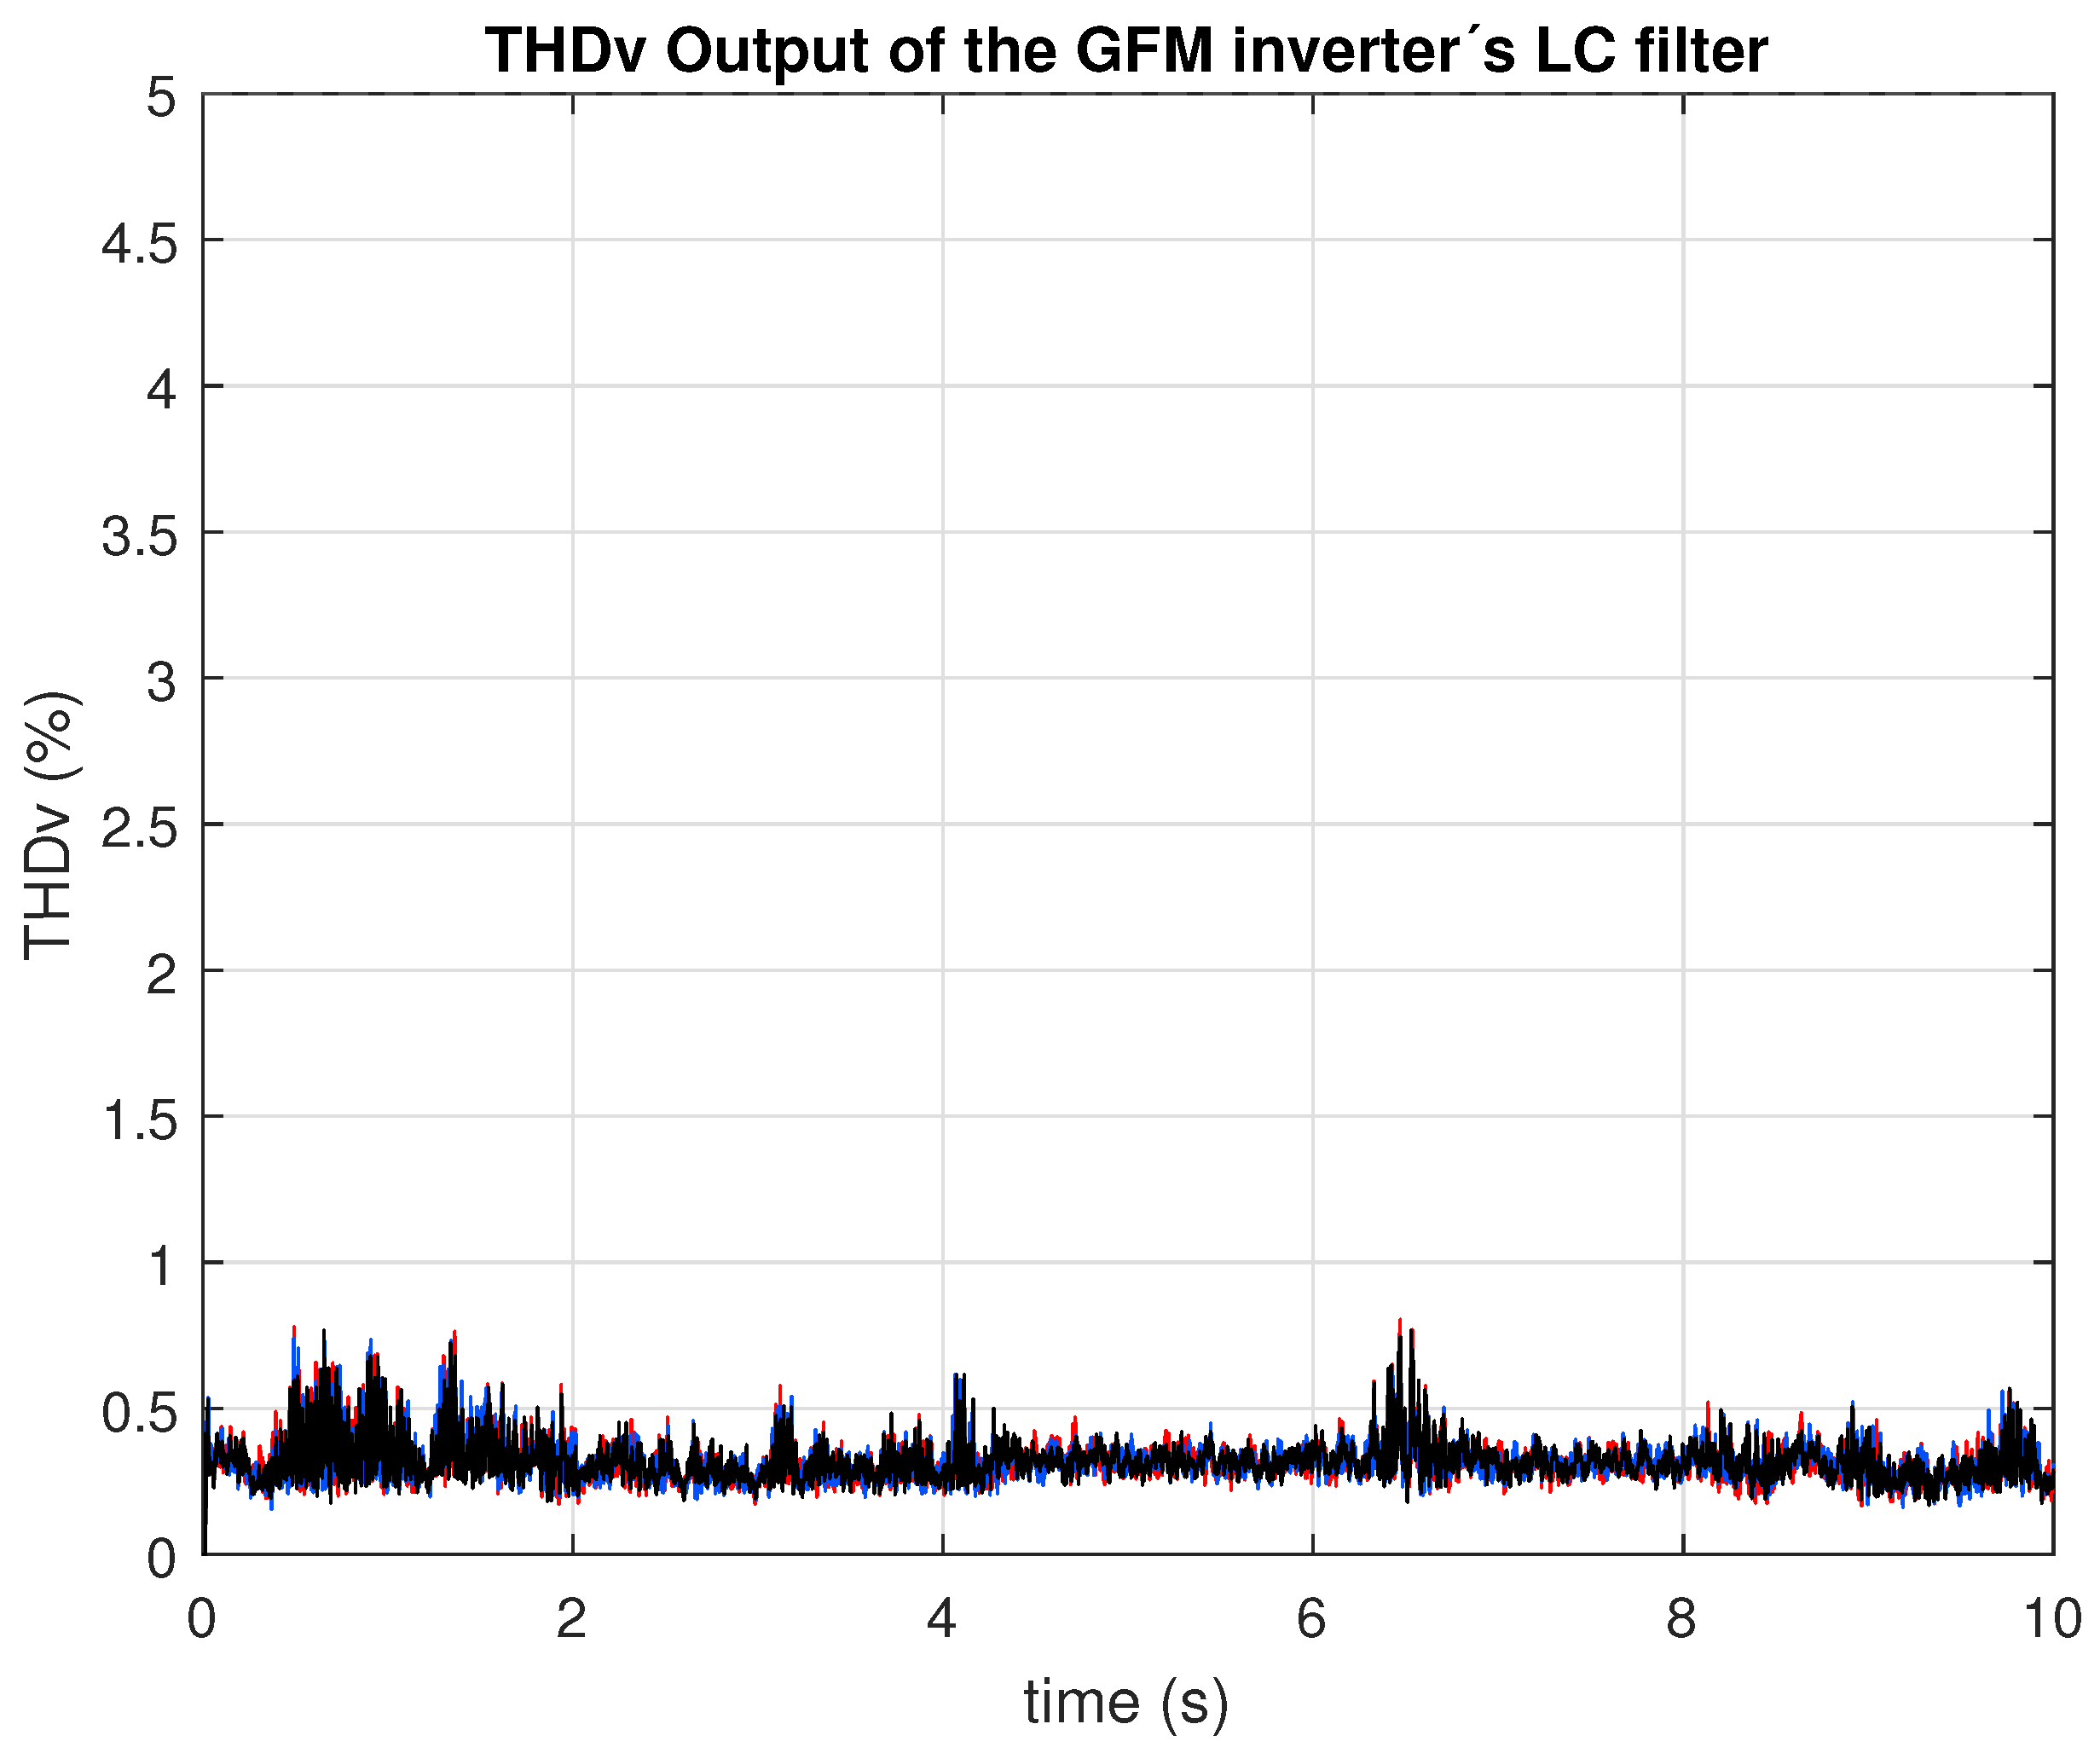
Similarly,
Figure 23 and
Figure 24 illustrate the voltage waveform and its corresponding THD, wich remained below 1%. This low value is attributed to the support provided by the grid, in contrast with the isolated condition where transient voltage THD reached up 5%.
Figure 25 and
Figure 26 illustrate the dynamic and transient response of the currents (
) and voltages (
) in the synchronous reference frame. These graphs demonstrate the robustness and response speed of the PI controllers implemented in the internal voltage and current control loops during the GFM’s connection to the grid (or while the GFM is grid-connected).
From a power quality perspective, these results confirm that the GFM control analyzed in this paper operated effectively under both isolated and grid-connected conditions, maintaining harmonic distortion levels within the recommended limits. Moreover, it is worth highlighting that the joint evaluation of virtual inertia, primary control (frequency), secondary control (power), and power quality analysis has not been simultaneously addressed in the studies reviewed by the authors, underscoring the contribution and novelty of this work.

