2.1. Voltage Stability Indices
This section details a structured method for analyzing voltage stability in radial distribution systems using specific stability indices. It begins by reviewing the most widely recognized indices reported in the literature, highlighting their principles and limitations. The study compares these indices in terms of collapse-prediction accuracy across different operating scenarios for radial power distribution systems. Furthermore, this section details the power flow techniques utilized in the assessment process, establishing a robust analytical framework for identifying critical operating conditions and improving the accuracy of voltage stability assessment in distribution systems.
Table 1 summarizes the well-known indices, including the recently published Novel Distribution Voltage Stability Index (
NDVSI [
36]), highlighting their key characteristics and underlying assumptions. It is important to observe that the indices (
SI [
32],
SI [
33], and
SI [
34]) disregard the impact of voltage angle differences and the shunt admittance of distribution lines, which can limit their accuracy under certain operating conditions. In contrast, the
NDVSI incorporates all line parameters, such as resistance, reactance, and voltage angle difference, providing a more comprehensive and realistic evaluation of system stability.
NDVSI also considers the magnitude of receiving active and reactive power load (
). The only exception is the line shunt admittance, which is typically negligible in radial power networks and therefore has no effect on voltage stability assessment.
The selection of these indices was guided by their extensive recognition in prior research, high citation impact, and consistent application in evaluating voltage stability. Although the indices [
32,
33,
34] share the same abbreviation “
SI,” they originate from separate studies conducted by different authors. Each index is based on a distinct mathematical formulation and analytical approach, resulting in significant differences in performance and interpretation. To maintain clarity and eliminate any potential confusion, each index is distinctly labeled with its corresponding citation:
SI [
32],
SI [
33], and
SI [
34]. These indices originate from separate formulations of the power flow equations, which lead to differences in how they react to various system operating conditions. For example, under normal load levels,
SI [
33] generally yields a value near 0.5, whereas
SI [
32],
SI [
34], and the
NDVSI [
36] tend to produce values approaching 1, suggesting a strong voltage stability margin. This behavior supports the conventional view that lower index values nearing zero signify a higher likelihood of voltage collapse. When the system is subjected to heavier loads in terms of active, reactive, or apparent power, the indices respond differently in identifying stressed states. These patterns are thoroughly examined in the section dedicated to case studies.
The critical value for all the voltage stability indices considered in this study is zero, as shown in
Table 1. Ideally, the value of each index should approach this critical threshold as the system load nears its maximum permissible level, indicating an increased risk of voltage collapse. Higher index values correspond to a safer operating state, while values approaching zero signal that the system is at risk of collapse. Each index exhibits distinct behavior due to differences in its derivation and underlying assumptions. For instance,
SI [
32],
SI [
34], and the
NDVSI [
36] have values close to 1.00 under low or normal loading conditions, reflecting a high stability margin. In contrast,
SI [
33] shows a value near 0.5 under base case loading.
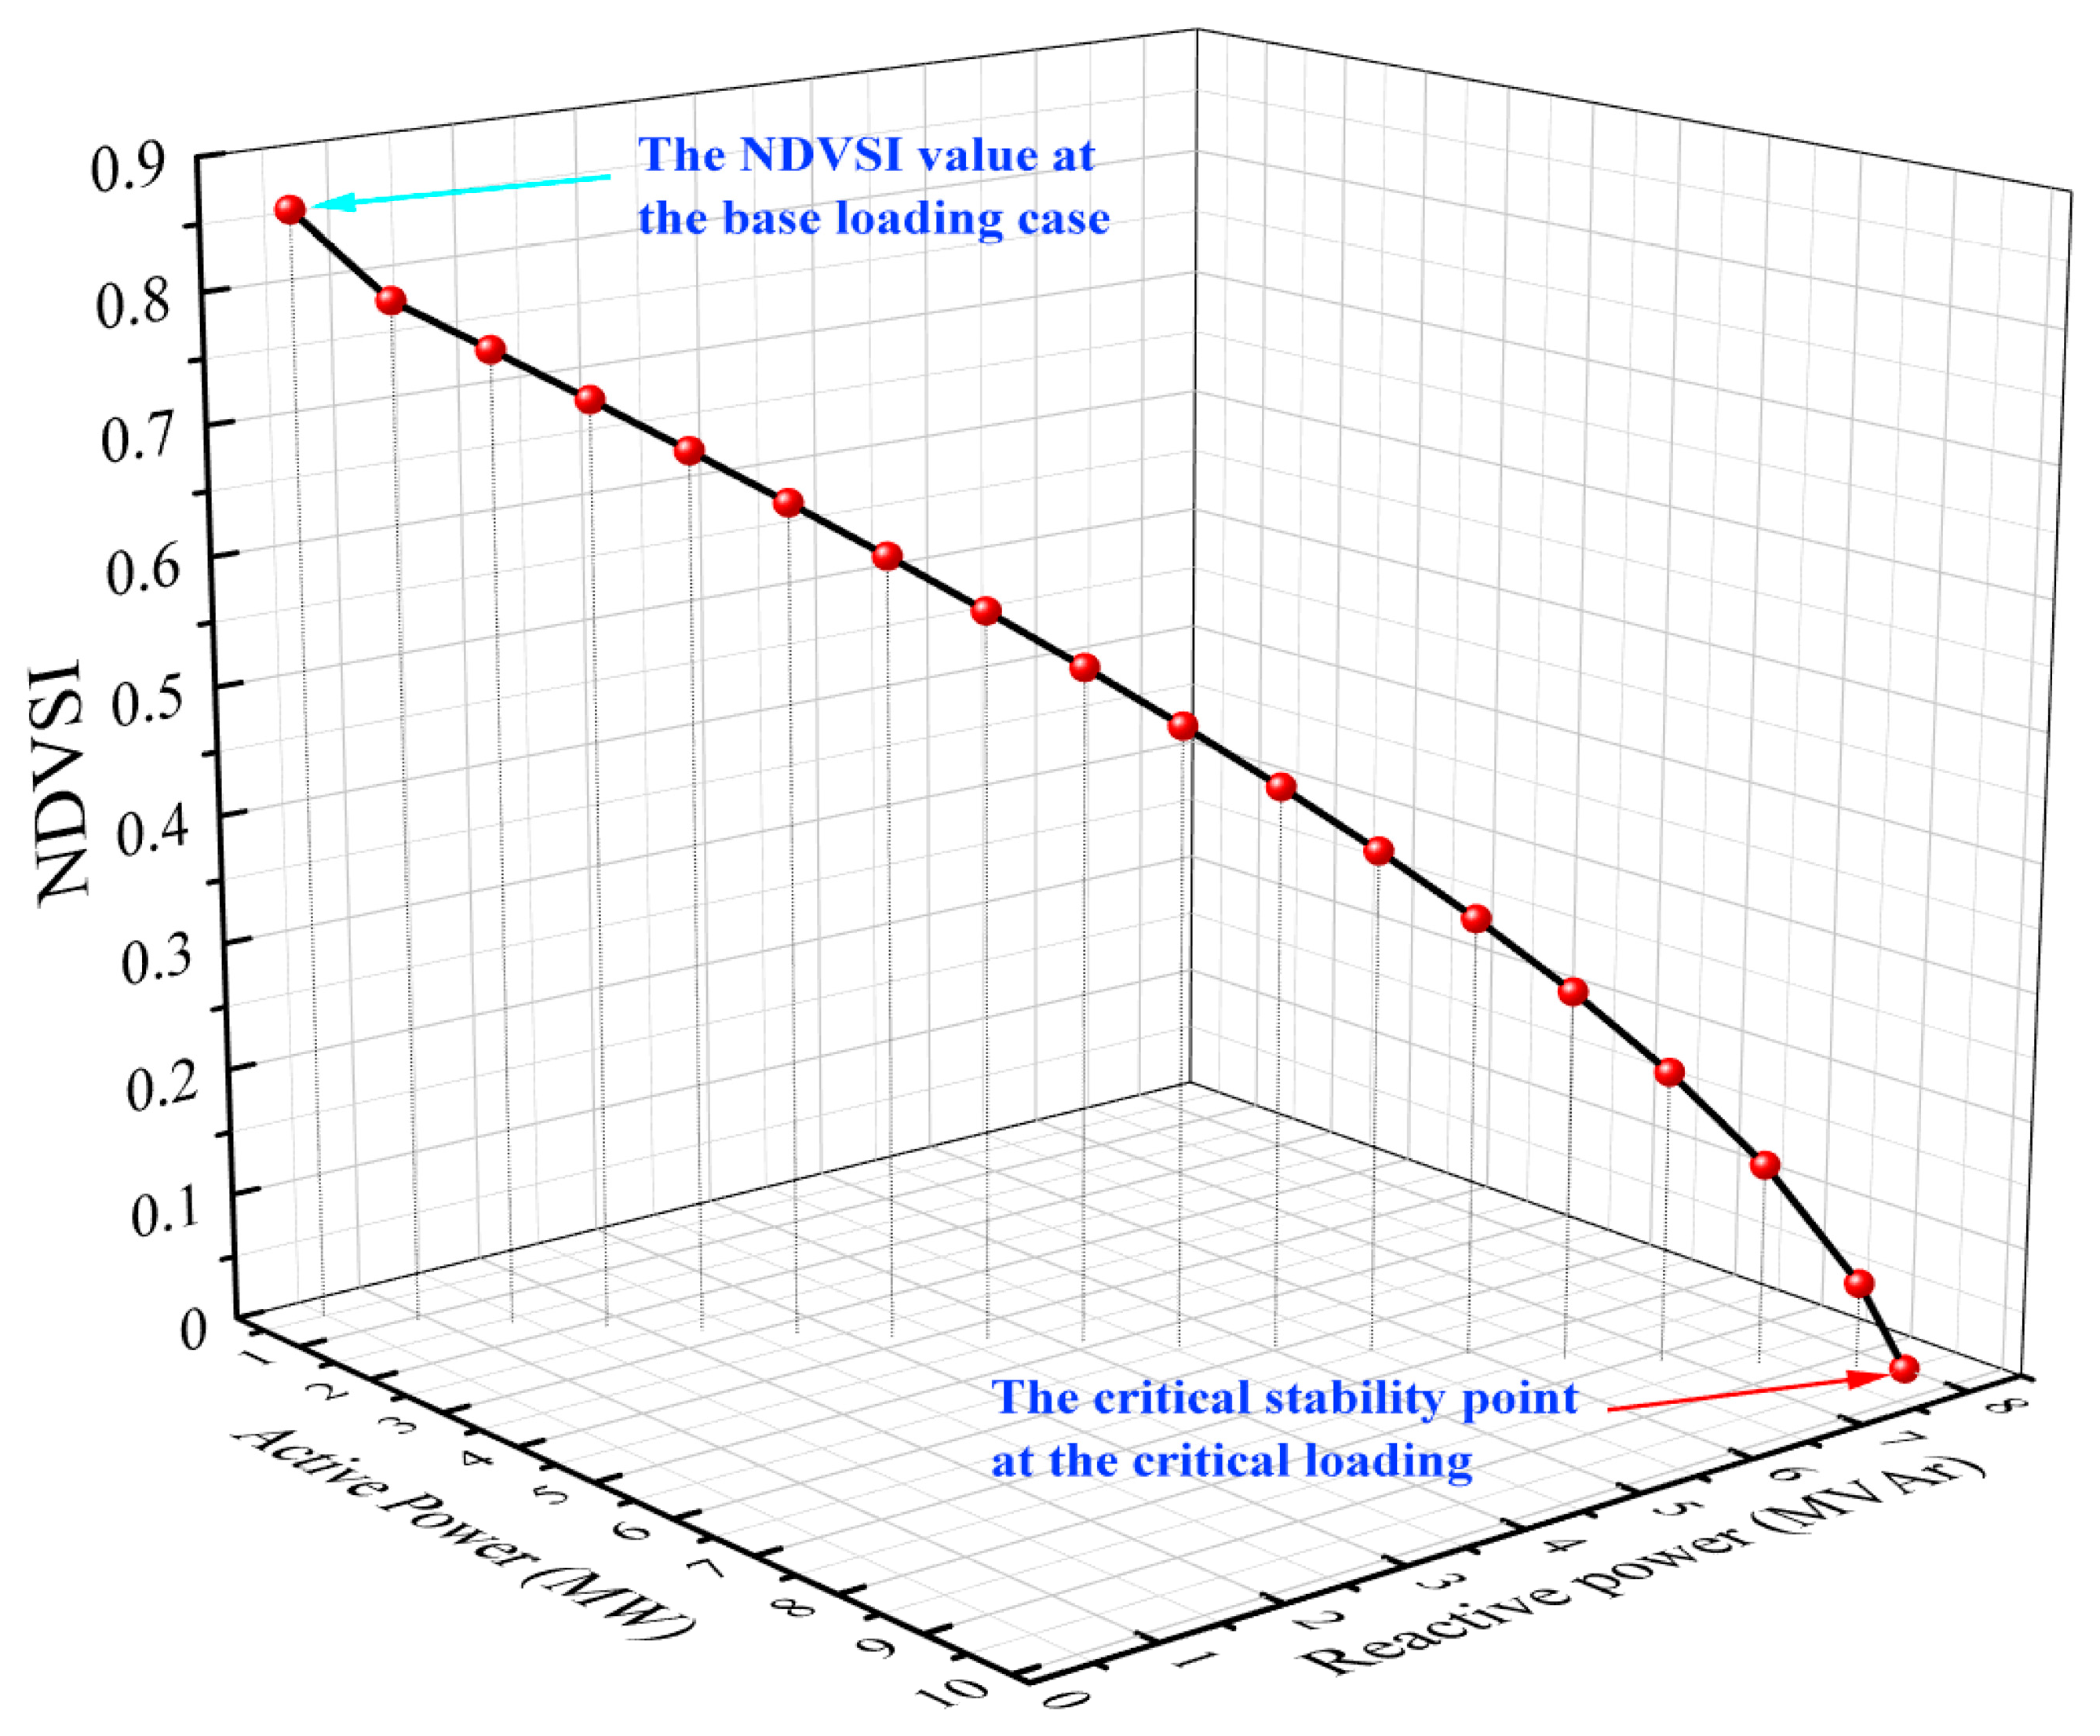
As the system load increases,
SI [
32],
SI [
34], and the proposed
NDVSI [
36] gradually decrease from 1.00 toward zero, while
SI [
33] decreases from 0.5 toward zero. This trend demonstrates that all indices are expected to approach zero as the system approaches critical loading conditions. At or near critical loads, an index value closer to zero provides a more accurate representation of voltage collapse risk, offering a precise early warning. Conversely, indices that remain significantly above zero under such conditions may give misleading results, suggesting that the system remains stable when it is, in fact, at risk of collapse.
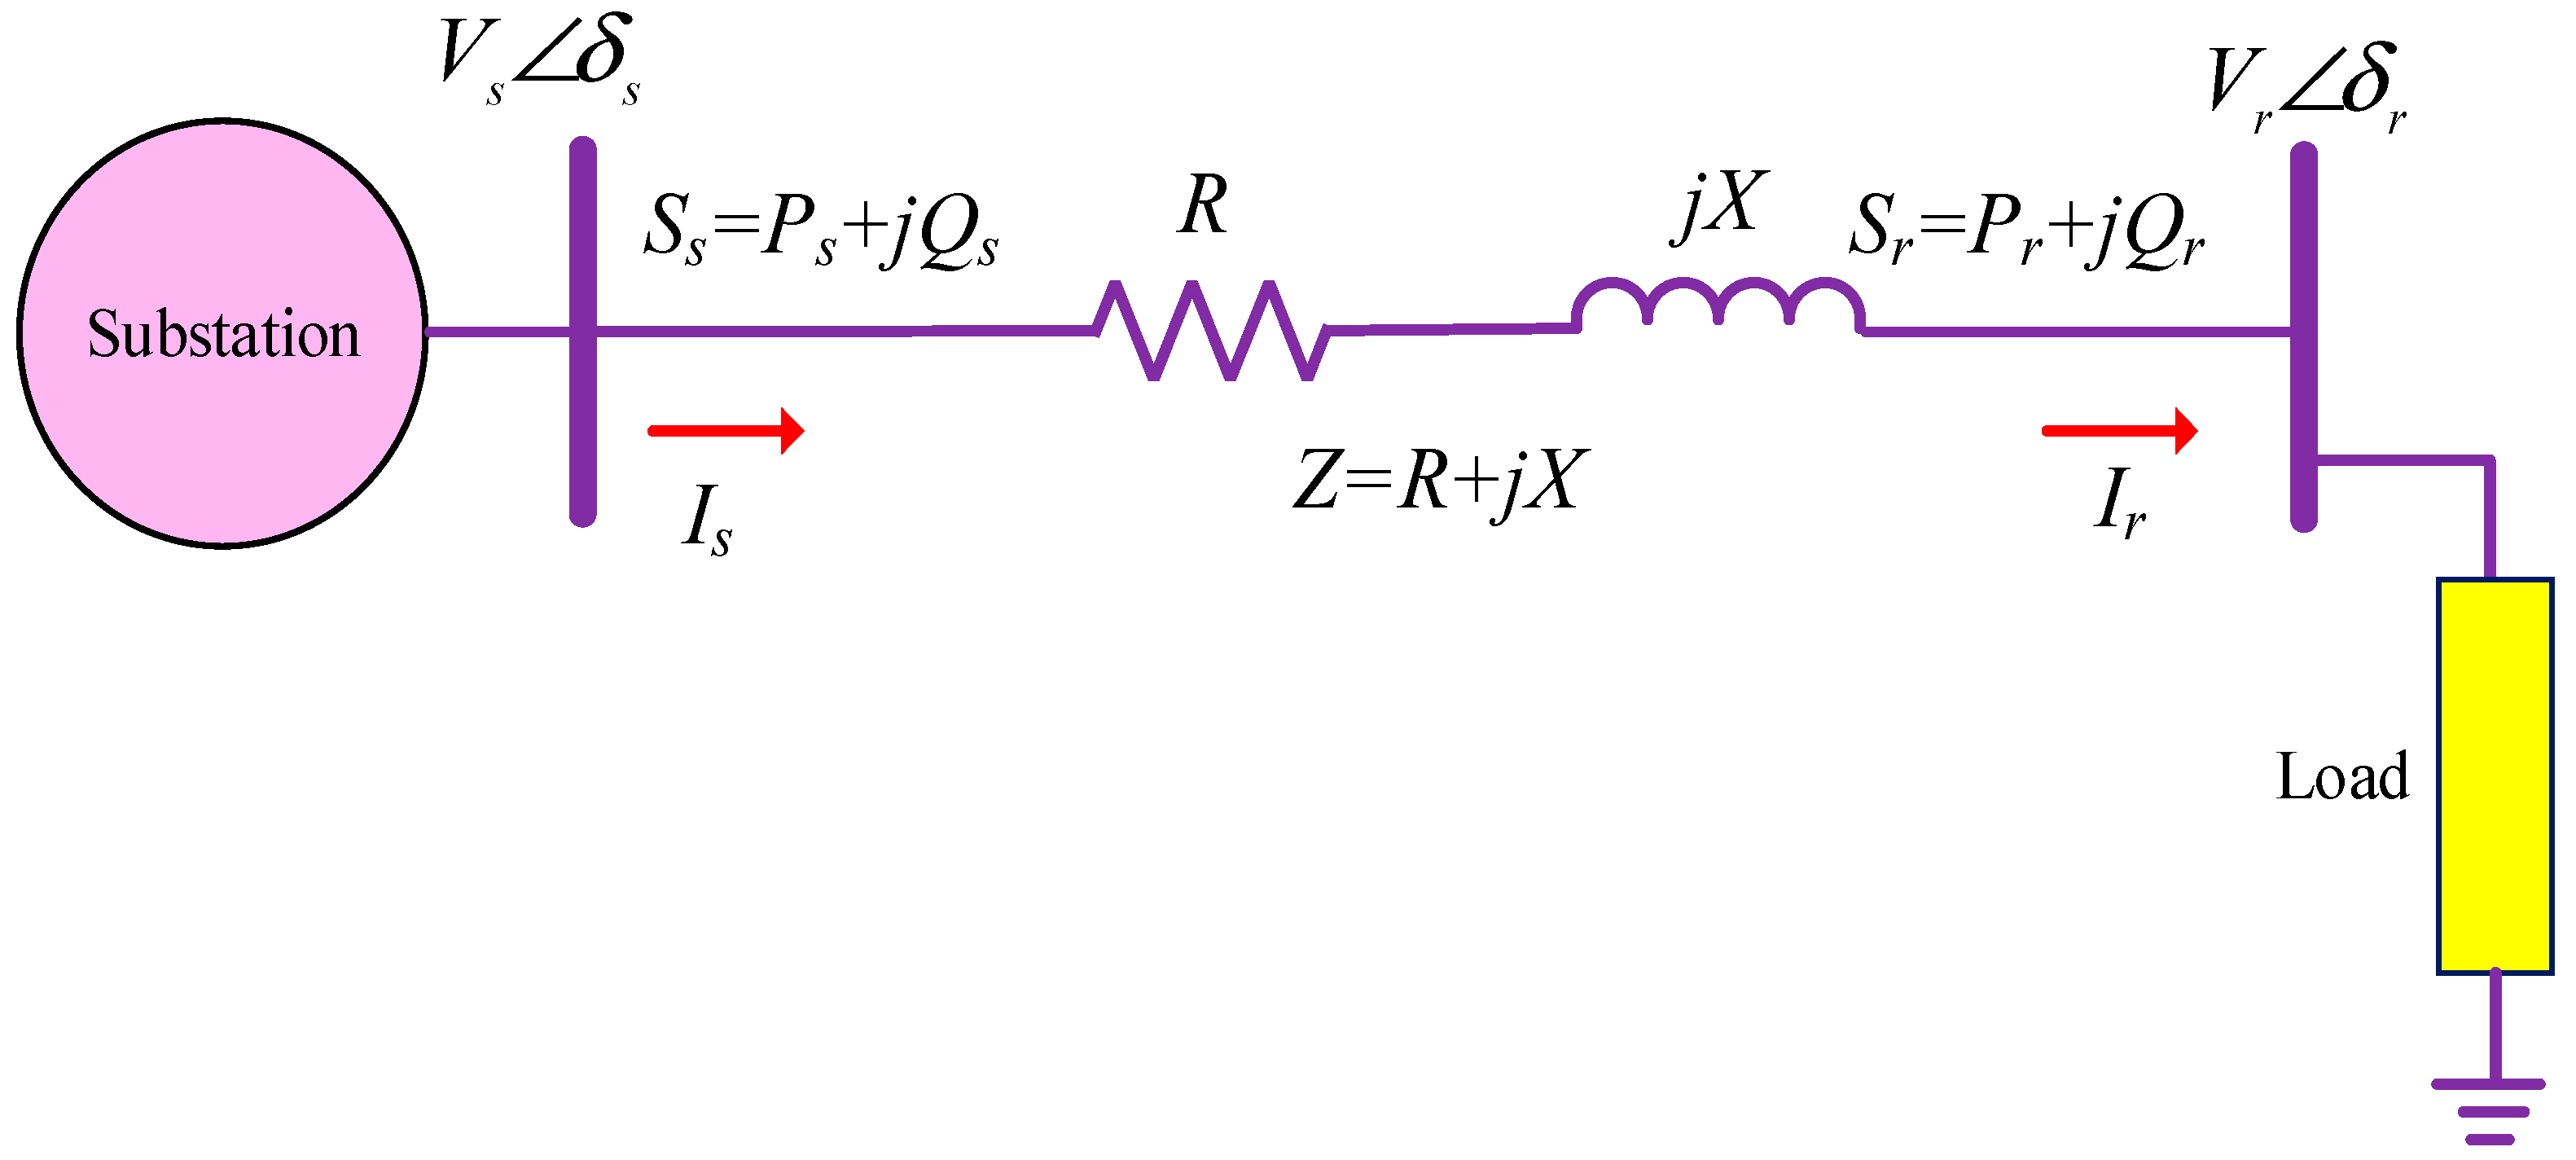
The single-line representation of a radial distribution network (RDN) is presented in
Figure 1, with the substation located at bus-s and the load placed at bus-r. Because the
, the Novel Distribution Voltage Stability Index (
NDVSI [
36]) can also be rewritten as:
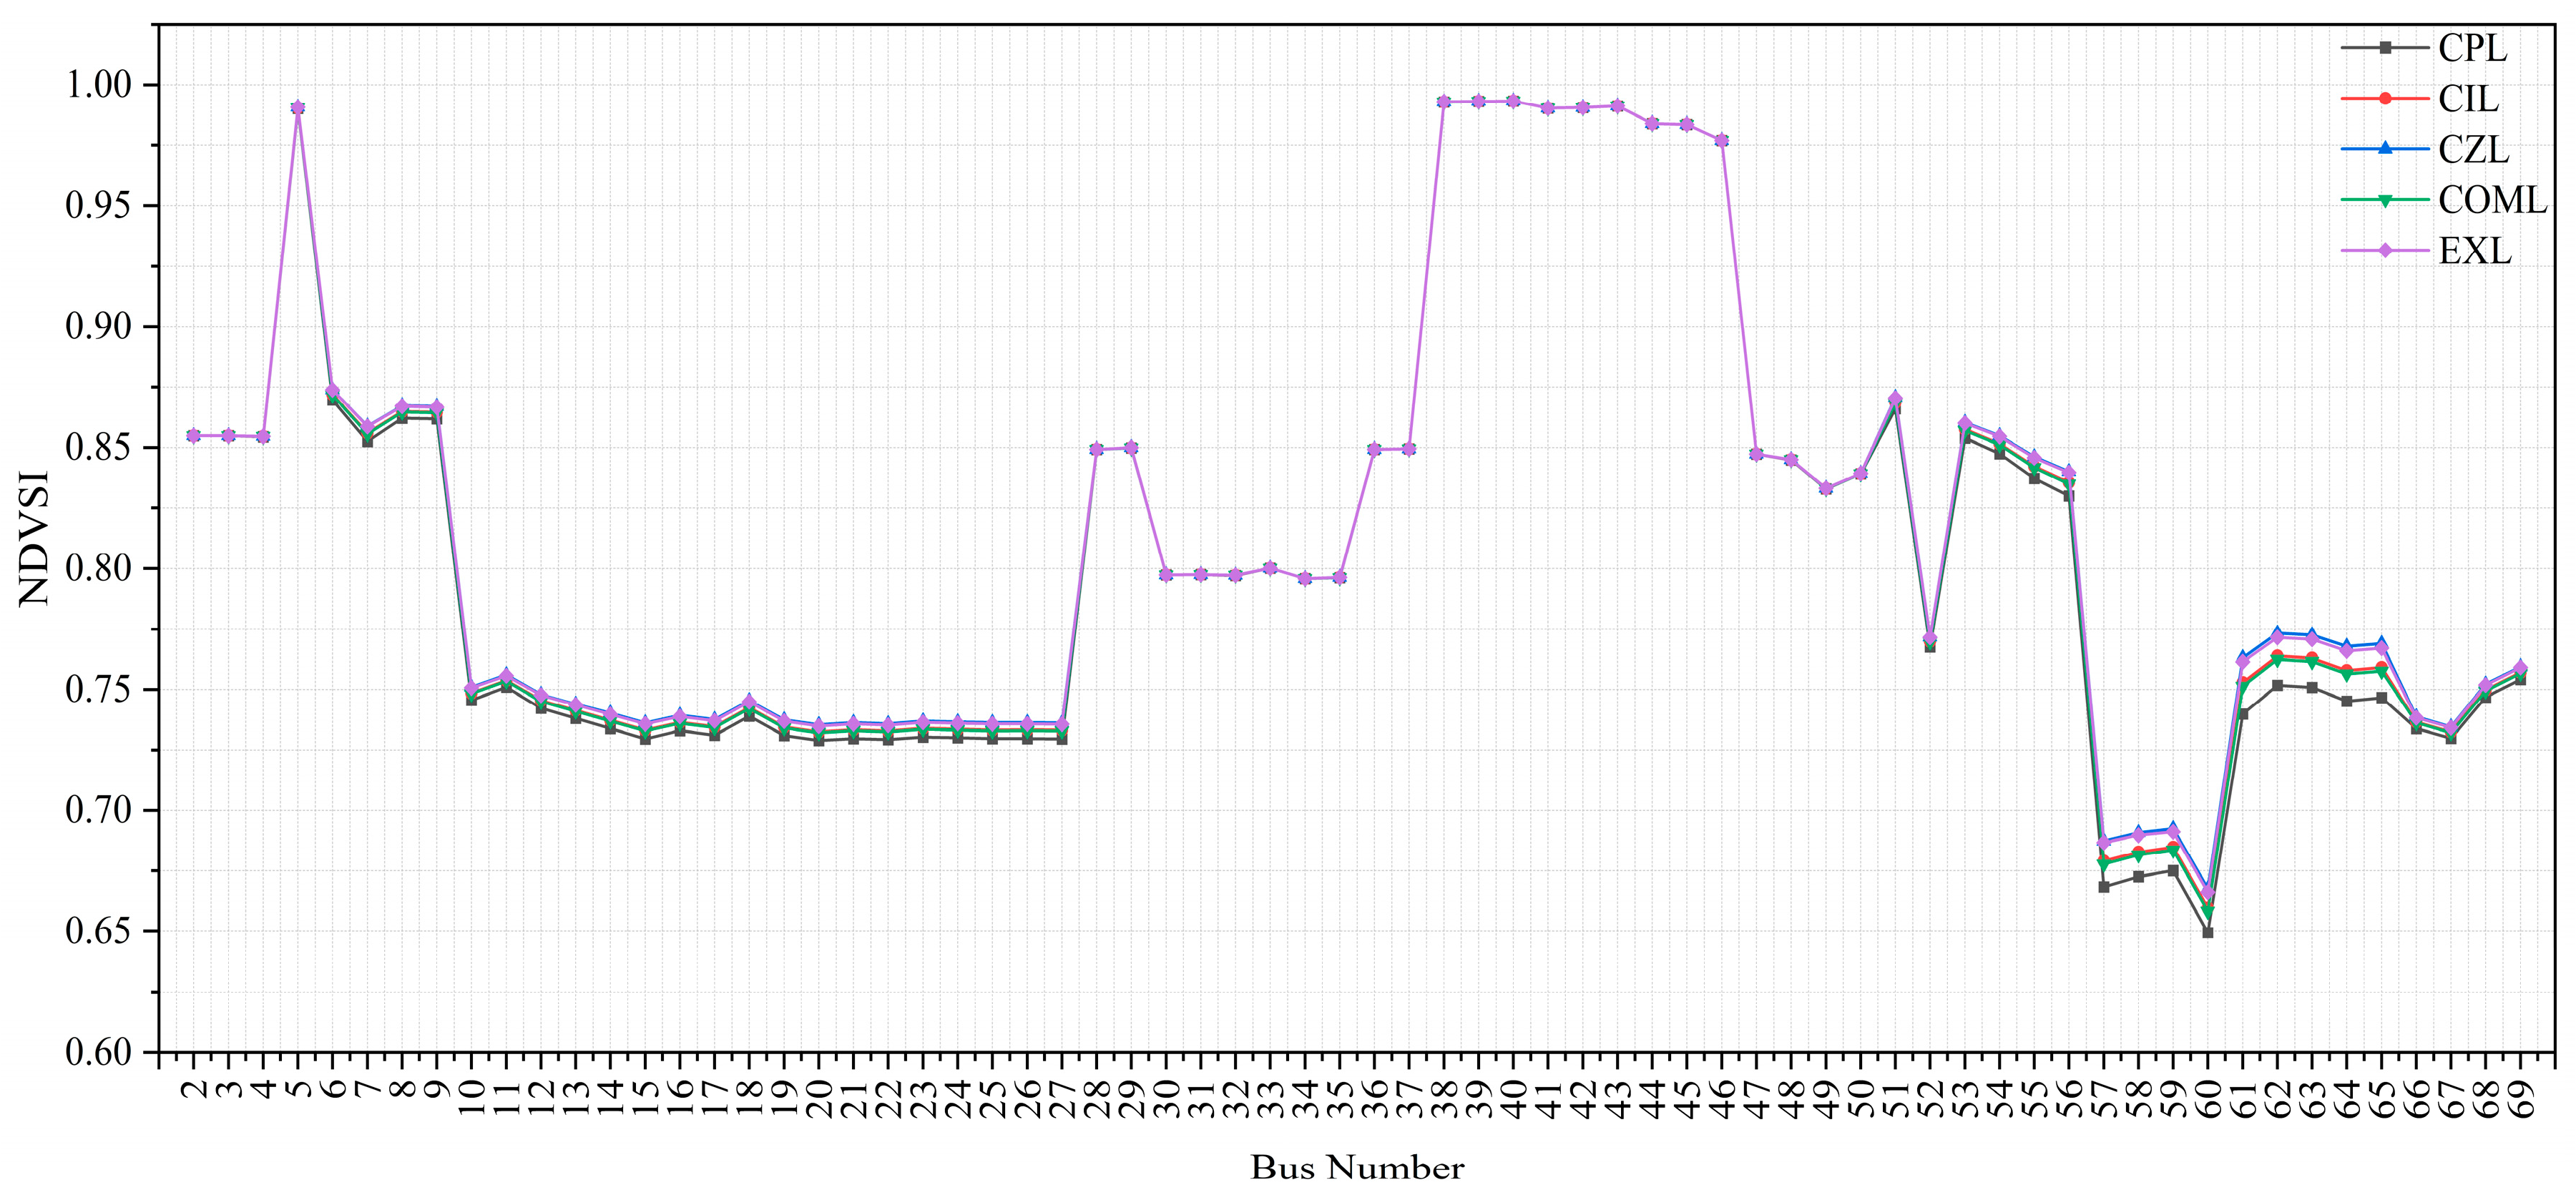
In a stable operating condition with normal loading, the NDVSI maintains values above zero close to 1. However, under instability scenarios like critical loading, the index decreases and eventually reaches zero. Values approaching zero indicate that the system is at a higher risk of voltage collapse.
From Equation (1),
NDVSI [
36] values are not solely dependent on the voltage magnitude. This is because
NDVSI is derived from the quadratic voltage equation, which itself is obtained from the power flow through the line of a two-bus equivalent system, where it relates the real (
) and reactive (
) powers projected along the line impedance angle (
). The term
reflects the phase alignment between the line impedance and the bus voltage angles. The first term,
, represents the stabilizing effect of the sending-end voltage—higher sending voltage or smaller phase deviation enhances the voltage stability at the receiving end. Conversely, the second term,
represents the destabilizing effect of power transfer through the line impedance. The
NDVSI value decreases as the load (
and
) increases or when the impedance angle (
) becomes large, indicating a reduced voltage stability margin.
Unlike
NDVSI, conventional indices neglect the influence of voltage-angle differences and are unrelated to the impedance angle, as illustrated in
Table 1. Therefore, each index exhibits distinct characteristics due to the distinct assumptions made during its formulation.
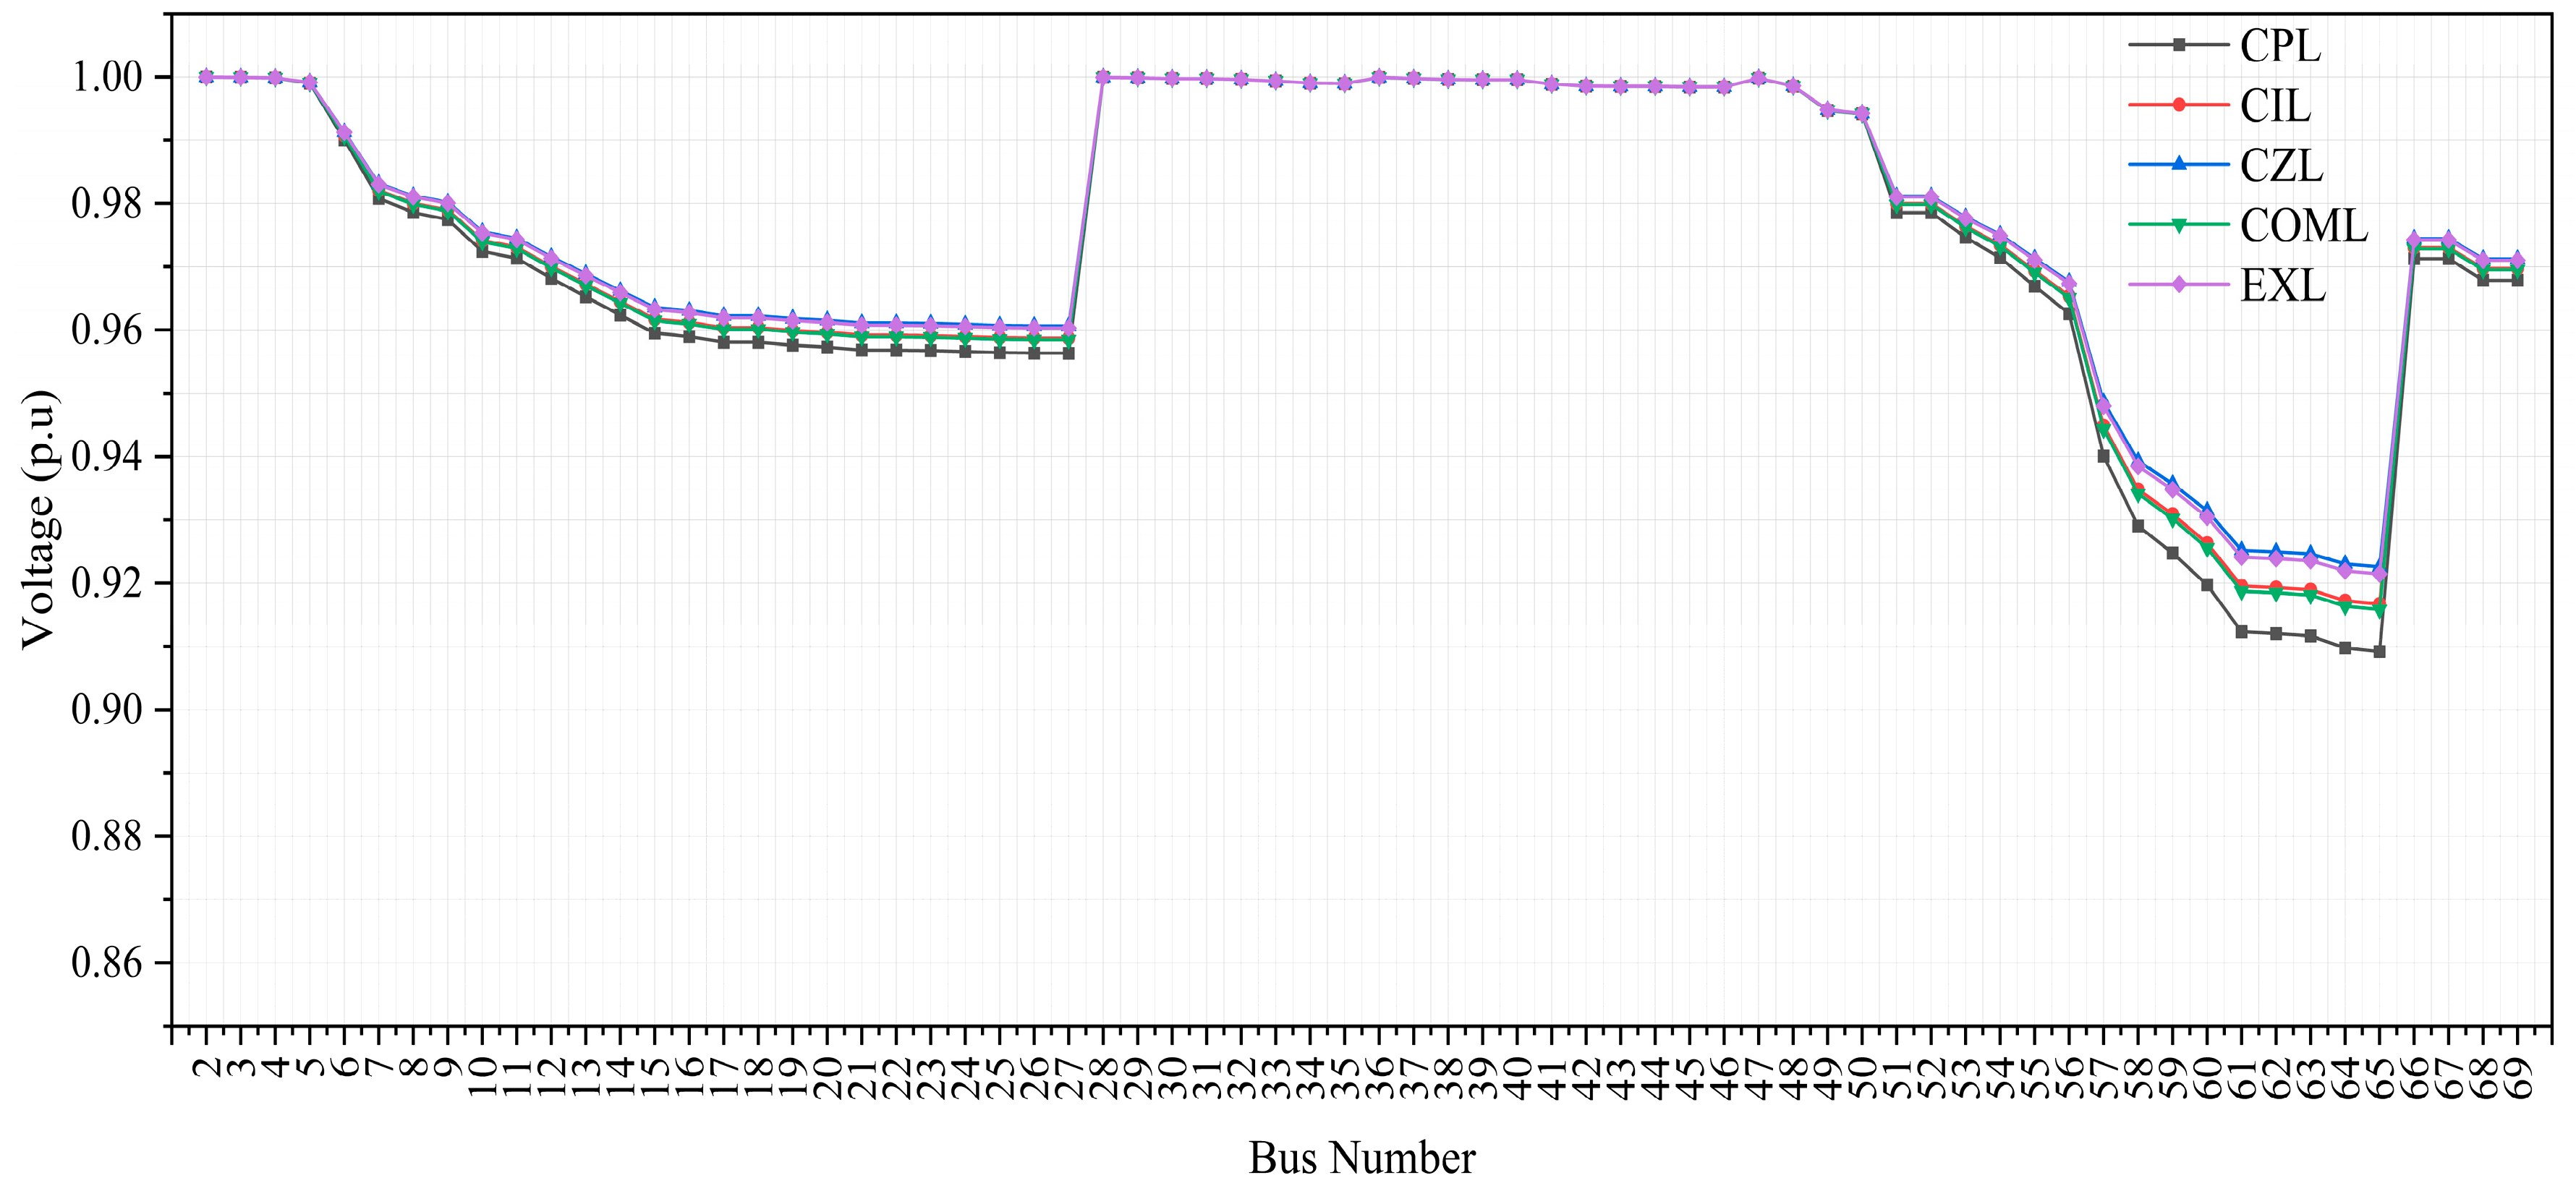
In summary, NDVSI captures the combined influence of sending-end voltage magnitude, load power, line impedance, and phase angle, not voltage alone. This explains the nonlinear relationship observed between NDVSI and bus voltages. Consequently, NDVSI does not necessarily follow the voltage profile monotonically; instead, it reflects the system’s voltage stability sensitivity rather than absolute voltage magnitudes.
2.3. Load Modeling
2.3.1. Formulation of Load Modeling
This study examines various balanced power load models, including constant power (CPL), constant current (CIL), constant impedance (CZL), composite (COML), and exponential (EXL). A unified mathematical representation encompassing these load types is provided in Equations (16) and (17).
The nominal active and reactive power are represented by
and
, respectively. V represents the bus voltage. Equations (16) and (17) have constraints in the following ways for every load:
This study assesses the voltage stability of radial distribution systems during the following load models:
- (1)
Constant Power Load (CPL)
For this model, and for . The system was tested under 100% CPL conditions at both base and critical loading levels. In this case, the load power remains constant regardless of voltage variations.
- (2)
Constant current load (CIL)
For this model, and for . The system was tested under 100% CIL conditions at base and critical loading levels. In this case, the load power is linearly proportional to the voltage magnitude.
- (3)
Constant impedance load (CZL)
For this model, and for . The system was tested under 100% CZL conditions at base and critical loading levels. In this case, the load power varies with the square of the voltage magnitude.
- (4)
Composite load (COML)
This model consists of 40% CPL, 30% CIL, and 30% CZL (ZIP components). The system was tested at both base and critical loading levels. This composite model allows for a more realistic representation of practical loads that exhibit mixed characteristics of power, current, and impedance components.
- (5)
Exponential load (EXL)
For this model,
and
for
. The exponential exponents e
1 and e
2 are set to 1.38 and 3.22, respectively [
38]. The system was tested under 100% EXL conditions at base and critical loading levels.
2.3.2. Explanation and Influence of Load Models on Voltage Stability
- (1)
Constant Power Load (CPL)
Description: Power consumption remains unchanged even when the voltage varies.
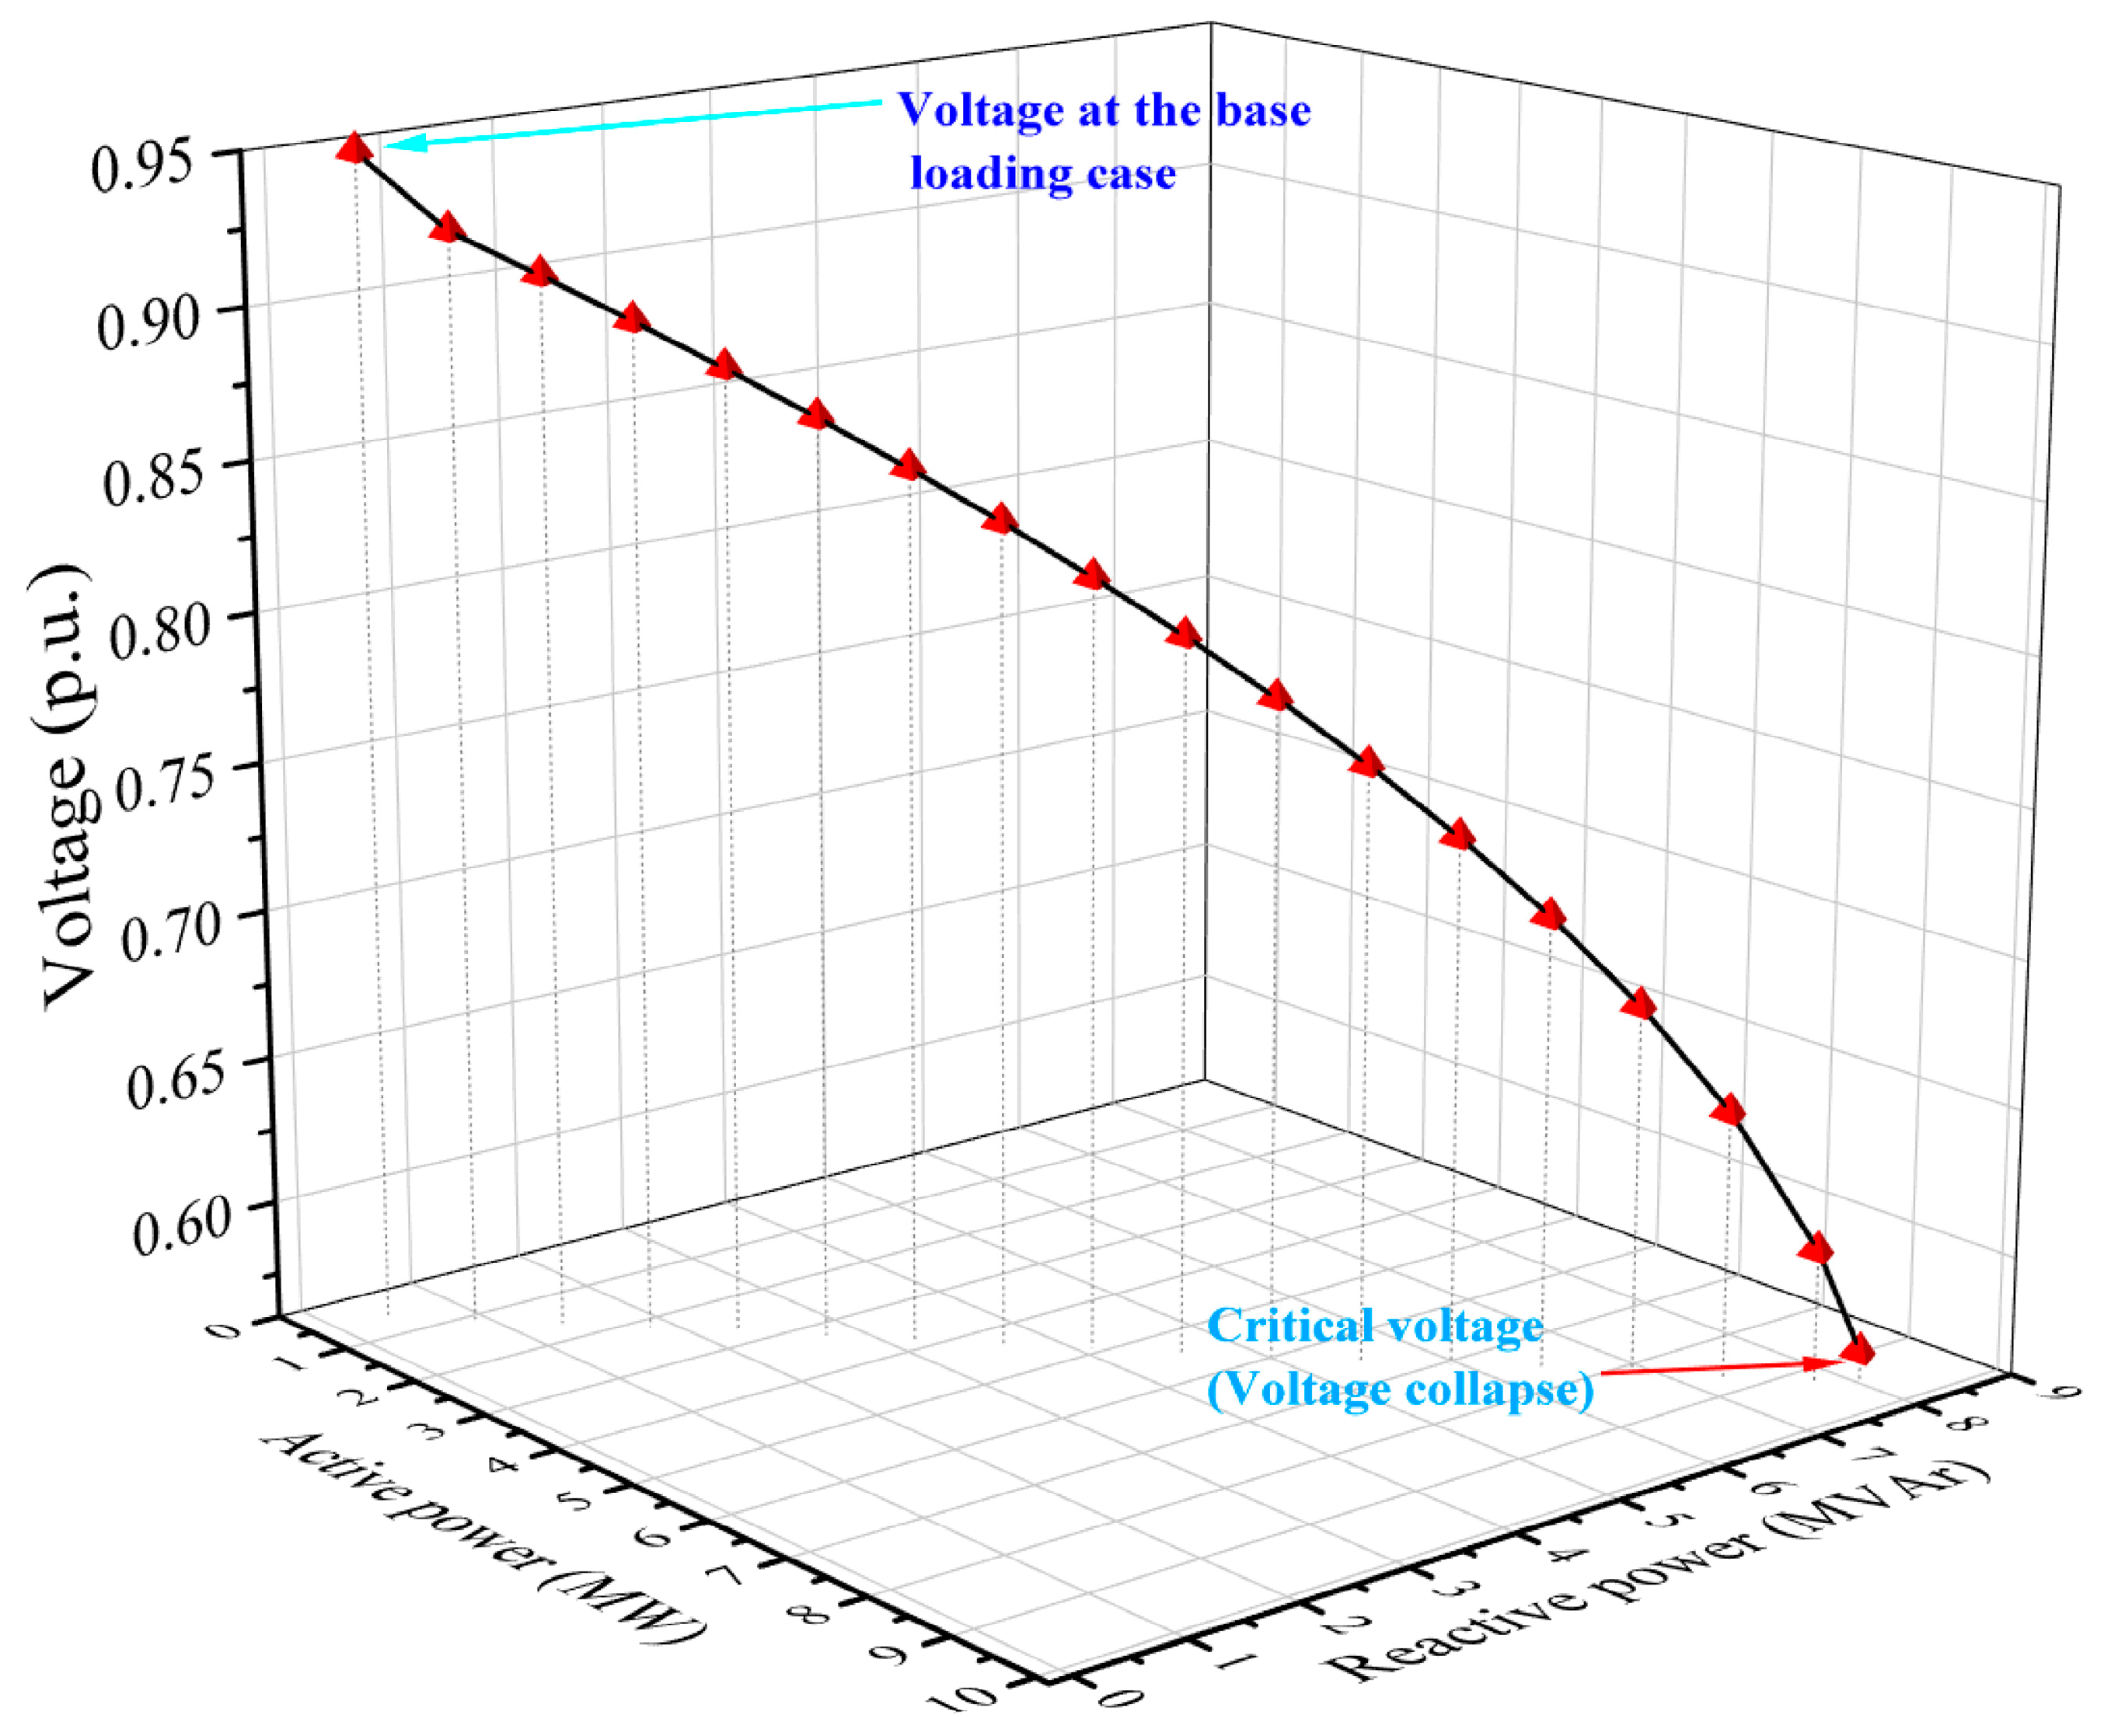
Impact on Voltage Stability: CPLs tend to reduce voltage stability because they draw the same power even at lower voltages, forcing the system to increase current and resulting in a larger voltage drop. This negative damping effect can lead to voltage collapse under stressed conditions.
- (2)
Constant Current Load (CIL)
Description: Power consumption changes linearly with voltage (i.e., ).
Impact on Voltage Stability: CILs exhibit moderate sensitivity to voltage changes. They are more stable than CPLs but less stable than CZLs, providing a balance between system stiffness and flexibility.
- (3)
Constant Impedance Load (CZL)
Description: Power consumption varies with the square of voltage ().
Impact on Voltage Stability: CZLs support voltage stability because their power demand decreases with voltage drop, naturally relieving system stress and preventing collapse.
- (4)
Composite Load (COML)
Description: Represents a mixture of CPL, CIL, and CZL components, capturing the realistic behavior of actual loads (e.g., households or industrial systems).
Impact on Voltage Stability: The stability behavior depends on the relative share of each component. A higher CPL portion tends to weaken stability, while a higher CZL portion improves it.
- (5)
Exponential Load (EXL)
Description: Power varies with voltage raised to exponents and , typically derived from empirical data.
Impact on Voltage Stability: EXL provides greater modeling flexibility, enabling more accurate representation of nonlinear load responses. For
and
, the load exhibits nonlinear but generally stabilizing behavior at higher voltages [
38].
2.4. Contingency Monitoring and Voltage Stability Assessment During Different Operating Load Conditions
Voltage stability analysis mainly focuses on identifying voltage collapse conditions, determining the highest load the system can handle, recognizing weak buses and branches, and estimating the remaining load margin. Understanding the proximity of the system to voltage collapse points is essential for ensuring continuous power supply. The suggested method for contingency monitoring under various operating load scenarios at various power factors is presented in this paper. In various likely operating load levels, the index’s efficacy in online system stability monitoring is evaluated. Different probable loads are progressively increased until the maximum permitted load is reached in order to assess the practicality of each index in diagnosing the critical nodes. To forecast voltage collapse at this juncture, the index must approach the stability threshold, which is zero.
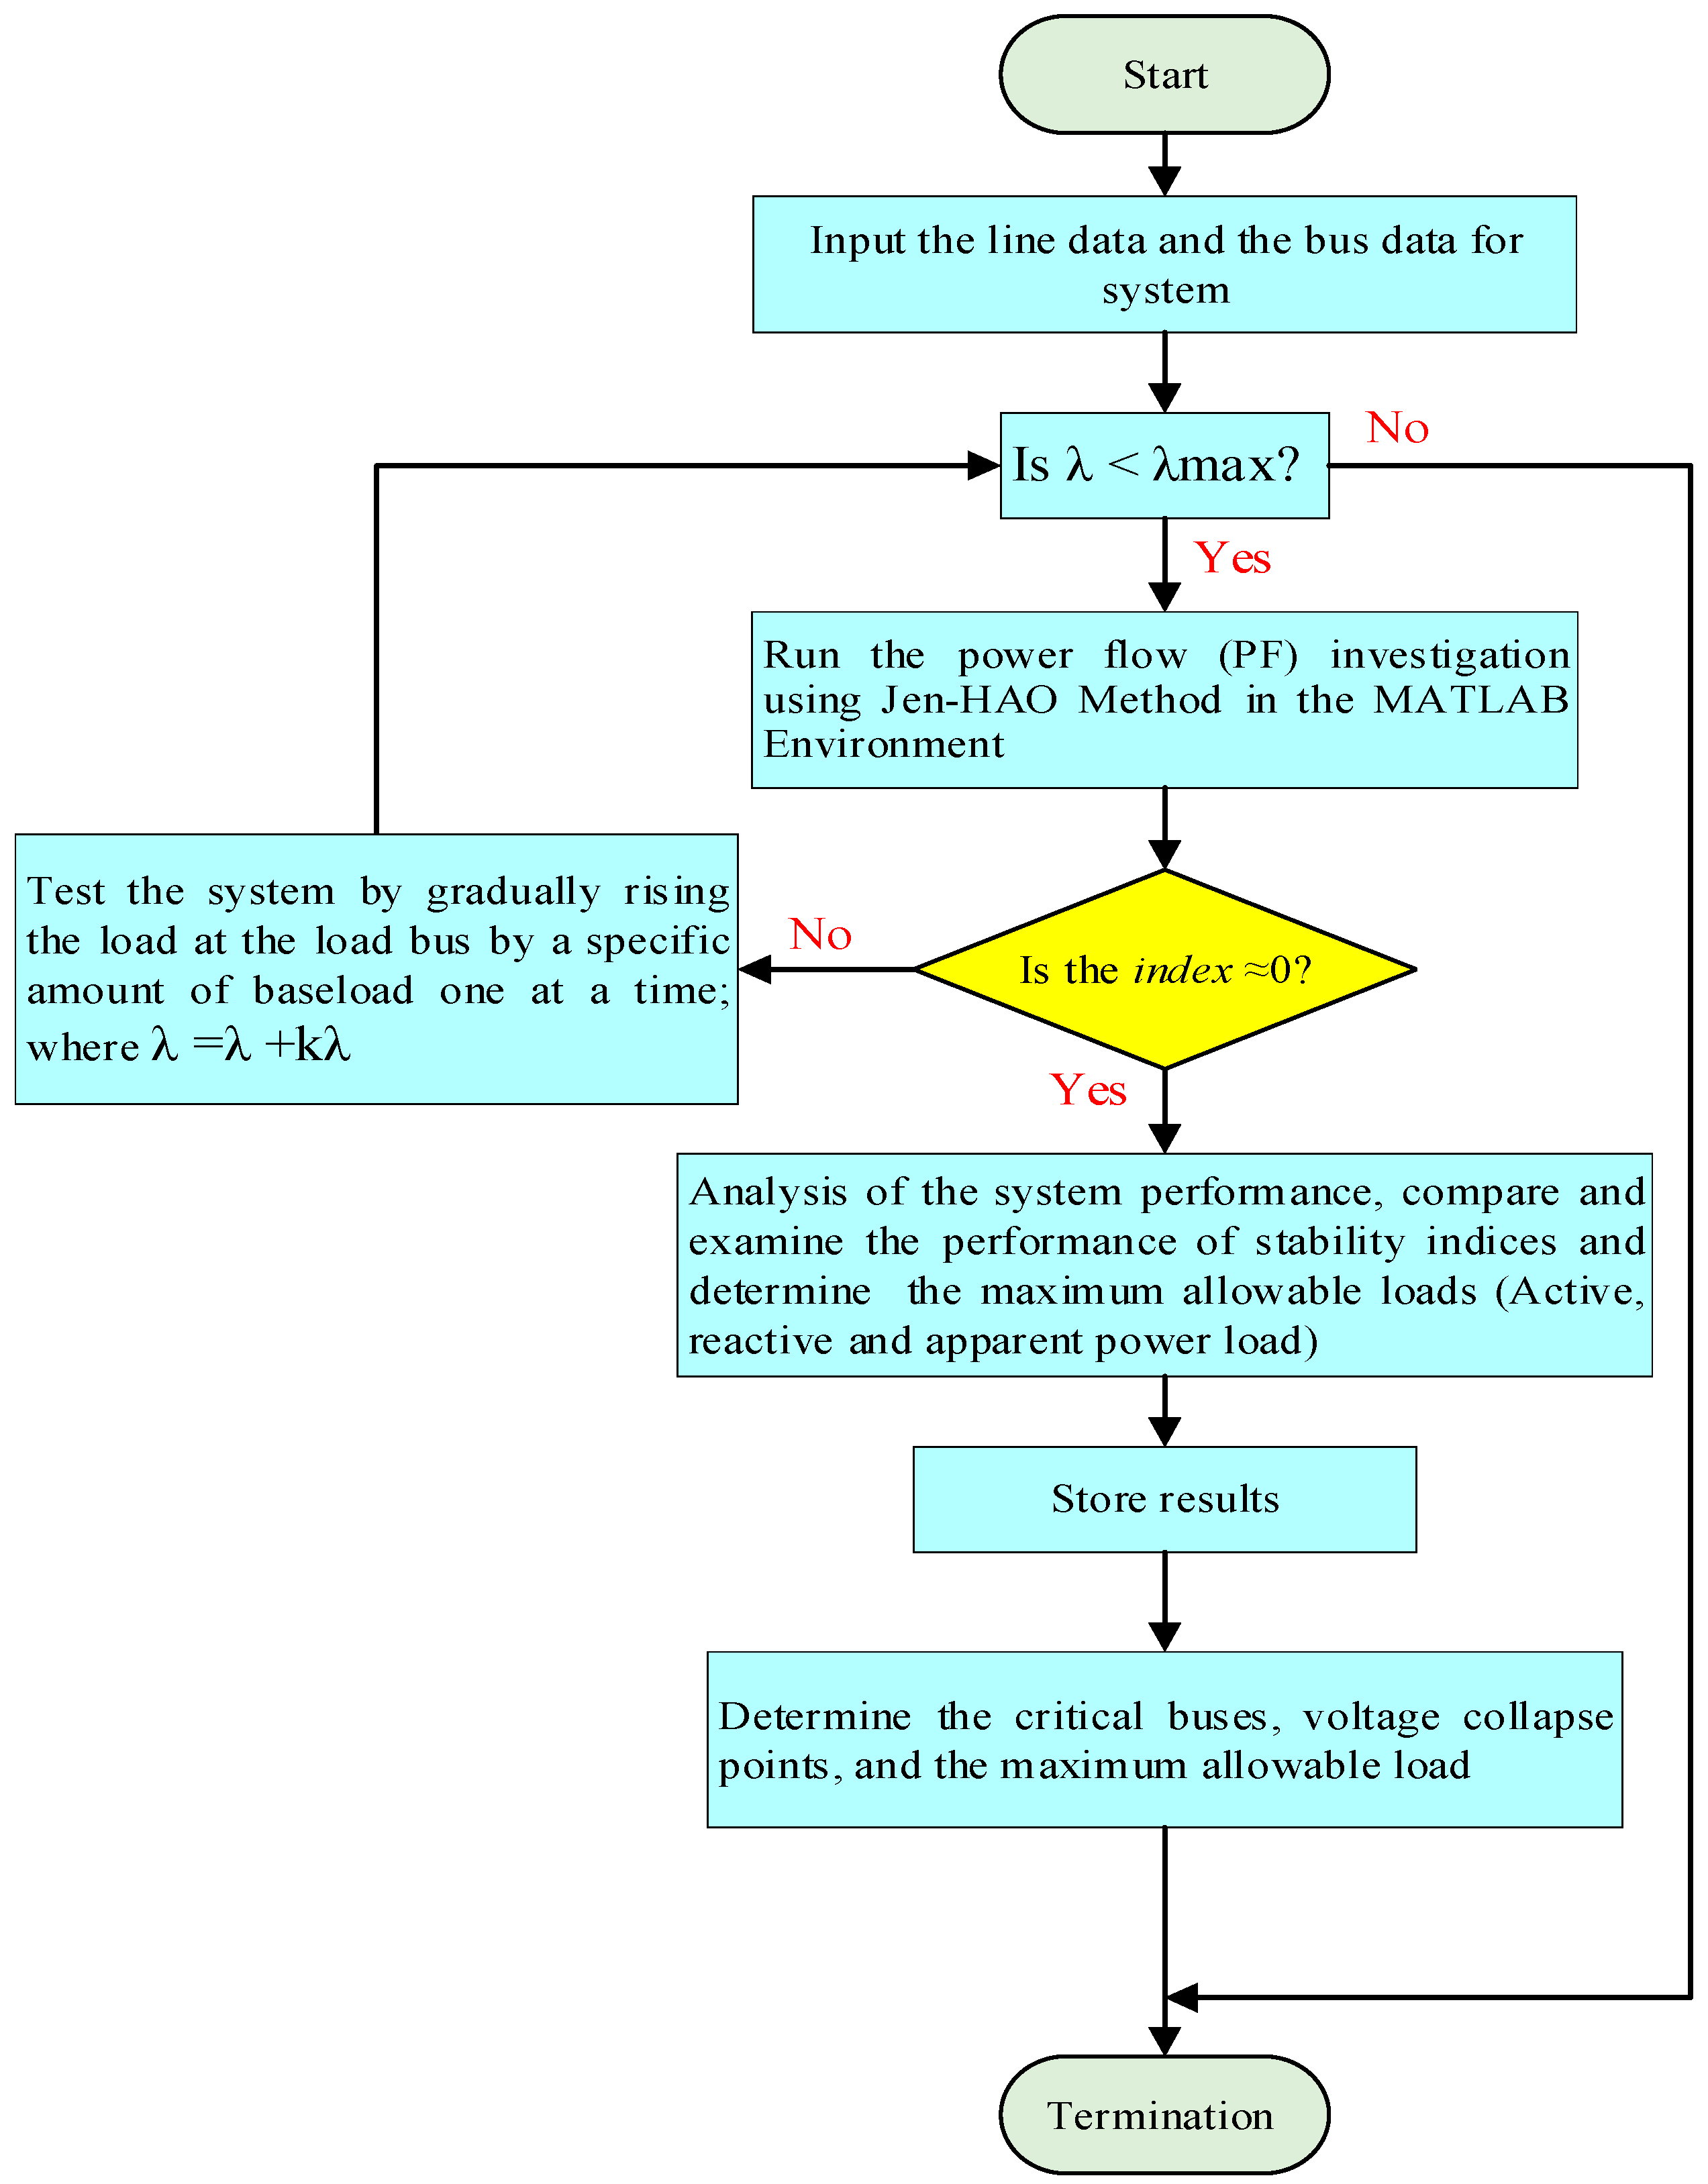
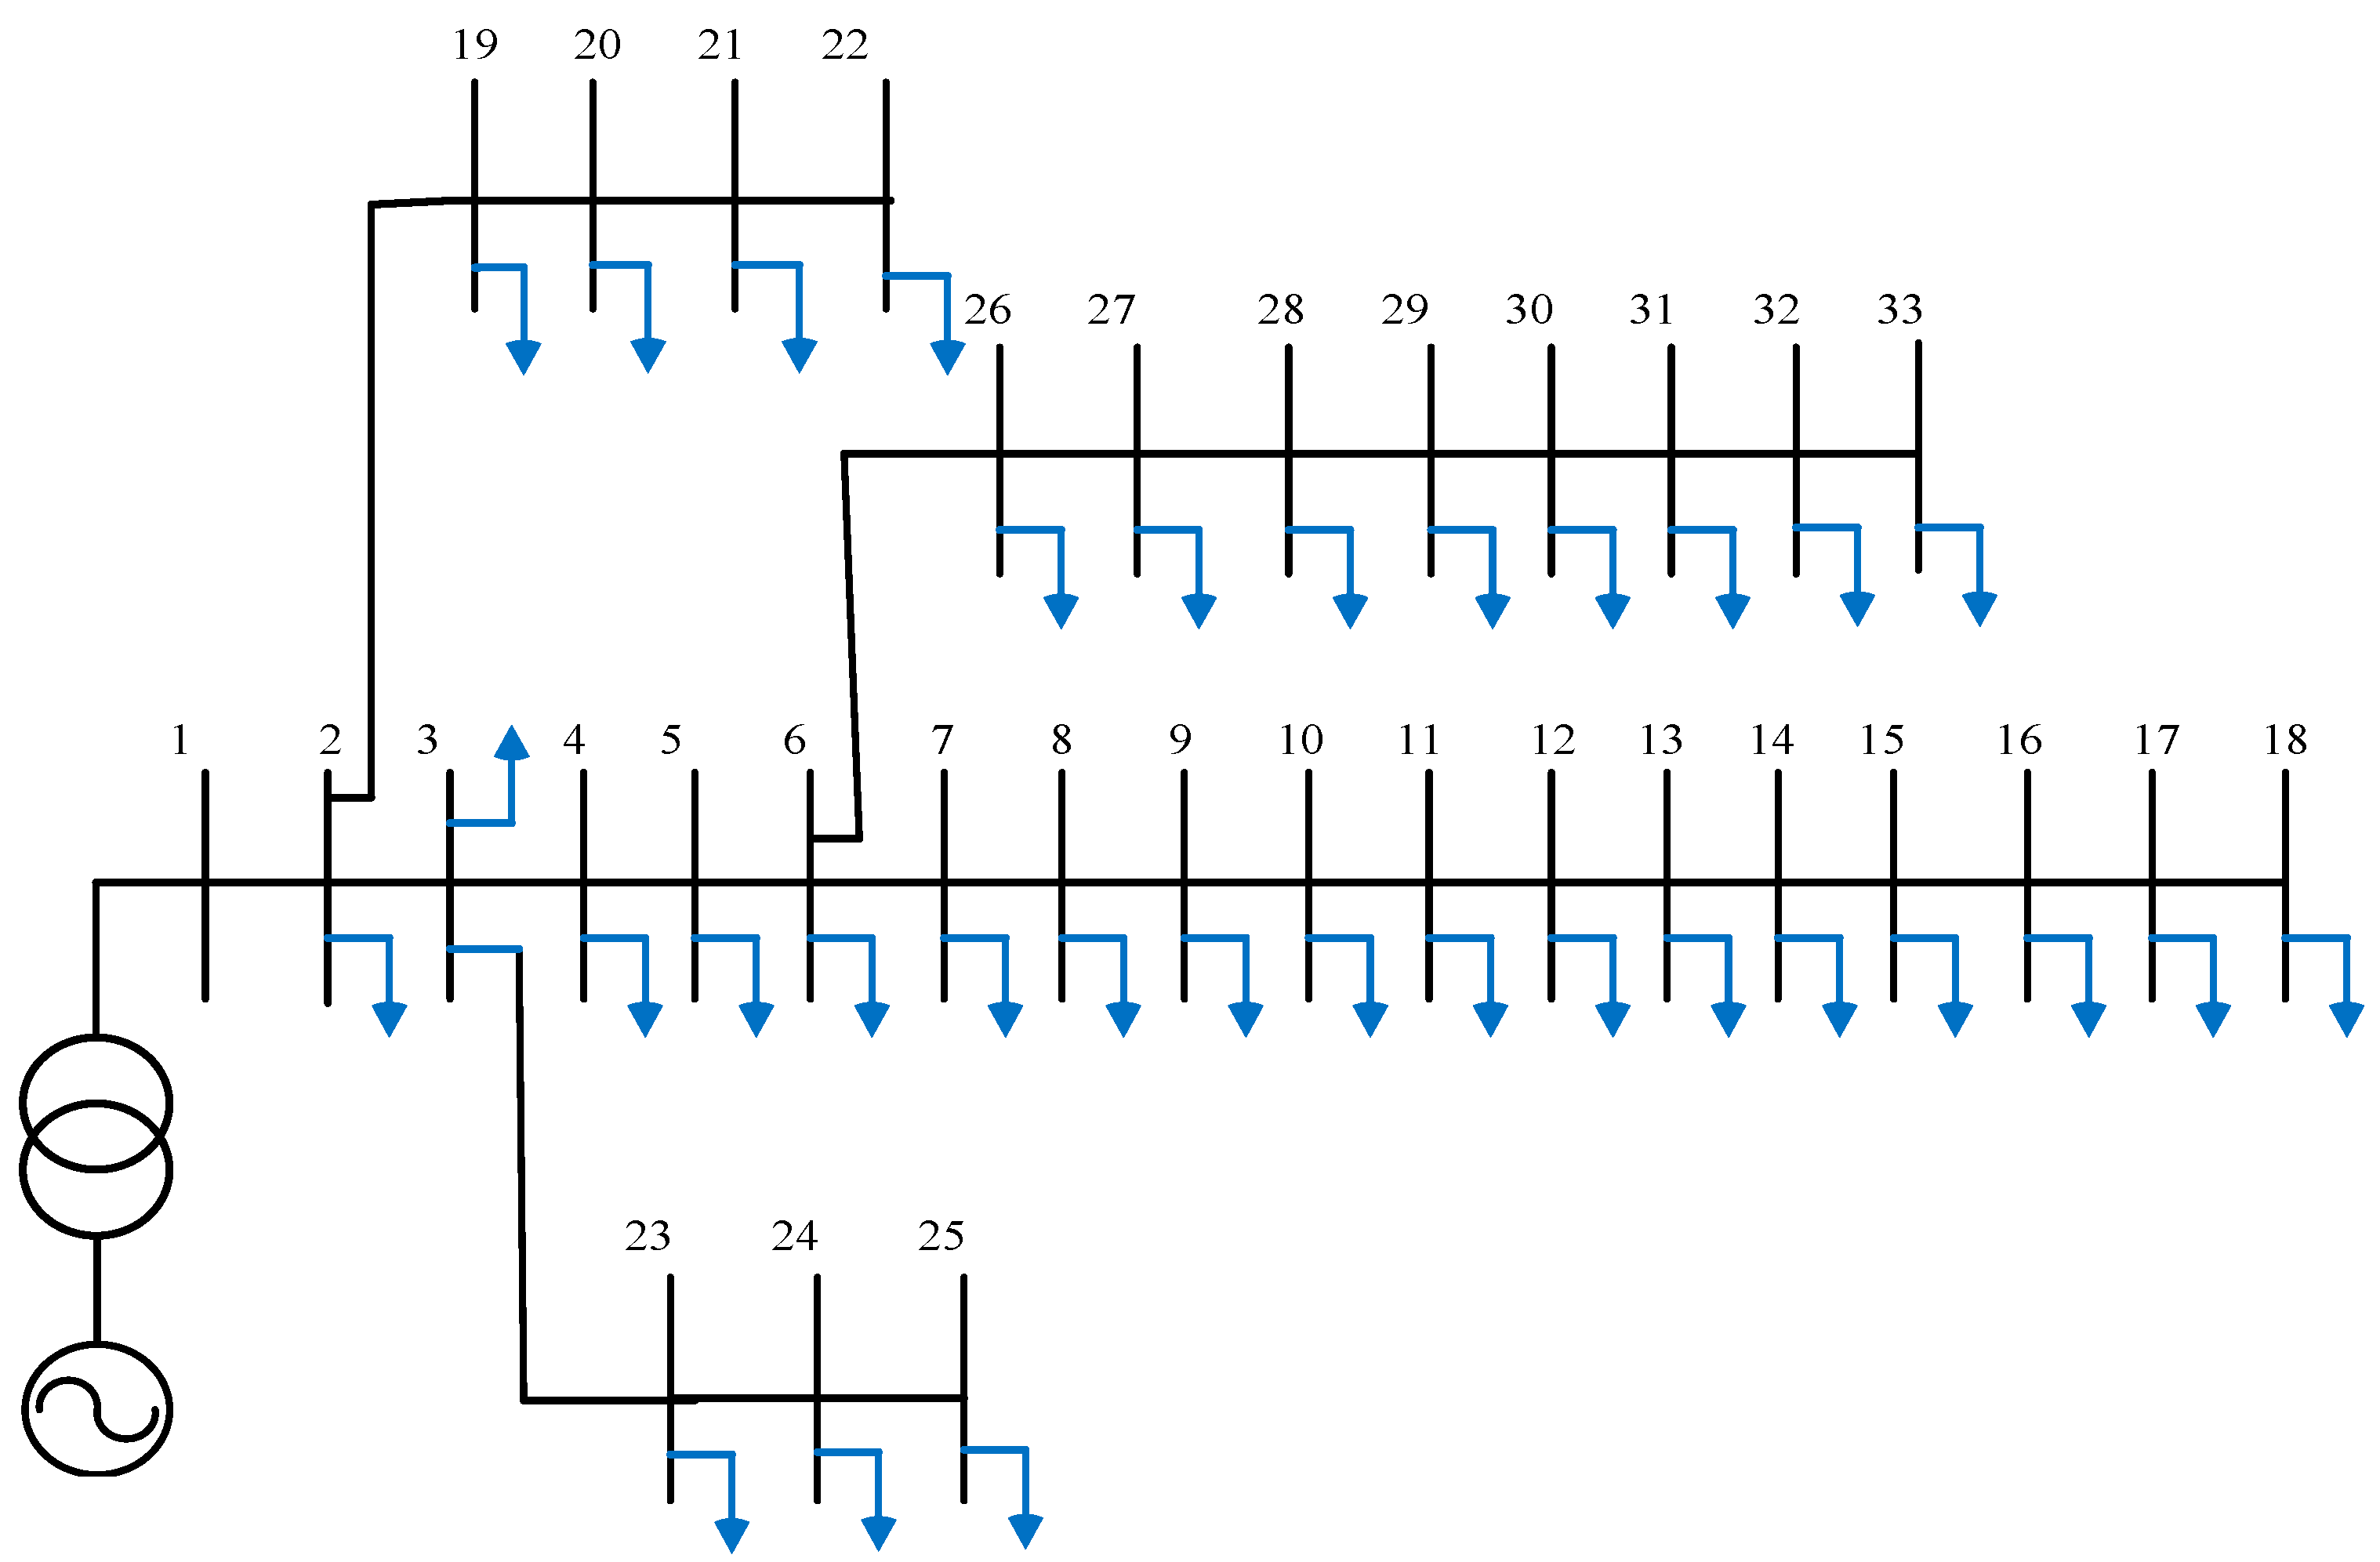
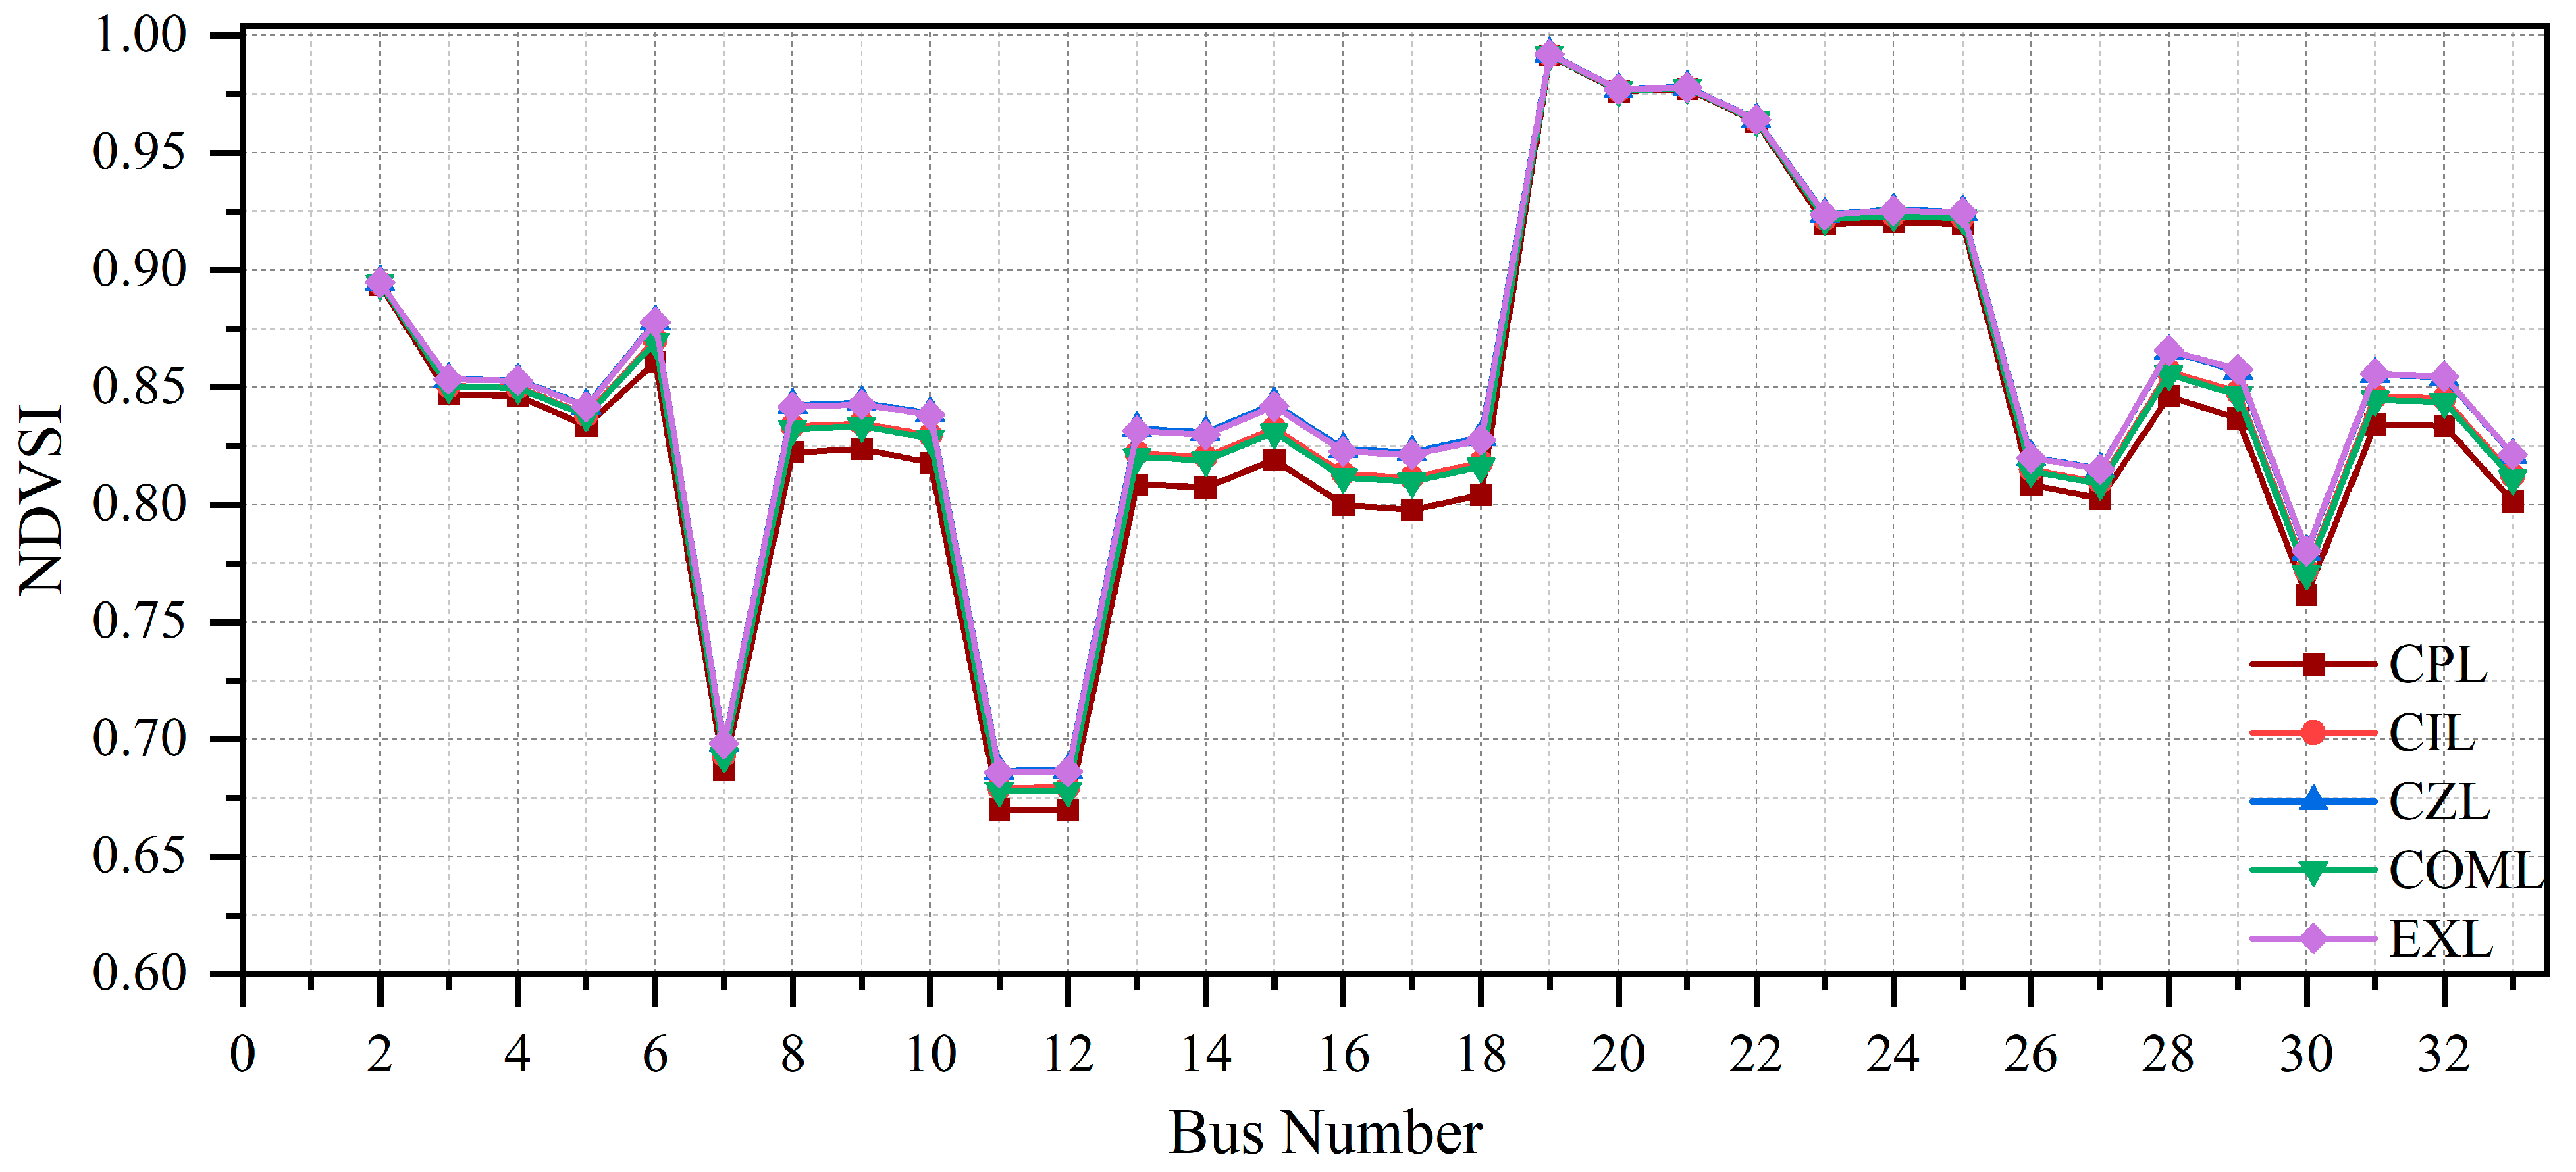
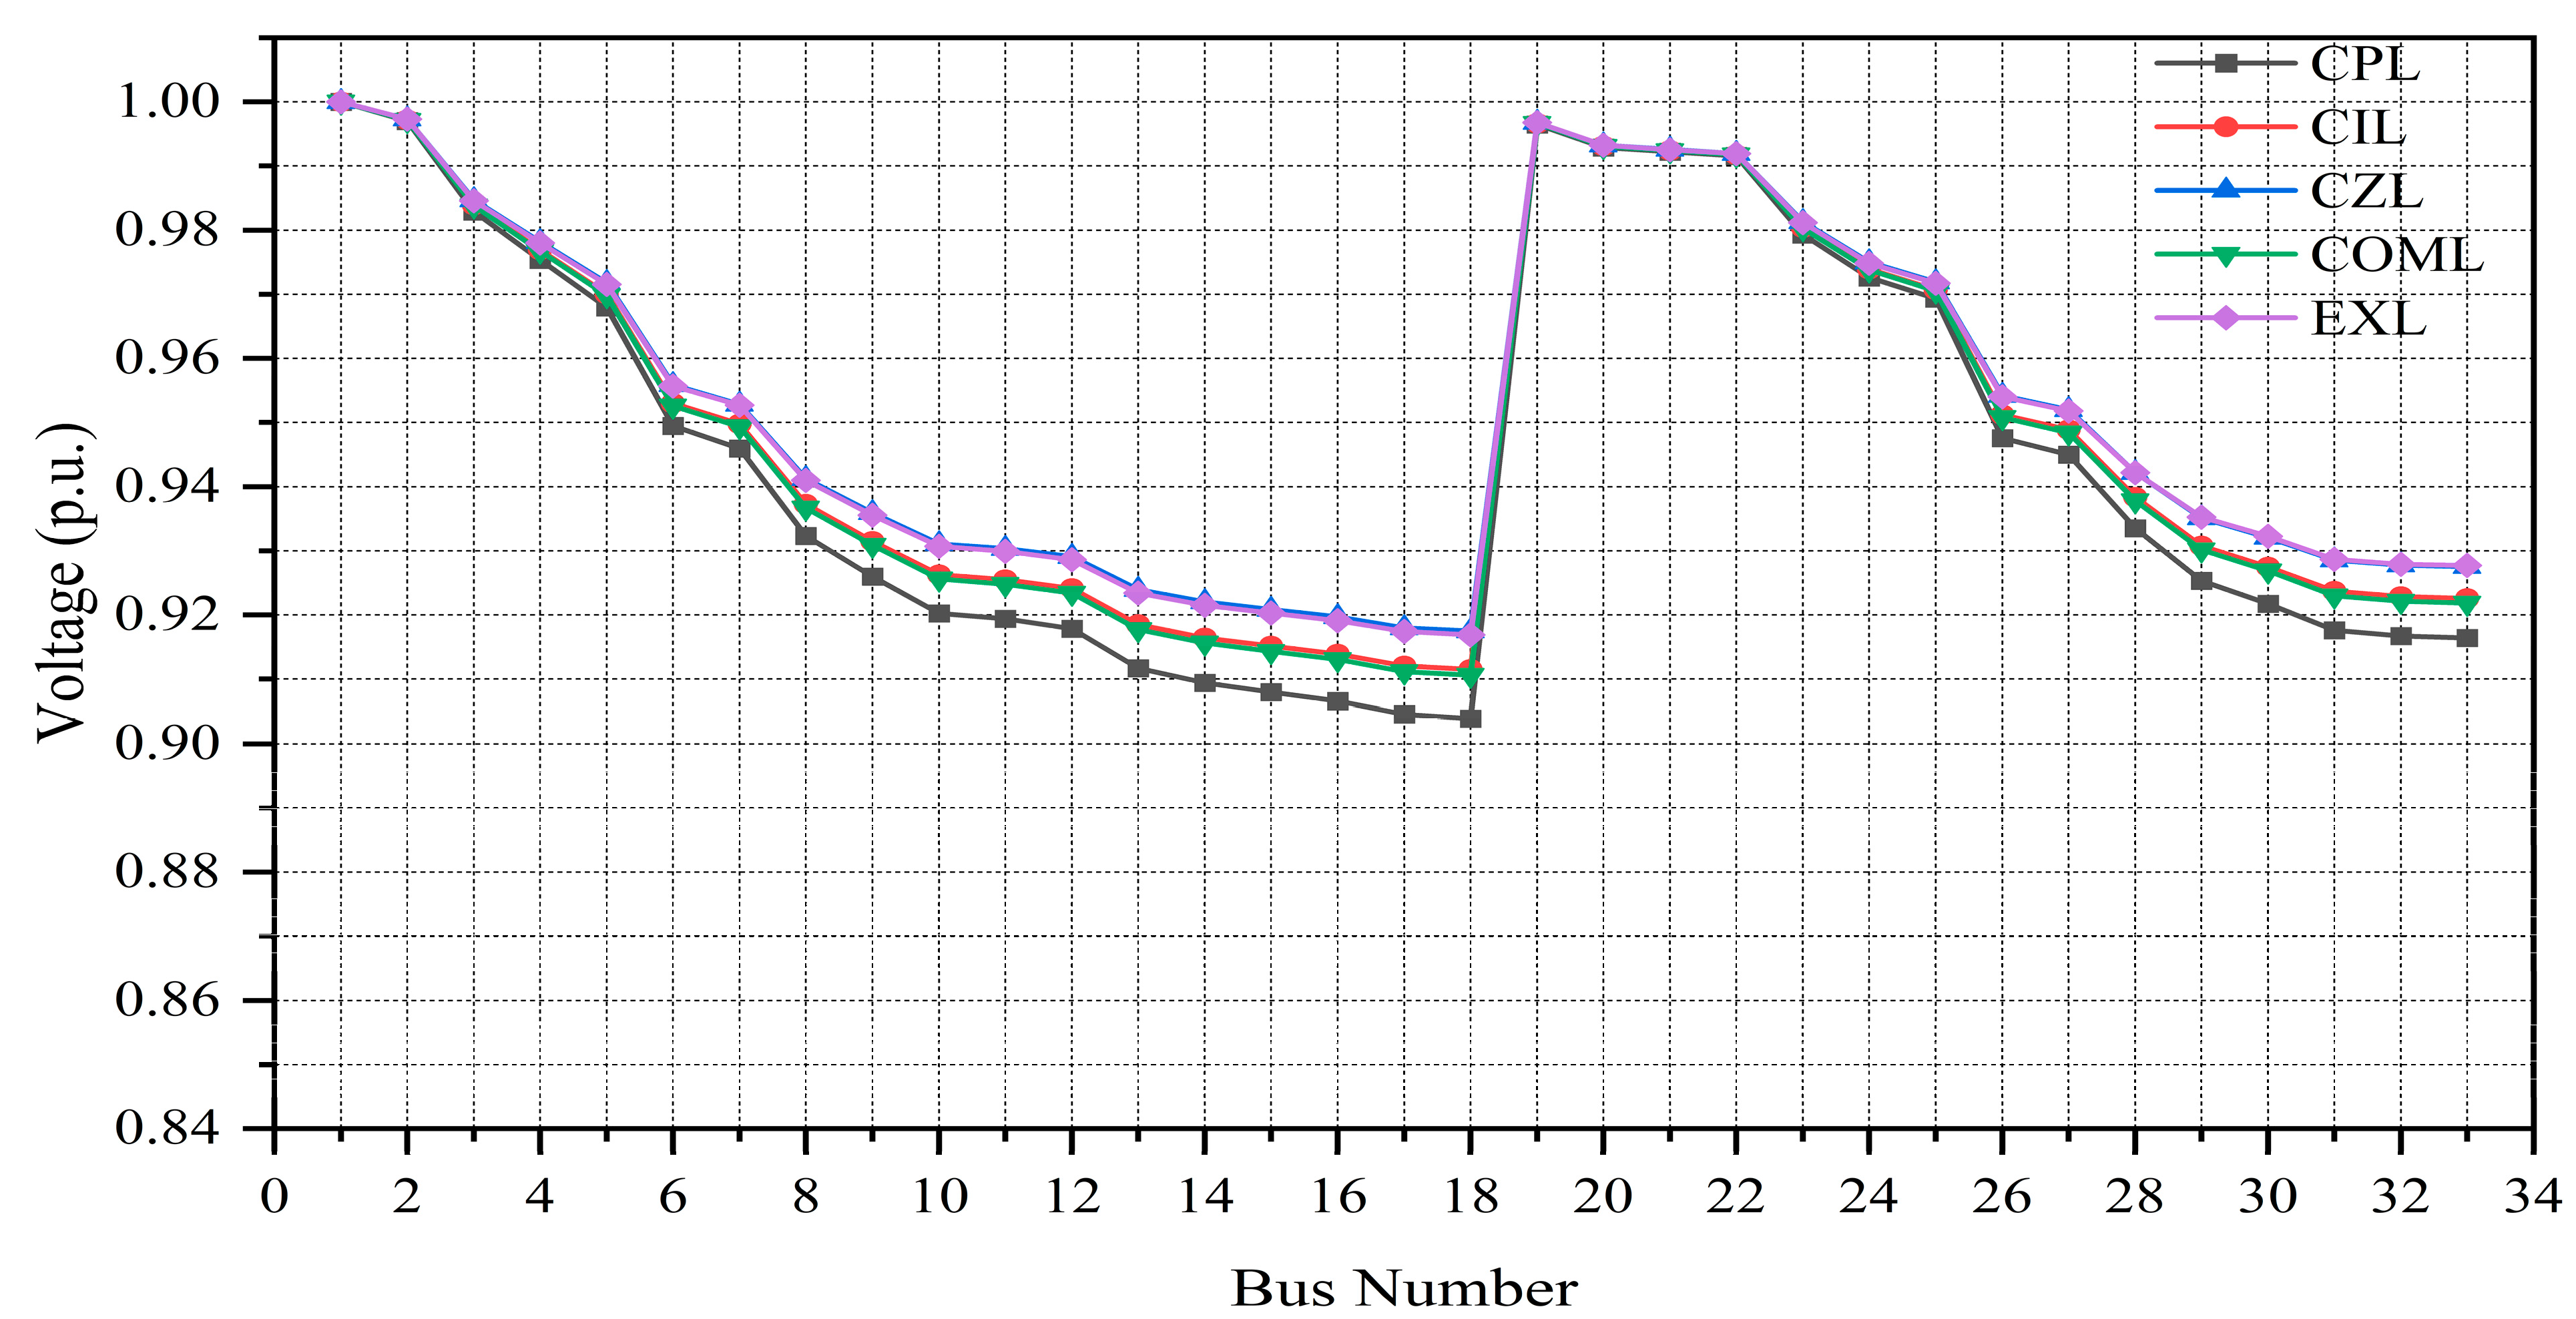
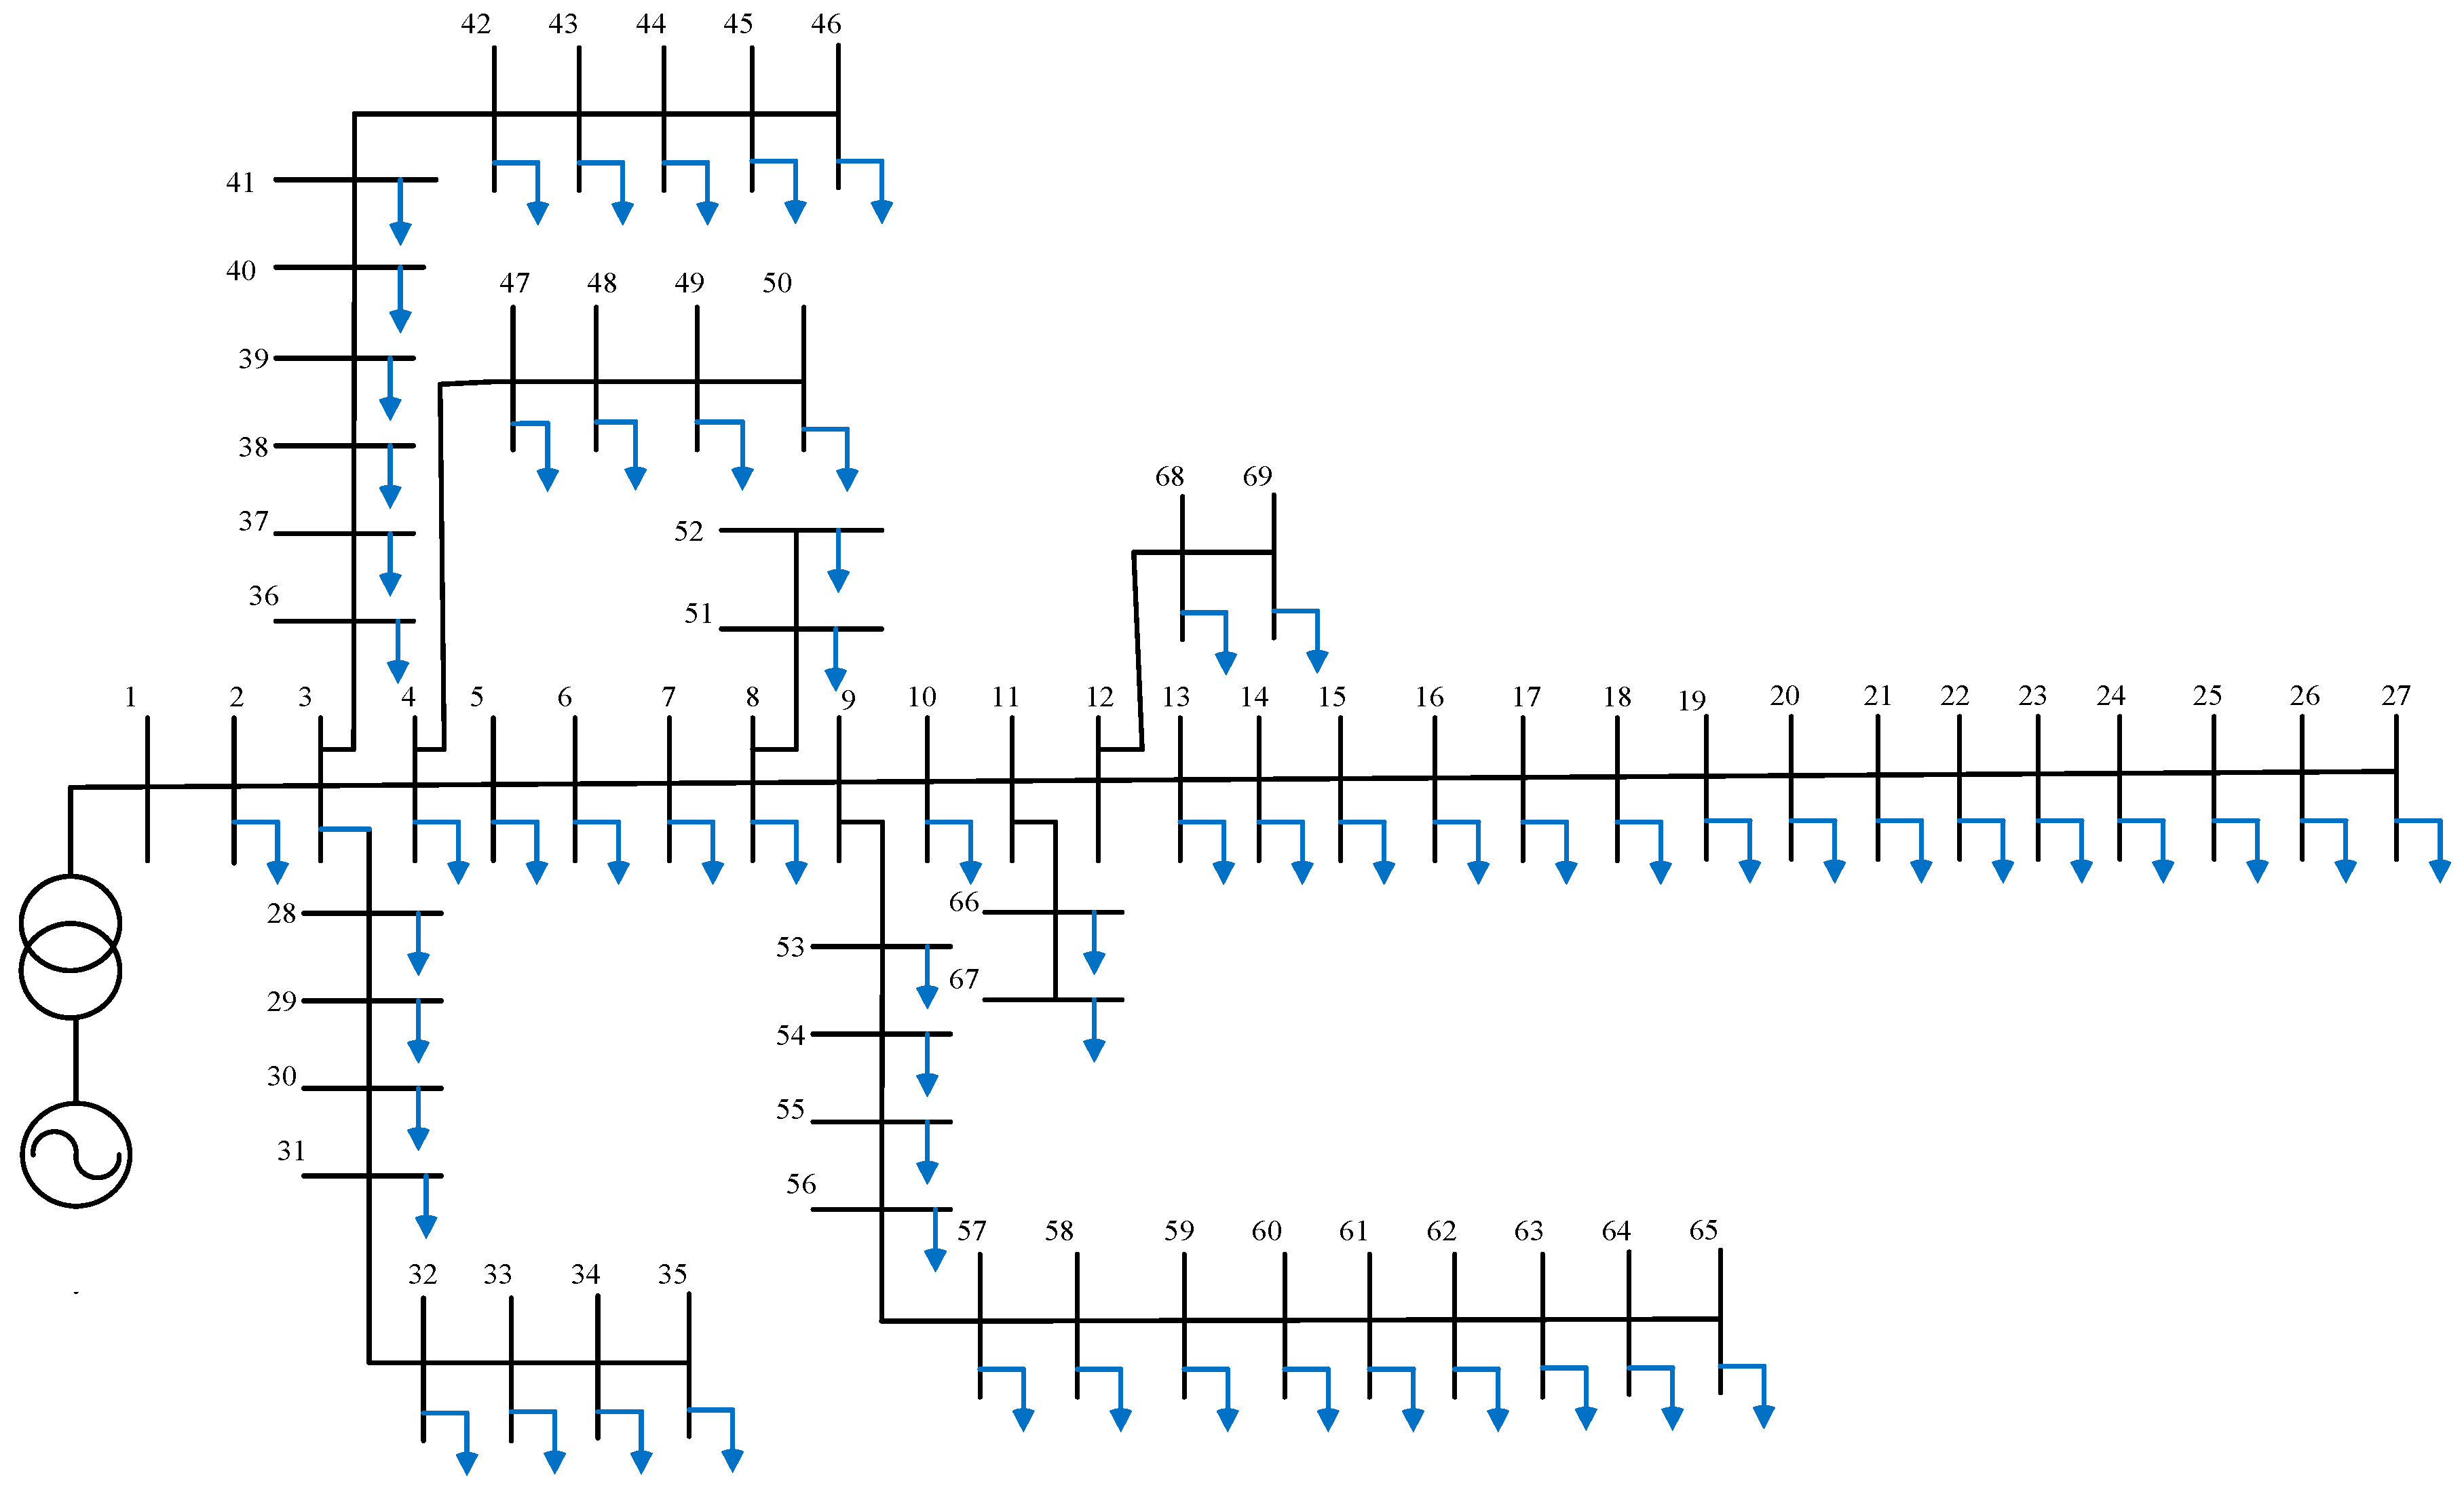
Figure 5 represents the procedures for contingency monitoring during different load operations. The evaluation of the indices is carried out on the IEEE 33-bus and IEEE 69-bus systems to assess their effectiveness and practical applicability as follows:
Scenario 1: In this scenario, the distribution system is evaluated under base-case loading conditions to examine the overall stability status of all nodes. Voltage stability indices are calculated to identify both strong and weak locations within the network. Since the system operates under normal conditions, the index values are expected to remain close to unity, signifying a stable operating state and a significant margin from the critical collapse point (index = 0). A node is considered more stable as its index approaches unity, whereas its proximity to zero indicates an increased risk of voltage collapse.
Scenario 2: This scenario evaluates the voltage stability of the distribution system by progressively increasing the load (active, reactive, or apparent power) at a selected node until it reaches its maximum permissible limit. The objective is to validate the capability of each index in identifying critical buses and predicting voltage collapse under stressed operating conditions. As the system loading approaches the critical threshold, the stability index is expected to decrease toward zero, indicating proximity to instability.
Figure 5 illustrates the contingency monitoring procedure under various loading scenarios. The following procedure is applied to assess the performance and practical applicability of stability indices using the IEEE 33-bus and IEEE 69-bus test systems.
- (1)
Enter the data for the radial power distribution system.
- (2)
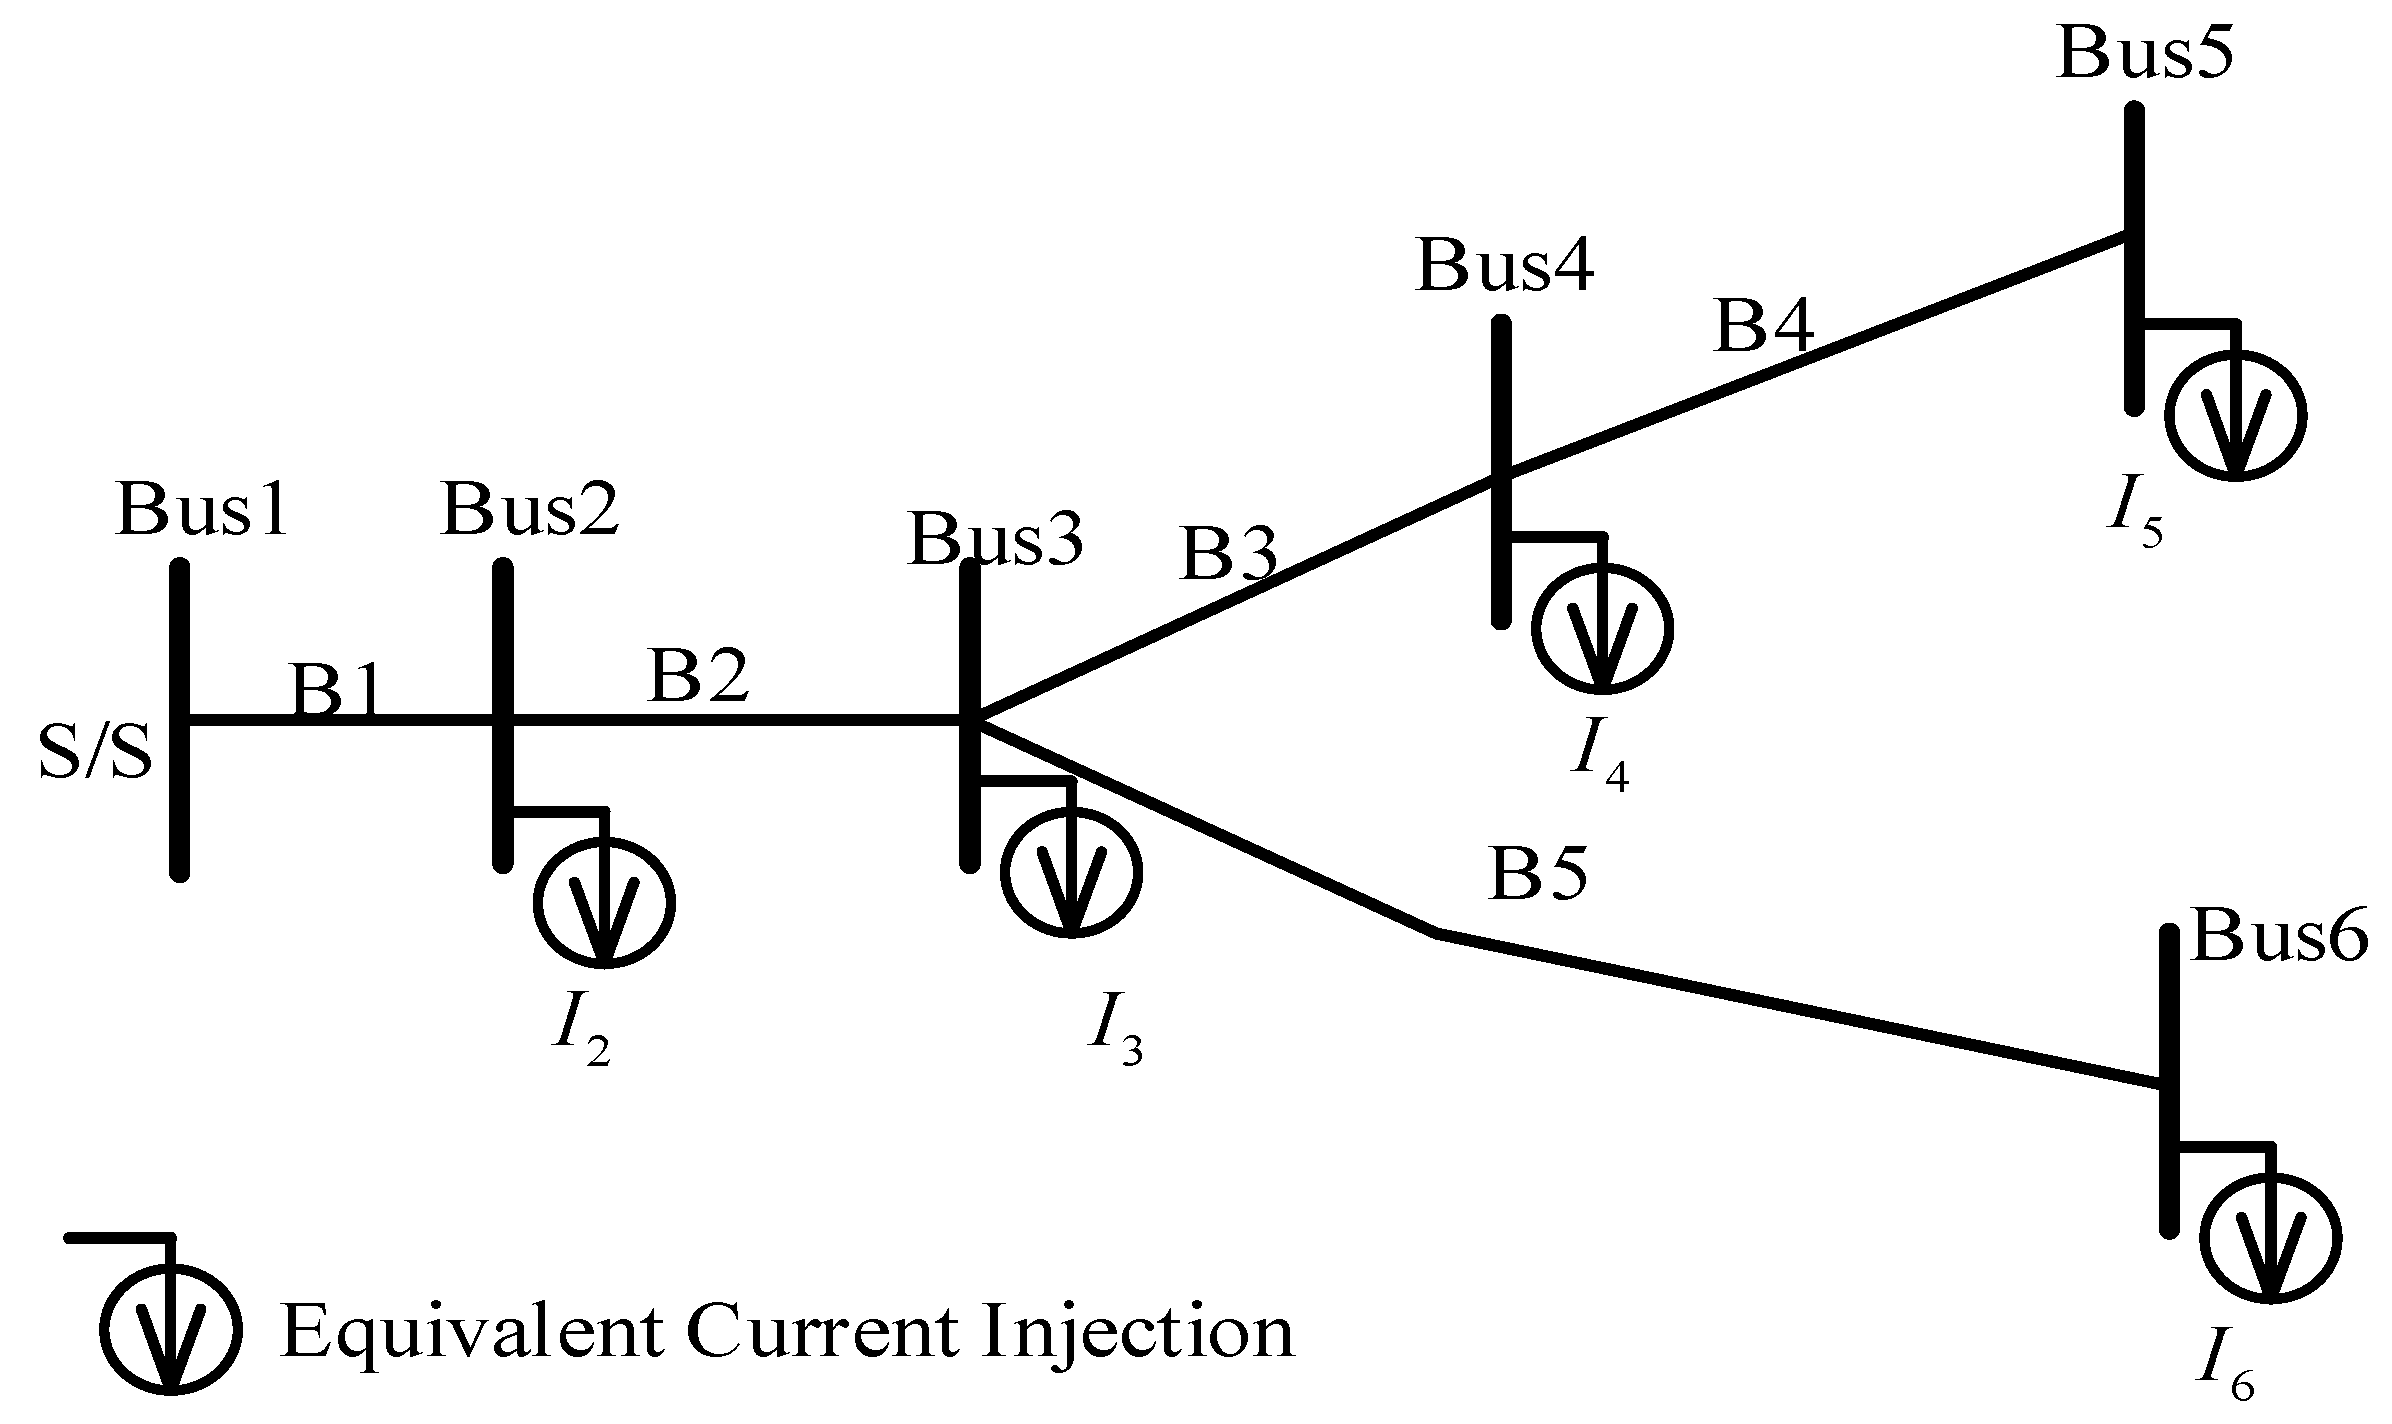
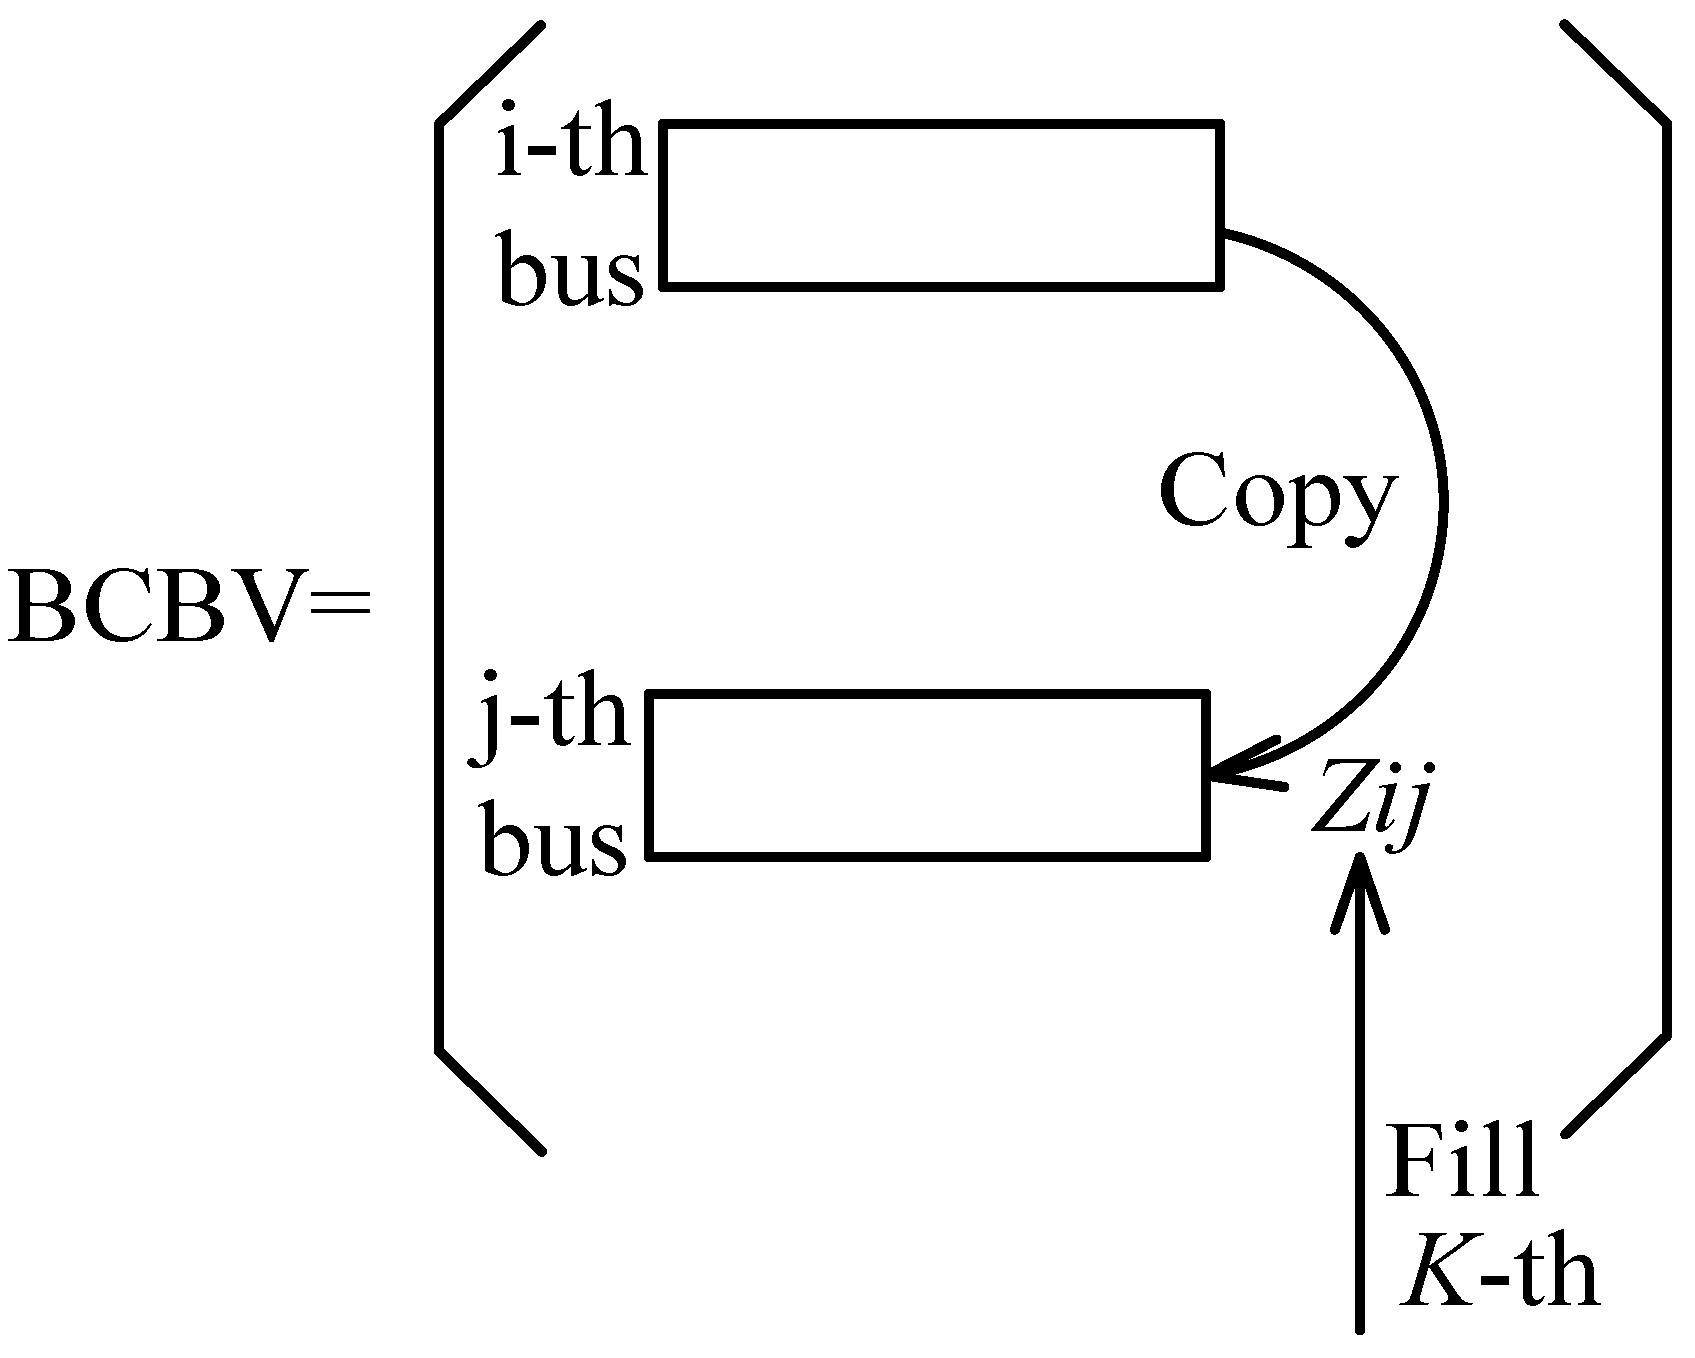
The Jen-HAO method, utilizing the BIBC and BCBV matrices, is employed to solve the power flow.
- (3)
Each index values are calculated during the base loading case to estimate the stability of the system.
- (4)
The maximum permissible load at each selected load bus, under different power factor conditions, is determined by gradually increasing the load by
k% until the power flow solution diverges or the index value approaches the stability limit (0.0). In
Figure 5,
λ represents the load under base-case conditions, while
λₘₐₓ denotes the maximum allowable loading level. At base-case loading, the index values are close to 1.0, indicating a stable system condition. As the load increases, the index values decrease, and for the most critical bus, the index approaches zero or reaches zero when the load attains its maximum level (
λ =
λₘₐₓ). Beyond this point, any additional load causes the power flow to diverge, signifying system instability.
- (5)
When the load goes above the limit, the solution doesn’t converge. In this instance, the voltage collapse point can be determined by reducing the load by a certain quantity.
- (6)
As the load increases, the index gradually decreases from one to zero, reaching the stability limit.
- (7)
Determine the buses associated with the smallest stability index values, as these indicate the most critical nodes in the network.
- (8)
For alternative likely load scenarios, choose a different load bus and execute steps 1 through 7 again.
- (9)
For alternative loading scenarios, a different load bus is selected, and steps 1 through 7 are repeated. Step 4, in particular, offers a systematic approach for determining the maximum loadability of each bus. Even when the system operates near the voltage collapse point, the high-performance index demonstrates strong capability in accurately monitoring and assessing the risk of voltage instability.
- (10)
Compare the well-known stability indicators (
SI [
32],
SI [
33],
SI [
34], and
NDVSI [
36]) and repeat all the procedures mentioned above in multiple cases for verification.
Scenario 3: This scenario evaluates the system’s loading margin (in MVA) by uniformly increasing both active and reactive power across all load buses. The loading process begins from the base level (
λ) and increases incrementally according to
λ =
λ(1 + k) until it reaches the maximum loading point (
λ =
λₘₐₓ). The procedure follows steps similar to those described in Scenario 2; however, unlike Scenario 2, where the load is increased at a single node, Scenario 3 applies the load increment simultaneously at all load buses. The process continues until the index approaches zero or the power flow solution fails to converge. The loading margin (
Smargin) is then computed as the difference between the base-case loading (
λ) and the maximum permissible loading (
λ =
λₘₐₓ), and it is expressed as:
