1. Introduction
Generation, transmission, and distribution of energy in a power system require high levels of flexibility, reliability, and security [
1]. However, increasing demand and the inclusion of variable energy sources alter these conditions, generating overload risks that affect transformers, transmission lines, and the system’s transmission capacity [
2]. The growing demand may exceed the transfer capacity between transmission and distribution systems, requiring continuous attention to operational security and a suitable balance between generation and consumption [
3]. Furthermore, risks such as load disconnect during n-1 contingency scenarios affect network stability, which was initially designed for a single load scenario, leading to failures, interruptions, and voltage variation problems [
4].
Another issue in power systems is the considerable distance between power sources and demand centers, which results in energy and financial losses. Furthermore, the extended distances between generation and consumption sites, the outdated nature of the power system’s components, and increasing electricity demand have intensified the challenges in energy quality [
5]. The expansion of power systems through new substations and lines improves their performance but faces challenges due to high costs, long timelines, and delayed return on investment [
6]. In addition, limited access to natural areas and environmental restrictions increase indirect project costs. Given these challenges, Flexible Alternate Current Transmission Systems (FACTS) have emerged as an efficient solution [
7]. They allow flexible management in response to demand variations and contingencies, optimize Electrical Power System (EPS) operation through instant reactive power injection, and improve stability and transfer capacity [
8,
9].
The scientific literature reports on the use of FACTS devices to optimize the operation of EPSs, particularly in networks with a high penetration of renewable energy sources. In [
10], the authors indicate that FACTS improve network efficiency through reactive power compensation, noting that optimal location in transmission and distribution reduces power losses and stabilizes voltage. In [
11], the impact of devices such as Static VAR Compensators (SVCs) and Unified Power Flow Controllers (UPFCs) on energy stability in renewable networks is examined, highlighting voltage, frequency regulation, and power flow as key aspects for efficient integration.
Other studies have compared FACTS devices to improve electrical network stability. In [
12], the use of Static Synchronous Compensators (STATCOMs) and SVCs is investigated, noting that the former provides better results of dynamic stability, emphasizing the importance of selecting specific devices to optimize transmission networks. In [
9], the use of STATCOMs and SVCs in distributed generation networks is studied. Both help mitigate voltage variations and improve the voltage profile, which is essential in advanced networks with high renewable integration. Some approaches rely on the optimal placement of FACTS devices using metaheuristic algorithms. In [
13], the Artificial Bee Colony (ABC) algorithm is used to locate devices such as SVCs, Thyristor-Controlled Series Capacitors (TCSCs), STATCOMs, and Static Synchronous Series Compensators (SSSCs), highlighting SSSCs for their ability to stabilize power flow and reduce transmission losses. In [
14], the Chaos Game Optimization (CGO) algorithm in IEEE 30-node networks is applied to optimize the power flow. This demonstrates that CGO outperforms other methods by reducing costs and losses in networks with high levels of renewable energy integration.
Specific FACTS applications have also effectively mitigated operational faults in electrical networks. In [
15], FACTS in the National Interconnected Electrical System of the Dominican Republic are implemented, using UPFCs, STATCOMs, SVCs, and TCSCs in simulations that show their effectiveness in isolated and smaller-scale networks. In [
16], fault location methods in FACTS-based systems are investigated using traveling waves in devices such as STATCOMs and UPFCs, noting that, despite higher costs, these methods offer greater accuracy than impedance-based methods. In [
17], the effectiveness of concentrated versus distributed reactive power compensation in enhancing the power factor at the point of common coupling is analyzed, focusing specifically on industrial power systems. Unlike Transmission Systems (TSs), which prioritize reliability and stability of the grid in large areas with multiple generation sources [
18], industrial power systems are typically high-demand facilities sensitive to power quality [
19]. These operational differences have a significant impact on the performance of reactive power compensation devices, particularly in terms of reactive power management, fault tolerance, and voltage regulation.
Among FACTS devices, SVCs stand out for their voltage regulation and reactive power stabilization capabilities in electrical networks, achieved by injecting or absorbing reactive power in real time. This feature is crucial in networks with variable load and intermittent generation, such as those with a high penetration of renewable energy [
20]. Compared to other FACTS devices, SVCs offer rapid response and high reliability, positioning them as a key tool to improve network stability and reduce transmission losses without requiring costly expansions [
21].
Several studies have examined various aspects of reactive power compensation, grid flexibility, and optimal allocation of FACTS devices in electrical systems in Colombia. For instance, [
5] analyzed the structural configuration of microgrids in distribution networks, while [
22] developed a convex optimization model for FACTS placement without operational validation. Other contributions focus on global trends in data collection and control needs [
23], metaheuristic-based optimization [
11], or the validation of SVCs in medium-voltage substations [
24,
25]. Ref. [
26] explores long-term HVDC strategies for the national grid. However, none of these studies evaluate the operational impact of centralized and distributed SVCs in a high-voltage Colombian TS under real constraints.
The present study addresses this gap through a system-level analysis based on historical demand and realistic compensation scenarios, providing practical evidence to inform planning decisions in regions with infrastructure limitations.
The studies analyzed the role of FACTS in modernizing electrical networks by enhancing efficiency and stability through reactive power compensation strategies and voltage stabilization. However, there is a lack of comprehensive evaluations of FACTS, particularly SVCs, as an integrated solution to optimize power factors, regulate voltage, reduce overloads, and minimize losses in TSs. Additionally, comparisons between centralized and distributed SVCs within TSs are lacking.
This paper compares centralized and distributed SVC installations, addressing operational challenges in a TS with overloads, low voltages, and power losses. To address these issues without incurring high expansion costs, an SVC is proposed as a reactive compensation mechanism, and its impact on system stability is analyzed under high-demand conditions. The analysis is conducted through simulations in the DigSilent Power Factory software, evaluating reactive compensation scenarios and comparing centralized and distributed SVC configurations at nodes close to loads. This study offers a potential solution for enhancing the infrastructure of limited electrical systems, such as Colombia’s.
The contributions of this study are as follows:
A comparison of centralized and distributed SVCs is performed based on voltage regulation and overload reduction to determine the most efficient configuration that can increase network stability.
A comprehensive evaluation of the effect of SVCs on power factor, voltage variation, overloads, and power losses is presented, which is lacking in previous studies.
A practical and applicable solution is offered to improve the stability in networks with expansion limitations.
A context-specific contribution is provided by applying and validating the methodology in a regional TS that is part of the Colombian electric grid, thereby addressing local planning needs and reinforcing the applicability of distributed compensation in national infrastructure development.
This study is relevant because it proposes using SVCs to improve operational reliability and efficiency without expanding the infrastructure, providing an economical alternative to investments in physical network expansion.
2. Materials and Methods
This section presents the methodology used in this study, which was developed using the following steps:
- 1.
Description of the TS under study.
- 2.
Evaluation of the TS in its initial condition.
- 3.
Definition of compensation scenarios.
- 4.
Evaluation of the TS under compensation conditions.
2.1. Description of the TS Under Study
In the first step, a single-line diagram of the TS under study is presented, along with the types of elements, their total quantity, and their distribution according to voltage level. This TS is located in the Caribbean region of Colombia, a territory historically affected by operational issues in the electricity service, including frequent interruptions, high technical losses, and overloads in key infrastructure elements. These conditions result from the combination of growing demand, limited infrastructure investment, and long distances between generation and consumption centers [
27].
2.2. Evaluation of the TS
The TS model, in its initial condition, was developed using the DigSilent Power Factory software. First, technical information on the elements that constitute the electrical system is collected, which is necessary to establish the baseline operating conditions.
Table 1 presents the parameters required to adequately represent the model, including buses, transformers, lines, loads, and network equivalents.
Next, the load nodes are characterized to estimate the local power compensation. A one-year observation window is considered, from which extreme demand values are identified.
Figure 1 shows the maximum and minimum apparent powers recorded during the 87 h at a node. The analysis is based on 1% of the historical data provided by the system. It allows for estimating the values of active power (P), reactive power (Q), apparent power (S), and power factor (PF) at each node.
The TS is simulated under a maximum demand regime, using historical data from 2018. To adequately represent system conditions, the following considerations are adopted:
Generator contributions are limited to their reactive power capacity.
Loads are modeled as constant powers.
The transformer TAPs are adjusted to their nominal state.
Active power is constant and is supplied through the grid equivalent.
Subsequently, a power flow study is conducted to identify the compensation and transfer capacity required in the most critical scenario, without considering the participation of generating plants. In this context, the external power values correspond to the sum of the load demand and electrical losses in the grid. In this stage, inductive or capacitive compensation devices are not included. Likewise, the negative signs in the line power allow for determining the flow direction (inflow or outflow) in the transmission elements.
The analysis results are organized into three main areas: load capacity, voltage regulation, and power flow.
Table 2 summarizes the information evaluated and its application in system diagnosis. This analysis identifies overloaded elements, technical losses, and nodes requiring compensation—all of which are essential for strengthening the flexibility and operational security of the power system.
This study identified elements with operational overloads that require priority attention. Although the nominal voltage levels established for the system are 13.8 kV, 18 kV, 34.5 kV, 110 kV, and 220 kV, the high number of active elements and the loading conditions lead to actual levels being lower than those assigned.
Finally, modal analysis is applied to identify nodes with voltage regulation problems. This technique enables the evaluation of the most severe operating conditions of the power system and proposes topological modifications to enhance the stability and performance of the TS.
2.3. Definition of Compensation Scenarios
Four compensation scenarios were established based on the results obtained from evaluating the TS in its initial condition and considering the limitations identified in terms of voltage regulation, technical losses, and load capacity. These scenarios incorporate SVC technology.
The proposed scenarios were defined based on two main criteria: the location of the SVC (centralized or distributed) and the connection voltage level. The following configurations were established:
Scenario 1 (centralized compensation 1): A single SVC connected to the reference bus (Slack).
Scenario 2 (centralized compensation 2): Installation of an SVC at node N4, corresponding to the voltage level of 220 kV.
Scenario 3 (centralized compensation 3): Installation of an SVC at node N20.
Scenario 4 (distributed compensation): Incorporation of multiple SVCs at central load nodes to decentralize compensation and address localized reactive needs.
Each of these scenarios aims to analyze and compare the impact of compensation strategies on the technical performance of the system, considering transfer capacity, voltage profile, and overload mitigation as indicators. To establish the reactive compensation requirements in each case, a technical criterion was adopted based on the minimum voltage stability limit, set at 0.72 pu. This threshold is supported by studies that analyze voltage behavior under contingency conditions. In [
28], it is observed that maintaining voltages above 0.72 pu ensures stable operation of wind-integrated systems and preserves LVRT performance during disturbances. Similarly, [
29] defined 0.70 pu as the critical minimum voltage but reported that post-disturbance voltages around 0.72 pu provide greater operational security. The study published in [
30] found that voltage drops to approximately 0.72 pu during severe faults in VSC-HVDC systems are still recoverable, validating this level as a stability margin. On the other hand, [
31] showed that lines associated with voltages below 0.72 pu often correlate with stressed conditions under the Modern Stability Assessment Index, supporting the selection of this threshold as an indicator of nodes at high risk of collapse.
From this threshold value and based on the power flow analysis without compensation devices, the total reactive power demand required to maintain voltage levels within the desired operating range (0.9–1.1 pu) was estimated. The reactive power to be supplied by the SVCs was calculated as the difference between this estimated demand and the reactive contribution of the uncompensated system, including technical losses associated with the transfer of reactive power under both loaded and no-load conditions.
In all cases, the SVCs were modeled as devices controlled by a thyristor using the "SVC Type 1" model available in DigSilent PowerFactory, which combines Thyristor-Controlled Reactors (TCRs) and Thyristor-Switched Capacitors (TSCs). The analysis was conducted under steady-state conditions, with SVCs implemented as PV nodes that regulate voltage through the exchange of reactive power.
The manuscript did not include dynamic simulations or fault analysis. The omission of transient analysis was a scope choice, aligned with the primary objective of comparing centralized and distributed SVC configurations under peak operational conditions. Studying the system under maximum demand is crucial, as it represents the most critical operational state, where voltage deviations, overloads, and power losses are most severe. The performance of compensation strategies under such conditions provides valuable insights into their effectiveness in ensuring system reliability and stability without infrastructure expansion [
10].
2.4. Evaluation of TS Under Compensation Conditions
In this step, the behavior of the TS is analyzed in different compensation scenarios to identify the strategy that provides the best operational performance in terms of transfer capacity, voltage profile, reduction in technical losses, and mitigation of overloads. The evaluation is performed through load flow simulations using the DigSilent Power Factory software, considering the four scenarios previously defined in
Section 2.3. In each scenario, an SVC configured with the following common technical characteristics is implemented:
The SVC connection node is modeled as a PV node, allowing the voltage level to be regulated by supplying or absorbing reactive power.
Operating limits for node voltage are defined between 0.9 and 1.1 pu, depending on the reactive power needs under conditions without generation.
The insertion of the SVC into the system is considered instantaneous, thus minimizing the transient impact on network elements.
In all scenarios, the active power exchanged by the SVC remains equal to zero, assuming purely reactive behavior.
The results obtained in each scenario are compared with the power system under uncompensated conditions, allowing for an assessment of the impact of SVCs on improving system performance. The analysis focuses on three main indicators:
Transfer capacity is determined by the increase in active power that can be supplied to the loads without compromising the operating limits of the power system.
Voltage profile: The voltage levels at each node are evaluated, identifying the reduction in deviations from the nominal values.
Loss and overload reduction: Technical losses on the lines are quantified, and elements operating above their rated capacity are identified.
2.5. Economic Assessment of Solutions
The economic analysis of the four reactive compensation strategies was conducted to quantify their financial viability using a life-cycle approach. This subsection outlines the data sources, assumptions, and calculation steps used to determine the capital expenditure (CAPEX), Operating Expenditure (OPEX), energy savings, and payback period (PBP) for each scenario.
The assessment considers four configurations: centralized SVCs installed at the Slack node, node N4, and node N20, as well as a distributed SVC scheme located at the load nodes. Each configuration is evaluated based on the amount of installed reactive compensation capacity and its technical impact on system losses.
The procedure adopted is as follows:
3. Results and Analysis
This section presents the power system test case used in the research, the results obtained by applying the method based on the installation of SVCs, and an analysis of the results.
3.1. Description of the TS Under Study
Figure 2 shows the TS study case, which includes subtransmission lines, transformers, power sources, compensators, and loads; where G are the generators, N are the nodes, L are the loads, and T are the transformers of the TS.
In
Figure 2, the equivalent network connected at bus N3 represents the interface with the external grid. It is modeled as a balanced three-phase voltage source with a fixed magnitude and phase angle, corresponding to a Thevenin equivalent that includes internal impedance and provides boundary conditions during the load flow analysis.
All generators are modeled as PV nodes, regulating voltage within specified operational limits. Each unit has a defined active power output and reactive power capability bounds, enabling the simulation of voltage control effects at generation buses under steady-state conditions.
Transformers are modeled as two-winding units with nominal voltage levels of 220/110 kV, 110/34.5 kV, and 34.5/13.8 kV. Their models include winding resistance and leakage reactance; tap changers are not considered in this study.
Transmission and subtransmission lines are represented using equivalent -sections with typical positive sequence impedance values, derived from standard conductor types and average line lengths. The analysis is limited to balanced steady-state conditions, so only positive sequence components are considered.
Table 3 presents the TS elements and the number of elements according to the voltage level.
3.2. Evaluation of the TS in Its Initial Condition
The load flow results are presented in
Table 4.
Table 4 presents the load flow results under uncompensated conditions, based on a maximum demand scenario. The network equivalent represents the total active and reactive power supplied by the external grid model, while the
load row reflects the power demand of the system.
Network losses refer to active power dissipation within the system. The
reactive power exchange quantifies the total reactive power circulating through the system’s lines and components due to magnetizing effects and line charging, which, although non-dissipative, impact voltage regulation and stability. The
reactive power deficit indicates the shortfall of reactive support (–44 MVAr), highlighting the system’s need for compensation to maintain voltages within acceptable limits. The power factor of 0.91 reflects overall system efficiency.
SVC compensation values are set to zero at this stage, as no reactive devices are connected in the base case.
The results of the power flow study showed that the TS had the following initial conditions:
A total of 98 elements were overloaded, of which 27 exceeded 125% of their nominal capacity (based on a reference value of 100 MVA for power transformers).
The voltage drop is between 0.71 pu and 0.94 pu
The power losses are 32 MW with an excess reactive power circulating through the system of 231 MVAr.
To provide a more detailed insight into the basis for node selection,
Table 5 presents the uncompensated condition results for the most critical buses. These nodes exhibit significant voltage deviations and overload levels exceeding 100%, justifying their consideration in the compensation scenarios.
Based on the load flow analysis of the TS, a critical scenario was identified, characterized by a high number of overloaded elements, voltage sags, and significant power losses. For the centralized compensation scenarios (Scenarios 1, 2, and 3), an SVC of 600 MVAr was proposed and calculated as the difference between the total reactive power demand of the system under uncompensated conditions (655 MVAr) and the effective reactive contribution of the system. This value aims to ensure the ability to raise the voltage profile within the desired operating range (0.9–1.1 pu), improve the transfer capacity, and reduce the incidence of overloads.
In contrast, scenario 4 considers a distributed compensation strategy across the load nodes. In this case, a compensation capacity of 437 MVAr is estimated using SVCs, calculated from the aggregate reactive demand at each node. This allows for a more efficient reactive power allocation based on local system needs.
The selection of SVC placement nodes was based on the severity of the technical conditions observed in the uncompensated scenario, considering overload indicators, voltage deviations, and network topology. The following nodes were selected for evaluation:
Slack node (Scenario 1): Represents the main connection point to the external power source. The installation of a centralized SVC here provides global reactive support; however, simulation results revealed high losses due to the long transmission paths required to reach critical load nodes.
Node N4—220 kV (Scenario 2): Located upstream of multiple demand clusters, N4 was selected to assess the effects of centralized compensation closer to the system backbone. While this scenario achieved improvements over the Slack-based installation, its effectiveness remained limited by its relative distance from critical nodes.
Node N20—220 kV (Scenario 3): This node lies in proximity to the most stressed region of the network, where numerous elements exceed 125% of their rated capacity and voltages fall below acceptable thresholds. Compensation at N20 yielded the best performance among the centralized options in terms of voltage recovery and loss reduction.
Load nodes (Scenario 4): This distributed strategy places SVCs directly at or near nodes with the highest reactive demand and poorest voltage profiles, such as N52, N53, N54, and N51. By compensating locally, this approach minimizes reactive power circulation across the system, reduces technical losses, and improves nodal voltage profiles while requiring a lower total compensation capacity.
These four configurations aim to compare centralized and distributed SVC strategies under the same peak operating conditions, highlighting their respective impacts on the system efficiency, voltage stability, and loadability.
3.3. Evaluation of TS Under Compensation Conditions
Table 6 presents a comparative summary of the results obtained in the four compensation scenarios analyzed in this study. For each case, the active, reactive, and apparent power values at the external source, the loads, and the power losses in the network are reported, as well as the line load, the power factor, and the magnitude of the applied capacitive compensation.
Table 6 shows that the best scenario corresponds to the location of the SVCs distributed in the load nodes since it is the one that presents the lowest total losses in the network: 20.36 MW and 125.06 MVAr, compared to the centralized compensation scenarios, where the losses reach up to 32.26 MW and 231.54 MVAr (Slack). Furthermore, a lower total reactive compensation capacity is required in this distributed scenario, equivalent to −437 MVAr, compared to the 600 MVAr required in each centralized scenario. These results reflect a better transfer capacity (with apparent power supplied from an external source of 980.37 MVA) and greater stability in the voltage levels, maintaining a constant power factor of 0.91.
Figure 3 shows the behavior of the voltage variation in the TS nodes without compensation and with distributed compensation using the SVC.
Figure 3 shows that in the absence of compensation, several nodes present voltages significantly below the minimum operating threshold, with values close to 0.71 pu at node N52 (13.8 kV level) and 0.72 pu at N51 (34.5 kV level). These values reflect severe voltage regulation problems and critical operating conditions. Abrupt drops are also observed at nodes such as N19 and N55, where voltages drop below 0.75 pu, compromising system stability and potentially affecting the safe operation of connected equipment.
In contrast, implementing distributed compensation with an SVC substantially improves the voltage profile at all nodes, raising values above 0.92 pu even at the most critical points (N52, N53, N54, and N51). The voltage at node N37 reaches 0.96 pu, and at node N20, it stabilizes at 0.94 pu, demonstrating a recovery in electrical performance across the different voltage levels of the system (13.8 kV, 34.5 kV, 110 kV, and 220 kV).
Table 7 presents the loadability distribution of the active elements of the TS, comparing the scenarios without compensation and with distributed compensation using an SVC. The information is organized according to loadability ranges (50–75%, 75.1–100%, 100.1–125%, and >125%) and voltage levels (13.8 kV, 34.5 kV, 110 kV, and 220 kV). For each combination, the number of transformers, lines, and total elements (TE) operating within that range are shown, both under base conditions and with an SVC, in addition to the difference between the two cases.
The results in
Table 7 demonstrate a significant improvement in the operating conditions of the system elements following the implementation of distributed reactive compensation. For example, in the critical overload range above 125%, the total number of overloaded elements is significantly reduced from 27 to 12, with a difference of up to −9 elements at 34.5 kV, indicating a significant reduction in thermal stress on the network. In the intermediate range of 100.1–125%, the total elements also decrease from 23 to 18, improving the operational safety margin.
In addition, an increase is observed in the number of elements operating under moderate conditions (50–75%), indicating a more balanced load redistribution. For example, at 13.8 kV, the number of transformers increased from 3 to 8 within this range, reflecting a relief from extreme operating conditions. The overall positive difference in this category suggests that compensation helps maintain equipment within acceptable operating margins, thereby reducing the likelihood of failures associated with prolonged overloads.
These results demonstrate that the use of distributed SVCs improves the voltage profile, as evidenced in the previous graphs, optimizes load distribution, reduces the number of critically overloaded elements, and enhances thermal stability under peak demand conditions in the power system.
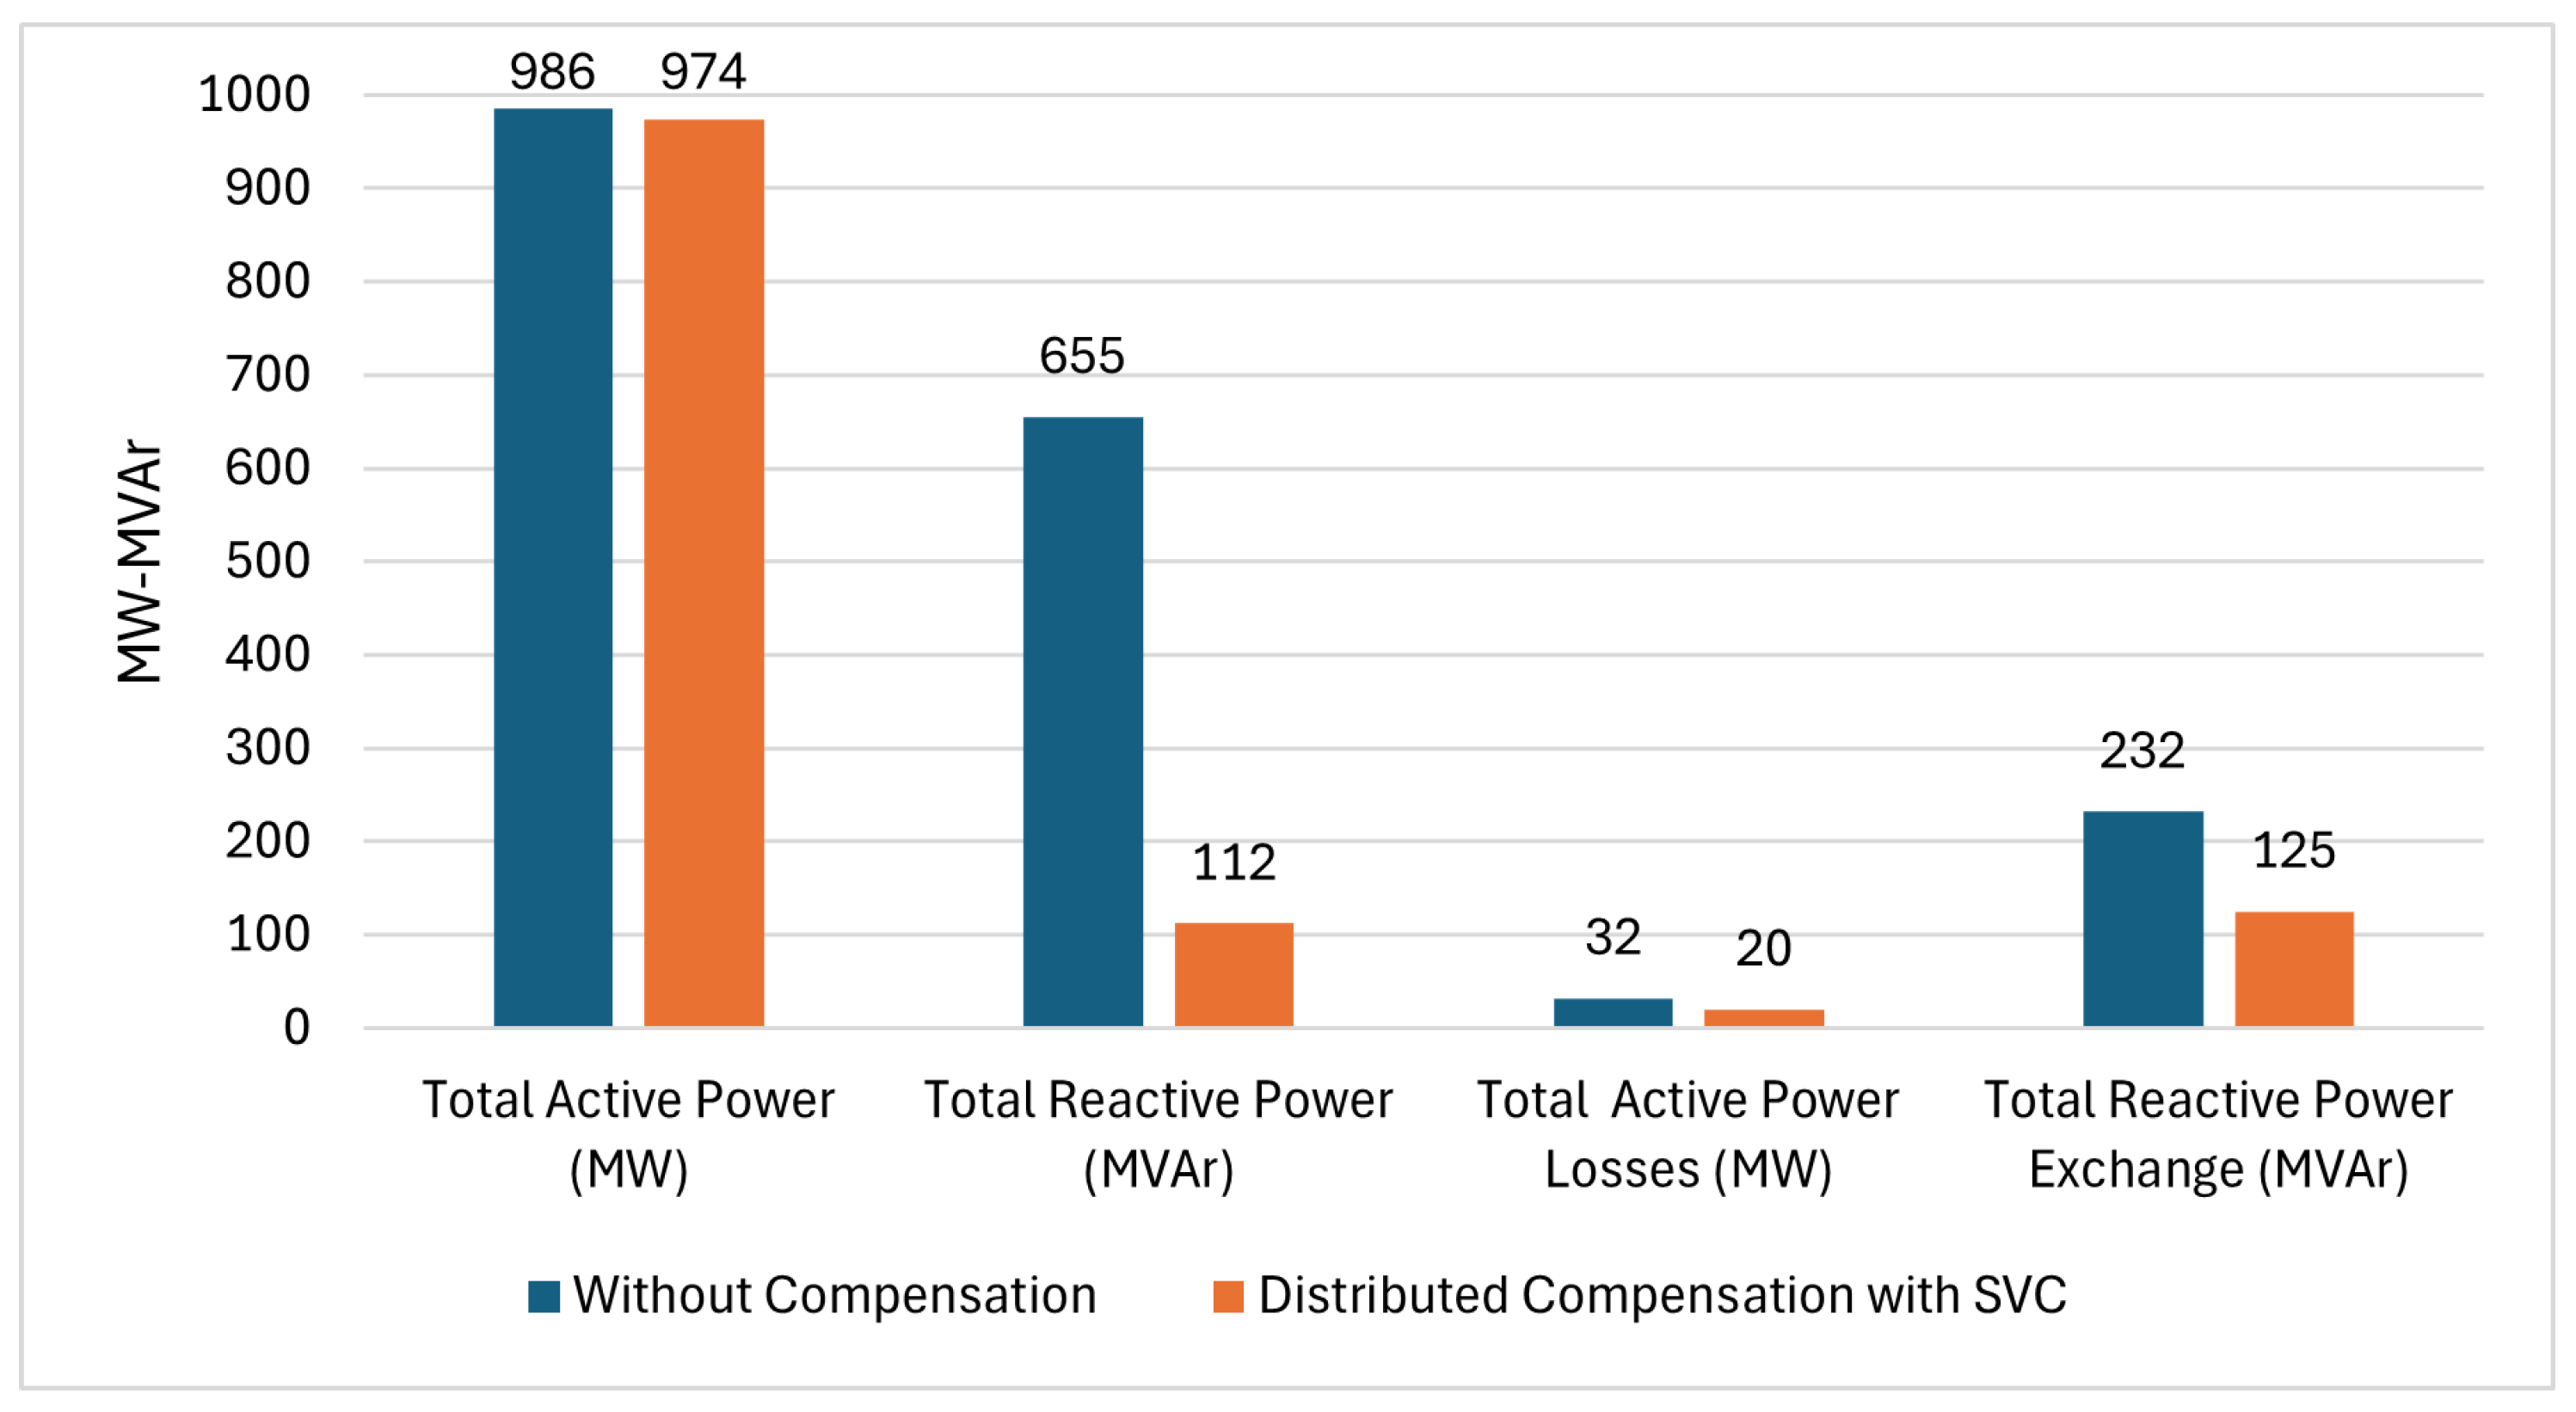
Figure 4 presents the comparative results of the load flow in the TS without compensation devices and with distributed compensation using SVCs located near the loads. The figure groups four analyses: total active power, total reactive power, active power losses, and system reactive power losses.
Figure 4 shows that the total active power supplied by the external source decreases from 986 MW in the uncompensated condition to 974 MW in the distributed compensation scenario. This 12 MW reduction represents a 1.2% improvement, associated with greater system efficiency, implying a lower power requirement to meet the same demand.
The results show a significant improvement in the total reactive power. In the scenario without compensation, the system requires 655 MVAr, whereas with the implementation of distributed SVCs, this value decreases to 112 MVAr. This difference of 543 MVAr corresponds to a reduction of 82.9%, indicating that the local supply of reactive power by SVCs substantially alleviates the load on the TS.
Regarding the active power losses, a decrease from 32 MW to 20 MW is reported, representing a 37.5% improvement. This performance confirms that the distributed compensation strategy reduces the technical losses caused by active power transmission through overloaded or sub-optimally loaded lines.
The reactive power losses also improve, going from 232 MVAr without compensation to 125 MVAr with distributed SVCs. This reduction of 107 MVAr is equivalent to a 46.1% improvement, consistent with the decrease in reactive power flow in the grid owing to the local supply provided by the compensators.
The results in
Figure 4 confirm the technical effectiveness of distributed compensation in improving the operational efficiency of the TS by reducing both active and reactive power flows and losses, maintaining supply capacity without compromising system stability.
The results confirm that distributed solutions, such as localized reactive generation and compensation, offer technical advantages over centralized approaches in terms of efficiency and stability. This superiority is based on reducing Joule losses, as locating resources close to the loads reduces both current and technical losses. Furthermore, these solutions improve the voltage profile at the terminal nodes, reduce the overloading of upstream elements, and strengthen the stability and resilience to the contingencies of the power system [
34,
35].
3.4. Results of the Economic Assessment
Table 8 presents the leading economic indicators for each compensation configuration, including the installed reactive capacity, capital expenditure (CAPEX), reduction in active power losses (
), annual energy savings, estimated monetary benefit, and the simple payback period.
Among the alternatives evaluated, the distributed compensation strategy emerges as the most economically favorable. Despite requiring 27% less reactive capacity than any centralized configuration (437 MVAr vs. 600 MVAr), it yields the highest reduction in active power losses (12 MW), corresponding to 36 GWh·yr−1 in energy savings. At a spot price of USD·kWh−1 0.165, this represents an annual benefit of USD 5.94 million. The resulting simple payback period is 7.4 years, which is nearly half that of the most favorable centralized alternative (Node N20, 13.5 years).
Beyond direct monetary savings, broader system-level benefits further support the economic attractiveness of the distributed scheme. Specifically, the strategy reduces the system-wide reactive power demand by 543 MVAr and cuts reactive power exchange through transmission corridors by 107 MVAr. These improvements mitigate voltage deviations, relieve stress on critical infrastructure, and release capacity for future demand growth. Economically, these benefits translate into deferred investments in network reinforcements, such as the postponement of a 15 km, 220 kV double-circuit transmission line, valued at approximately USD 15 million.
3.5. Future Work and Research Perspectives
This study focused exclusively on the steady-state evaluation of centralized and distributed SVC configurations under maximum load conditions. However, dynamic aspects such as transient stability, voltage recovery, and fault ride-through performance are also critical for ensuring system resilience under contingency scenarios. Therefore, future research will incorporate dynamic simulations in DIgSILENT PowerFactory to assess the time-domain response of the SVCs, particularly under faults, switching events, and voltage sags. These extensions will enable a more comprehensive evaluation of compensation strategies and support informed decision-making in operational and protection planning.
Additionally, upcoming work will explore the integration of other FACTS devices—such as STATCOMs and TCSCs—to benchmark their performance under identical network conditions. These studies will provide valuable insights for technology selection, considering both technical behavior and implementation costs.
4. Conclusions
The results of this study confirm that the incorporation of Static Var Compensators (SVCs) significantly improves both the technical and economic performance of TSs. Among the compensation strategies analyzed, the distributed configuration based on the installation of SVCs at load nodes proved to be the most effective. Technically, this strategy achieved a 37.5% reduction in active power losses (from 32 MW to 20 MW) and a 46.1% decrease in reactive power losses (from 232 MVAr to 125 MVAr). These substantial improvements confirm the efficiency of decentralized reactive power support.
Additionally, the distributed strategy improved the voltage profile at critical nodes—raising voltages to above 0.92 pu—and reduced the number of overloaded elements operating above 125% of their nominal capacity by more than 50% (from 27 to 12). These technical benefits were achieved without requiring the expansion of the transmission infrastructure or compromising system transfer capacity.
From an economic perspective, the distributed strategy required 27% less installed reactive power capacity (437 MVAr vs. 600 MVAr) while delivering the highest annual energy savings (36 GWh) and monetary benefit (USD 5.94 M/year). The simple payback period was only 7.4 years—almost half that of the best centralized alternative, reinforcing the financial feasibility of this solution. Furthermore, the distributed strategy contributes to long-term cost avoidance by deferring investments in new transmission lines and mitigating the need for urgent infrastructure upgrades.
This study also contributes methodologically by providing a detailed comparison of centralized and distributed SVC deployments under realistic technical and economic constraints. The simulations were conducted using historical load data and extreme demand conditions to enhance their practical applicability for system planning.
By validating the proposed methodology in a real Colombian TS, the findings demonstrate the cost-effective potential of distributed SVC deployment in regions with infrastructure limitations. These insights support the inclusion of distributed compensation strategies in national grid modernization efforts, particularly in developing countries where financial, environmental, and topological constraints challenge traditional expansion-based solutions.


 ,
, 


