Article

A Real Data-Driven Fault Diagnosing Method for Distribution Networks Based on ResBlock-CBAM-CNN

1
State Grid Beijing Electric Power Research Institute, Beijing 100075, China
2
Beijing Dingcheng Hong’an Technology Development Co., Ltd., Beijing 100075, China
3
State Key Laboratory of Intelligent Power Distribution Equipment and System, Hebei University of Technology, Tianjin 300401, China
4
Chongke Intelligent Technology Zhejiang Co., Ltd., Hangzhou 311103, China
*
Author to whom correspondence should be addressed.
Electricity 2025, 6(2), 19; https://doi.org/10.3390/electricity6020019
Submission received: 21 February 2025 / Revised: 29 March 2025 / Accepted: 1 April 2025 / Published: 7 April 2025
(This article belongs to the Special Issue Advances in Operation, Optimization, and Control of Smart Grids)

Abstract

:
Power distribution systems frequently encounter various fault-causing events. Thus, prompt and accurate fault diagnosis is crucial for maintaining system stability and safety. This study presents an innovative residual block-convolutional block attention module-convolutional neural network (ResBlock-CBAM-CNN)-based method for fault cause diagnosis. To enhance diagnostic precision further, the proposed approach incorporates a multimodal data fusion model. This model combines raw on-site measurements, processed data, and external environmental information to extract relevant fault-related details. Empirical results show that the ResBlock-CBAM-CNN method, with data fusion, outperforms existing techniques significantly in fault identification accuracy. Additionally, t-SNE visualization of fault data validates the effectiveness of this approach. Unlike studies that rely on simulated datasets, this research uses real-world measurements, highlighting the practical applicability and value of the proposed model for fault cause diagnosis in power distribution systems.

1. Introduction

Power distribution reliability is a critical concern in the power system industry. However, the vast coverage, diverse equipment types, and complex operating environments of power distribution systems make fault cause identification challenging [1]. The inherent ambiguity of fault characteristics often produces unclear diagnostic indicators. This challenge makes it difficult for conventional, manual methods to accurately identify root causes, leading to delays in fault restoration [2]. To address this, data-driven techniques are employed to automatically extract discriminative patterns from heterogeneous measurements, enabling precise fault identification without relying on predefined assumptions. This approach ensures efficient diagnosis and timely responses, which are critical for maintaining system reliability.
Given this challenge, various methods have been proposed for fault cause diagnosis. For instance, Ref. [3] identifies lightning and non-lightning faults based on transient traveling waveforms and tail time. In addition, Refs. [2,4] utilize the artificial immune recognition system (AIRS) and artificial neural networks (ANNs), respectively, to identify fault causes such as tree falls, animal collisions, and lightning strikes by extracting fault line numbers, seasons, time periods, weather conditions, fault phases, and protective device actions. However, these methods [2,3,4] lack the ability to identify other common fault causes, such as those due to the electrical equipment itself. In [5], a decision-making tree model is proposed to accurately conclude fault causes. However, this approach necessitates the use of multiple models tailored to different seasons, leading to increased computational demands and extensive data requirements.
Meanwhile, with the rapid development of artificial intelligence, deep learning algorithms, known for their strong capability to extract nonlinear features, have shown significant promise in various tasks within power systems [6,7,8,9,10,11]. The author of [6] employs the Hilbert–Huang transform (HHT) and convolutional neural networks (CNNs) to analyze fault information, while Ref. [7] introduces a method based on the combination of wavelet singular entropy and fuzzy logic. The author of [8] develops a fault identification approach in electrical power distribution systems using a combined discrete wavelet transform (DWT) and fuzzy logic, utilizing the accumulated energy of each frequency band signal of voltage and current to distinguish fault types. However, the methods in [6,7,8], which leverage neural networks to extract fault information, are limited to identifying fault phases without determining specific fault causes. As a result, they do not offer direct guidance for the rapid repair of faults in power distribution systems.
Currently, the large-scale deployment of intelligent measurement devices, including distribution automation systems, feeder terminal units, and fault indicators, has allowed the collection and analysis of a large amount of data in real time. This extensive data collection supports both offline training and online application of deep learning models for fault cause diagnosis in power distribution systems [12].
Taking into account the existing research gap, this paper proposes a method to identify fault causes using the residual block-convolutional block attention module-CNN (ResBlock-CBAM-CNN) [13]. Furthermore, the proposed method uses multisource information to rapidly and accurately identify fault causes. It should be noted that, unlike studies that commonly rely on datasets generated by power system simulation software, this method uses measurement data from actual power grids. Thus, this paper demonstrates the practical effectiveness of the proposed model in identifying fault causes in real-world power systems. The contributions of this paper include the following:
  • The proposed ResBlock-CBAM-CNN model enables a quick and accurate diagnosis of fault causes in power distribution systems, reducing the dependence on the personal experience of line patrols.
  • To enhance fault diagnosis accuracy, this paper introduces the ResBlock-CBAM-CNN structure, which leverages channel and temporal attention mechanisms to improve the model’s ability to focus on critical features and time-based variations in power distribution systems.
  • To improve identification accuracy, the paper introduces a multimodal data fusion method that extracts fault-related information by integrating raw on-site measurements, feature-processed data, and external environmental information.

2. Physical Mechanisms of the Fault Diagnosis Task and the Corresponding Fault Information Extraction Structure

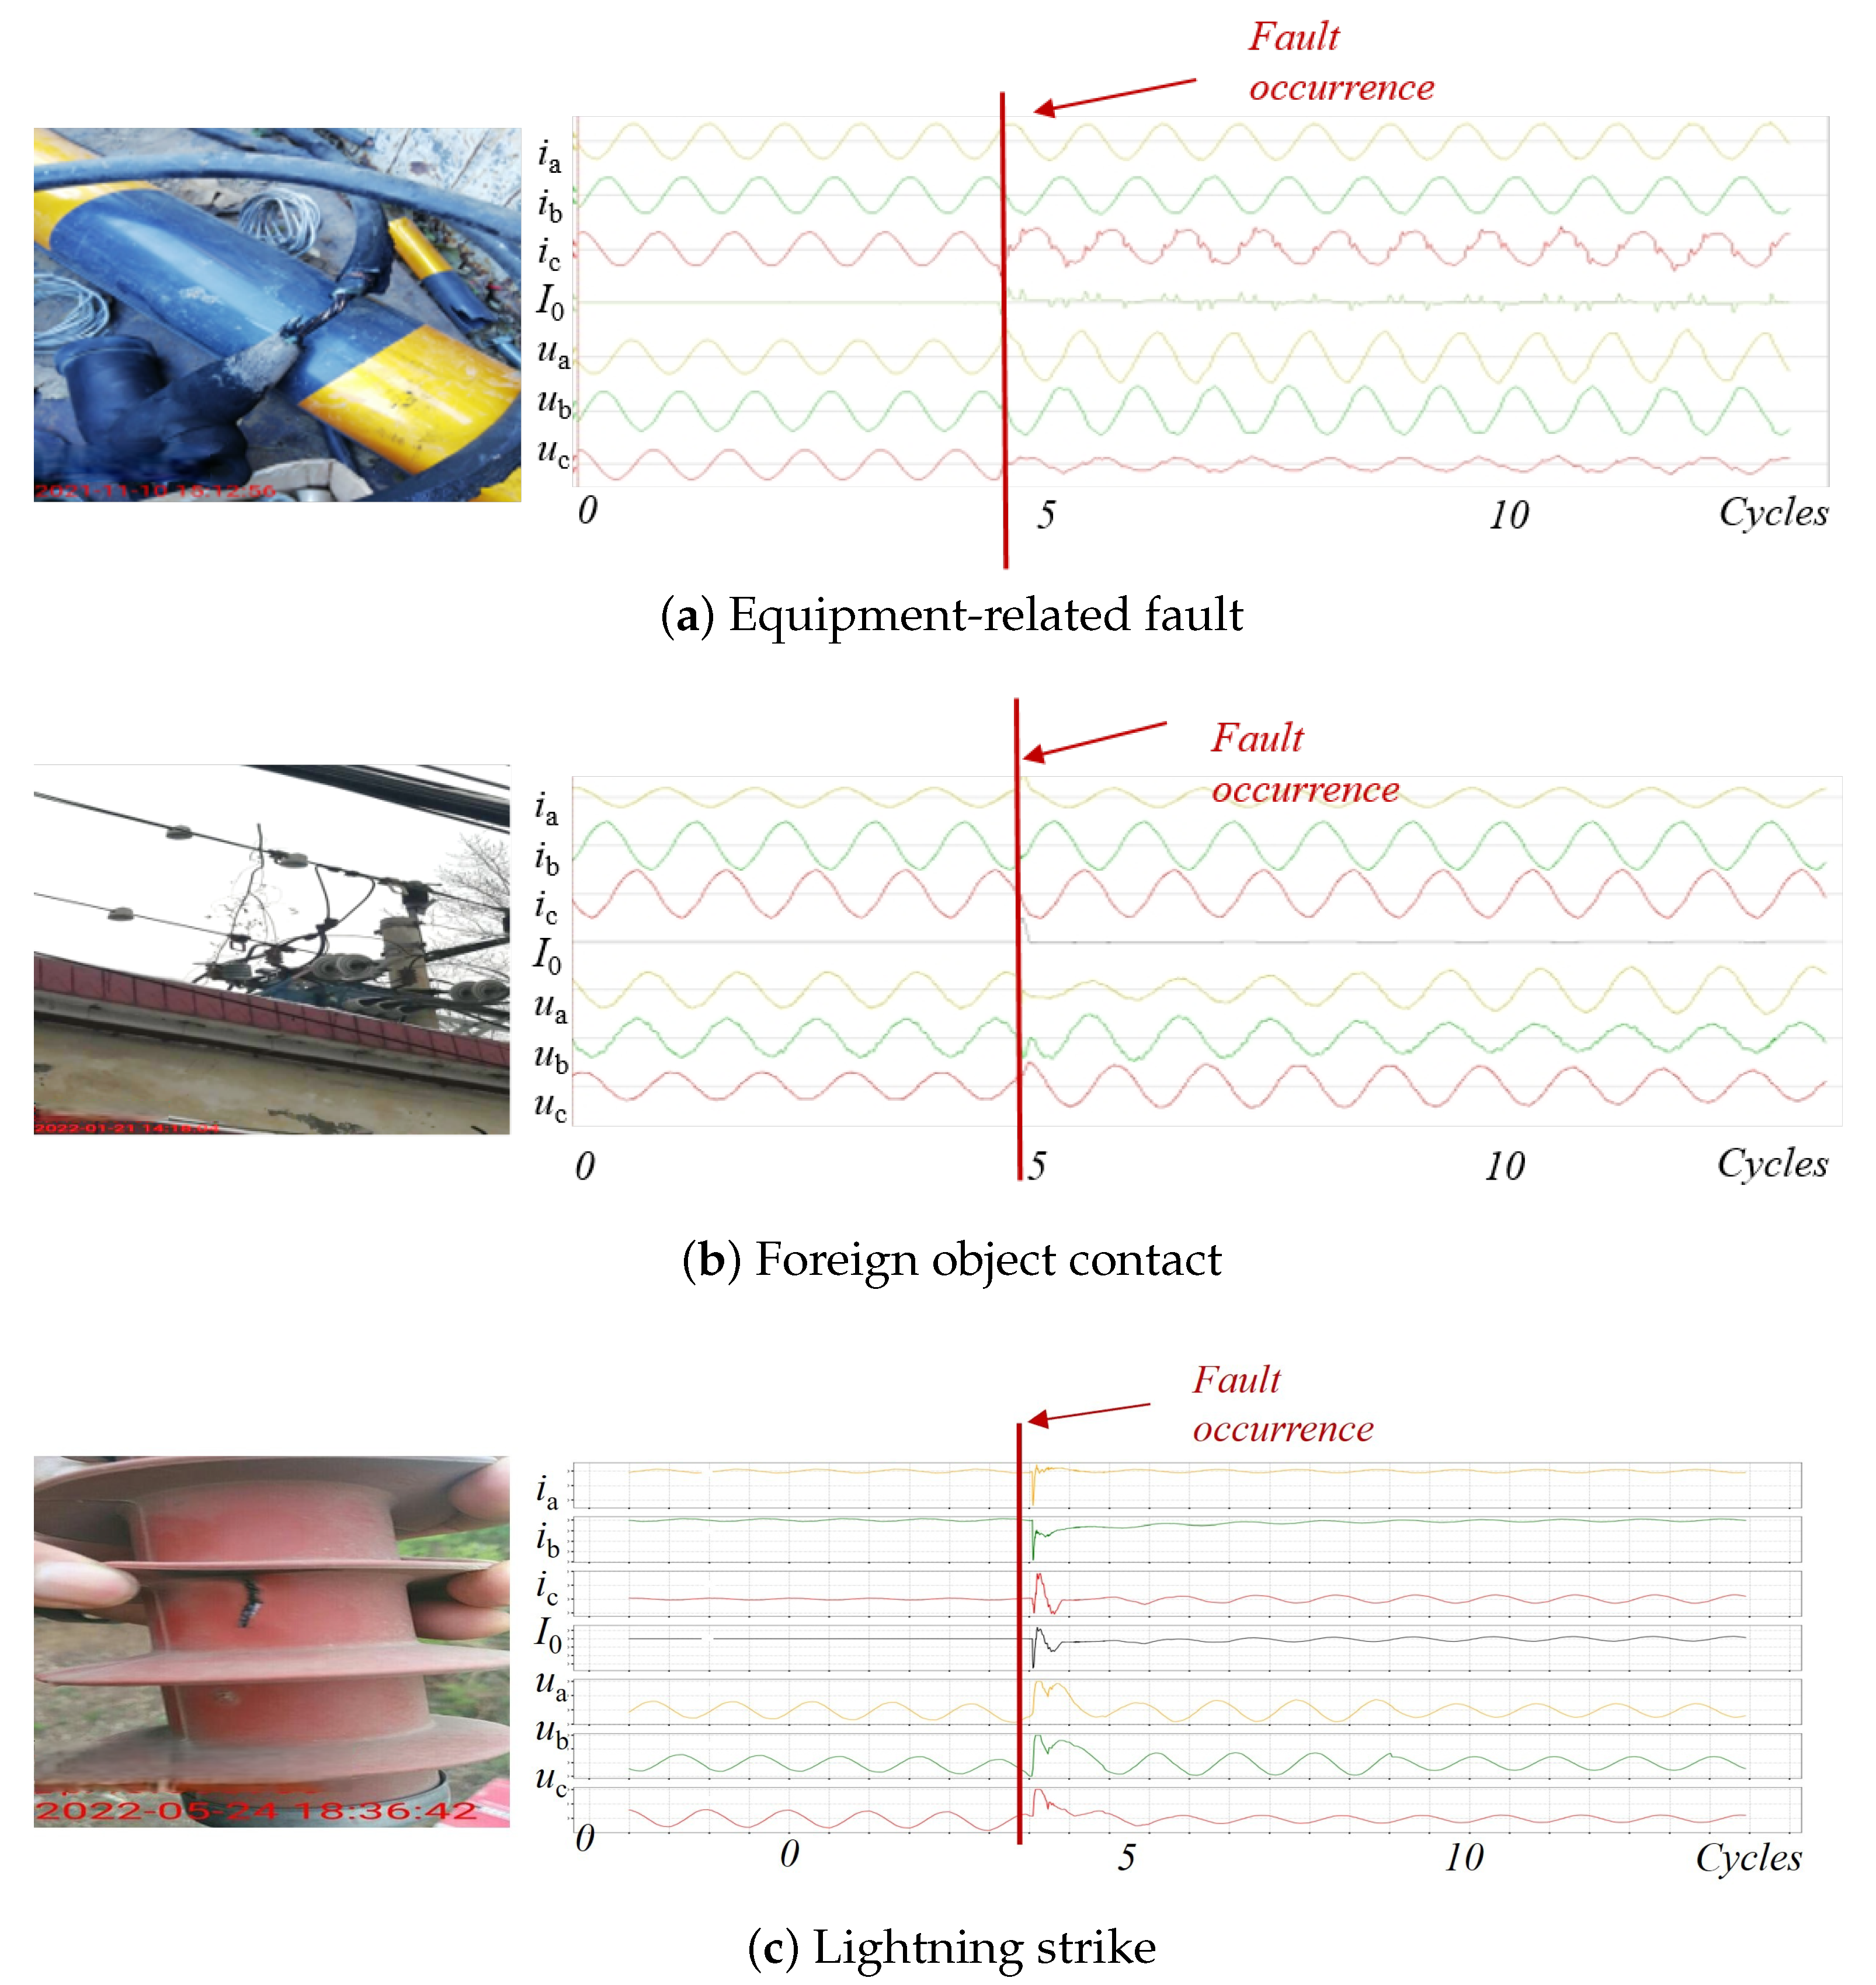
2.1. Common Fault Types in Power Distribution Systems

This paper establishes a fault cause diagnosis method using deep learning algorithms. Fault causes are categorized into three main types: equipment-related faults, foreign object contact faults, and lightning-caused faults. The following section presents various fault causes and their corresponding fault signals. It can be observed that the power signal waveforms exhibit complex variations under different fault causes, which greatly increases the difficulty of diagnosing the fault causes in power distribution systems. Meanwhile, by analyzing the physical mechanisms driving signal changes after a fault, we demonstrate the feasibility of fault diagnosis using artificial intelligence algorithms.
In power distribution systems, equipment-related faults constitute 32% of all recorded incidents, primarily involving components such as lightning arrestor leads, fuse bodies, and transformer elbow insulators. As shown in Figure 1a, a characteristic equipment failure demonstrates continuous “spike” patterns in the zero-sequence current waveform throughout the sampling period. These persistent anomalies, measured by field-installed sensors monitoring three-phase current, zero-sequence current, and electric field variations, typically stem from insulation degradation caused by manufacturing defects, improper installation, or environmental factors like moisture penetration. The cyclical breakdown and recovery of main insulation often lead to sustained grounding faults.
Another predominant fault category, accounting for 50% of system failures, involves foreign object contact from fallen trees and wildlife (particularly birds and snakes). Figure 1b illustrates a typical case where tree branches bridge weakly insulated conductors, generating transient current spikes (1–2 pulses per event). Field observations reveal distinct seasonal patterns, with bird-related faults peaking in the second quarter due to nesting activities, while weather-induced fallen tree faults escalate during rainy/windy periods [5]. The self-clearing mechanism occurs through the arc erosion of foreign materials, allowing for automatic insulation recovery.
Lightning-induced faults, representing 18% of cases, exhibit unique waveform signatures, as demonstrated in Figure 1c. Direct strikes or electromagnetic induction cause simultaneous three-phase electric field disturbances and current surges. Protection systems respond within 1–2 cycles, as arresters temporarily ground the line then restore normal operation. This transient behavior contrasts with equipment faults’ persistent waveforms and foreign objects’ intermittent patterns.
This comprehensive analysis of waveform characteristics—spanning continuous insulation failures (equipment), transient environmental interactions (foreign objects), and atmospheric discharges (lightning)—reveals the complex physical mechanisms underlying distribution system faults. The distinct temporal-spatial patterns and multivariate sensor data correlations underscore the necessity for advanced diagnostic methods that can adapt to these diverse failure modes.
In summary, the above analysis highlights the complexity of electrical waveform variations caused by different fault from a physical mechanism perspective, underscoring the need for data-driven methods to achieve rapid and accurate fault diagnosis.

2.2. Database Construction

The dataset used in this study is collected from on-site sensors deployed by a power distribution company in China. These field measurements provide detailed grid operation records, ensuring that the data accurately reflect real-world conditions and enhancing the practical applicability of the research. After a fault occurs, the data are transmitted to the power distribution system center, which then analyzes the fault causes based on the waveform data. Given the presence of various sensing units at the power distribution sites, the sampling frequencies for fault information are 12,800 Hz and 4096 Hz, respectively. The dataset consists of 900 fault samples, including 500 samples of foreign object contact, 300 samples of equipment-related faults, and 100 samples of lightning-caused faults. The data are divided into a training set and a test set in an 8:2 ratio. The data-driven model is implemented in PyTorch and executed on a server equipped with an NVIDIA RTX 3090 GPU (32 GB RAM). The hardware is provided by NVIDIA Corporation, Santa Clara, CA, USA.

2.3. Model Architecture Rationale and Data Fusion Motivation

Traditional data-driven approaches often struggle to effectively fuse electrical data with environmental information, including the development of deep learning model architectures that correspond to fault characteristics and the implementation of suitable data fusion strategies. To address this, our methodology embeds domain-specific knowledge into both model components and data fusion processes, ensuring alignment with the intrinsic characteristics of power distribution faults analyzed in Section 2.1 and illustrated in Figure 1.
Each component of the proposed ResBlock-CBAM-CNN architecture targets specific aspects of fault behavior. Convolutional layers capture multi-scale temporal patterns corresponding to waveform variations in equipment faults (continuous oscillations) and lightning strikes (impulsive transients). The CBAM module adaptively emphasizes critical electrical variables, with channel attention enhancing sensitivity to phase-specific anomalies and spatial attention localizing transient events. Residual connections maintain gradient flow across deep layers, supporting stable learning of subtle fault signatures, such as intermittent insulation breakdowns. This integrated design ensures the model effectively adapts to the diverse fault features described in Section 2.1; a detailed explanation is provided in Section 2.4.
Furthermore, the multimodal data processing framework reflects the heterogeneous nature of fault mechanisms. Raw measurements preserve transient details essential for detecting foreign object contacts, while processed parameters capture energy relationships that distinguish fault stages. External factors, such as seasonal variations, are systematically incorporated to explain context-dependent fault patterns. Data reshaping transforms sequential measurements into spatially structured representations, enabling the joint analysis of phase correlations, temporal evolution, and environmental dependencies. These strategies collectively address the complex interdependencies between electrical signatures and operational conditions, resulting in a unified framework for fault diagnosis. Detailed descriptions are provided in Section 2.5.
The proposed framework is designed to reflect the hierarchical and adaptive nature of fault diagnosis in power systems. Residual blocks incorporate skip connections to facilitate gradient propagation, mitigating vanishing gradients in deep networks. This approach ensures that critical fault features are preserved and refined across layers through additive identity mappings, where deeper neurons learn residual corrections rather than replacing shallow-layer activations.
Moreover, the CBAM module introduces a dual attention mechanism to dynamically adjust neuronal activations. Channel attention, implemented through global pooling and nonlinear gating, enhances fault-relevant feature channels (e.g., zero-sequence current patterns) while suppressing noise. Spatial attention refines feature localization by selectively activating neurons in specific regions, enabling the network to isolate transient disturbances (e.g., lightning-induced phase imbalances). This mechanism directs computational resources toward key areas in the input space.
Furthermore, convolutional layers utilize shared weights and local receptive fields to enforce translational invariance, allowing the network to recognize fault patterns (e.g., oscillatory waveforms) regardless of their temporal position. Finally, multimodal data fusion preserves the complete informational topology of heterogeneous data streams. This design adheres to the early fusion paradigm, where multimodal features are integrated at the input level to maximize mutual information retention before hierarchical processing.
Collectively, these mechanisms establish a structured framework: residual connections enhance feature reuse, attention mechanisms enable context-aware filtering, convolutional layers maintain structural consistency, and multimodal fusion facilitates cross-modal integration. Formal mathematical representations of these mechanisms are provided in Section 2.4.

2.4. Proposed Model Structure

To extract fault cause-related information for fault cause diagnosis, this paper proposes a combined ResBlock and CBAM module structure within a CNN framework [13]. As shown in Figure 2, the CBAM module enhances the feature map by applying both channel and spatial attention mechanisms. Channel attention refines the features by focusing on significant channels, resulting in F , the refined feature map. Spatial attention then processes F to highlight important locations within the feature map.
Specifically, to enhance the feature representation by emphasizing important electrical variable channels, the channel attention mechanism (CA) computes the following:
F ¯ avg = 1 H × W i = 1 H j = 1 W F i , j
where F ¯ avg is the global average pooling result, and H and W are the height and width of the feature map F .
F ¯ max = max i = 1 H max j = 1 W F i , j
where F ¯ max is the global max pooling result.
C A ( F ) = σ ( W 2 δ ( W 1 ( F ¯ avg + F ¯ max ) ) )
where C A ( F ) is the channel attention vector, σ is the Sigmoid function, δ is the ReLU activation function, and W 1 and W 2 are the weights of the fully connected layers.
F = C A ( F ) · F
where F is the output feature map after applying channel attention, and · denotes element-wise multiplication.
Moreover, to focus on significant locations across electrical temporal records in the feature map, the spatial attention mechanism (SA) is defined as follows:
F ¯ sum = c = 1 C F c
where F ¯ sum is the aggregated feature map across channels, and F c is the c-th channel of the feature map F after channel attention.
S A ( F = σ ( Conv 1 ( ReLU ( Conv 2 ( F ¯ sum ) ) ) )
where S A ( F ) is the spatial attention map, Conv 1 and Conv 2 are convolution operations, and σ is the Sigmoid function.
Overall, the complete CBAM integrates both channel and spatial attention to refine the feature map as follows:
C B A M ( F ) = S A ( C A ( F ) )
Therefore, the proposed CBAM-CNN structure enhances the analysis of power signals by refining feature representation through both channel and temporal attention mechanisms. The channel attention mechanism improves feature learning by focusing on the most informative channels, thereby enhancing the model’s capability to interpret diverse electrical characteristics. The temporal attention mechanism, applied to sequence data, emphasizes critical temporal regions, which aids in detecting variations caused by faults. By integrating these mechanisms, CBAM-CNN effectively identifies and diagnoses faults in the power distribution system by capturing and analyzing variations in electrical signals over time.
As indicated in Table 1, the proposed model mainly consists of CBAM, ResBlock, convolutional (Conv) and fully connected (FC) layers. Additionally, dropout is employed as a regularization technique to prevent overfitting. By randomly dropping neurons during each training iteration, the network is forced to not rely on specific neurons, reducing overdependence on certain features and enhancing the robustness and generalization capability of the network. Additionally, batch normalization (BN) is used as a regularization method during model training [14]. BN calculates the mean and standard deviation for each batch of training data and normalizes the input to have a mean close to 0 and a standard deviation close to 1. This process mitigates the problem of internal covariate shift, constrains the inputs to activation functions within a narrower range, and supports stable gradient propagation.
The final output layer in the proposed classifier uses the softmax function as follows:
P ( y = k x ) = exp ( w k x ) i = 1 C exp ( w i x )
where P ( y = k x ) is the probability of class k given input feature vector x , w k is the weight vector for class k, C is the total number of fault classes, and exp denotes the exponential function.

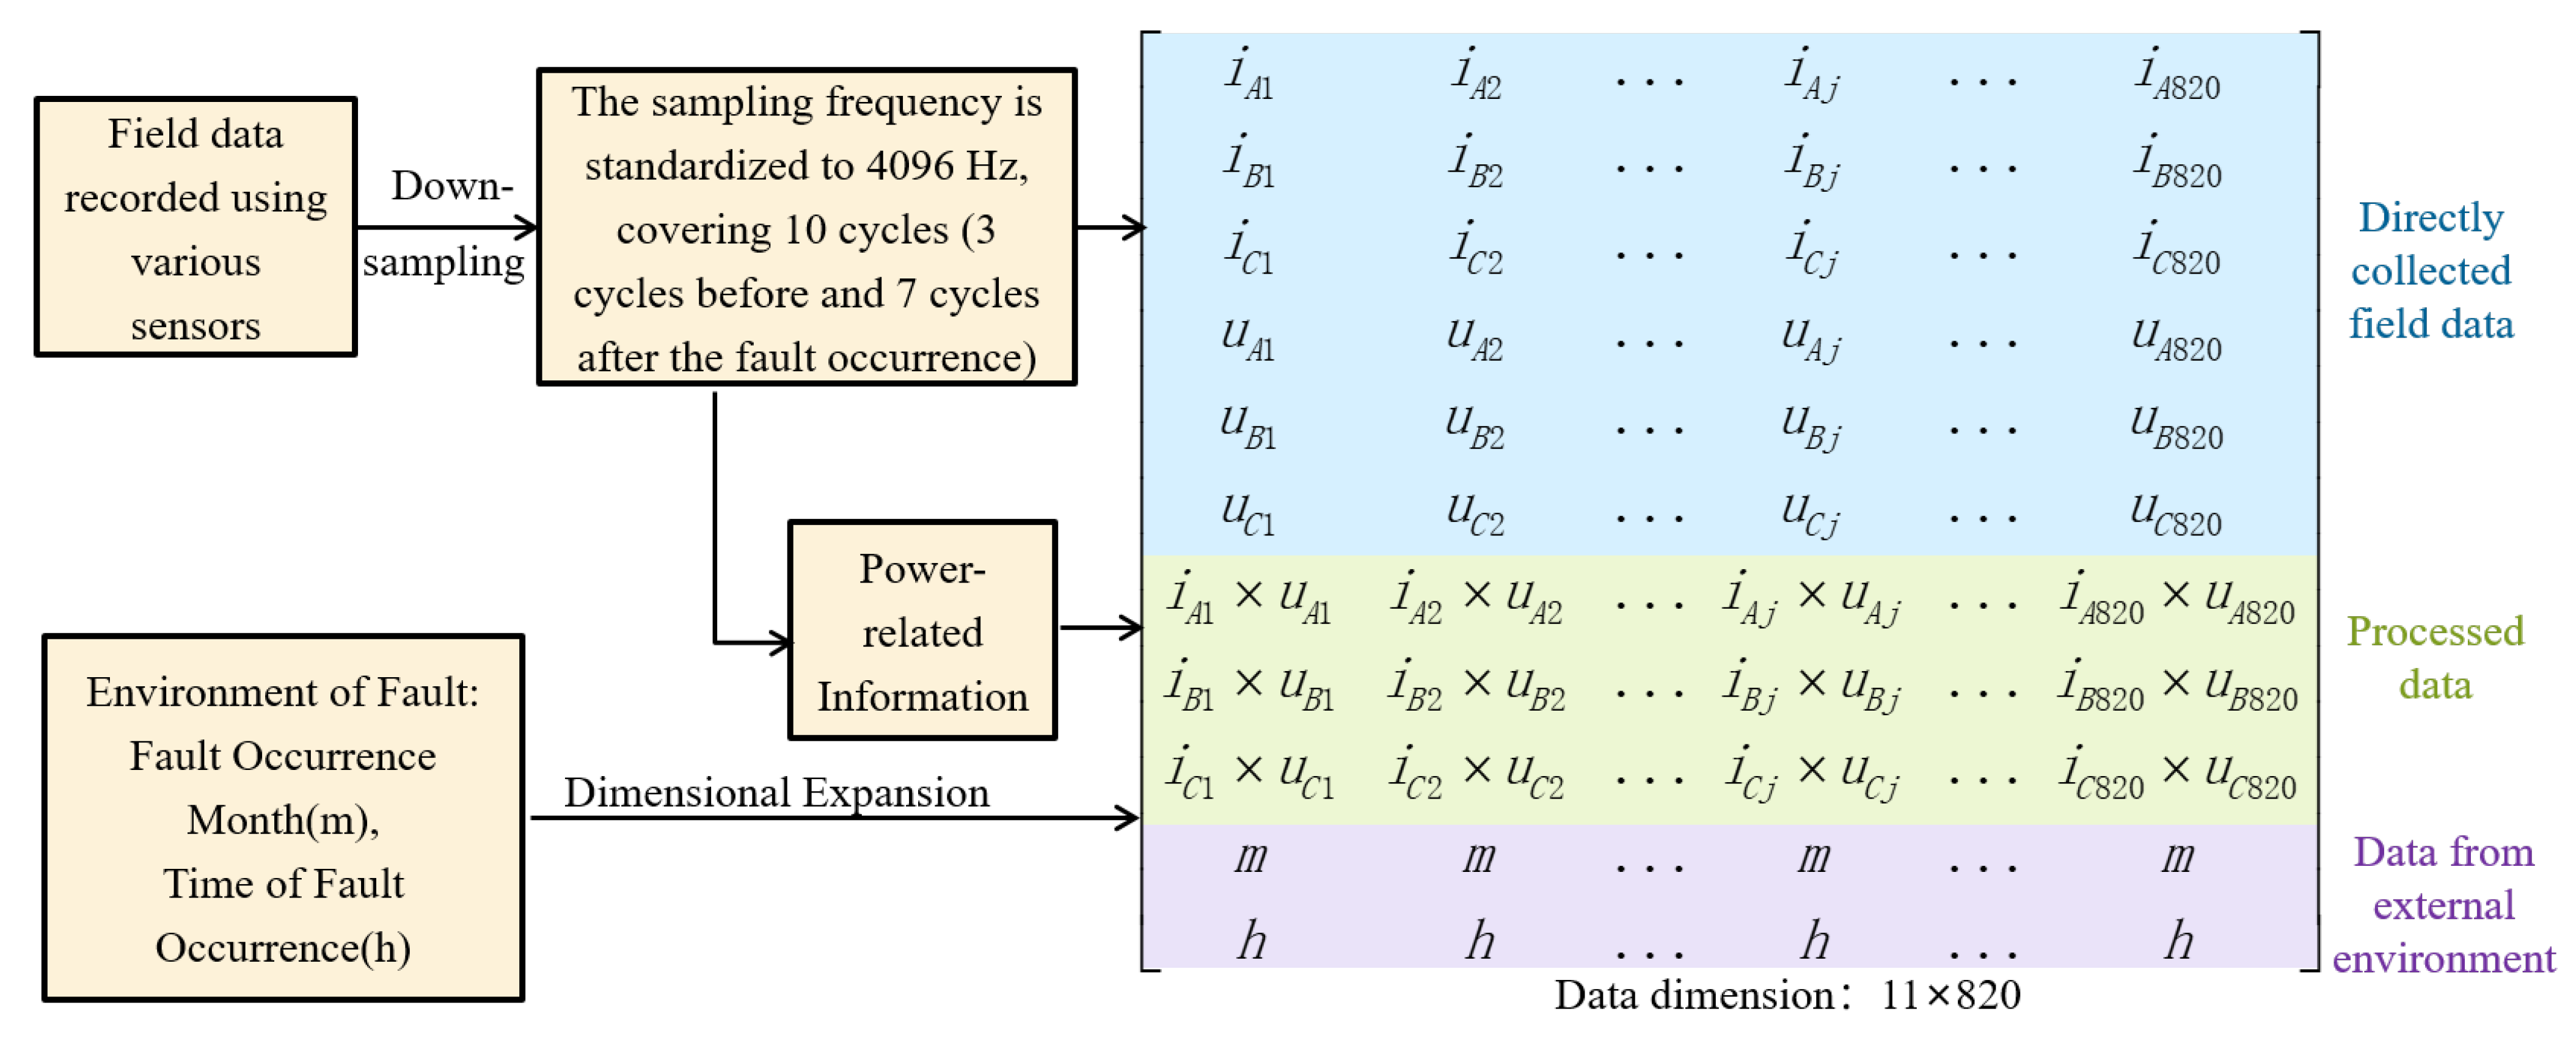
2.5. Proposed Feature Engineering with Multimodal Data Fusion

To enhance diagnostic accuracy, this paper proposes a multimodal data fusion framework to process raw electrical measurements, thereby improving the algorithm’s capability to identify fault signatures, as illustrated in Figure 3.

2.5.1. Data Alignment

To achieve temporal consistency, high-frequency sensors (12.8 kHz) and medium-frequency sensors (4.096 kHz) were downsampled to the unified 4.096 kHz. Each waveform was standardized to include three pre-fault cycles and seven post-fault cycles. After alignment, the data dimensions became 11 × 820, where −11 corresponds to multimodal features, including direct measurements (three-phase current/electric field), processed parameters (active/reactive power), and environmental data, and −820 derives from 10 cycles × 82 samples/cycle ( 4096 Hz ÷ 50 Hz grid frequency). This ensures temporal coherence across heterogeneous sensors.

2.5.2. Multimodal Information Fusion

This paper leverages a multimodal data fusion model that integrates raw on-site measurements, processed data, and external environmental information. The sensors recorded the raw three-phase current and electric field signals of the fault line. The power-related signals are also introduced; as discussed in Section 2.1, different fault causes result in varying energy changes within the fault line. Moreover, as addressed in Section 2.1, the outside environment of the fault occurrence has a significant impact on the fault causes. Therefore, we incorporated the fault occurrence month (m) and time of fault occurrence (h) into the proposed feature map.

2.5.3. Z-Score Normalization
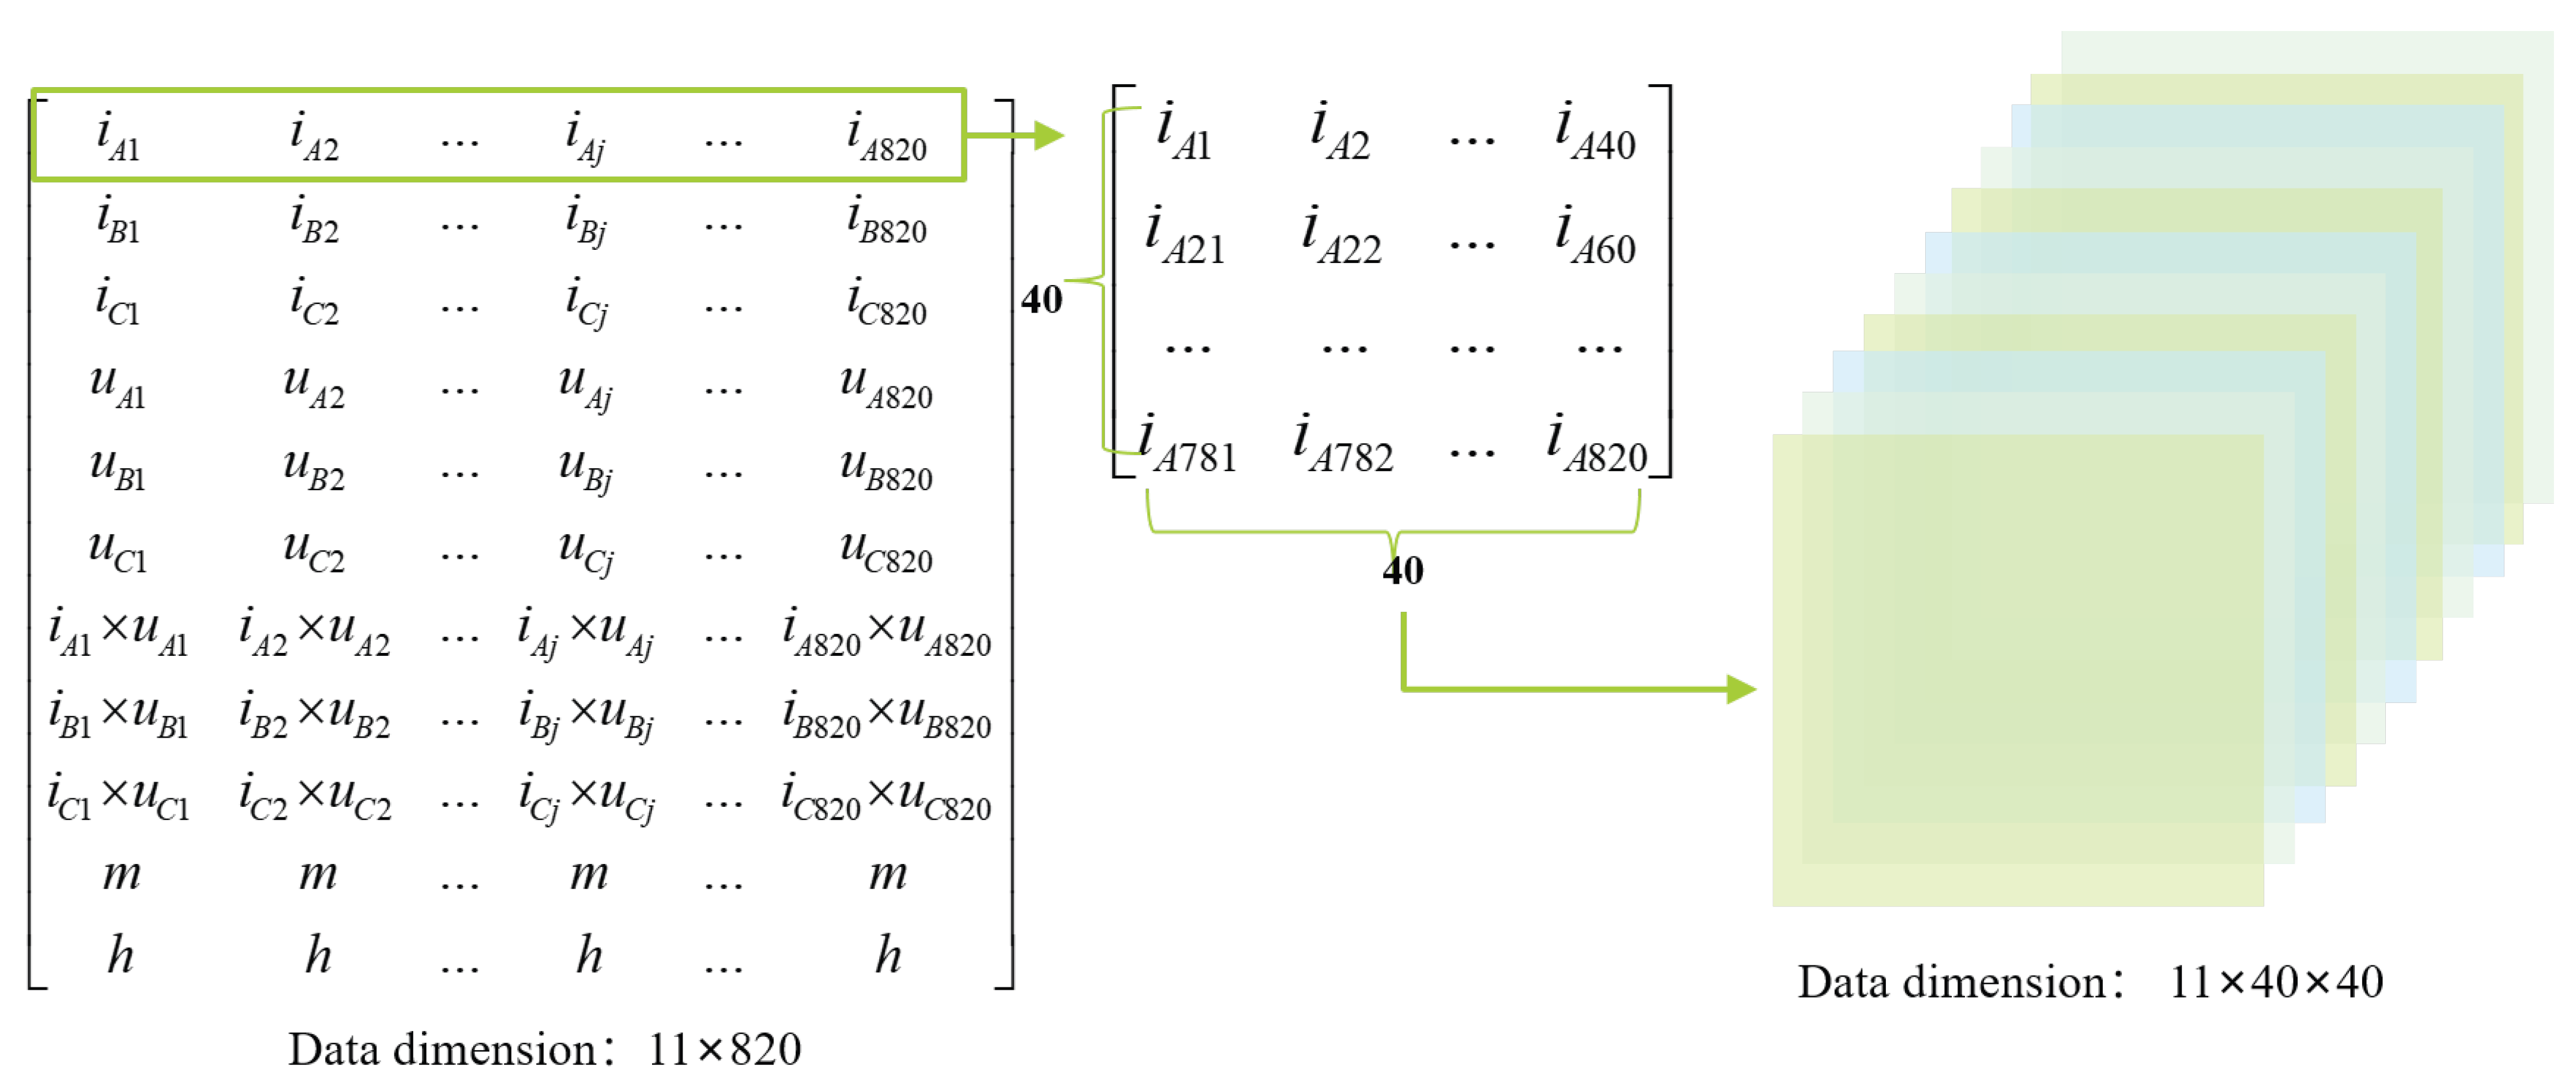
The three different time-series electrical signals were stored as a multi-dimensional database matrix after z-score normalization. Z-score normalization was applied to eliminate the effects of differences in feature scales.
z = x μ σ
where x is the data, μ is the mean of the data, and σ is the standard deviation.

2.5.4. Data Reshape

As shown in Figure 4, by reshaping the data from its original dimensions of 11 × 820 to 11 × 40 × 40, the one-dimensional data are converted into a two-dimensional format. This allows local features in the data to be more closely arranged together, promoting interactions and integration between features. This transformation helps the model to more quickly and accurately capture patterns and relationships within the electrical data.

2.6. Model Optimization Stage

The composite loss function combines cross-entropy with L2 regularization [15]:
L = 1 N i = 1 N y i log ( y ^ i ) + ( 1 y i ) log ( 1 y ^ i ) + λ 2 j = 1 M w j 2 2
where N is the batch size, y ^ i is the predicted probability, and λ controls regularization strength.
The optimization strategy employs RAdam (rectified Adam) [16] with
θ t + 1 = θ t η t v ^ t + ϵ · m ^ t
where m ^ t = m t 1 β 1 t (bias-corrected first moment) and v ^ t = v t 1 β 2 t (bias-corrected second moment).

3. Case Study

3.1. Comparison of Different Model Structures

To investigate the contribution of model components to the overall performance, this section demonstrates the feasibility of the proposed algorithm structure through ablation experiments. The accuracy of different model structures is obtained via the removal of specific components. Table 2 shows the performance of the proposed model with different configurations of components, including convolutional layer, ResBlock, CBAM, and BatchNorm.
Accuracy provides an overall measure of correct predictions, reflecting the model’s general classification ability. To address class imbalance and ensure fair evaluation across all fault categories, we also incorporate the F1-score, which balances precision (the accuracy of positive predictions) and recall (the ability to identify all positive instances) [17].
The F1 score is defined as:
F 1 score = 2 · Precision · Recall Precision + Recall
Precision = T P T P + F P
Recall = T P T P + F N
where T P denotes true positives, F P denotes false positives, and F N denotes false negatives.
As demonstrated in Table 2, each component of the proposed model plays a significant role in enhancing fault identification performance. The baseline model, consisting solely of convolutional layers, effectively extracts features from the data, providing a solid foundation. The addition of ResBlocks further improves the model’s ability to learn more complex features by utilizing skip connections, which help maintain the flow of information and gradients throughout training.
Moreover, incorporating CBAMs into the ResBlock model enhances its performance by applying attention mechanisms that focus on the most relevant features, thus improving the model’s ability to capture and prioritize important patterns within the data. Batch normalization also contributes by stabilizing the training process and enhancing generalization through normalization of activations and gradients.
The model achieves its best performance when all components—convolutional layers, ResBlocks, CBAMs, and batch normalization—are combined. This combination effectively addresses the complexities of power system data, such as intricate temporal patterns and relationships, leading to improved fault cause identification accuracy. Each component adds value to the model, demonstrating the effectiveness of the integrated approach in practical applications for power system fault analysis.

3.2. Comparison of Different Feature Map Construction Methods

This paper introduces a multimodal data fusion method using multi-source fault information, as shown in Figure 3. To validate the necessity of this data fusion method for identifying the causes of power distribution system faults, we experimentally evaluate various data construction approaches in this section. These approaches include the use of raw measurement data, power-related information, and external environmental data in ablation experiments.
Table 3 demonstrates that the proposed feature map achieves the highest performance in fault cause identification, both in terms of accuracy and F1-score. The seasonal factor significantly impacts identification accuracy; for example, the presence of bird nests and fallen trees is distinctly seasonal, as discussed in Section 2.1. Additionally, the time of day correlates with fault occurrences, such as increased wind at night leading to foreign objects contacting power lines. Power-related information also plays a crucial role by reflecting energy changes in the fault line.
Thus, compared to using only raw sensor data, the proposed multimodal data fusion method, which integrates raw sensor data with power-related information and external environmental factors, significantly enhances fault identification accuracy in power distribution lines. This highlights the effectiveness of our approach in identifying fault causes in power distribution systems.

3.3. Comparative Analysis with Existing Methods

This section compares the proposed method with existing methods. Due to the small scale of on-site data, decision tree (DT), multi-layer perceptron (MLP) [18], support vector machines (SVM) [19] and deep belief networks (DBN) [20], bidirectional long short-term memory (BiLSTM), gated recurrent unit (GRU) and recurrent highway networks (RHN) are used as comparison algorithm. In SVM, DT, MLP and DBN, the 2D information is reshaped into 1D vectors, and principal component analysis (PCA) is utilized to enhance their performance. For BiLSTM, GRU, and RHN, the 3D input is restructured into sequential formats.The hyperparameters for each classifier are determined using Grid-Search to achieve optimal performance. The classifiers are trained for up to 1000 epochs with a learning rate of 0.0005. The kernel function selected for SVM is the radial basis function (RBF). The kernel sizes of the five fully-connected layers in the MLP are 200, 100, 50, 20, and 5, respectively.
As shown in Table 4, the proposed method outperforms alternative techniques in fault identification. Shallow learning architectures, such as DTs and SVMs, exhibit limited representational capacity because they flatten multidimensional data into vectors, thereby discarding structural patterns critical for distinguishing fault types with overlapping electrical characteristics. Although deep sequential models, such as BiLSTMs, GRUs and RHNs, improve temporal modeling, their recurrent architectures tend to disrupt the relationships between phase measurements and environmental data.
The proposed ResBlock-CBAM-CNN framework addresses these limitations by integrating adaptive feature refinement, depth-stable learning, and spatially coherent processing. Within the CBAM module, channel attention dynamically prioritizes fault-sensitive variables (e.g., zero-sequence currents for insulation degradation), while spatial attention isolates transient disturbances in specific phases without compromising broader operational patterns. These attention mechanisms, embedded in residual blocks, stabilize gradient propagation across deep layers and enable robust learning of both abrupt transients (e.g., lightning strikes) and gradual fault evolution (e.g., equipment aging). Moreover, the CNN backbone processes input data as structured 2D feature maps, preserving phase-to-phase relationships and temporal fault evolution. This design aligns with fault characteristics analyzed in Section 2.1, explicitly modeling environmental dependencies through dedicated month and time information. By retaining coupling between electrical responses and external factors, it captures critical interactions often overlooked by other methods.
Overall, the proposed ResBlock-CBAM-CNN framework achieves enhanced fault diagnosis performance by aligning its design with the intrinsic characteristics of power distribution faults, including environmental dependencies and temporal patterns, ensuring its suitability for real-world power systems.

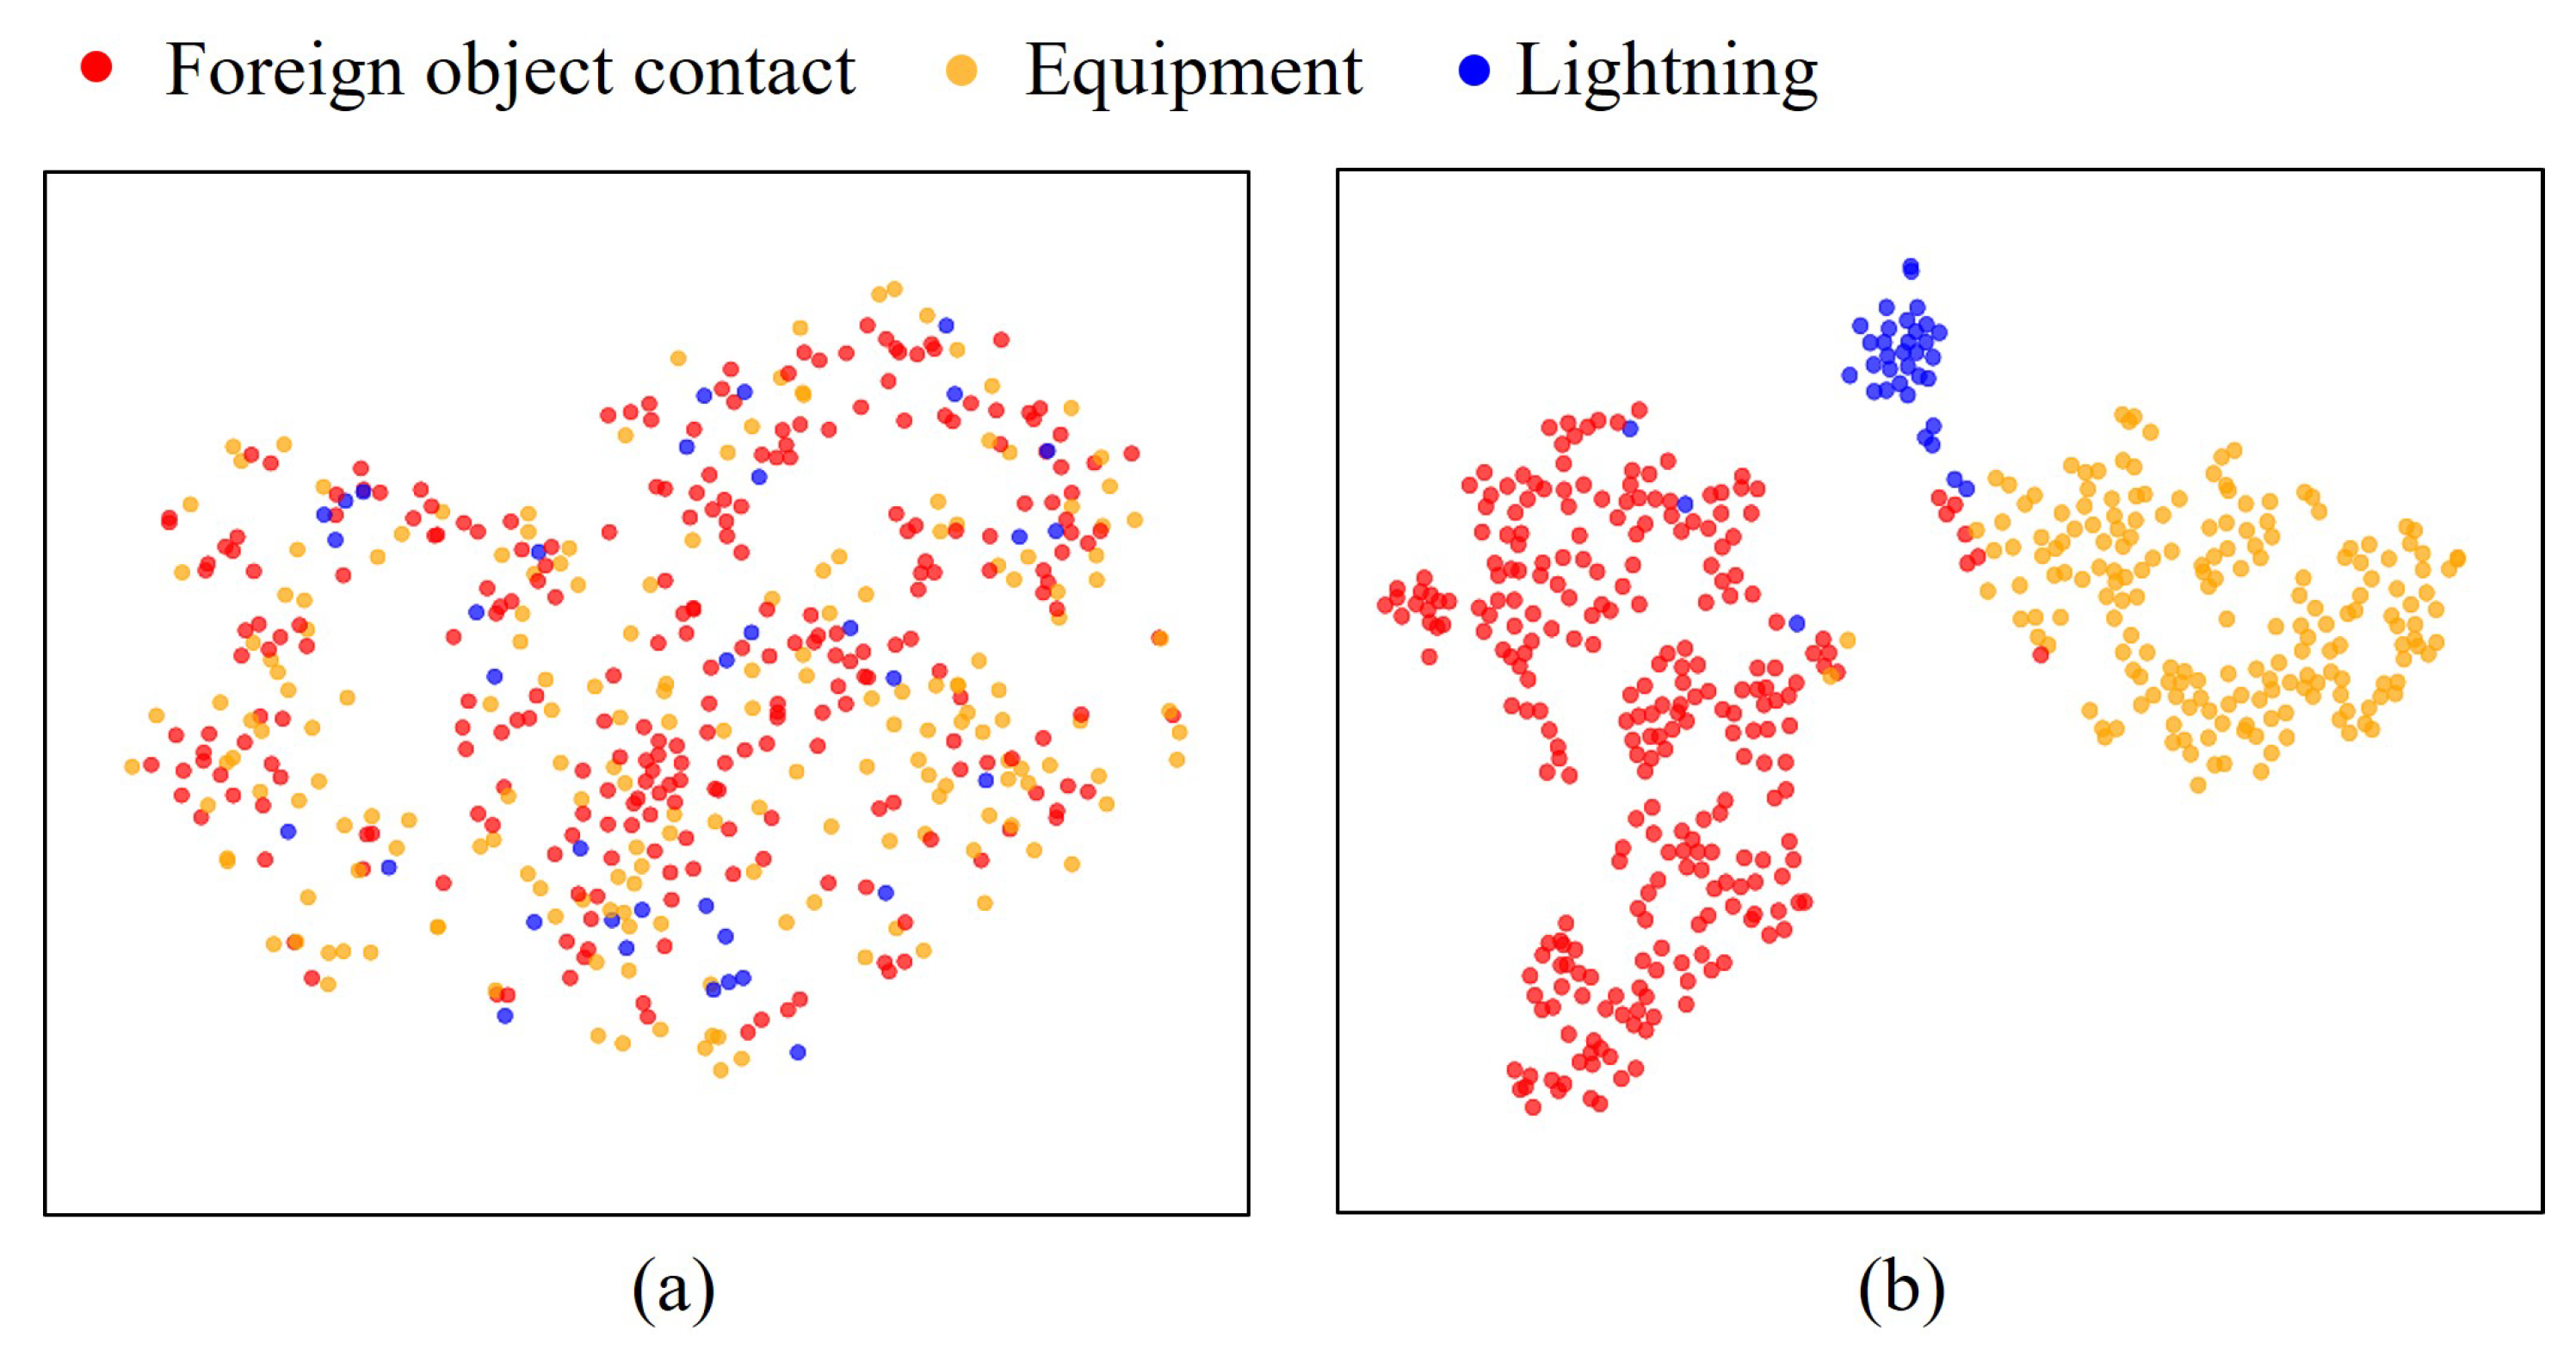
3.4. The Visualization of the Proposed Method

To validate the effectiveness of the proposed method, this section uses t-SNE [21] to demonstrate its capability in distinguishing between fault data from the three different causes. Figure 5a,b visualize the raw electrical data and the extracted data after applying the proposed model. As shown in Figure 5a, the raw electrical data exhibit a complex and indistinct pattern, making it difficult to differentiate between fault causes in the power distribution system, which hinders the quick identification and repair of faults. This underscores the importance of data-driven approaches for accurate fault cause identification.
In contrast, Figure 5b shows the feature representations at the final fully connected layer of the proposed classifier, where the three types of data are clearly separated into distinct clusters. This separation demonstrates that the proposed method effectively captures the critical features related to fault causes, leading to high classification accuracy. Consequently, the t-SNE visualization further confirms the necessity and effectiveness of the proposed approach for fault cause identification in power distribution systems.

4. Conclusions

This paper presents a robust model for fault cause diagnosis in power distribution systems. The proposed framework is rigorously evaluated using real-world grid fault database, demonstrating its reliability and adaptability across diverse operational conditions. The results highlight its potential as a scalable and generalizable solution for fault diagnosis in evolving power distribution networks, even as new fault types emerge. The superior performance is validated through numerical experiments, and the key contributions are summarized as follows:
(1)
The proposed data-driven method enables automated fault identification with minimal reliance on manual expertise while maintaining high accuracy.
(2)
By fusing raw measurements, processed operational parameters, and environmental data, the model overcomes the limitations of single-source data analysis, enhancing its ability to differentiate complex fault patterns.
(3)
The proposed framework integrates the CNN backbone for temporal sequence analysis, the CBAM module for adaptive feature refinement, and the ResBlock architecture for deep structural learning. By aligning these components with the intrinsic fault characteristics of power distribution systems, the framework significantly enhances fault identification accuracy.

Author Contributions

Conceptualization, Y.Y. and H.M.; methodology, Y.Y. and C.G.; software, H.M. and C.G.; validation, H.M. and Q.Z.; formal analysis, Y.Y.; investigation, H.M.; resources, Y.L.; data curation, C.G.; writing—original draft preparation, N.W. and Y.Y.; writing—review and editing, B.Y., H.M. and Q.Z.; visualization, H.M.; supervision, Y.L.; project administration, Y.L. All authors have read and agreed to the published version of the manuscript.

Funding

This research was funded by the Science and Technology Project of State Grid Beijing Electric Power Company, grant number DCHA-KJ-24120306, and in part by the State Key Laboratory of Intelligent Power Distribution Equipment and System (No. EERI_OY2023005) Hebei University of Technology and the S&T Program of Hebei (24464401D).

Data Availability Statement

The original contributions presented in the study are included in the article; further inquiries can be directed to the corresponding author.

Conflicts of Interest

Authors Yuhai Yao, Hao Ma, Cheng Gong, and Yifei Li were employed by the company Beijing Dingcheng Hong’an Technology Development Co., Ltd. Authors Ning Wei and Bin Yang were employed by the company Chongke Intelligent Technology Zhejiang Co., Ltd. The remaining authors declare that the research was conducted in the absence of any commercial or financial relationships that could be construed as a potential conflict of interest.

References

  1. Liang, J.F. Research on rapid diagnosis method of single-phase grounding fault in distribution network based on deep learning. In Proceedings of the Chinese Automation Congress (CAC), Hangzhou, China, 22–24 November 2019. [Google Scholar]
  2. Xu, L.; Chow, M.; Timmis, J. Power distribution outage cause identification with imbalanced data using artificial immune recognition system (AIRS) algorithm. IEEE Trans. Power Syst. 2007, 22, 198–204. [Google Scholar]
  3. Morales, J.; Orduna, E.; Rehtanz, C. Identification of lightning strike due to shielding failure and back flashover for ultra-high-speed transmission-line protection. IEEE Trans. Power Deliv. 2014, 29, 2008–2017. [Google Scholar] [CrossRef]
  4. Xu, L.; Chow, M. A classification approach for power distribution systems fault cause identification. IEEE Trans. Power Syst. 2006, 21, 53–60. [Google Scholar]
  5. Li, Y.; Song, X.; Zhao, S.; Gao, F. A line fault cause analysis method for distribution network based on decision-making tree and machine learning. In Proceedings of the Fifth Asia Conference on Power and Electrical Engineering (ACPEE), Chengdu, China, 4–7 June 2020. [Google Scholar]
  6. Guo, M.; Yang, N.; Chen, W. Deep-learning-based fault classification using Hilbert–Huang transform and convolutional neural network in power distribution systems. IEEE Sens. J. 2019, 19, 6905–6913. [Google Scholar]
  7. Dehghani, M.; Khooban, M.H.; Niknam, T. Fast fault detection and classification based on a combination of wavelet singular entropy theory and fuzzy logic in distribution lines in the presence of distributed generations. Int. J. Electr. Power Energy Syst. 2016, 78, 455–462. [Google Scholar] [CrossRef]
  8. Jamil, M.; Singh, R.; Sharma, S.K. Fault identification in electrical power distribution system using combined discrete wavelet transform and fuzzy logic. J. Electr. Syst. Inf. Technol. 2015, 2, 257–267. [Google Scholar] [CrossRef]
  9. Chen, K.; He, Z.; Wang, S.X.; Hu, J.; Li, L.; He, J. Learning-based data analytics: Moving towards transparent power grids. CSEE J. Power Energy Syst. 2018, 4, 67–82. [Google Scholar]
  10. Fang, J.; Liu, C.; Zheng, L.; Su, C. A data-driven method for online transient stability monitoring with vision-transformer networks. Int. J. Electr. Power Energy Syst. 2023, 146, 108669. [Google Scholar]
  11. Fang, J.; Chen, K.; Liu, C.; He, J. An Explainable and Robust Method for Fault Classification and Location on Transmission Lines. IEEE Trans. Ind. Inform. 2023, 19, 10182–10191. [Google Scholar]
  12. Samantaray, S.R.; Kamwa, I.; Joos, G. Phasor measurement unit based wide-area monitoring and information sharing between microgrids. IET Gener. Transm. Distrib. 2017, 11, 1293–1302. [Google Scholar]
  13. Woo, S.; Park, J.; Lee, J.Y.; Kweon, I.S. CBAM: Convolutional Block Attention Module. In Computer Vision—ECCV 2018; Ferrari, V., Hebert, M., Sminchisescu, C., Weiss, Y., Eds.; Lecture Notes in Computer Science; Springer: Cham, Switzerland, 2018; Volume 11211. [Google Scholar]
  14. Ioffe, S.; Szegedy, C. Batch Normalization: Accelerating Deep Network Training by Reducing Internal Covariate Shift. In Proceedings of the International Conference on Machine Learning, Lille, France, 6–11 July 2015; Volume 37, pp. 448–456. [Google Scholar]
  15. Lecun, Y.; Bottou, L.; Bengio, Y.; Haffner, P. Gradient-based learning applied to document recognition. Proc. IEEE 1998, 86, 2278–2324. [Google Scholar]
  16. Liu, L.; Jiang, H.; He, P.; Chen, W.; Liu, X.; Gao, J.; Han, J. On the Variance of the Adaptive Learning Rate and Beyond. arXiv 2021, arXiv:1908.03265. Available online: https://arxiv.org/abs/1908.03265 (accessed on 26 October 2021).
  17. Cortes, C.; Mohri, M. AUC Optimization vs. Error Rate Minimization. In Advances in Neural Information Processing Systems. Adv. Neural Inf. Process. Syst. 2004, 11, 356–360. [Google Scholar]
  18. Zhou, Y.; Guo, Q.; Sun, H.; Yu, Z.; Wu, J.; Hao, L. A novel data-driven approach for transient stability prediction of power systems considering the operational variability. Int. J. Electr. Power Energy Syst. 2019, 107, 379–394. [Google Scholar] [CrossRef]
  19. Wang, J.; Sima, W.; Yang, Q. Classification and identification of over-voltage based on HHT and SVM. In Proceedings of the International Conference on High Voltage Engineering Application, New Orleans, LA, USA, 11–14 October 2010. [Google Scholar]
  20. Liu, W.; Hao, D.; Zhang, S.; Zhang, Y. Power System Transient Stability Assessment Based on PSO-DBN. In Proceedings of the 2021 6th International Conference on Power and Renewable Energy (ICPRE), Shanghai, China, 17–20 September 2021; pp. 333–337. [Google Scholar]
  21. Cheng, S.J. An Analysis of Prospects for Application of Large-scale Energy Storage Technology in Power Systems. Autom. Electr. Power Syst. 2013, 37, 3–8. [Google Scholar]
Figure 1. Field images and waveform data of common faults in power distribution systems: (a) equipment-related; (b) foreign object contact; (c) lightning strike.
Electricity 06 00019 g001
Figure 2. The proposed combination of ResBlock and CBAM module.
Electricity 06 00019 g002
Figure 3. Multimodal feature engineering framework in the proposed method.
Electricity 06 00019 g003
Figure 4. The process of data reshape.
Electricity 06 00019 g004
Figure 5. Visualization of (a) the raw data and (b) the extracted features of the proposed model.
Electricity 06 00019 g005
Table 1. The proposed ResBlock-CBAM-CNN model.
Layer TypeParameters
Conv1Out Channels: 16, Kernel Size: (3, 3)
BatchNorm1-
ReLU1-
MaxPool1Kernel Size: (2, 2), Stride: 2
CBAM1Reduction Ratio: 16, Kernel Size: (7, 7)
ResBlock1Skip connection: Conv1 + CBAM1
Conv2Out Channels: 16, Kernel Size: (3, 3)
BatchNorm2-
ReLU2-
MaxPool2Kernel Size: (2, 2), Stride: 2
CBAM2Reduction Ratio: 16, Kernel Size: (7, 7)
ResBlock2Skip connection: Conv2 + CBAM2
Conv3Out Channels: 8, Kernel Size: (3, 3)
BatchNorm3-
ReLU3-
MaxPool3Kernel Size: (2, 2), Stride: 2
CBAM3Reduction Ratio: 8, Kernel Size: (7, 7)
ResBlock3Skip connection: Conv3 + CBAM3
Fully connected1Out Features: 32
BatchNorm4-
ReLU4-
DropoutDropout Rate: 0.5
Fully connected2Out Features: 2 (Softmax Output)
Table 2. Performance of the proposed model with different components.
ConvResBlockCBAMBatchNormAccuracy (%)F1-Score (%)
86.3284.29
88.4586.18
90.5689.03
91.1289.70
94.5792.82
Table 3. Performance comparison under different feature map structures.
Raw Record Data (Current, Voltage)Power-Related DataMonthTime of DayAccuracy (%)F1-Score (%)
74.6271.28
82.1780.45
86.2885.12
91.4289.67
94.5792.82
Table 4. Performance comparison of different methods.
MethodAccuracy (%)F1-Score (%)
The proposed method94.5792.82
RHN90.2188.78
BiLSTM91.0588.75
GRU85.1284.01
DBN85.0283.10
DT82.2380.82
SVM81.9880.68
MLP75.2274.03
Disclaimer/Publisher’s Note: The statements, opinions and data contained in all publications are solely those of the individual author(s) and contributor(s) and not of MDPI and/or the editor(s). MDPI and/or the editor(s) disclaim responsibility for any injury to people or property resulting from any ideas, methods, instructions or products referred to in the content.

