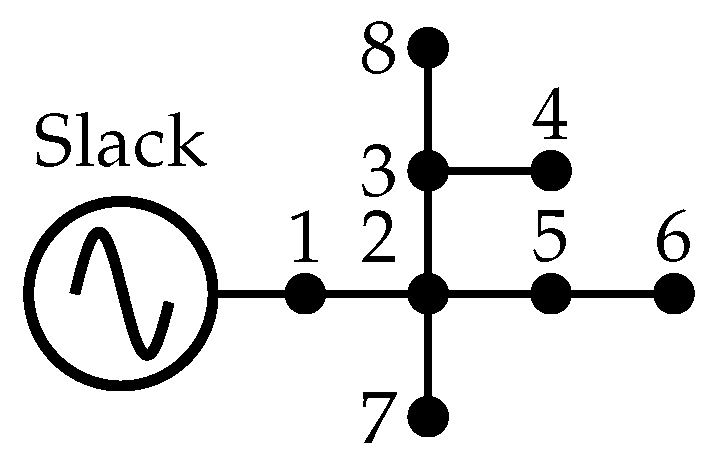
This section details the validation of the proposed methodology, which was carried out in two stages. First, our method was implemented on widely recognized test systems selected from the specialized literature (i.e., the 8-, 25-, and 37-node systems). These systems have been previously validated and used by other authors in similar problems involving unbalanced three-phase grids, and they exhibit the inherent characteristics of distribution systems: unbalanced loads, a radial topology, and line asymmetries. Thus, they adequately represent real network conditions. Subsequently, a comparative numerical analysis of the proposed mathematical models against previous studies was conducted. This analysis allowed verifying the consistency and accuracy of both the mathematical model and the proposed methodology.
6.2. Computational Validation and Comparative Analysis
The proposed matrix (M-MINLP) and vector (V-MINLP) formulations for phase balancing were rigorously validated using the Julia programming software v1.10.2, leveraging the JuMP v1.21.1 optimization package and AmplNLWriter v1.2.1. All simulations were executed on a workstation equipped with a 12th Gen Intel Core i7-12700T CPU @ 1.40 GHz and 32 GB RAM, running on 64-bit Windows 11 Pro. Additionally, the formulations were compared against multiple literature-reported combinatorial optimization techniques based on metaheuristics, including the CBGA [
36], the discrete VSA (DVSA) [
36], the CSA [
37], the improved CSA (ICSA) [
37], the BHO [
39], the sine–cosine algorithm (SCA) [
39], the HOA [
38], and the SSA [
41]. Additionally, the proposed models were compared against convex approximations of the mathematical model, such as the mixed-integer quadratic convex model based on average power (MIQC-AP) [
30], the mixed-integer quadratic convex model based on average current (MIQC-AI) [
30], and the mixed-integer quadratic convex model based on electrical momentum (MIQC-EM) [
30].
A detailed analysis of the results is presented below.
Table 2 presents the results reported in the specialized literature for the metaheuristic and exact solution techniques, along with the results obtained by our two proposed formulations, in the eight-node test system. The table organizes the information according to the implemented methodology, the reported power losses, and the percent reduction compared to the base case. It is important to note that, for this case, the power losses of the base case are 13.9925 kW.
In the eight-node test system, except for the MIQC-AP approach, all methodologies achieved identical results, with power losses of 10.5869 kW and a percent reduction of 24.34%. This uniformity is due to the relatively small solution space ( = 279,936 combinations), which allows all methods to converge to the global optimum. These results validate the reliability and accuracy of the M-MINLP and V-MINLP formulations in small-scale systems.
The uniformity in the results for the eight-node test system indicates that the solution space is small enough for all optimization techniques (including metaheuristic methods and convex approximations of the mathematical model) to efficiently explore it in the search for the global optimum. This highlights the ability of the reported techniques to perform effectively when the problem size is manageable, and it validates the precision and robustness of the M-MINLP and V-MINLP formulations. From a practical standpoint, the results reinforce the reliability of exact formulations in ensuring optimal solutions, even in small systems. Furthermore, this test serves as a benchmark for validating the implementation and correctness of the optimization framework before scaling to more complex and computationally intensive scenarios. The ability of the proposed formulations to maintain precision under these conditions further demonstrates their suitability for both small-scale systems and larger, real-world distribution networks.
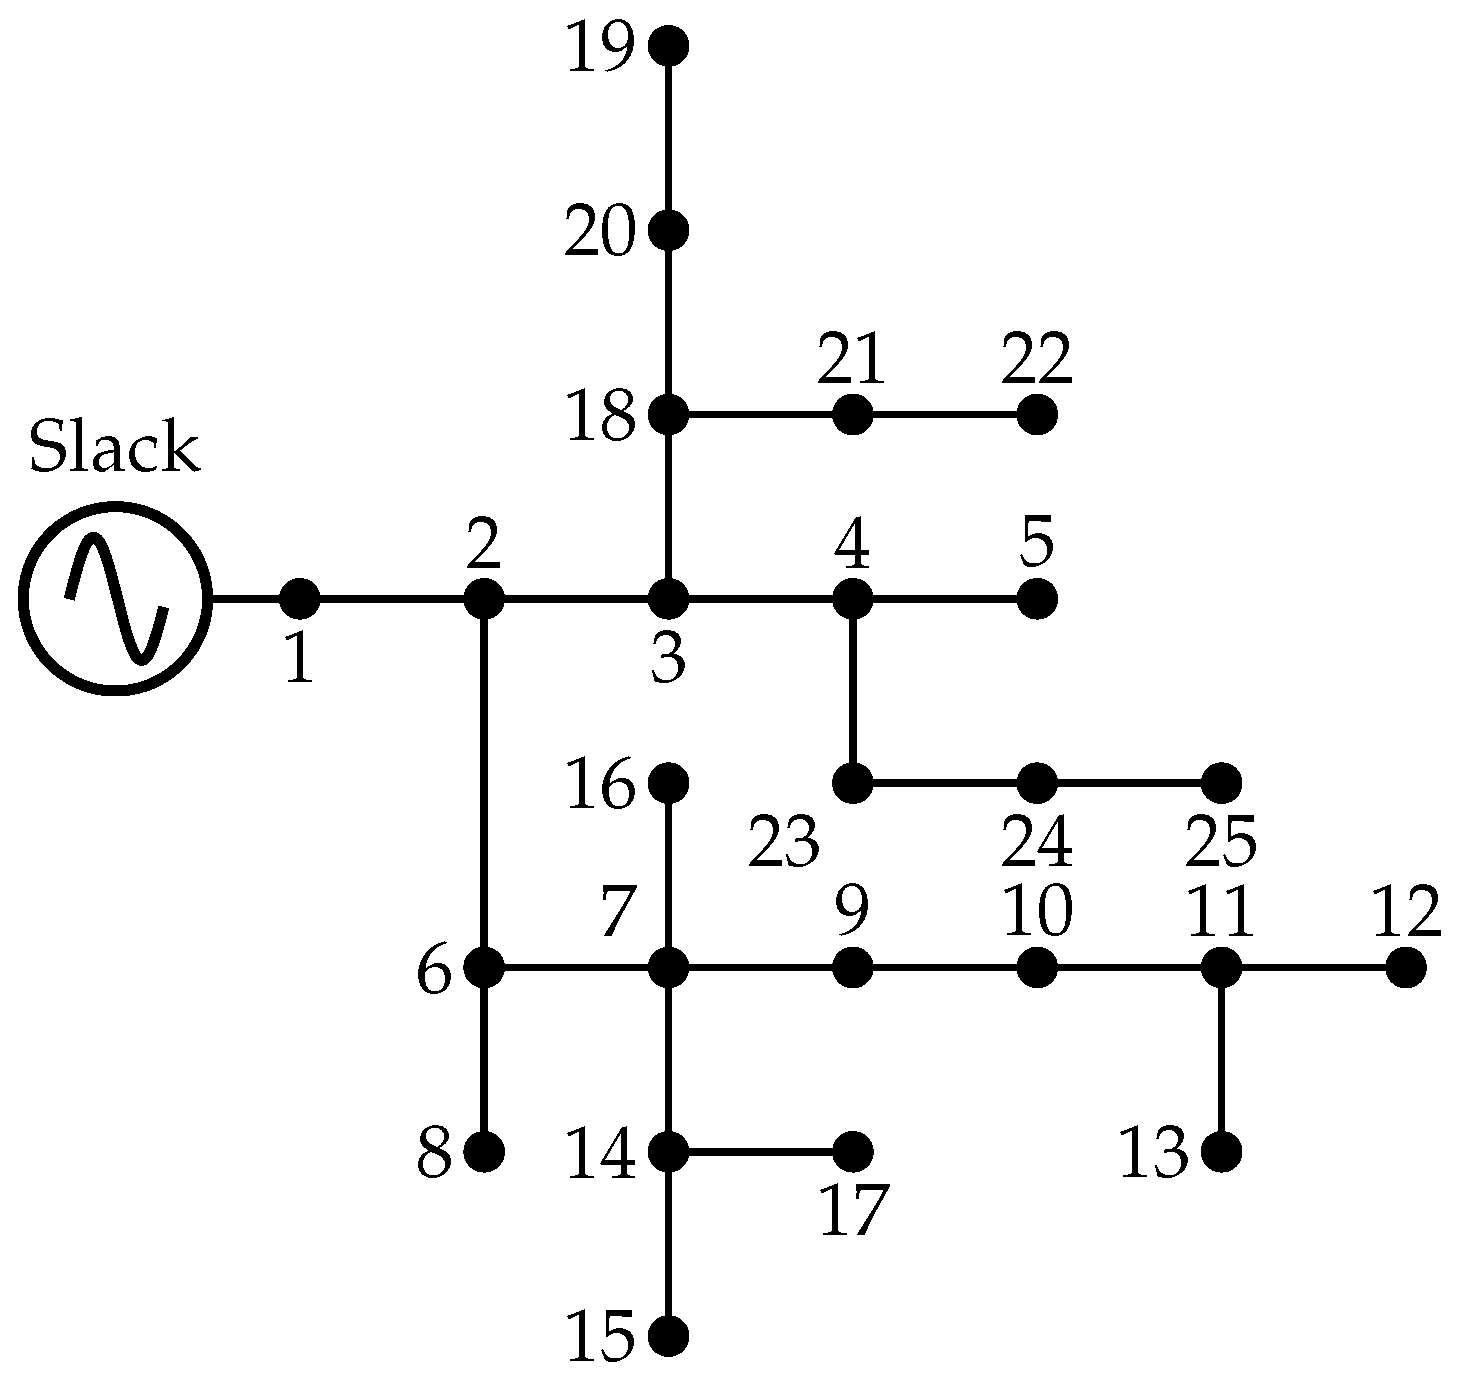
Table 3 presents the numerical results obtained for the 25-node test system, analyzing the same information as in
Table 2.
Unlike the 8-node test system, the results for the 25-node feeder exhibit variations in power loss values and reduction percentages across optimization techniques. While all methods achieve a power loss reduction greater than 3.99%, the proposed formulations (M-MINLP and V-MINLP) stand out by achieving the lowest value, i.e., 72.2801 kW, corresponding to a 4.1641% reduction. This improvement highlights the robustness and precision of the proposed methodologies in handling medium-scale systems, where the solution space is exponentially larger ( combinations) compared to smaller systems. In particular, the exact formulations outperform both the convex approximations and the metaheuristic approaches, which tend to be more prone to suboptimal solutions related to local optima.
It is worth noting that convex approximations such as MIQC-AI achieve results close to the proposed formulations but fall slightly short in terms of power loss minimization. Similarly, the best-performing metaheuristic techniques, i.e., HOA and SSA, achieve reductions of 4.1556%, demonstrating their effectiveness but still falling behind the precision of the exact formulations. From a practical perspective, our proposed methodologies offer two key advantages. Firstly, unlike metaheuristic methods, which rely on iterative heuristics and probabilistic search mechanisms, the exact formulations ensure convergence to the global optimum. Secondly, the methodologies are designed to handle the increased complexity of larger systems without compromising precision, as demonstrated in this test case.
These results reaffirm the relevance of the proposed formulations in medium-sized grids, where achieving precise and globally optimal solutions is critical for minimizing power losses and enhancing system efficiency. Furthermore, the performance gap between the proposed formulations and other approaches becomes increasingly significant as system complexity grows, emphasizing the suitability of the former for practical deployment in real-world scenarios.
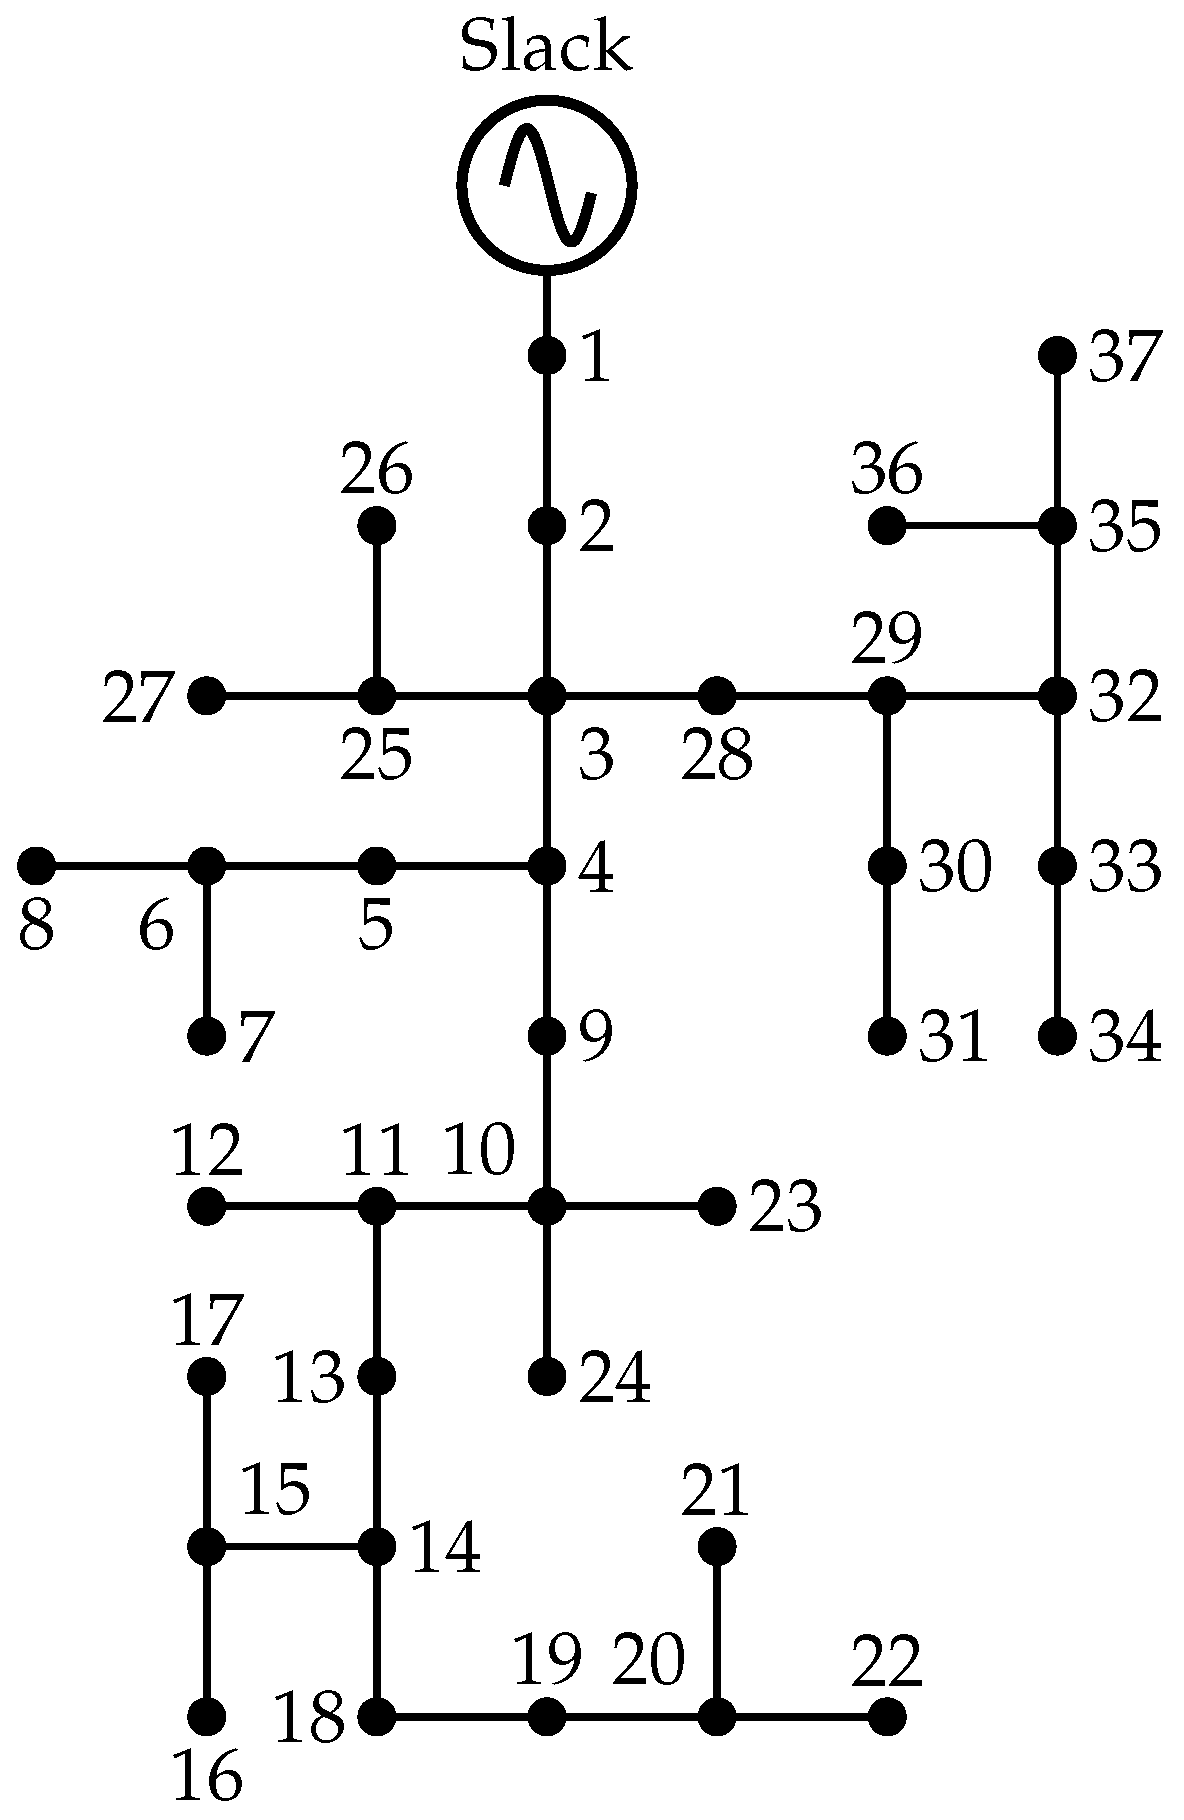
Finally, the numerical results for the 37-node test system are presented in
Table 4. The same information as in the previous two test systems is analyzed. Note that, in this case, there are no results for the convex approximations of the mathematical model.
According to the results, all optimization methodologies significantly reduce power losses with respect to the benchmark case, achieving reductions above 19%. However, the M-MINLP and V-MINLP formulations report the lowest power losses (61.4748 kW for a 19.2563% reduction), highlighting their scalability and robustness, especially in systems with exponentially larger solution spaces ( configurations for the 37-node system). While some metaheuristic techniques (e.g., SSA, ICSA) achieve reductions close to those of our proposal, they rely on stochastic iterative processes, increasing the likelihood of convergence to local optima in complex search spaces.
These results underscore the fundamental trade-off between solution quality and computational guarantees in phase-balancing optimization. Metaheuristic and convex approximation methods can obtain near-optimal solutions, but they lack global optimality guarantees, particularly in large-scale networks where the solution space is exponentially larger ( for the 25-node system and for the 37-node system). In such cases, metaheuristic approaches often fail to fully explore the solution space, leading to suboptimal solutions due to premature convergence or inadequate search strategies.
In contrast, our M-MINLP and V-MINLP formulations leverage exact mathematical programming, ensuring a systematic and exhaustive exploration of all feasible configurations. The combination of interior-point methods with branch-and-cut techniques allows these models to achieve mathematically rigorous and globally optimal solutions, eliminating the uncertainty associated with metaheuristic approaches. While the observed improvements regarding power losses over previous methodologies may appear small (<0.004%), their significance lies in the guarantee of optimality rather than in the absolute gain. This is particularly relevant in the electrical planning of distribution systems, where even small enhancements in efficiency may lead to significant long-term economic and operational benefits.
The practical relevance of these results lies in their scalability to real-world distribution networks. The minimal performance differences between the proposed formulations and the best-performing metaheuristics emphasize the importance of using exact methods in problems of this scale, where precision is critical. Additionally, the results highlight the limitations of metaheuristic approaches in reliably achieving optimal solutions as system complexity increases. This confirms that exact optimization techniques are more suitable for medium-scale distribution networks, where power loss minimization directly impacts operational efficiency and cost-effectiveness.
Moreover, the convergence of all methodologies in the eight-node case validates the robustness of the proposed models. Since the eight-node system has a relatively small search space (279,936 possible phase allocations), all methodologies, including the metaheuristic ones, can effectively explore the feasible solutions and reach the same result. However, as the system size increases, the computational challenges associated with combinatorial complexity become more pronounced, reinforcing the need for exact optimization approaches that ensure global optimality.
Regarding computational performance, M-MINLP consistently outperforms V-MINLP in terms of solution time, being 15.6 times faster for the 8-node system, 4.4 times faster for the 25-node system, and 2.5 times faster for the 37-node system. This difference in efficiency becomes increasingly relevant as the system grows larger. However, given the vast solution space, the computational times remain remarkably short – note that, if one combination were evaluated every 10 ms, it would take over 150 million years to explore all configurations in the 25-node system, as well as billions of years for the 37-node system. These results highlight the efficiency of our approach, demonstrating that global optima can be obtained within practical time frames.
These findings reaffirm the necessity of methodological precision in addressing combinatorial optimization problems involving power systems. The proposed M-MINLP and V-MINLP formulations provide a reliable, scalable, and computationally efficient approach to phase-balancing optimization, laying a solid foundation for future advancement in power distribution network planning and operation.
6.3. Complementary Analysis
To further illustrate the impact of the proposed phase-balancing optimization, this section presents a detailed comparative analysis of system imbalance and voltage profile before and after implementing the optimization strategy. While the primary objective of the methodology is to minimize power losses, the results also demonstrate its effectiveness in reducing system unbalance, which directly influences voltage asymmetry.
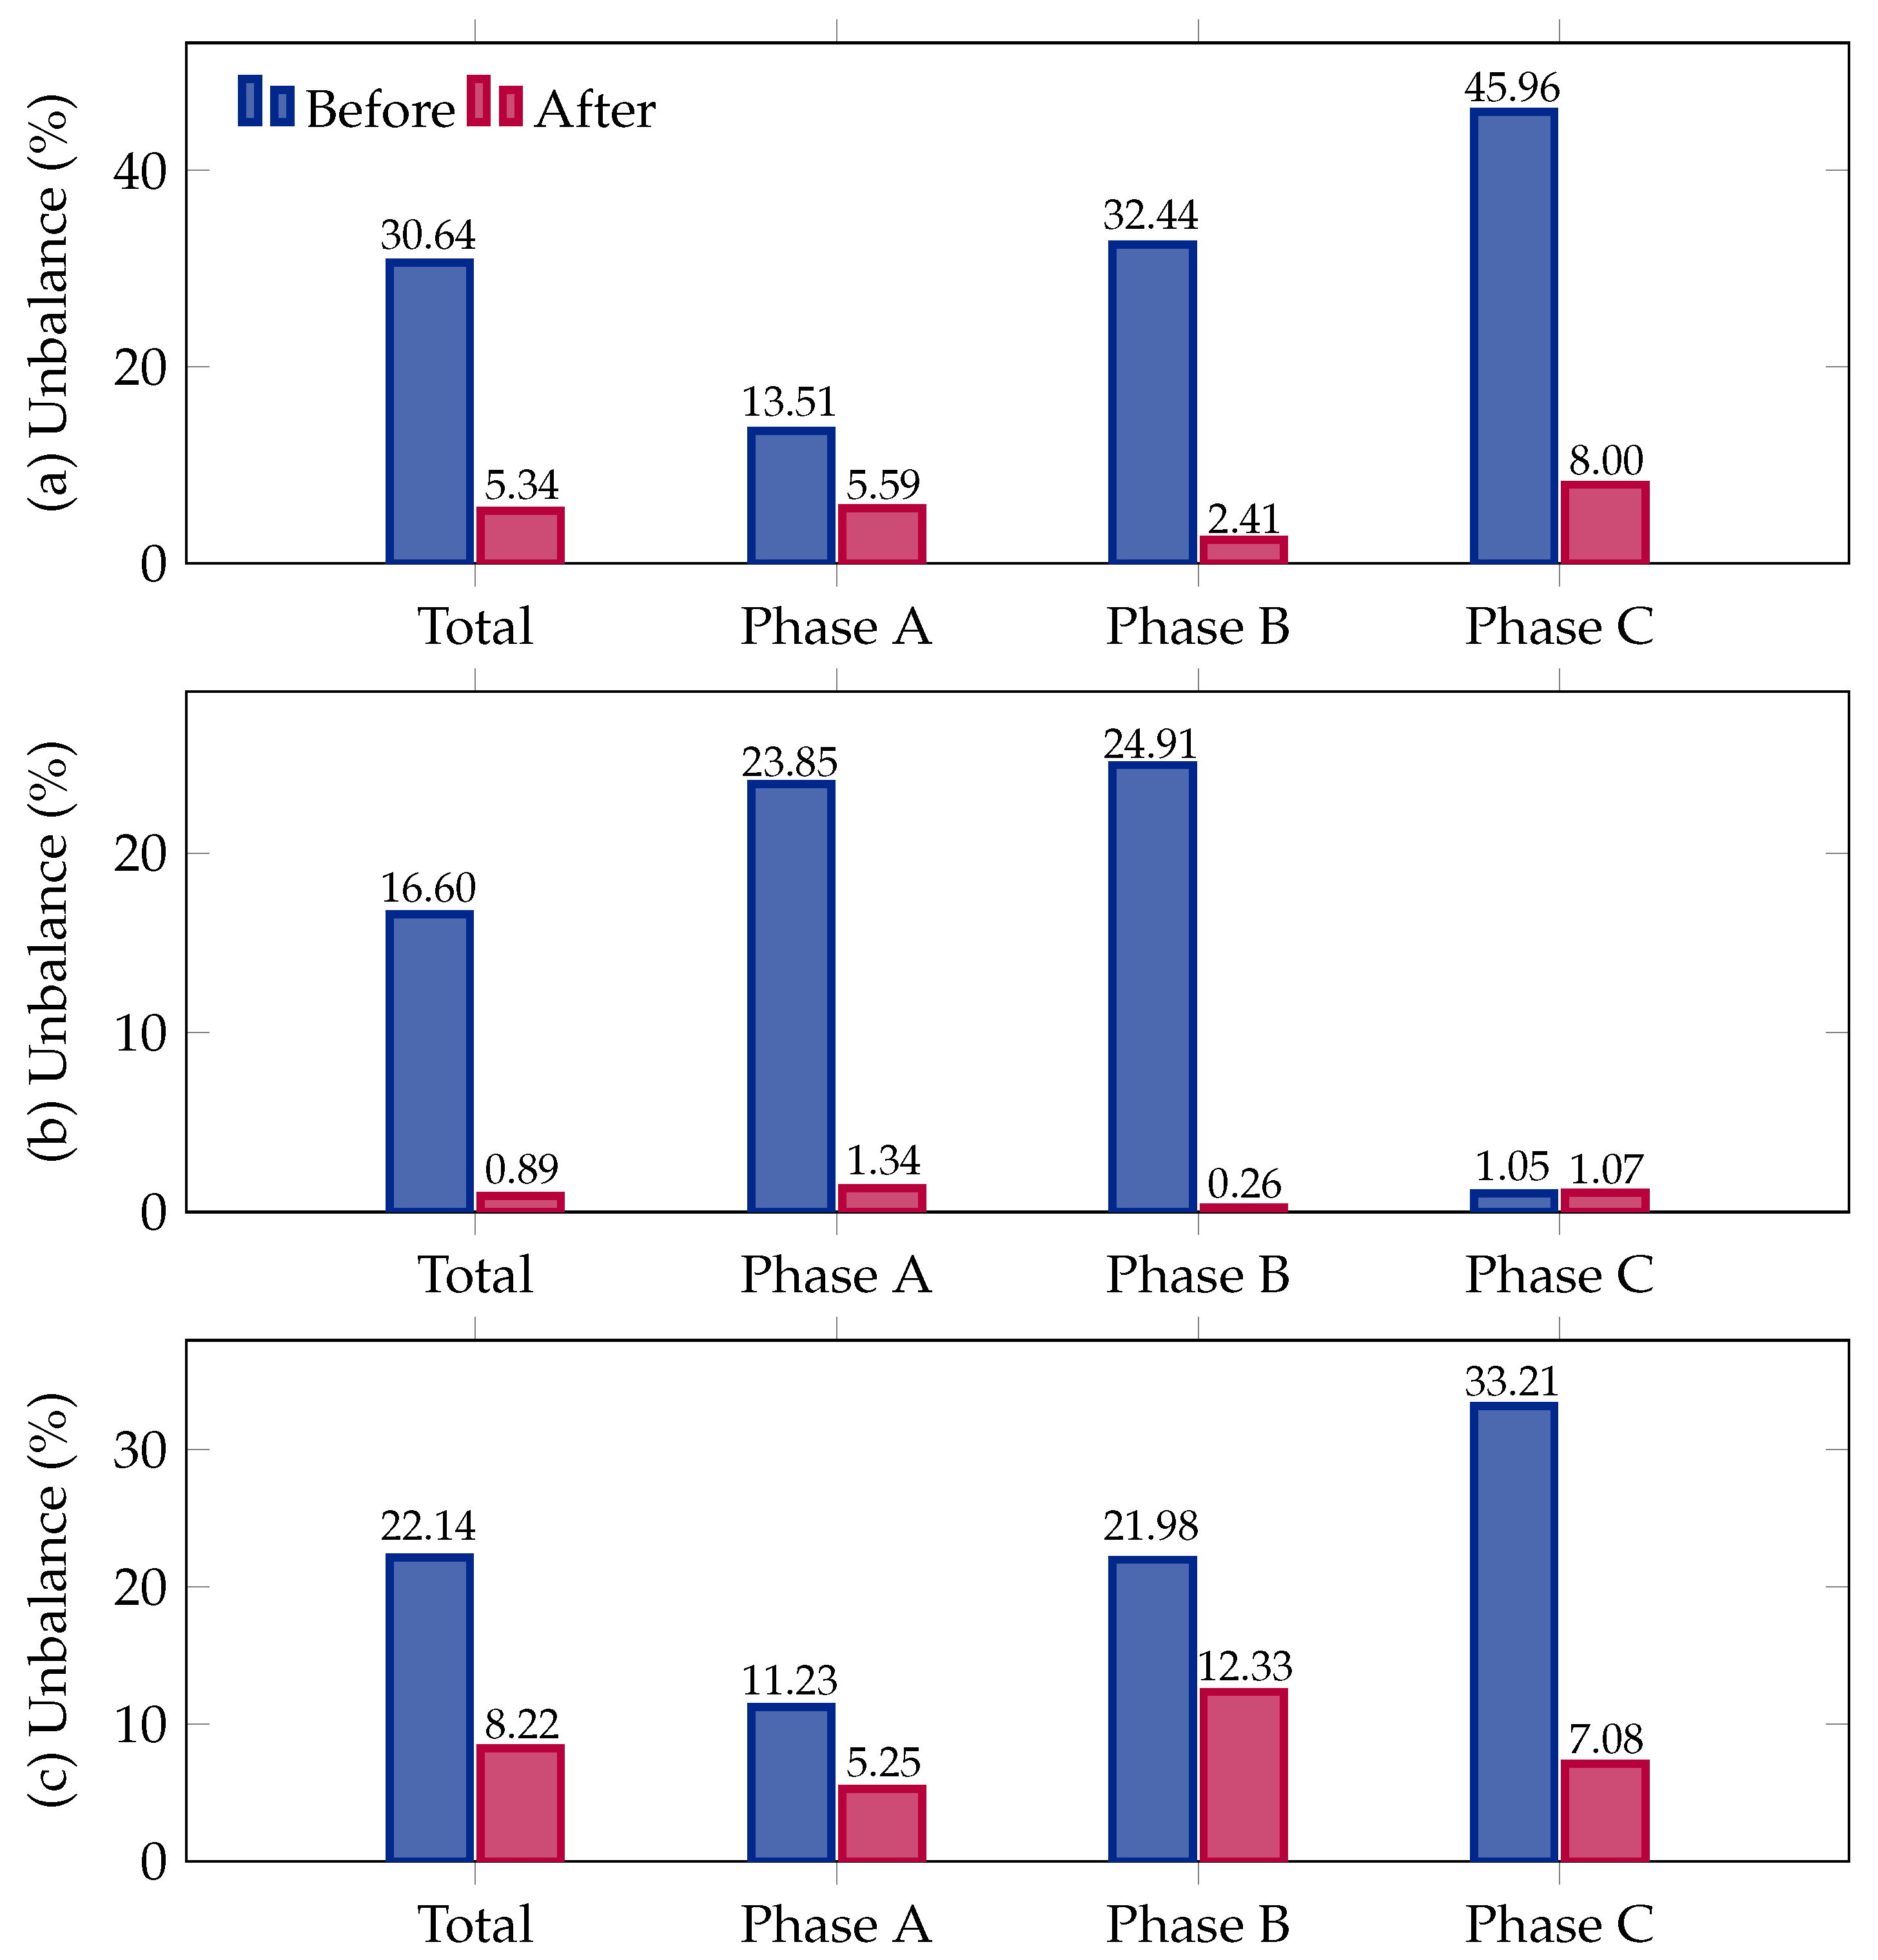
Figure 5 illustrates the percentage of current unbalance before and after applying the proposed phase-balancing methodology across three different test systems: 8-node, 25-node, and 37-node feeders.
The results demonstrate a significant reduction in unbalance, reinforcing the effectiveness of the optimization approach.
The implementation of the proposed methodology results in a significant reduction ub total unbalance in the eight-node system, decreasing from 30.64% to 5.34%, an 82.57% improvement. The phase-specific corrections show notable reductions, particularly in Phase B, where unbalance drops from 32.44% to 2.41%, and in Phase C, where it decreases from 45.96% to 8.00%.
For the 25-node system, the proposed phase-balancing methodology achieves the highest percentage reduction in unbalance, improving from 16.60% to 0.89%, a 94.6% reduction. The largest improvement is observed in Phase B, where unbalance drops from 24.91% to 0.26%, followed by Phase A, which decreases from 23.85% to 1.34%. Phase C remains largely unchanged, indicating that this phase was already well balanced before optimization.
In the 37-node system, the total unbalance is reduced from 22.14% to 8.22%, representing a 62.9% improvement. Phase C exhibits the largest absolute reduction, decreasing from 33.21% to 7.08%, followed by Phase A with a drop from 11.23% to 5.25%. Phase B sees a moderate improvement, decreasing from 21.98% to 12.33%. While some residual unbalance remains, particularly in Phase B, the methodology effectively minimizes phase disparities and improves overall system performance.
The proposed optimization methodology successfully reduces system unbalance, leading to better phase balancing, improved current distribution, and enhanced network unbalance. The results validate the effectiveness of the approach in both small and large networks, demonstrating its practical applicability for real-world distribution systems.
Figure 6,
Figure 7 and
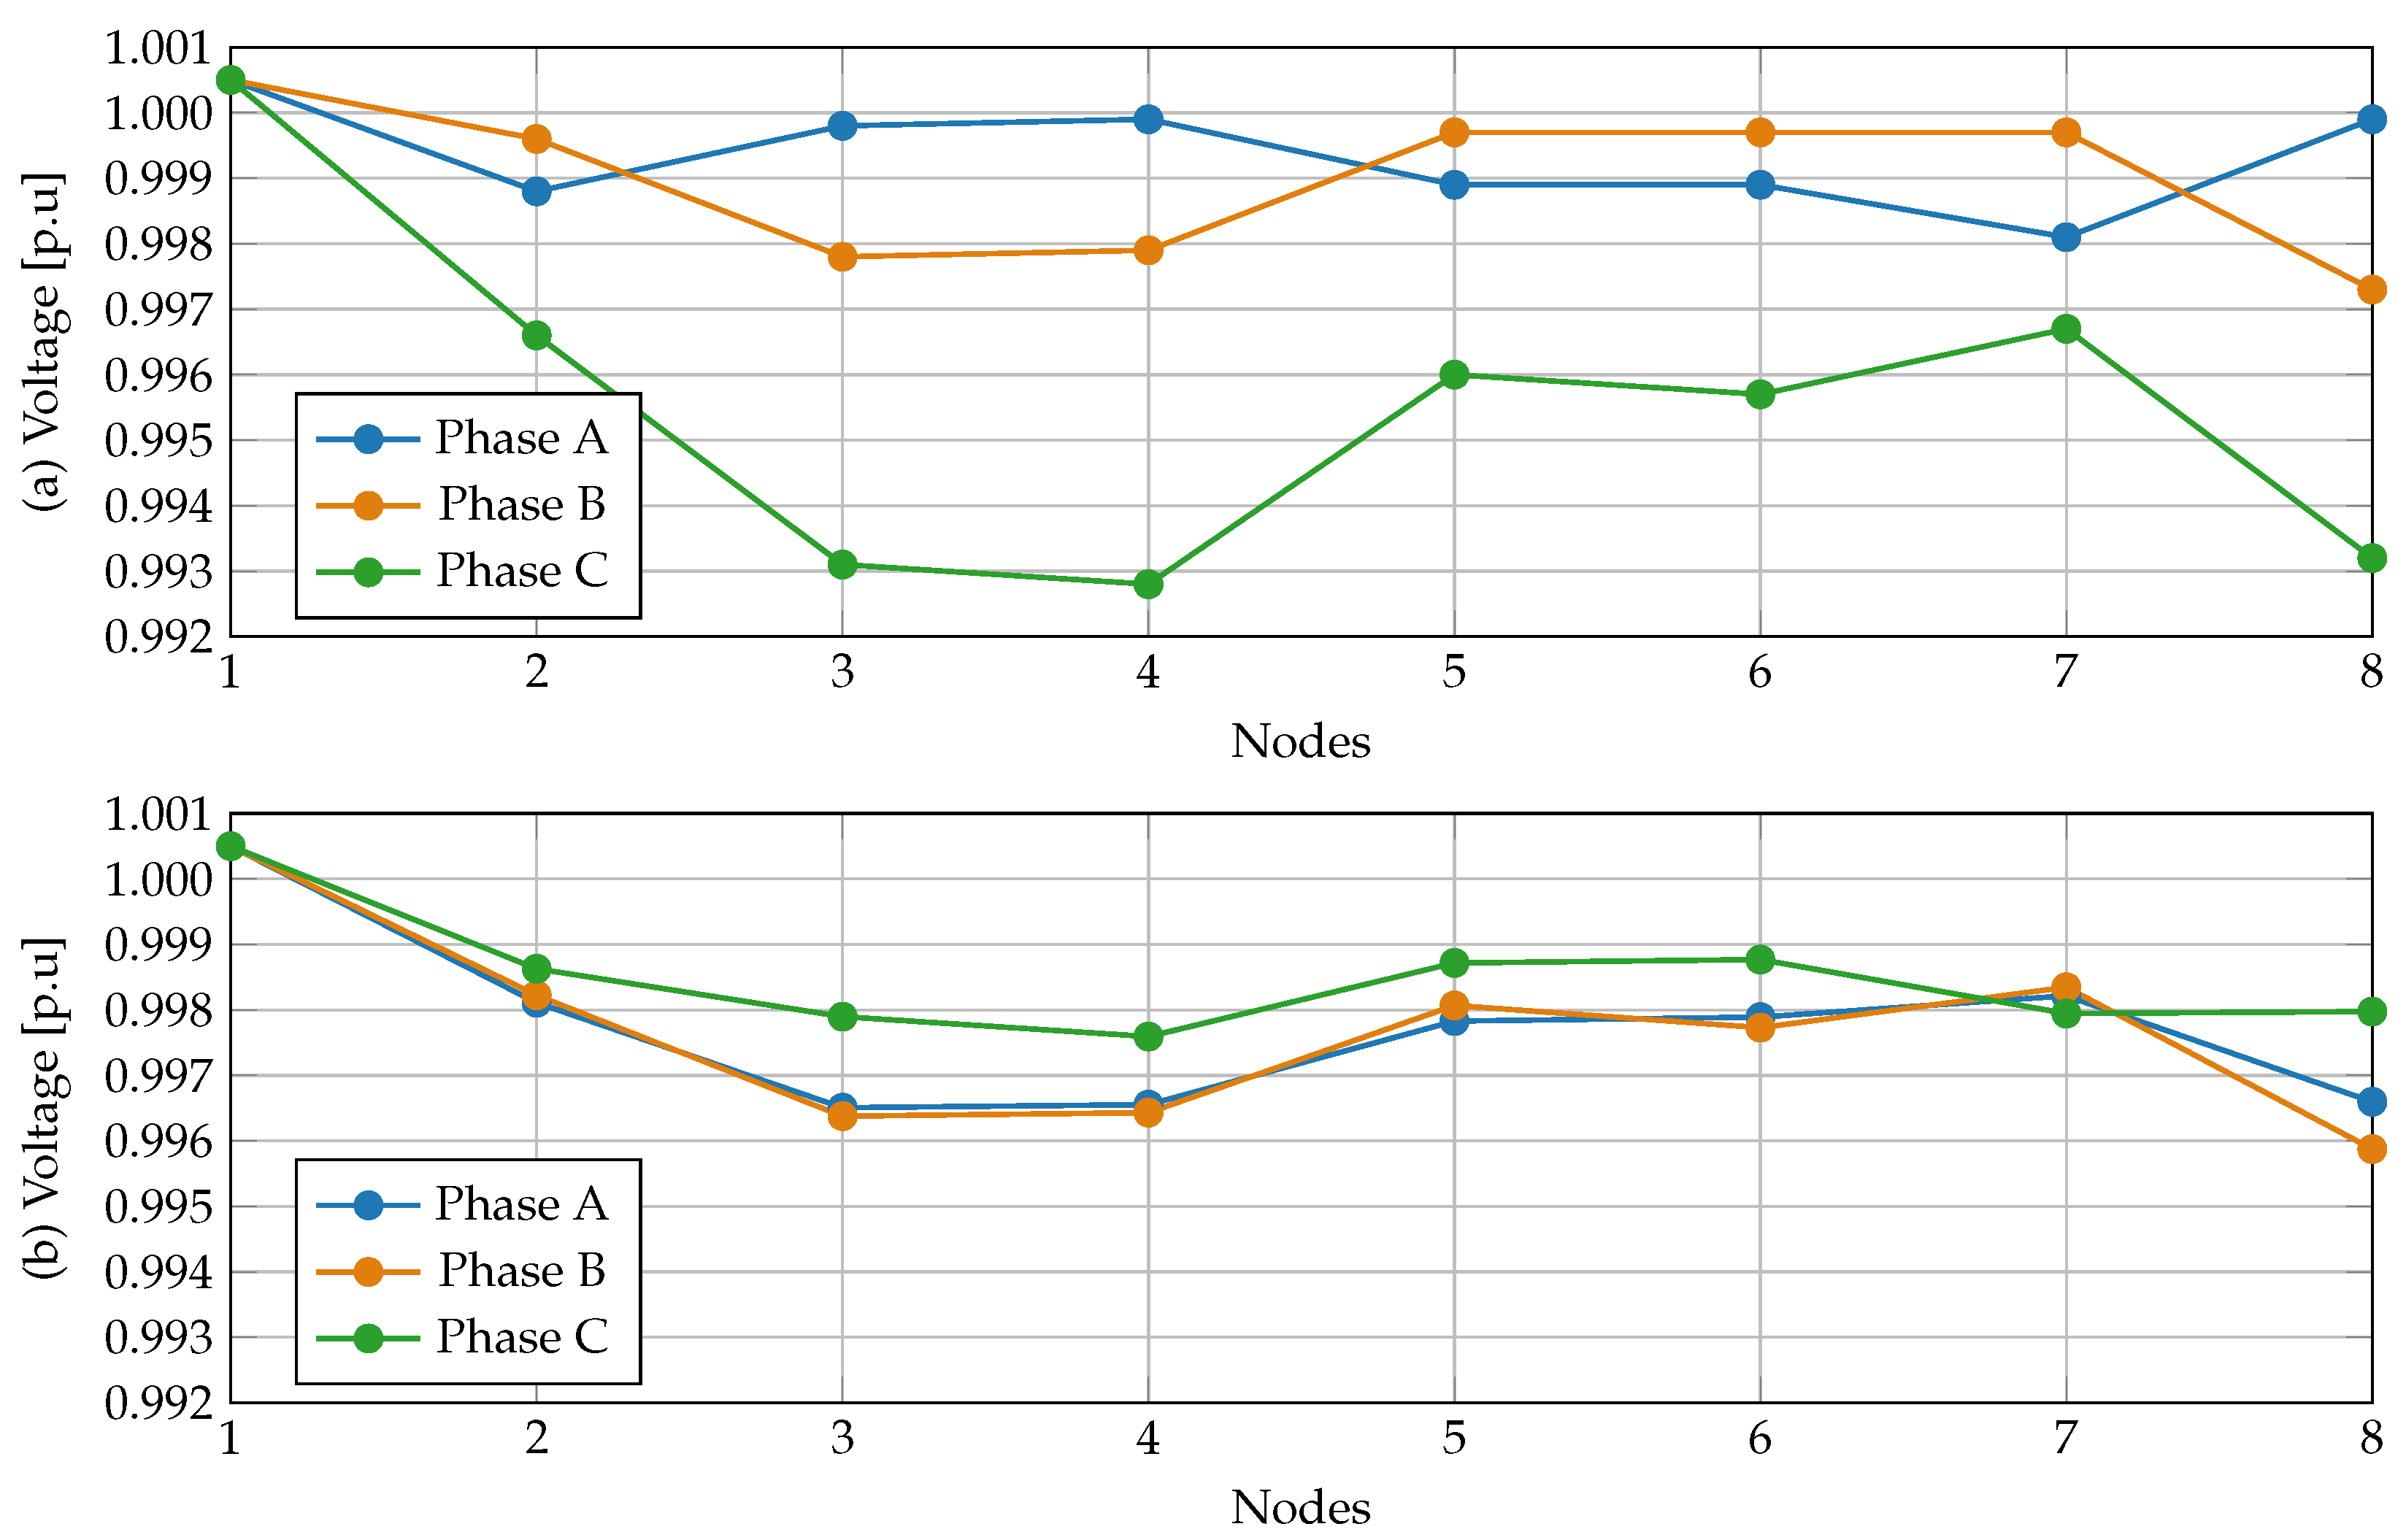
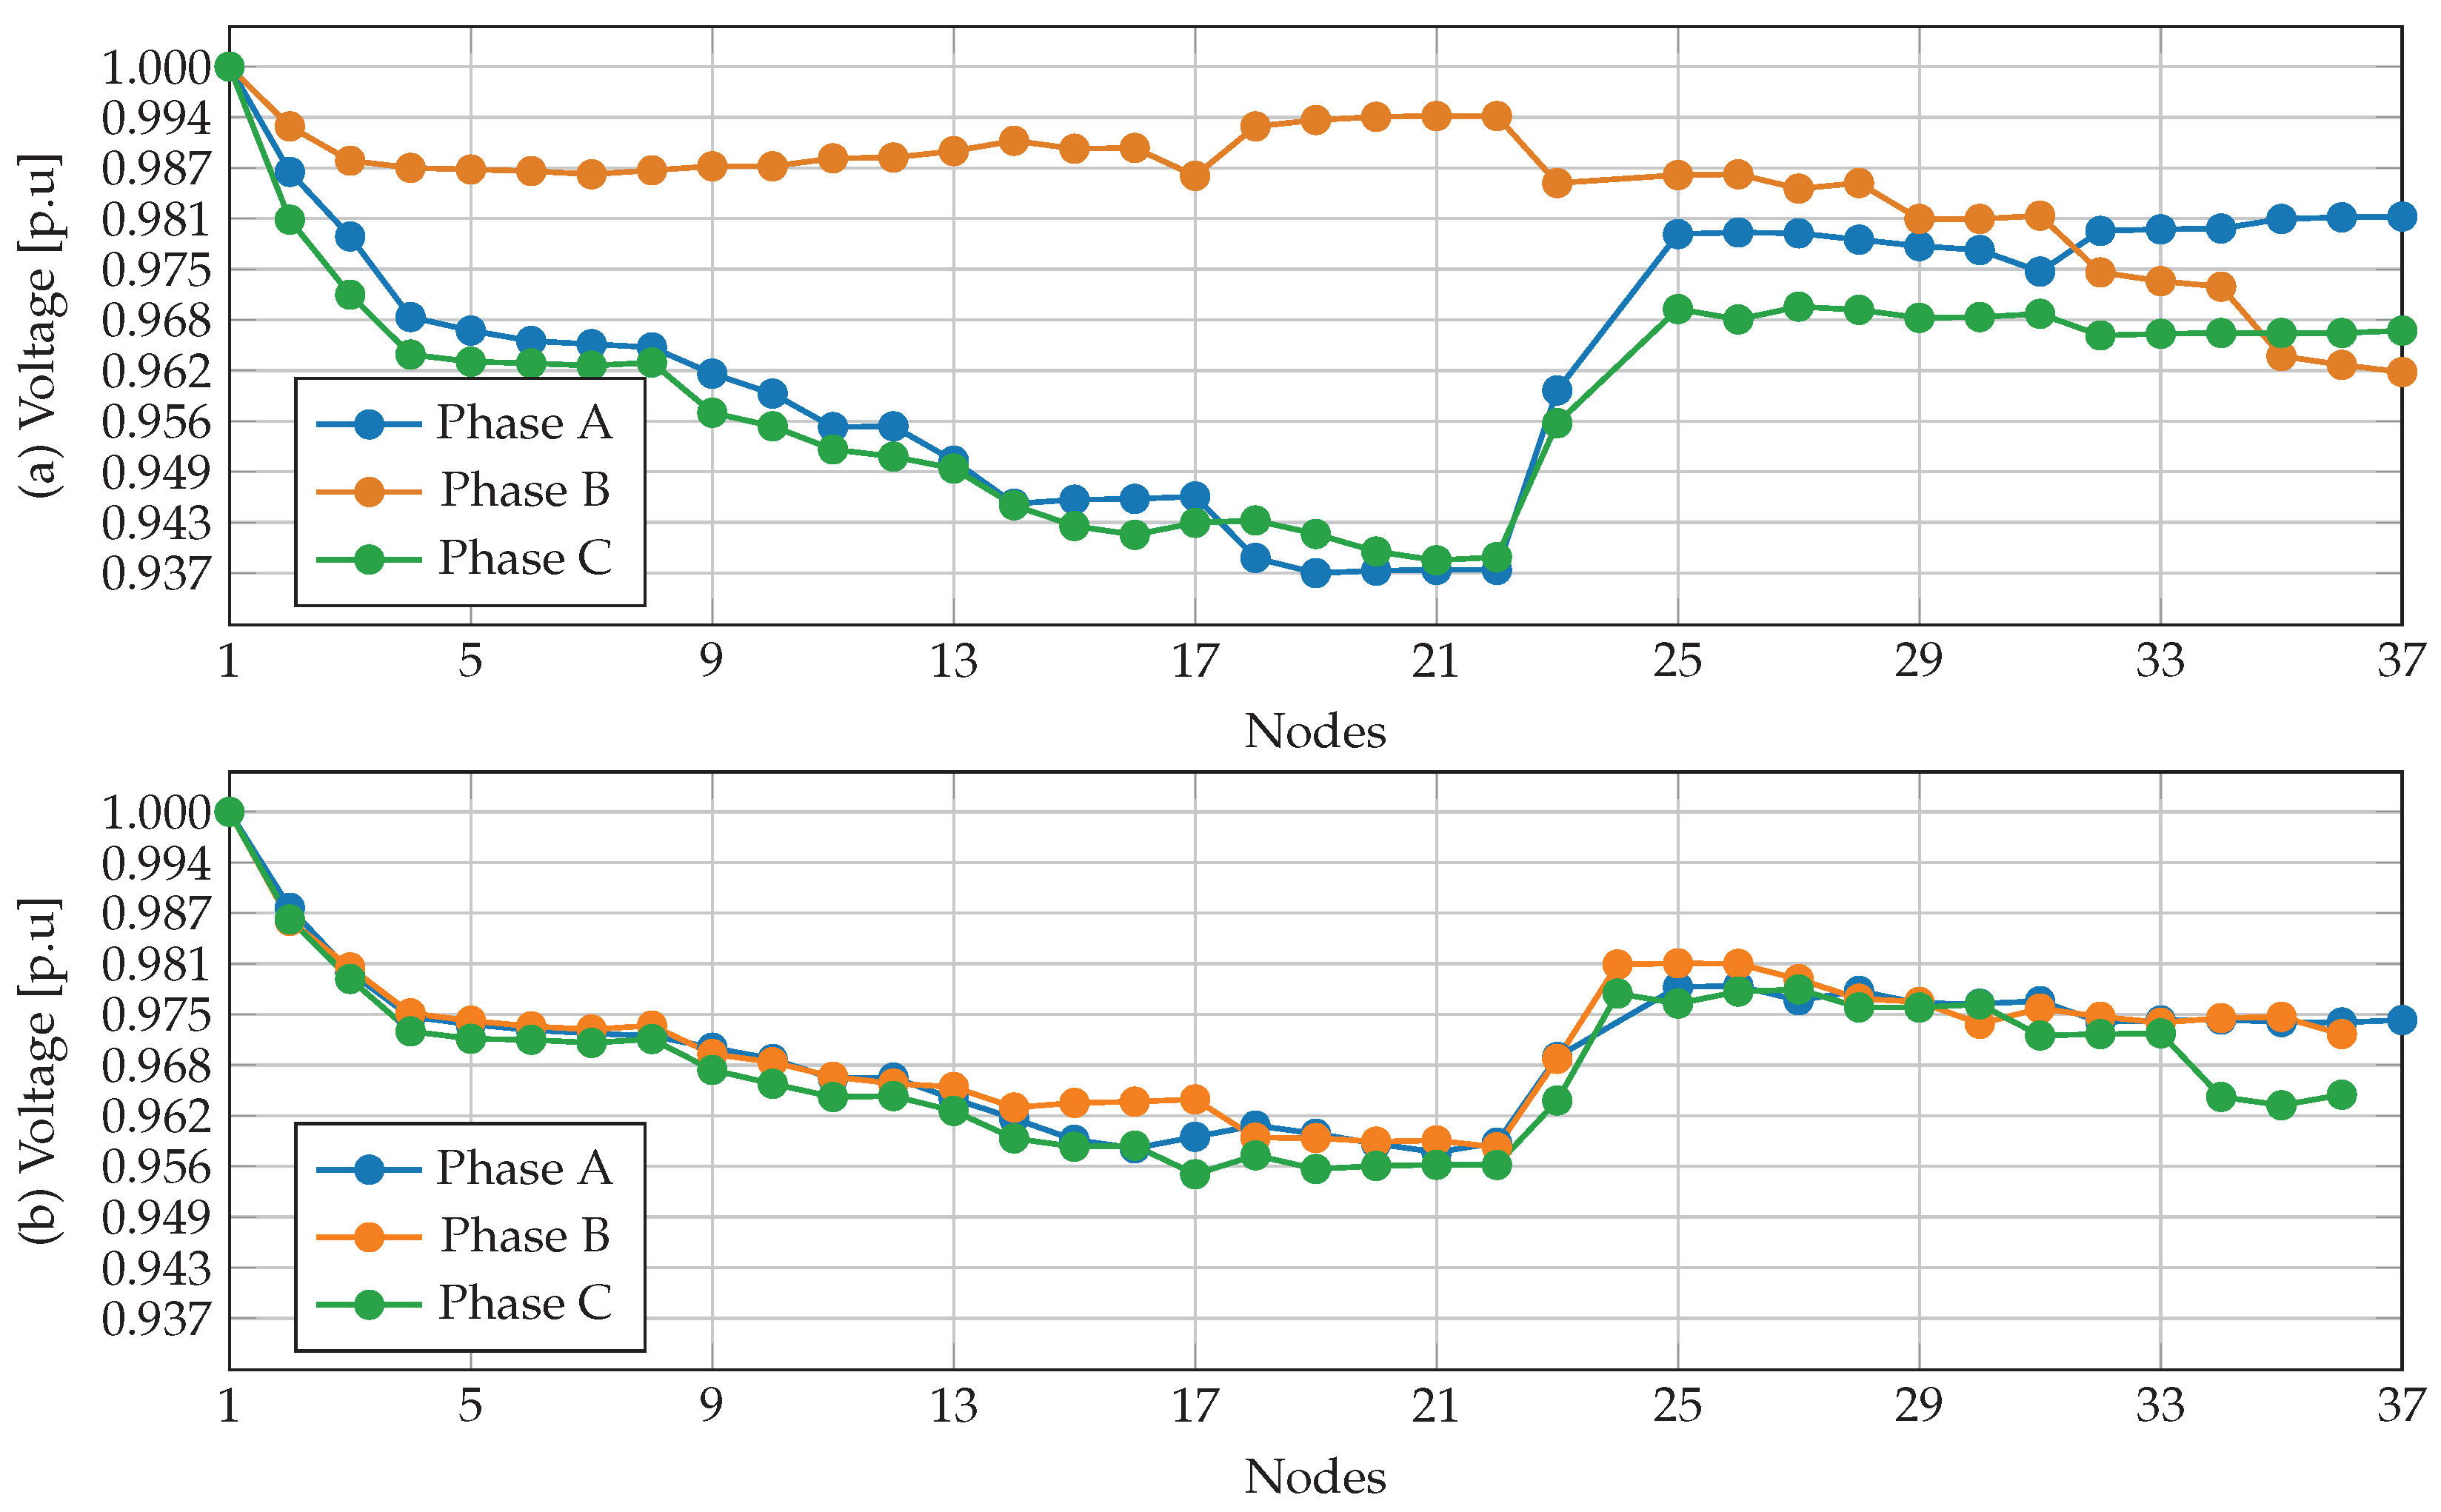
Figure 8 illustrate the voltage profiles for the 8-node, 25-node, and 37-node systems, respectively, before and after implementing the proposed phase-balancing methodology. The results show a notable improvement in voltage uniformity, demonstrating that optimizing phase connections not only reduces power losses but also enhances voltage unbalance across the network.
Figure 6 illustrate that the voltage profile before optimization reveals significant phase disparities, particularly at nodes 3, 5, and 8, where Phase C experiences the most pronounced voltage drop. After phase balancing, the voltage levels across phases become more uniform, reducing phase separation and improving overall voltage symmetry.
Regarding to 25-node test system (
Figure 7), initially, the voltage profile exhibits clear phase separation, especially in the mid-section of the network (nodes 7–20), where Phase A and Phase C show the largest deviations. After applying the phase-balancing optimization, voltage unbalance is significantly reduced, with phase voltages aligning towards a more balanced distribution. This improvement suggests that the methodology successfully redistributes loads, leading to a more stable network with lower phase-to-phase deviations.
Finally, in the 37-node test system, before phase balancing, the voltage profile is highly unbalanced, particularly in the lower voltage regions (nodes 7–30), where Phases A and C experience a notable drop. After optimization, voltage levels become more consistent, with a substantial reduction in phase differences, particularly in critical nodes. The improvements are most evident in the mid-to-late sections (nodes 25–37), where phase voltages align more closely, validating the method’s effectiveness in larger, more complex distribution networks.
The results across all three test systems demonstrate that the proposed phase-balancing optimization methodology effectively reduces both power losses and voltage unbalance. The most pronounced improvements are observed in larger networks, where initial phase disparities were more severe. By minimizing the distribution lines’ current, related to power losses, the methodology naturally mitigates current unbalance, which is the primary driver of voltage unbalance in distribution networks. Since voltage drops are directly proportional to current flow, reducing excessive unbalanced currents prevents disproportionate voltage deviations across phases, leading to a more stable and uniform voltage profile. This confirms that optimizing phase assignments not only enhances network efficiency by reducing power losses but also improves power quality by mitigating voltage imbalance, reinforcing the practical applicability of the proposed approach in real-world distribution networks.
6.4. Computational Complexity Analysis
This subsection analyzes the computational complexity of the proposed M-MINLP and V-MINLP formulations, evaluating their scalability and performance in solving the optimal phase-balancing problem. The computational complexity of these models is influenced by several factors, including the number of binary decision variables and constraints.
Table 5 and
Table 6 characterize the mathematical model according to these factors.
Table 5 and
Table 6 provide a detailed characterization of the variables and constraints of the M-MINLP and V-MINLP models, allowing for an analysis of their computational complexity. In terms of variables, the M-MINLP model introduces more binary constraints (
) by using a matrix representation for phase configuration, whereas the V-MINLP model employs a vector representation with fewer binary constraints (
) but with a larger number of possible combinations in the optimization process.
In the M-MINLP formulation, the connection for each node is not modeled using a simple binary variable to indicate whether a load is connected to a specific phase; instead, it is represented through a rotation matrix (
Table 1). Each node has three binary variables per phase, corresponding to each position within the matrix, and additional constraints, i.e., Equations (
10) and (11), are imposed to ensure that only one of the six possible matrices is selected. This approach accurately models the cyclic rotation of phases, which is essential for optimizing the load balance. By fixing a reference phase at each node, the valid options are reduced to only two in order to satisfy Constraints (
10) and (11). For example, if the model fixed the first position to phase A at node 2, the only valid options would automatically be
(ABC) or
(ACB). Thus, the model scales with a complexity of
.
In contrast, in the V-MINLP formulation, each node utilizes a vector of six binary positions, where only one can take the value of 1 i.e., Equation (
13). This means that each node has six independent phase connection possibilities, resulting in an exponential growth of
. This greater flexibility translates into a more aggressive exponential growth compared to M-MINLP, making this approach less computationally efficient for medium-sized and large networks. Therefore, M-MINLP is a more suitable option for larger-scale networks, as its more restrictive structure allows for a more efficient exploration of the solution space. Meanwhile, V-MINLP may be preferable for small networks, where the flexibility in phase allocation does not impose a prohibitive computational burden.
In this regard, the main difference between the proposed formulations lies in the mathematical representation of the load connection model. To facilitate the understanding of the results presented herein, the following comparison table is included:
Table 7 compares the M-MINLP and V-MINLP formulations in terms of their number of variables, constraints, computational complexity, and efficiency. Note that M-MINLP introduces a slightly higher number of variables (
vs.
) and has more constraints (
vs. 1
). In terms of complexity, M-MINLP scales with
, which is significantly better than the
scaling of V-MINLP. This explains its high efficiency in large-scale networks. Although both models ensure global optimality, V-MINLP incurs a higher computational cost, making it more suitable for small or medium-sized networks. In this sense, M-MINLP is a more efficient option for large distribution systems, whereas V-MINLP offers greater flexibility in phase allocation, albeit at the expense of a higher computational burden.


