Review

Identification of Potential Barriers to Electric Vehicle Adoption in Oil-Producing Nations—The Case of Saudi Arabia

Faculty of Engineering, The University of Nottingham, Nottingham NG7 2RD, UK
*
Author to whom correspondence should be addressed.
Electricity 2022, 3(3), 365-395; https://doi.org/10.3390/electricity3030020
Submission received: 9 June 2022 / Revised: 25 July 2022 / Accepted: 8 August 2022 / Published: 12 August 2022
(This article belongs to the Special Issue Electromagnetic Compatibility in Power Systems and Smart Cities)

Abstract

:
Electric vehicles (EVs) are important elements in the global strategy to tackle climate change; however, research often fails to sufficiently identify the range of barriers which affect their adoption. Taking Saudi Arabia as a case study, this paper analyses responses from 698 potential drivers in order to identify and rank the infrastructure, performance, financial, social, and policy barriers to EV adoption in a major oil-producing nation with a hot climate and a desert terrain. According to this study’s findings, the most important barriers in this context are the lack of charging infrastructure and the additional load placed on the national grid, while others include the safety and effectiveness of batteries at high temperatures, and the ability of EVs to perform in desert conditions. Common themes also include concerns that EVs may damage Saudi’s oil-based economy, cost of purchase and maintenance, low resale value, and the absence of awareness about EVs. The study concludes that EV manufacturers must demonstrate that their vehicles are suitable for the Saudi climate. Governments should also provide subsidies, or other incentives, to promote adoption of EVs as the study also found that variations in the cost of different EV models in Saudi Arabia, for example, the Tesla Model 3, is up to 40% more expensive to own than a Toyota Camry, mean that owning EVs can cost significantly more than small sized internal combustion engine-based vehicles (ICEVs). This paper identifies and ranks the barriers to EV ownership in a desert nation which is a leading petroleum producer and compares the relative costs of EVs and ICEVs in the country. As such, it has immediate relevance in countries with similar economic, geographic, and climatic conditions.

1. Introduction

The principal cause of global warming is recognized as greenhouse gas (GHG) emissions, predominantly from burning fossil fuels [1]. In 2019, over a quarter of the EU’s GHG emissions were caused by transportation [2]. As the transportation sector is responsible for a considerable proportion of these emissions, sustainable transportation must be a part of any climate change mitigation strategy. Electric vehicles (EVs) are widely considered to be more environmentally and economically efficient than internal combustion engine-based vehicles (ICEVs), and as the technology matures and availability increases [3], governments around the world are beginning to phase out ICEVs and promote EV adoption; for example, the UK has recently legislated to end the sale of new petrol and diesel cars by 2030 [4]. However, while research to date has addressed the modelling, evaluation, or presentation of new EV methods or technologies, the end-user’s perspective has largely been ignored [5], despite the fact that the widespread adoption of EVs will depend on meeting consumers’ economic, social, and environmental demands.
This study foregrounds potential end-users’ requirements in respect of EVs and identifies the key technical, social, financial, infrastructure, and policy barriers to their widespread adoption, using Saudi Arabia as a case study, since, according to Chidambaram [6], limited adoption of EVs in developing countries is a matter of concern. In doing so, it builds on a previous paper which explored ICEV drivers’ perceptions of EVs and the factors they found most attractive [7], with particular reference to the Saudi context. The Kingdom of Saudi Arabia (KSA) presents an interesting context within which to examine end-users’ perceptions of EVs and the barriers to their widespread adoption. The country has long been a major producer of oil, but it now has ambitious plans to reduce its GHG emissions, with the aim of achieving net-zero by 2060 [8]. This will require much greater use of public transport and the widespread adoption of EVs [9,10], and the country aims to become a regional hub for EV manufacturing [11]. However, EVs are currently unavailable for purchase in the Kingdom, although they can be imported, and there has been scant research into how end-users perceive them, or the challenges to their widespread adoption. The need for such research has recently become more pressing. In May 2022, Lucid Motors, a US EV manufacturer, announced that it will begin constructing manufacturing facilities in the Kingdom, with a capacity of 155,000 electric vehicles [12]. As part of the deal involves the Saudi government committing to purchase 100,000 vehicles over a ten-year period, there is an increasingly urgent need to understand how potential users in the country view EVs and the nature of the barriers to their widespread adoption. In exploring these issues and identifying both general barriers (applicable in most contexts) and local barriers (applicable in similar cultural and geographical contexts), this study will inform the development of public policy to encourage drivers to adopt EVs, thereby serving the strategic imperatives of sustainable transport and development and promoting the related social and environmental values.
In order to achieve this aim, the paper addresses the following research questions to explore the relationship between potential users’ perceptions of EVs and the barriers to their widespread adoption:
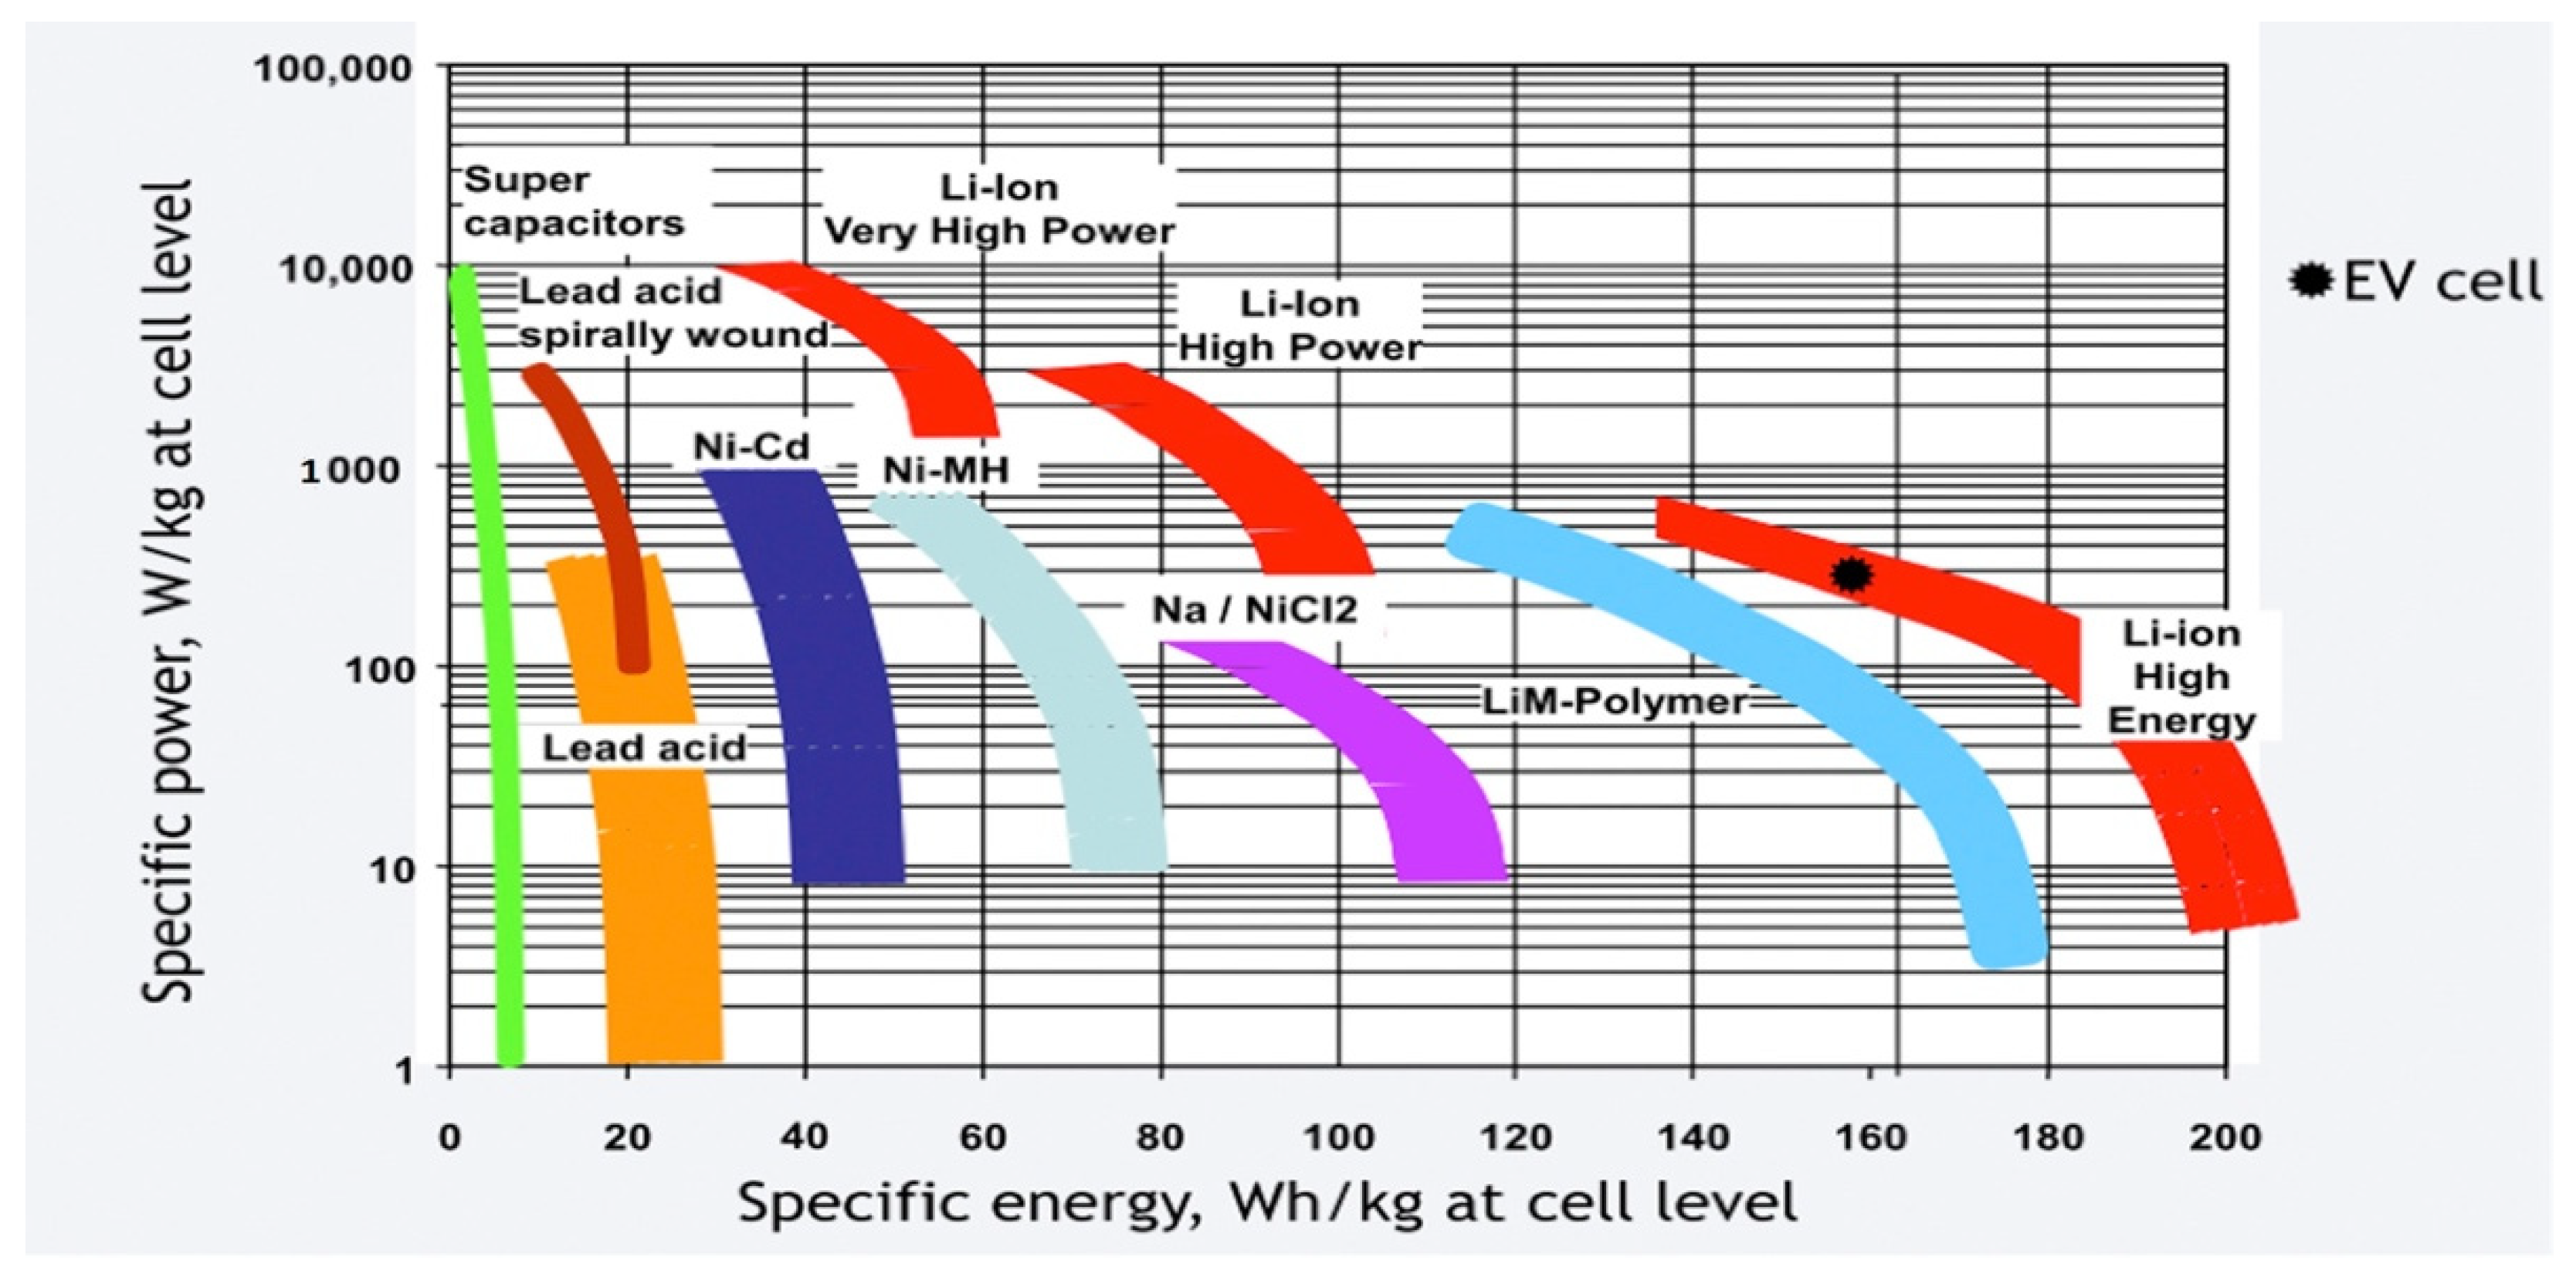
  • RQ1: What are the salient characteristics of EVs and what is their potential for strengthening EV acceptance?
  • RQ2: To what extent are EVs perceived as economically, socially, and environmentally beneficial compared to ICEVs in Saudi Arabia?
  • RQ3: What are the main barriers to widespread EV adoption, which ones are regarded as most significant by potential users, and are they nationally, regionally, or internationally applicable?

2. Literature Review

Electric vehicles can be up to four times more energy efficient than those with internal combustion engines [13]. Therefore, EVs are considered a more sustainable alternative to ICEVs for future mobility needs, and countries are starting to invest more heavily in their manufacture, notably China, the global leader in car production [14]. However, even the most advanced current EV technologies have many limitations, including limited ranges, long recharging times, short lifespans of components, high costs, and some safety concerns, and these issues must be addressed if EVs are to be widely accepted. In addition, although EVs have a strong potential for reductions in transportation-related carbon dioxide (CO2) emissions, which is estimated at 17–34% of those from ICEVs [15,16], Malmgren [5] warns that people sometimes misunderstand the benefits of EV usage and that currently there are inadequate cost–benefit analyses. This paper therefore begins by reviewing published papers, policy statements, and other research to identify the key elements associated with EVs and whether they act as incentives or barriers to widespread EV adoption. These include charging infrastructure, available energy and grid resources, national transport strategies, geographical considerations, and economic forces (at the national level), energy management systems, batteries, and autonomous features (at the vehicle level) [17], maintenance costs and fuel savings (at the individual level), and wider social benefits related to development, the environment, health, and national security.

2.1. Key Factors Associated with EVs

There have been many studies of the factors influencing potential EV users and the importance of taking their views into consideration. For example, according to Funke [18] the share of electric taxi fleets in Karlsruhe, Germany, could increase by up to 45% if taxi users’ perspectives were considered. Meanwhile [19] suggests that knowing customers’ needs and segmenting buyers by range requirements is critical, rather than presuming that all drivers need currently expensive large batteries. In terms of adoption, [20] concludes that EVs are more attractive to consumers with high annual mileage in Germany, while [21] finds that the high purchase price and high battery costs are the most important factors affecting EV adoption in China. However, Singh [22] concludes that policymaking is the most influential factor in terms of influencing the rate of EV adoption since it can directly affect customers’ intentions to purchase an EV. In regions, such as Japan and California, US, for example, long-term government subsidies encourage drivers to switch to EVs [23], and many studies have found that the development of EV infrastructure enhances acceptance of EVs, something which requires policy support [22,24]. Such factors are expected to influence the perceptions of potential EV users in Saudi Arabia and other petroleum producing states, and these are discussed in more detail below.

2.1.1. Charging Infrastructure

Charging infrastructure is a key issue in relation to EV adoption, and Tie [25] recommends the building of a comprehensive nationwide charging infrastructure to precede the introduction of EVs. This is a particular issue in the context of Saudi Arabia, a relatively large country (at over 2,000,000 km2) [26] with a desert climate. The long distances between cities and the heavy use of air-conditioning drains batteries more quickly, and Saudi drivers report feeling ‘range anxiety’ [27], so charging stations are needed on all main roads. An optimal solution would be the formation of isolated microgrids supplied by renewable energy, with diesel backup [27].

Charging Stations

Numerous studies have found that a lack of infrastructure has a direct impact on consumers’ intentions to purchase an EV [22,28,29]; this not only affects market sales, but it has also risen to the top of the list of arguments against the spread of EVs [30]. Research indicates that an increase in public charging infrastructure development leads to an increase in EV sales; however, in the early stages of the EV market, private charging options, such as home or workplace charging, have also proven to be significant [31]. Moreover, lower total expenses associated with household charging unit installation and vehicle operation would significantly enhance customer behaviour towards and perceptions of EVs [6].

Repair and Maintenance Workshops

According to [32] the absence of EV repair centres and workshops compared to those for ICEVs has disappointed current EV owners. For example, a study in Denmark [33] found that the fact that EV technology is still new means that relatively few workers are qualified and trained to fix EVs, so even simple repairs are costly and more complex repairs may take several months.

Effect on the Electricity Grid

EVs consume a high amount of real power in a short period of time due to the non-linear nature of their loads, and this can cause instability in the power networks [34]. Overloading of charging may also affect aspects of the grid and distribution network, depending on driving and charging behaviour, so EVs can have a significant impact on the power network’s load curve [35]. The KSA generates an estimated 362 TWh of electricity, mainly from crude oil and natural gas, [36]; however, demand can exceed supply in the hot summer months, and the widespread adoption of EVs will place additional burdens on an overstretched grid. In addition, as less than 1% of electricity comes from renewable energy resources [36], this may also increase GHG emissions unless steps are taken to further develop renewable electricity production.

2.1.2. Vehicle to Grid Technology

Storage of energy is also an issue for EV adoption; however, the increasing global uptake of EVs facilitated by technological advances, such as cheaper batteries, has initiated new business models to exploit the potential of EVs for electric storage. V2G technology is one such development, and it enables EVs to be charged and to return stored electricity to the grid through a connection to a domestic, commercial, or public charging station [37]. Vehicle batteries are charged at a low tariff when demand on the grid is low and excess unused power is available, then partially discharged at a higher tariff during peak demand, when the grid is short of supply, allowing owners to make a profit [38]. V2G thus offers cheap, flexible, and fast-responding storage [39] and also incentivizes EV owners to participate in charge/discharge systems.
According to Weiller and Neely [40], V2G has both short- and long-term potential benefits. The former includes residential applications, such as vehicle-to-home for smart home systems, and it is significant to note that Tesla has promoted its EVs as central to the ‘self-powered home’, in which they are integrated with solar panels and a so-called Powerwall [41]. The long-term benefits include potential reductions in GHG emissions (around 13,429 kg CO2 per year with self-sufficiency of 99.1% and net metering) and reduce per-unit electricity prices by up to 12% [42]. In addition, as Tesla’s move suggests, continued technological innovation and development of V2G systems, alongside shorter battery response times, will potentially be enhanced by integration with solar photovoltaics, among other options [43].
The development of this technology is currently constrained by inadequate infrastructure, battery degradation, and low consumer awareness. For example, grid-scale uses of EV batteries for storage and V2G applications are unlikely to be deployed in the short-term because EV adoption rates do not yet justify new control architectures being implemented. However, studies of consumer acceptance of V2G have identified key institutional and policy factors as including incentives to EV consumers, such as direct subsidies, emission-based taxes, provision of charging infrastructure, and free parking. Developments in battery capacity, driving range, and in the purchase price of EVs are discussed below.

2.1.3. EV Batteries

Lithium ion batteries (LIBs) are used for EVs and grid storage applications because of their superiority to conventional lead–acid or nickel–cadmium batteries in terms of energy density, specific power, cost, safety, cycle life, and calendar life. An LIB stores chemical energy during charging and converts it to electrical energy while discharging, and an EV carries LIBs in groups connected as modules, which are joined together to form a complete battery pack. Each module has the circuits for a thermal management system and the whole pack is used to power the motor which propels the EV [44]. The power density, cycle life, cost per kWh of energy, and calendar life correspond to the energy requirement of the battery system. However, the range and the battery capacity of an EV are not linear; the weight of the battery pack increases with an increase in capacity, which adversely affects the efficiency of the vehicle on the road. It is therefore important to compare batteries and battery systems based on energy and power densities, rather than on range requirements. Different battery technologies and their specific energy and specific power ratings are shown in Figure 1 [45].
Car manufacturers rarely make the batteries they use, although Tesla has its own battery manufacturing plant, and battery cell production is largely concentrated in the USA, China, Japan, and South Korea, details are shown in Table 1 [46,47,48,49].

Driving Ranges and Charging Times

One of the main challenges associated with battery electric vehicles (BEVs) is the limited capacity and driving range associated with the batteries and their cost. The battery capacity of many current models limits their driving range to 250 km, although some new models offer ranges of up to 400 km, and upcoming models are predicted to range beyond this [50]. Consumers are also concerned about the cost of batteries. In 2015 this was approximately USD 350/kWh, making the cost for a battery capacity of 40 kWh as much as USD 14,000, meaning an EV would cost at least USD 12,000 more than a similar ICEV [50]; however, it is estimated that these will decrease to around USD 112/kWh by the end of 2025 [51]. It is important to recognize that real-world driving ranges will not be the same as the rated (or manufacturers’) range, as factors, such as driving conditions and drivers’ skills, will affect vehicle efficiency. Thus, the time taken to charge an EV is also a significant consideration. Table 2 [47,52,53,54] lists some of the most modern EVs, their rated and actual driving ranges, and their battery charging times.
From Table 2, the shortest attainable rapid charging time is 22 min for the Tesla Model 3, while most other modern EVs can be rapidly charged fully within 45 min. Among these, the Tesla Roadster has the longest range, at 965 km, with a real-world range closer to the rated range than other EVs. The length of time it takes to recharge an EV depends on the type of charger used, with the fastest chargers costing the most. There are currently three main types of chargers, AC level 1, level 2 and DC fast chargers, and their key performance details are shown in Table 3. AC level 1 EV supply equipment delivers charging through a 120-volt AC plug and provides a range of about 2–5 miles per charging hour, while AC level 2 equipment is capable of charging through 208–240-volt electrical supply, and it can be installed at home or as a public charging point. This provides 10–20 miles per charging hour; however, as the charging time for a 24 kWh battery pack is around 8 h, an EV should be fully charged at home when 240-volt services are available [55]. Next, 480-volt direct current (DC) fast charging equipment provides charging in around 30 min, but these are only available at public stations and cannot be installed in residential buildings for safety purposes. Globally, there are three types of DC charging systems: Type 4 CCS/COMBO (Combined Charging System), Type 4 CHAdeMO, and Tesla dual single-phase AC and DC charger [56]; however, only the Japanese CHAdeMO standard chargers (used by Nissan, Mitsubishi, and Kia), are currently fitted with V2G technology [57].

Battery Lifespan

Competition with conventional ICEVs requires EVs and their batteries to run reliably for 10–15 years under various climatic conditions and duty cycles. The main factors limiting battery lifetime are time at high temperature, state of charge (SoC), cycling at high depth of discharge (DoD), and C-rate [59]. While time at high temperature may not be regarded as a significant factor within Western European or North American contexts, it takes on much greater importance in the Saudi context, where summer temperatures average 45 °C [60]. The life cycles of some commonly used energy storage batteries and their characteristics are listed in Table 4 [61]
Charging is most efficient when the battery has low charge or SoC, while charge acceptance slows towards saturation. Charging efficiency also depends on temperature and SoC. As the battery ages, internal resistance increases, and the charge rate slows. An SoC above 80% promotes capacity fade, while keeping the lithium ion at high SoC affects lifetime more than cycling at mid-range SoC [62].

2.1.4. Weather Conditions and Terrains

Research suggests that the performance of an EV varies considerably according to the climate and terrain in which it is driven. For example, [63] found that the driving range in mountainous terrain was less than the manufacturers had estimated. In addition, the thermal behaviour of lithium ion batteries is adversely affected by extreme heat, with both charging efficiency and life cycle significantly reduced when battery temperature exceeds 50 °C. For example, the Nissan Leaf’s battery capacity was found to deteriorate when tested in the heat of Arizona in the US [64]. Saudi Arabia has a desert climate with extremely high temperatures in the summer, reaching an average of 45 °C [65], and mountainous regions in the west and southwest, and this could raise doubts about the suitability of EVs, negatively impacting their quick adoption, at least in the short-term.

2.1.5. Safety of EVs

While there are risks with any motorised vehicle, the risk of fire and other hazards associated with lithium ion batteries are particularly serious in EVs for a variety of reasons; these include high demands in terms of driving performance and charging speed, the resulting increasing scale and energy density of battery packs, and unavoidable traffic accidents [66]. There is an additional risk that burning lithium ion batteries may release toxic gases as a result of their high heat rate [66]. Concerns around the risks associated with fires due to batteries overheating are likely to be exacerbated when external air temperatures are already high, as is the case in the KSA.

2.1.6. Environmental Benefits

EVs have the potential to play a key role in reducing GHG emissions within the transportation sector, which has one of the highest emissions rates of any sector [67]. However, evaluating exactly how environmentally friendly EVs are is a complex task that includes assessing the electricity generation sources for charging and manufacture and the challenges associated with recycling EV batteries, and their overall contributions to environmental degradation. Consequently, users are frequently unsure whether driving an EV will actually assist the environment by reducing GHG emissions [68]. However, the use of renewable resources to power EVs could significantly enhance their green credentials.

2.1.7. EV Prices

EV pricing depends on several factors, including driving range, battery capacity, and km/kWh energy consumption. Table 5 [69] lists the manufacturer’s suggested retail price (MSRP) for selected US BEVs, showing their range, battery capacity, and km/kWh consumption. The fact that even the cheapest models come in at over USD 29,900 demonstrates that purchase price is a significant factor in relation to EVs, especially by comparison with ICEVs.
As Table 5 demonstrates, almost all models exhibit similar range per kWh energy consumption, at 5–6 km/kWh, except the Tesla Model X variants, at less than 5 km/kWh. While Tesla models are broadly comparable with competitors’ models in km travelled per kWh, they have superior ranges because of their larger battery capacity, compact packing, and efficient thermal management systems. The Hyundai Ioniq Electric has an impressive range per kWh of approximately seven kilometres; this high efficiency may be due to Hyundai’s battery technology. If Hyundai could scale its battery capacity to the 100 kWh capacity of Tesla, then it would have a driving range of 710 km, far longer than any other model, including those of Tesla. However, the pricing shown here suggests that any such innovation would lead to a significant increase in price, as Tesla models are among the most expensive listed, with the highest suggested retail price of the Tesla Model X P100 D being the most expensive at USD 140,000.

2.1.8. Charging Costs

While the average purchase costs of EVs far exceeds those of ICEVs, the running costs are typically much lower. For example, EDF Energy’s GoElectric 35 tariff [70], currently available to UK users, has an off-peak rate of GBP 0.045/kWh (USD 0.06/kWh), enabling users to fully charge a standard 40 kW Nissan Leaf overnight for only GBP 1.80 using a 7 kW home charger. This is much lower than the equivalent fuel cost for a conventional petrol or diesel car. In any driving scenario, the recharge consumption of an EV can be determined by multiplying its drive efficiency (in kWh/mile) by miles travelled. In the case of level 2 charging, the A/C charge rate is equal to the EV’s hourly recharge consumption, and dividing the required daily recharge consumption by the vehicle charging rate gives the number of charge hours per day [71]. The optimal daily charging amount can be estimated using Equations (1) and (2) below:
DHC =   LMP T × ( CHR ( T 1 ) × VCR ) + n = 1 T 1 VCR × LMP n
T = ( CHR VCR )
DHC represents the daily hourly charges (USD), VCR is the vehicle charge rate (kW), T is charging time (hours), CHR is the charge required (kWh) and LMPn is the locational marginal price (LMP) during the nth lowest-ranked hour of the day (USD/kWh). When estimating DHC, the LMP values can, if necessary, be taken as starting from the lowest LMP hour and moving to the next rank ordered LMP hour. The savings achieved in the Tesla 3 long-range and Chevrolet Bolt for a range of driver profiles (light, average, heavy, and Lyft/Uber) are shown in Table 6 [71].
Having explored the main factors associated with EV usage globally, the next section examines the factors which are likely to influence their adoption in Saudi Arabia, notably recent rises in domestic fuel prices and the government’s ambitious carbon reduction plans set out in Vision 2030.

2.2. Drivers of EV Adoption in Saudi Arabia

There were over 15 million vehicles in Saudi Arabia in 2020 [72], four-fifths of these being cars and other light vehicles, and numbers are expected to reach 25 million by 2030 [73]. Although buses operate between cities and to and from neighbouring countries and trains run between major cities, such as Riyadh, Jeddah and Dammam, urban public transport is limited. Most people use their own vehicles, as the meagre public transport provision is compensated for by subsidized fuel, making cars affordable, even for low-income residents [74]. For example, in Riyadh, the capital city, private vehicle ownership almost doubled between 1996 and 2008, accounting for 85% of 8 million daily trips taken, against only 2% in buses [74]. According to the Saudi Energy Efficiency Center [75], transportation currently consumes around 21% of total energy in the KSA, at around one million barrels of oil equivalent per day, and 52% of the sector is light duty vehicles. As transportation energy consumption is expected to double by 2030 [75], the widespread adoption of electric vehicles could have a significant impact in reducing CO2 emissions; however, the findings of the survey (survey questions: https://rb.gy/lhogk8, accessed on 15 February 2021) conducted for this study indicate that there are almost no EVs on the KSA’s roads at the moment. Only one participant out of 698 stated that they currently drove an EV, with nearly 3.5% owning hybrid vehicles, but more than 96% of respondents still drive conventional vehicles.
However, domestic fuel prices are now being brought into line with international levels, as part of reforms aimed at easing the burden of subsidies on state finances, improving energy efficiency, and cutting consumption. Between 2007 and 2015, gasoline prices in Saudi Arabia were fixed, with premium 95-octane gasoline cost of SAR 0.60 (Saudi riyals) per litre, while 91-octane gasoline was at SAR 0.45 per litre. In the first wave of energy price reforms in December 2015, retail prices rose to SAR 0.90 and SAR 0.75 per litre, respectively, and there were larger increases in 2018, with prices rising to SAR 2.04 and 1.37 per litre [76]. In July 2021, following increased crude oil prices, the government capped prices at SAR 2.33 and 2.18 per litre, respectively [76]. As for electricity, the residential and commercial tariffs were set in January 2018 at SAR 0.18 and 0.20 per kWh, respectively [77]. With consumers now feeling the effect of increases in the price of gasoline, there is more willingness to consider switching to an electric option.
The Saudi government wishes to promote EVs in line with Saudi Vision 2030, an ambitious and broad reaching strategy to shift the economy away from oil and reduce GHG emissions, and some policies to support their adoption have already been developed [78]. However, adoption initiatives, such as the agreement with Lucid Motors, are in their early stages and are just beginning to be implemented in the country. This is reflective of the approach to EVs of the petroleum-producing states within the Gulf Cooperation Council (GCC), with the notable exception of the United Arab Emirates (UAE). Although a global revolution is occurring in the field of EVs, Dubai is the only location in the Gulf to have embraced this technology to date, with about 50% of Dubai’s taxi fleet now being hybrid or electric, and 300 charging stations available across the city [79]. Various studies have been conducted to assess the future of EVs in the KSA and to estimate the GHG reductions that may be achieved by their adoption [80]. Despite the fact that the country is one of the world’s largest oil producers, many of these studies indicate that a key challenge to EV adoption is the massive additional demand EVs will place on an already overloaded electrical network, especially during the summer, and steps are now being taken to design systems to evaluate the impact of EVs on the grid [81]. One possible solution is a techno-economic hybrid power system for EVs using a mixture of green energy [82]. This would be a significant development, both in terms of developing sustainable EV infrastructure and meeting the country’s GHG reduction targets. Having examined the key factors associated with EV adoption identified in the literature, both internationally and in the Saudi case study context, the next section describes the methodology adopted for the study.

3. Methodology

This study adopted a mixed-methods approach to analysing the perceptions of potential EV users in the KSA, with the aim of identifying the barriers to widespread EV adoption in the Kingdom. This is part of a wider study of the strategy of using EVs to partly replace centralized energy storage, given that solar panels and other renewable energy systems are increasingly deployed. It is anticipated that this case study can be applied or correlated to other Gulf Cooperation Council (GCC) countries or any country that shares the same climate conditions and similar user lifestyles.

3.1. Quantitative Analysis

Data were collected in a quantitative e-survey, considered suitable for large samples [83]. Sampling was non-random [84], the instrument being an electronic questionnaire self-administered by individuals identified via local vehicle suppliers [85]. Most of the 78 items were in the form of closed questions which were scored on a 5-point Likert scale from “not important” (1) to “very important” (5). Some additional open questions were used to elicit more subtle perceptions. To meet limitations of scope and space, a selection of the questionnaire findings is reported here.
Three aspects of instrument validity were assessed: face, content, and construct validity [86]. For face validity, ten participants were asked to examine questionnaire items for logical links with the objectives [87]. For content validity, six EV experts assessed each item for purpose, i.e., whether it measured what it should measure [86]. Content validity was evaluated further via subjective feedback in a pilot study of 30 participants, which also explored construct validity objectively to confirm the instrument’s reliability and internal consistency. This was achieved by means of Cronbach’s alpha and exploratory factor analysis (EFA), which was used to develop theory, reduce complexity, and identify latent factors [88]. The experts in the field who reviewed the survey questions included an expert working on an EV chargers project at Saudi Electricity Company, two EV policy and regulatory experts working at the Saudi Standards, Metrology and Quality Organization (SASO), and three other researchers working in the field of EVs in the Saudi context.
Both Arabic and English versions of the questionnaire were used to elicit responses from a wider population of drivers, comprising Saudi national, expatriates and others. Four bilingual experts examined the Arabic-to-English translations of the survey items and the responses to open questions. To ensure clarity and reduce the risk of misunderstanding, the second page of the survey offered definitions of such terms as ‘hybrid vehicle’, ‘electric vehicle’, ‘conventional vehicle’, and ‘V2G’.

3.2. Qualitative Analysis

NVivo was used for qualitative analysis, following Braun and Clark’s [89] six steps of thematic analysis: (1) data familiarity, by iteratively reading responses to ensure understanding; (2) creating initial codes; (3) exploring textual data for themes by mapping initial codes to text; (4) reviewing themes; (5) defining and naming themes; and (6) preparing the report. The combined qualitative–quantitative analysis followed the approach of Makrakis and Kostoulas-Makrakis [90].
The response rate was enhanced by a combination of convenience, snowball, and volunteer sampling, thus compensating for any weaknesses among these strategies [91]. A sample size of 601 was calculated to be sufficient at a confidence level of 95% and a 4% margin of error [92], given Saudi Arabia’s population of 34.8 million [93]. When data were collected, 1012 questionnaires were returned, 698 of them complete, at a completion rate of 70%; the incompleteness of the remainder may be explained by the novelty of EVs in the KSA. The instrument was developed on the SurveyMonkey platform, and in line with the increasing use of social networking sites by researchers seeking to strengthen engagement with surveys [84], Twitter, WhatsApp, and Telegram were used to recruit participants, as were emails.
The R software environment was used to perform data analysis, comprising descriptive statistics and factor analysis, including means and frequencies, an independent samples t-test, Cronbach’s alpha and Pearson correlation coefficients, one-factor repeated measures ANOVA, EFA using the lavaan package [94], and ggplot2 for graphics [95]. Normal distribution and data homogeneity assumptions were confirmed by skewness and kurtosis tests, making the above procedures appropriate [96].

3.3. Cost of Long-Term Ownership

As the literature review indicated that cost forms a significant barrier to EV adoption, the potential costs of ownership over a period of 10 years were calculated for both EVs and ICEVs based on their long-term costs. For the purposes of this study, the cost of ownership was deemed to include the initial cost and ongoing operation and maintenance (O&M) costs. Estimations of O&M costs were based on the resources available in the KSA. Maintenance and repair costs were calculated on a vehicle’s entire expected lifetime and thus assumed to be constant across the 10-year analysis period. The fact that EVs are far cheaper to operate and maintain than ICEVs, as combustion engines require oil, filters, belts, and so on, and EVs do not, was also considered. A 10-year period was chosen as research indicates that the payback period for an EV might be up to ten years due to the higher initial costs compared to ICEVs [97]; as a result, and in order to account for variation in daily driving ranges, ownership costs were examined for the first 10 years. This study assessed annual running cost as follows:
Engine O&M: Calculated for ICEVs only. Given their low requirement for engine maintenance, this cost was not considered for EVs when estimating the cost of their long-term ownership.
Other O&M: These costs include those associated with tires, brake pads, gearbox oils, etc. [98,99], which are generally similar for EVs and equivalent ICEVs.
Battery replacement: According to [100], battery replacement is a major cost associated with long-term EV ownership; however, it is estimated that these will decrease fairly rapidly [51]. The US Department of Energy set cost targets of USD 300/kWh by 2015 and USD 125/kWh by 2022 [101], and this study took USD 125/kWh as the cost of the battery. Battery replacement was assumed to be necessary only for EVs with a high usage rate. It was also assumed that it may be required eight years after purchase of the vehicle. This was taken into consideration when estimating the battery replacement costs for vehicles in all mileage ranges. The fact that EVs with larger batteries will incur greater replacement costs was also recognized; thus, for the Tesla Model 3, a 75 kWh battery capacity was assumed, making the estimated battery replacement cost around USD 9375 (approx. SAR 35,000).
Administration fees: Most of these are paid to the government, including for vehicle registration, annual renewal, periodic inspection, and plate registry [102]. The KSA currently imposes no road tax, congestion charges, or emission charges; however, nor does the government offer grants for ownership of EVs, whereas the UK government, for example, provides up to GBP 1500 under its net-zero strategy [103] and the Irish government provides EUR 5000 grants [104].
Car insurance: According to [105], some of the KSA’s motor insurance companies offer fixed annual insurance prices, and the annual average is SAR 1050 (USD 280). This is the insurance cost used in this study for all car brands and all mileage ranges.
Due to the absence of EV agencies in the KSA, the initial price for the Tesla was obtained by examining Tesla prices in the UAE [106], which is similar to the KSA market in terms of prices, standards, and other factors, and set at AED 200,000 (USD 54,450). The initial cost for the three Toyota ICEVs was set based on new vehicle prices at Saudi Toyota, as follows: the Camry is priced at SAR 99,000 (USD 26,400), the Prado at SAR 213,000 (USD 56,800) and the VXR at SAR 404,500 (USD 108,000) [107]. However, a primary long-term cost not included in the present analysis is depreciation; it is assumed that all EVs and ICEVs are purchased outright, rather than via loans or instalment plans, and that ownership persists for the full ten years, making depreciation inapplicable.
Finally, the cost of ownership of a vehicle over 10 years can be calculated as [108]:
C O O 10 = ( PP GI ) + BR + y = 1 10 ( F C y ( D ) + T + O M C y )
where C O O 10 is the 10-year cost of ownership, PP is the initial cost of the vehicle, GI represents government incentives to purchase it (currently zero in the KSA), BR is battery replacement cost, F C y is forecasted cost of fuel per year y , D is the annual distance travelled by the vehicle, T is the motor tax on the vehicle (again, zero in the KSA), and O M C y is O&M cost per year (excluding fuel consumption).

4. Findings

This section presents the findings of the study. The demographic data are reported in Section 4.1, then the quantitative and qualitative results are presented and discussed in Section 4.2 and Section 4.3, respectively.

4.1. Demographic Data

The majority of participants were Saudi citizens (around 96%) and there were more men (around 85%) than women (around 15%). This gender difference was anticipated since women have only recently been permitted to drive in the KSA [109]. Most of the respondents (around 60%) lived in the central region (including the capital, Riyadh), followed by around 20% in the western region (which include the major cities of Jeddah, Makkah, and Medina). Over two-thirds were aged 30–50, followed by 18 to 29 years old, who accounted for around 18% of participants. Around 51% had an undergraduate degree, while 22% had higher degrees (e.g., a master’s or doctorate). Only 1% of participants did not have a high school diploma. The major demographic data elicited are provided in Table 7.

4.2. Quantitative Findings

4.2.1. Current Vehicle Usage

Almost half of respondents reported owing vehicles with six-cylinder engines, followed by a third with four cylinders, and a fifth with eight. It may be assumed that Saudi drivers prefer vehicles with large engines to suit the long distances and exceptional terrain, including vast expanses of desert, in the country. In terms of the daily distance travelled, participants were asked to select from a number of mileage segments, taking average mileage as the mid-point of the range, with Segment #1 (under 25 km); Segment #2 (26–50 km), Segment #3 (51–100 km); Segment #4 (101–150 km); and Segment #5 (above 150 km). More than a third (37%) of participants selected Segment #2, while 21% travelled less than this. Just over 30% selected Segment #3, with around 3% reporting that they drove for more than 150 km per day. The daily mileage of participants is illustrated in Figure 2.

4.2.2. Fuel Consumption Costs (Based on Distance Travelled)

To test whether EVs were cost effective of in terms fuel consumption in the context of a petroleum producing nation, a calculation of the comparative fuel consumption costs between ICEVs and EVs was made using the mileage ranges shown in Figure 2. Three popular Toyota ICEV models (Camry, Land Cruiser Prado, and Land Cruiser VXR) were used to represent ICEVs, because Toyota came top of the 2019 Brand Index for car makers in Saudi Arabia [110], with the Tesla Model 3 used to represent EVs, as it was identified as the best-selling EV around the world in 2020 [111].
Fuel cost per day (Equation (4)) was measured according to the current petrol price (SAR 2.18/L) and fuel efficiency for the above three Toyota brands as 18.3, 10.1 and 8.2 km/L, respectively [107]. The fuel cost per day of EVs (Equation (5)) was calculated according to the Saudi electricity tariff (0.18 SAR/kWh). The estimated battery capacity of the Tesla model 3 is 75 kWh, and its consumption is 0.121 kWh/km [112]:
Fuel   cos t   per   day   of   ICEV = SAR / L Average   km   per   day
Fuel   cos t   per   day   of   EV = 0.151   kWh / km   × 0.18   SAR / kWh Average   km   per   day  
Figure 3 compares daily cost of consumption for the four models at each of the five average daily mileage segments, based on manufacturers’ specifications. Among ICEVs and in each segment, the Camry has the lowest cost, which increases with engine size. Thus, in Segment #5, the VXR costs SAR 50 per day to run and the Prado SAR 8.20. However, the Tesla Model 3 is seen to be a much cheaper alternative in terms of fuel cost in all segments, at about six, ten, and thirteen times lower than the Camry, Prado, and VXR models, respectively.

4.2.3. CO2 Emissions (Based on Distance Travelled)

As the desire to reduce CO2 emissions is a key driver of EV adoption for the Saudi government, Equation (6) was used to estimate and compare emissions from EVs and ICEVs. The figure of 2.29 kg/L was based on data from National Resource Canada [113] who estimate the CO2 tailpipe emissions for gasoline vehicles at 2.29 kg/L. As before, the Camry, Prado, and VXR were used as examples:
CO 2   ( kg / L ) = 2.29 * (   Average   km   per   day Fuel   efficiency   ( km L )   )
Figure 4 indicates that CO2 tailpipe emissions increase rapidly as driving range and engine size increase, the highest emissions being in Segment #5, at 22.02, 39.90, and 49.15 kg/L for the Camry, Prado, and VXR, respectively.

4.2.4. EV Prices

Given the fact that the literature identified purchase price as a key barrier to EV adoption, respondents were asked to identify the maximum price they would be willing to pay for an EV. Figure 5 shows respondents’ preferences in terms of EV price and battery range, with the majority (62%) choosing the lowest price band (SAR 70,000 to 100,000) and just 3% choosing the high battery range with advanced specification (SAR 250,000 to 500,000).

4.2.5. Addressing Energy Storage Issues

V2G technology has been identified as a possible solution to some of the energy storage issues associated with EVs [7]. In order to assess the acceptability of introducing V2G technology to Saudi Arabia, participants were asked whether they would be willing to use an EV to supply the electricity grid if they gained some economic benefit from doing so. In order to avoid any confusion, the terms used were clearly defined to ensure participants had a clear understanding on which to base their responses. As Figure 6 shows, three-quarters of participants expressed an interest in this, while just under a quarter declined. Some of the 2.5% of respondents who selected the ‘Other’ option here provided instructive qualitative responses, expressing doubts about costs versus financial benefits, technical issues, including reliability and safety in the hot Saudi climate, or the risk that frequent charging and discharging would reduce battery life, making the income from selling power insufficient to compensate for having to replace the battery more quickly.
It is interesting to note that analysis of responses to this question via ANOVA revealed that respondents who expressed greater interest in financial incentives and environmental matters elsewhere in the survey were significantly more positive in their replies regarding V2G.
In order to calculate the potential availability of EV batteries to feed the grid via V2G, respondents were asked about their current car ownership (Q18). More than half of respondents (58%) owned a single car, 27% owned two, and 15% had three or more, reflecting a diversity in lifestyles in terms of income and reliance on private cars for transport. It is noticeable that many respondents who owned more than one vehicle reported choosing to drive 4 × 4 vehicles in desert areas and small cars in towns. ANOVA revealed a positive relationship between concerns about duration of charging (Q18) and the number of cars owned. Participants with one car (M = 3.82, SD = 1.086), two cars (M = 3.66, SD = 1.071), and three or more cars (M = 3.62, SD = 1.058) differed significantly (p = 0.003) in their answers. Thus, there is less concern about this challenge among those have more than one car as they can use another car during the charging period.

4.2.6. Ranking the Barriers to EV Adoption

Respondents were then asked to rate 10 potential barriers to EV adoption identified in the literature in terms of their importance in relation to purchasing decisions. The resulting EV barriers scale was subjected to descriptive analysis. Table 8 ranks the ten barriers in descending order of importance, with verbal interpretations following [114]. The most important barriers according to mean weight was availability of charging stations, with the fact that the KSA does not need EVs as it is one of the biggest petroleum-producing countries ranked as least important. Duration of charging, lack of trust in EVs as a new technology, and high maintenance costs all ranked highly, but respondents were less concerned about potential safety issues with rechargeable batteries, and more with the costs associated with purchasing and charging an EV.
The independent-samples t-test comparing all barriers by gender found a statistically significant gender difference for terrain and weather conditions only (p = 0.003), with males (M = 2.98, SD = 1.094) being more concerned about these barriers than females (M = 2.90, SD = 1.000). This may indicate that men are more likely to spend time in desert areas, for example, in off-road driving; however, it is also possible that they have more experience in terms of a vehicle performance in desert terrain and also in the summer heat, since women have only recently been permitted to drive in the KSA [109]. In addition, the independent-samples t-test revealed a statistically significant difference in willingness to use V2G (Q9) in relation to the limited driving range barrier (Q16) (p = 0.000), with respondents who said they were not willing to use V2G (M = 3.42, SD = 1.195) being more concerned about these barriers than those were (M = 3.08, SD = 1.120). This suggests that these respondents are not as interested in the financial benefits of V2G as they are in ensuring that the range of their EVs would cover their everyday journeys.
ANOVA applied to the means among age groups revealed a statistically significant difference (p = 0.004) between age groups on availability of charging stations (Q10), with younger participants considering them more significant: 18–29 (M = 4.07, SD = 1.129), 30–39 (M = 3.93, SD = 1.204), 40–49 (M = 3.79, SD = 1.251), over 50 (M = 3.49, SD= 1.230). This may indicate that younger generations have a larger driving range or are more likely to make unexpected trips, so they need to make sure charging facilities will cover them., ANOVA was also applied to the means among the five daily distance travelled segments (see Figure 2) and revealed a statistically significant difference (p = 0.000) between the five segment groups in relation to EVs’ limited driving ranges (Q16), with the largest segment, Segment #5 (over 150 km), considering this to be most significant: Segment #1 (under 25 km) (M = 3.10, SD = 1.121), Segment #2 (26–50 km) (M = 3.22, SD = 1.167), Segment #3 (51–100 km) (M = 3.59, SD = 1.186), Segment #4 (101–150 km) (M = 4.04, SD = 1.188), and Segment #5 (over 150 km) (M = 4.22, SD = 1.121). Thus, there is obvious concern among those who travel the greatest distances daily about the limit of EV driving ranges.
While these concerns are likely to be reflected across the globe, ANOVA was also applied to check the relationship between participants’ demographic data and their attitudes towards two local barriers: weather and terrain (Q20) and Saudi Arabia’s position as a major oil-producing nation (Q11). As was anticipated, participants in coastal regions in the east and west, which have high humidity in the summer, rated this barrier most highly (M = 3.26, SD = 1.205), (M = 3.11, SD = 1.367), respectively, followed by those in northern and central regions (M = 3.06, SD = 1.145), (M = 3.00, SD = 1.096), respectively. Respondents in the southern region, which is mountainous and relatively cool, were least concerned about this barrier (M = 2.98, SD = 1.291). In respect of the KSA’s status as a major oil-producer, meaning that there was no need for EVs, it was clear that those with the highest annual incomes were most concerned about this issue (M = 2.85, SD = 1.307), and that concern decreased as annual income decreased. This may indicate that low-income families did not regard this as an obstacle and would support the use of EVs, regardless of the country’s ability to continue fuelling ICEVs based on its vast oil reserves.

4.3. Qualitative Findings

Thematic analysis was applied to the qualitative data provided. Figure 7 provides a word cloud of the most frequently repeated words in the responses, generated as a result of data mining, and identifies maintenance as a significant concern, along with related matters, including battery replacement, spares, and the existence of professionally staffed maintenance facilities [7].
Ranking the Barriers to EV Adoption (Thematic Analysis)
Table 9 presents a thematic analysis of the comments provided, identifying participants with an alphanumeric code. The barriers are ranked in terms of the frequency with which they were mentioned, with ‘reliability’ mentioned most and ‘insurance price’ mentioned least.
Concerns about the reliability of EVs are significant, both as a new and relatively unknown form of technology, and, specifically, within the country’s hot climate and desert terrain. Issues relating to safety are also prominent, along with concerns about access to qualified and affordable maintenance care. ICEVs insurance in general in the KSA is low at around USD 280 per year [105], and this may be reflected in the lack of concern about insurance costs. Concerns about the adoption of EVs affecting the economy shows a novel concern among Saudi drivers, but this may also be reflected in other oil-producing states.

4.4. Creating a Combined Framework of Barriers

The gap between the quantitative and qualitative results was bridged by taking the approach of Adhikari and Ghimire [115], combining the two sets of results into a single framework of barriers. This comprises five linked categories: infrastructure, performance, financial, social, and policy, with the barriers in each category ranked according to the frequency with which they were mentioned across both sets of results. The green-coloured barriers correspond to the obstacles included in the original framework presented by Adhikari and Ghimire [115], while the yellow barriers have been identified by respondents in this study and relate to the Saudi context (See Figure 8).

4.5. Assessing the Cost of Long-Term EV Ownership

As a number of the barriers identified in Figure 8 relate to the perceived costs associated with EVs, the study estimated the relative costs of EV and ICEV ownership over a 10-year period, based on Steinhilber, Wells and Thankappan’s methodology [3]. EVs are represented by the Tesla Model 3 and ICEVs by the Toyota Camry, Prado, and VXR, and the results are shown in Figure 9.
The ranking of the Tesla between the Camry and the Prado indicates that, in the long run, EVs cost less to own than many high-end ICEVs. However, it is interesting to note that, across segments, the long-term ownership cost of an ICEV based sedan, such as the Toyota Camry, is much lower than a comparable EV model, such as the Tesla Model 3. Thus, in Segment #1, with the lowest driving range, the Tesla Model 3 is up to 40% more expensive than the Toyota Camry, and it is 13% more expensive compared to the Camry in Segment #5. Based on Weldon and Morrissey [108], an EV would thus be the more affordable option only when the car is driven greater yearly distances, with ICEVs more economical than EVs at low usage levels. The introduction of subsidies for the purchase or charging of EVs should alter this picture; for example, in Ireland, with the existing government subsidies, EVs are 34%, 25%, and 21% more cost-effective than ICEVs over 4-, 8- and 12-year ownership periods, respectively [116]. While in the Netherlands, France, and the United Kingdom, the total cost of ownership of EVs is comparable to that of ICEVs [117]. Therefore, policymakers should evaluate the viability of grants and incentives to promote EV adoption in the KSA.

5. Discussion

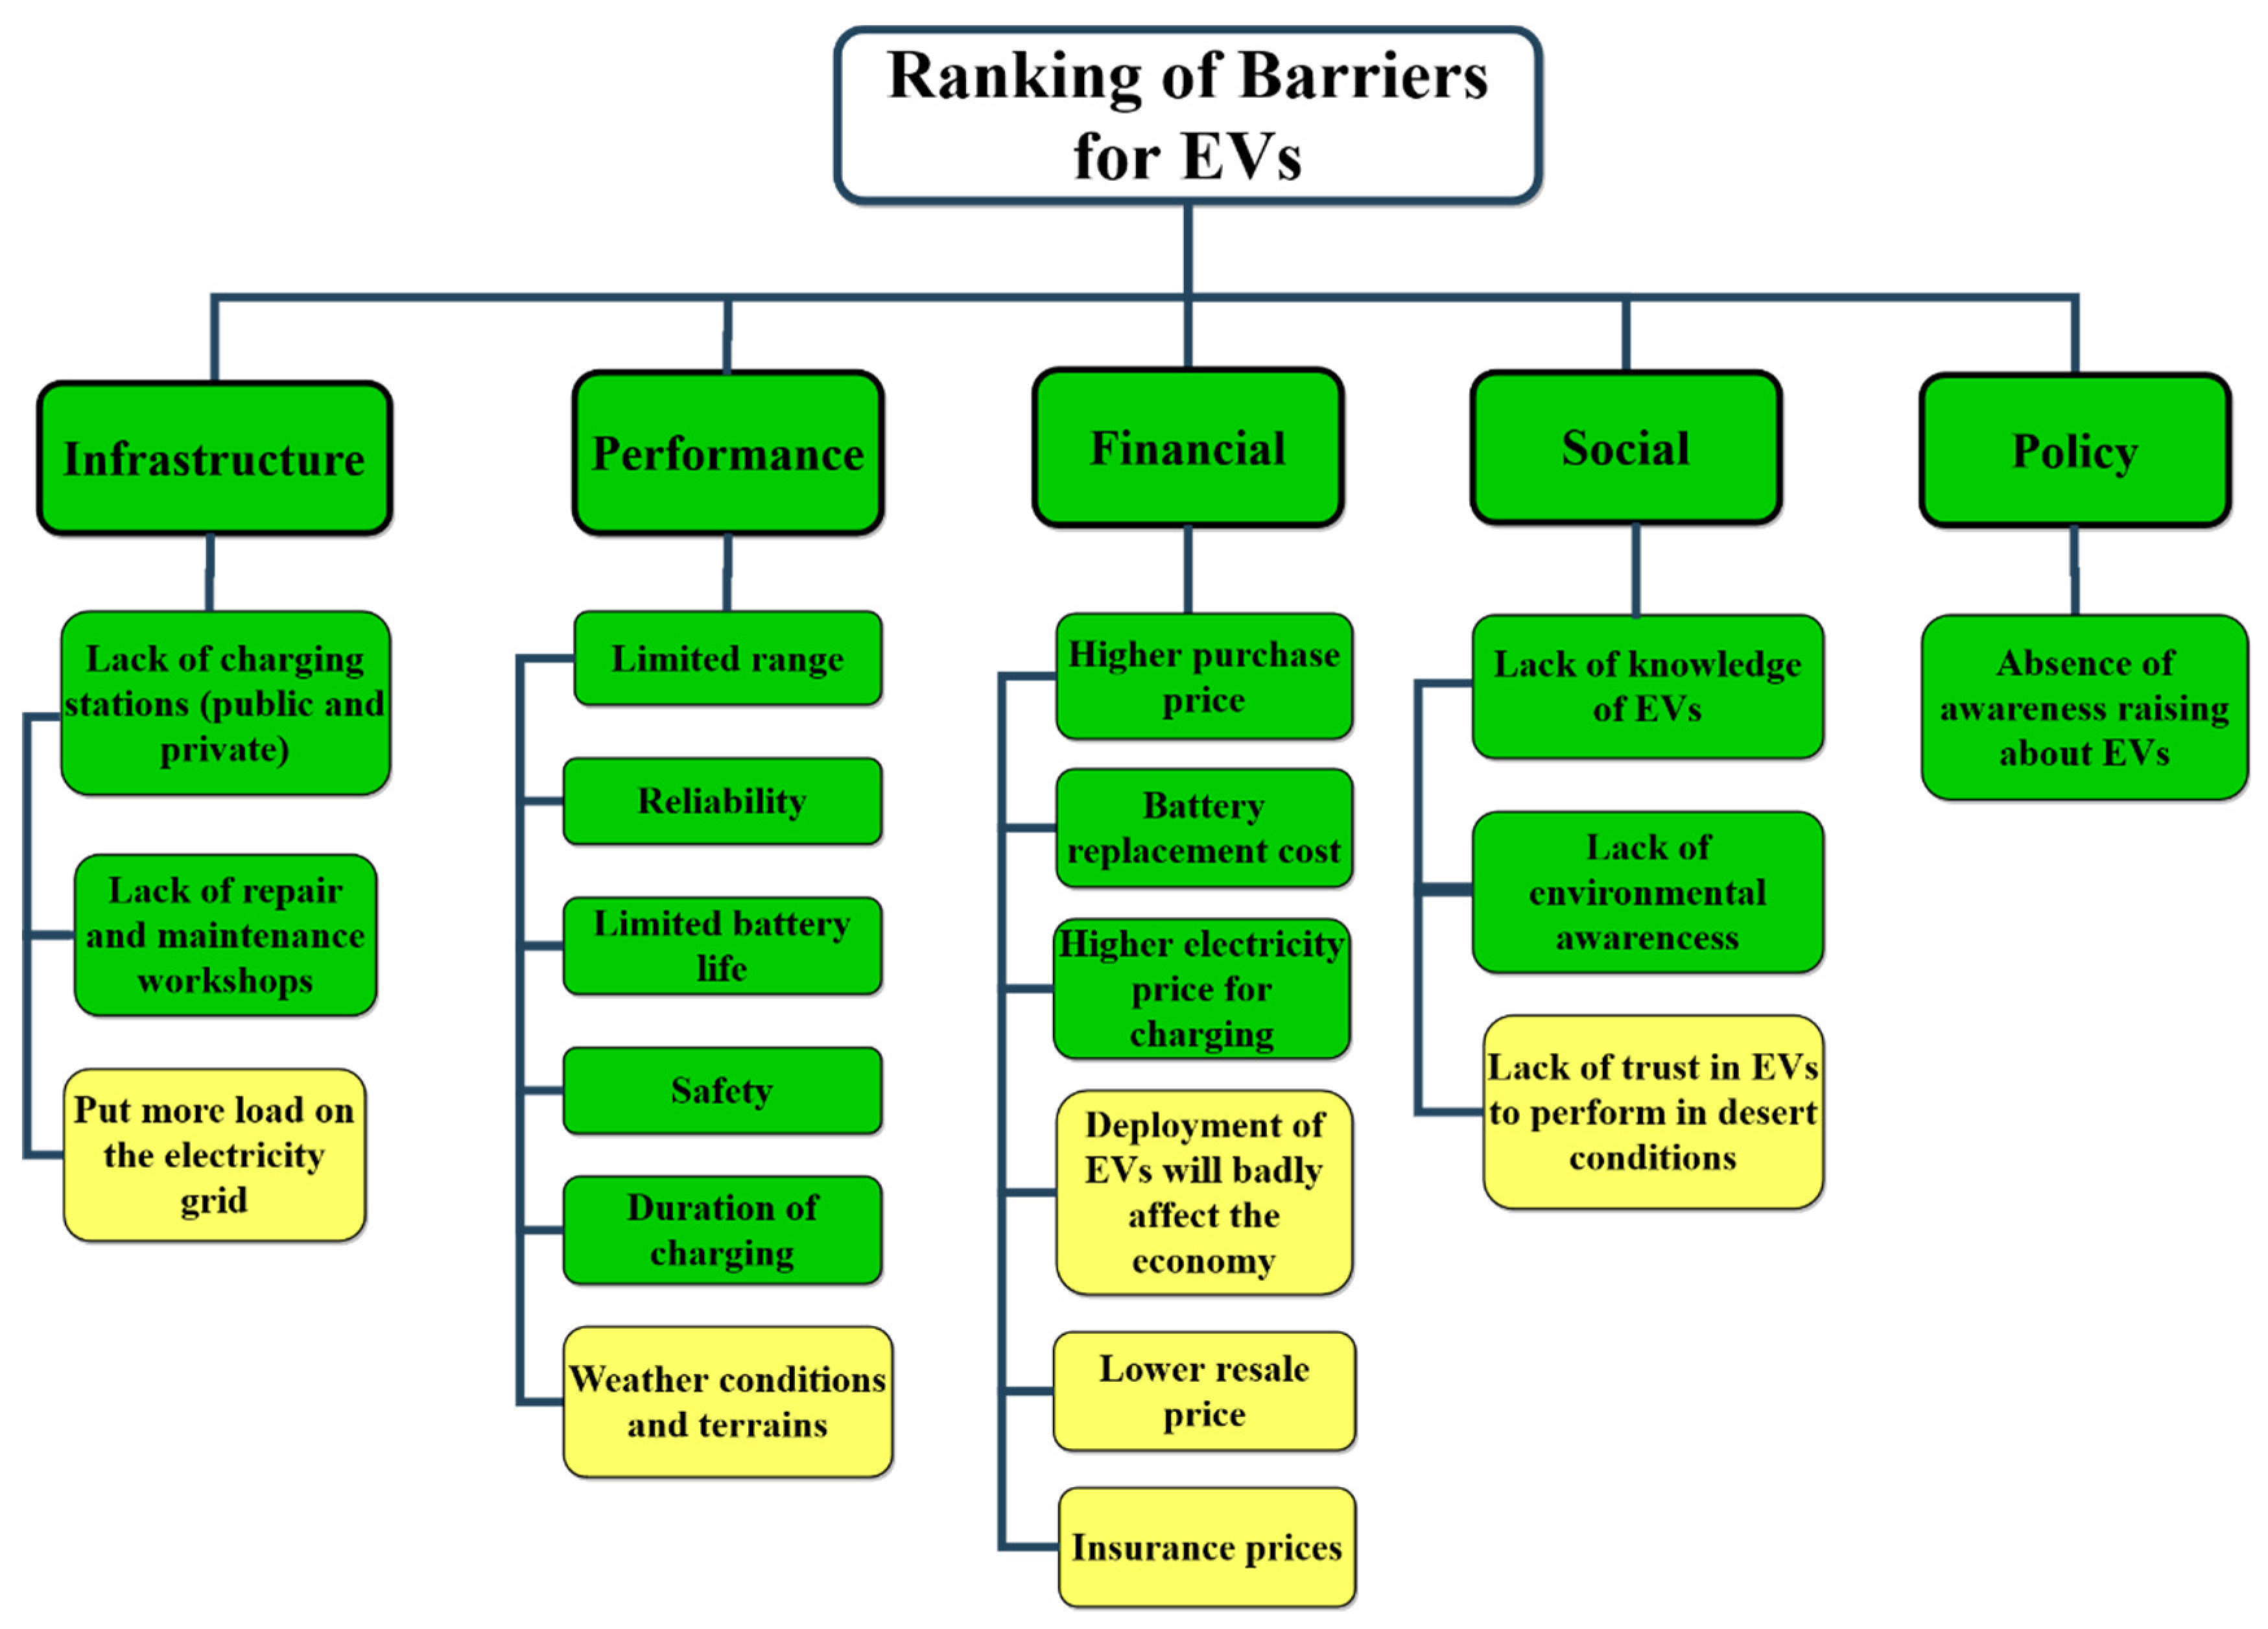
The thematic framework developed by combining the results of the quantitative aspects of the research and the qualitative analysis provides a model of how potential users in Saudi Arabia perceive the barriers associated with EVs and their relative importance (See Figure 8).
Infrastructure is an essential prerequisite for the adoption of EVs, and two of the barriers in this category (charging stations and maintenance provision) would apply in any national context; however, concerns around the additional load EVs place on the grid are particular to Saudi Arabia, and to other hot countries where the capacity to generate electricity sometimes fails to meet rising demand. The top ranking of charging stations reflects consumers’ concerns that EVs may not be practicable across the large territory of Saudi Arabia, echoing anxieties over BEVs’ relatively limited range, long charging times, and the time it will take to replace petrol stations with a charging network [118]. EVs’ dependence on emerging technologies makes consumers unlikely to support their adoption in the absence of appropriate infrastructure, and the significant demand among respondents for both urban and rural charging stations, consistent with the existing literature [
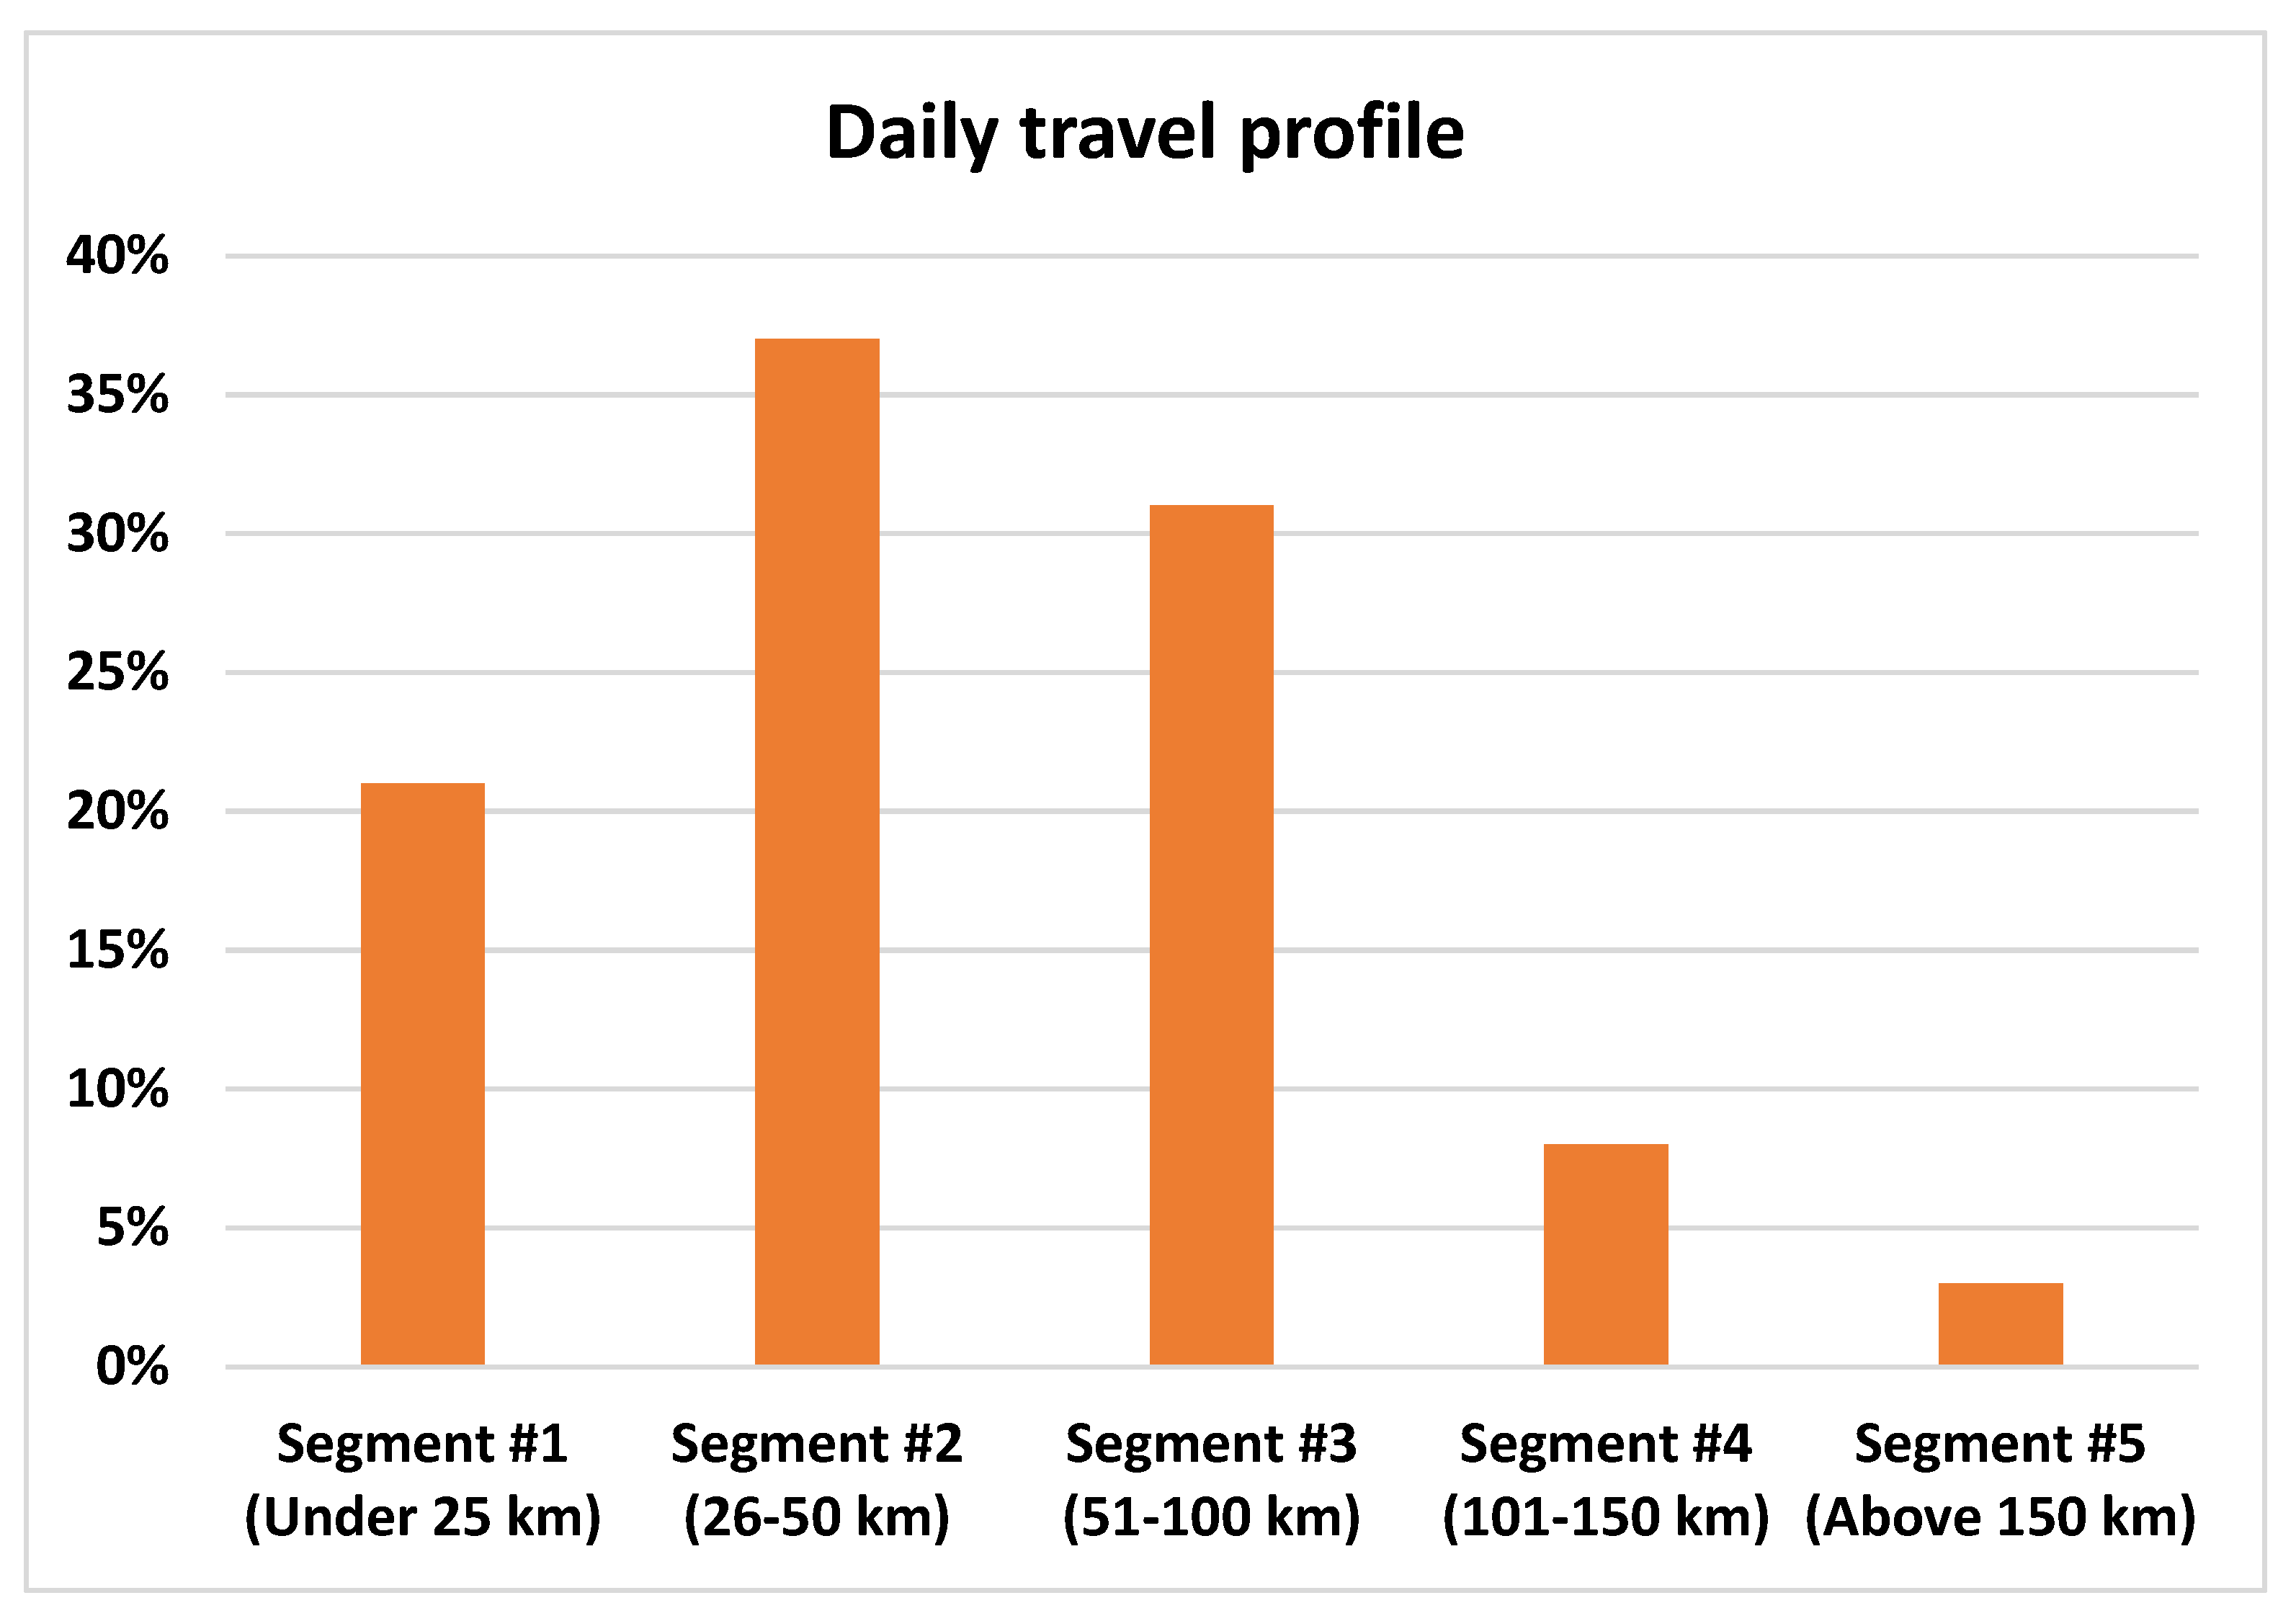
119], suggests that building an extensive charging network would be a significant early step in accelerating the deployment of EVs across all parts of the country. Furthermore, it seems that a variety of charging infrastructure, including rapid chargers for drivers who travel more than 100 km per day, is needed. However, clear policy is needed to identify where responsibility for creating infrastructure lies, since EV manufacturers tend to believe that the government should be fully responsible for developing charging stations and repair maintenance facilities, while governments believe that the industry should also play a part [33]. Thus, adopting EVs requires collaboration from both private and government sectors to build suitable infrastructure, and the private sector needs to be encouraged through the provision of competitive investments and grants.
Consumers’ concerns regarding maintenance, evidenced both quantitatively and qualitatively, are perhaps unsurprising, given that EV deployment in Saudi Arabia is at an early stage, and as the technology becomes more widespread, these are likely to reduce over time. However, in a hot country, such as the KSA, the demand EVs place on the grid is likely to pose a significant barrier in the longer term, and stakeholders must find alternative ways to mitigate the risk of grid overloading, such as utilising renewable energy resources, managing charging times, and implementing effective policies and strategies. Existing research warns that connecting EVs to the power grid may result in higher short-circuit currents, voltage fluctuation, demand surges, and reduced equipment lifespan [120], and the national grid must be upgraded in order to meet this new demand [121]. In addition, higher electricity consumption also entails increases in GHG emissions if solar, wind, wave, or other sustainable generation alternatives are too costly or cannot satisfy demand, so policy makers must consider energy generation and renewable energy usage when developing infrastructure to support EVs. In this regard, it is significant to note that potential EV users in Saudi Arabia have identified the need for renewable sources of electricity as a significant factor affecting their willingness to adopt EVs [7], and resource diversification in this way would be sensible for both load profile and for EV users. While the increase in demand on the grid will occur in any country in which EVs are adopted, this is a particular concern in Saudi Arabia, and in other hot countries, where demand for air conditioning places significant strains on the existing energy supply.
Participants were found to rate the performance dimension, comprising limited range, reliability, battery lifespan, charging duration, safety, and weather conditions and terrains as particularly important. Doubts about performance are evident in both sets of data, with consumers concerned that EVs may not be reliable in the country’s extreme climatic and geographical conditions, and stakeholders, including manufacturers and lawmakers, must take account of these if EVs are to be more widely adopted. Furthermore, to satisfy customer demand for EVs in a country such as India, EV motors should be made more durable and cost-effective for easy maintenance and repair [6]. Concerns are clear in the qualitative findings, which demonstrate anxieties over BEVs’ relatively limited range, battery life, long charging times and safety and reliability. These are reflected in the literature, with limited ranges and long charging times recognised as the two largest barriers to consumer acceptance of EVs in the passenger vehicle market [122]. The issue of the reliability and safety of EV components is also regarded as an important concern [123], and the limited battery life imposes a significant financial burden on EV users, as well as affecting EV performance, and is also considered as a significant barrier [124]. While the risk of traffic accidents is an issue in any context, the climate in the KSA raises concerns about the exposure of batteries to high temperatures and the potential fire risk of lithium ion batteries. Although the risk of an electrical shock from a vehicle is very low, because the components and cables are usually well-insulated and covered [125], concerns about the effectiveness of EVs across the various terrains and hot weather conditions in the KSA persist. As the US tests in the desert region of Arizona have indicated that the driving range can fall by 29% when average daily temperatures reach 41 °C [126], more extensive testing in desert conditions by battery and EV manufacturers, such as Lucid Motors, are required to reassure consumers that EVs are a viable option in the Kingdom.
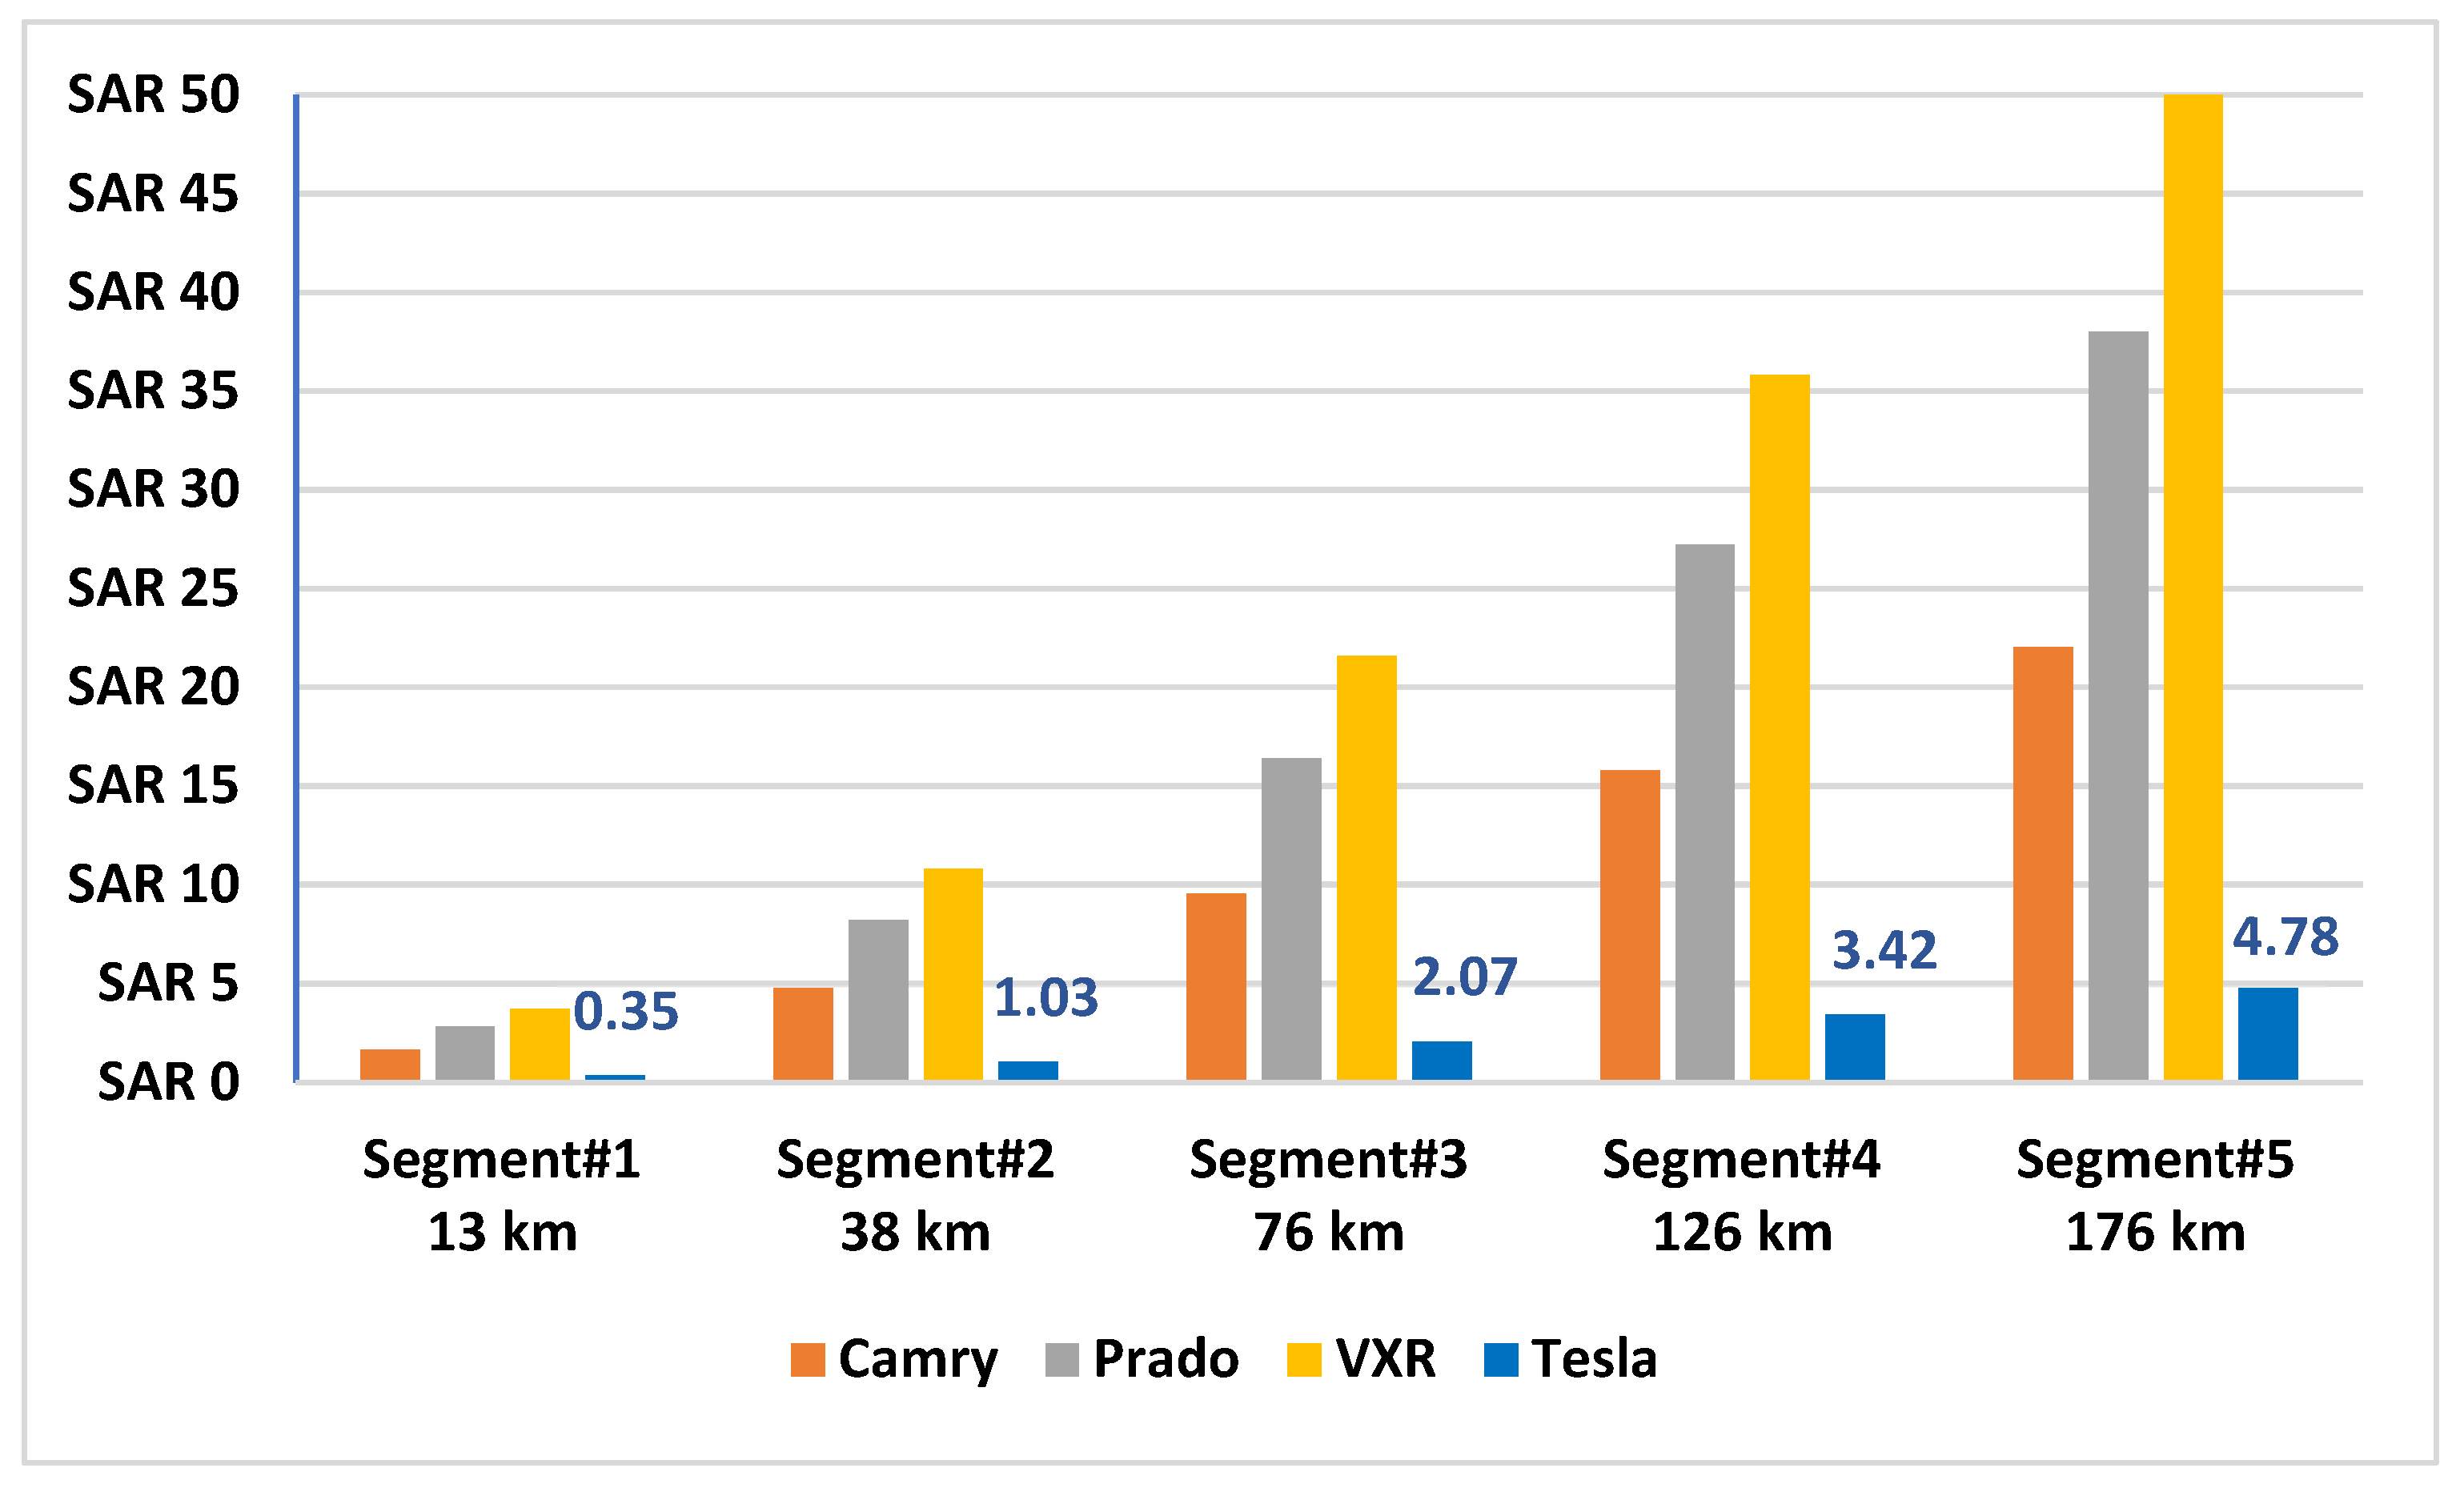
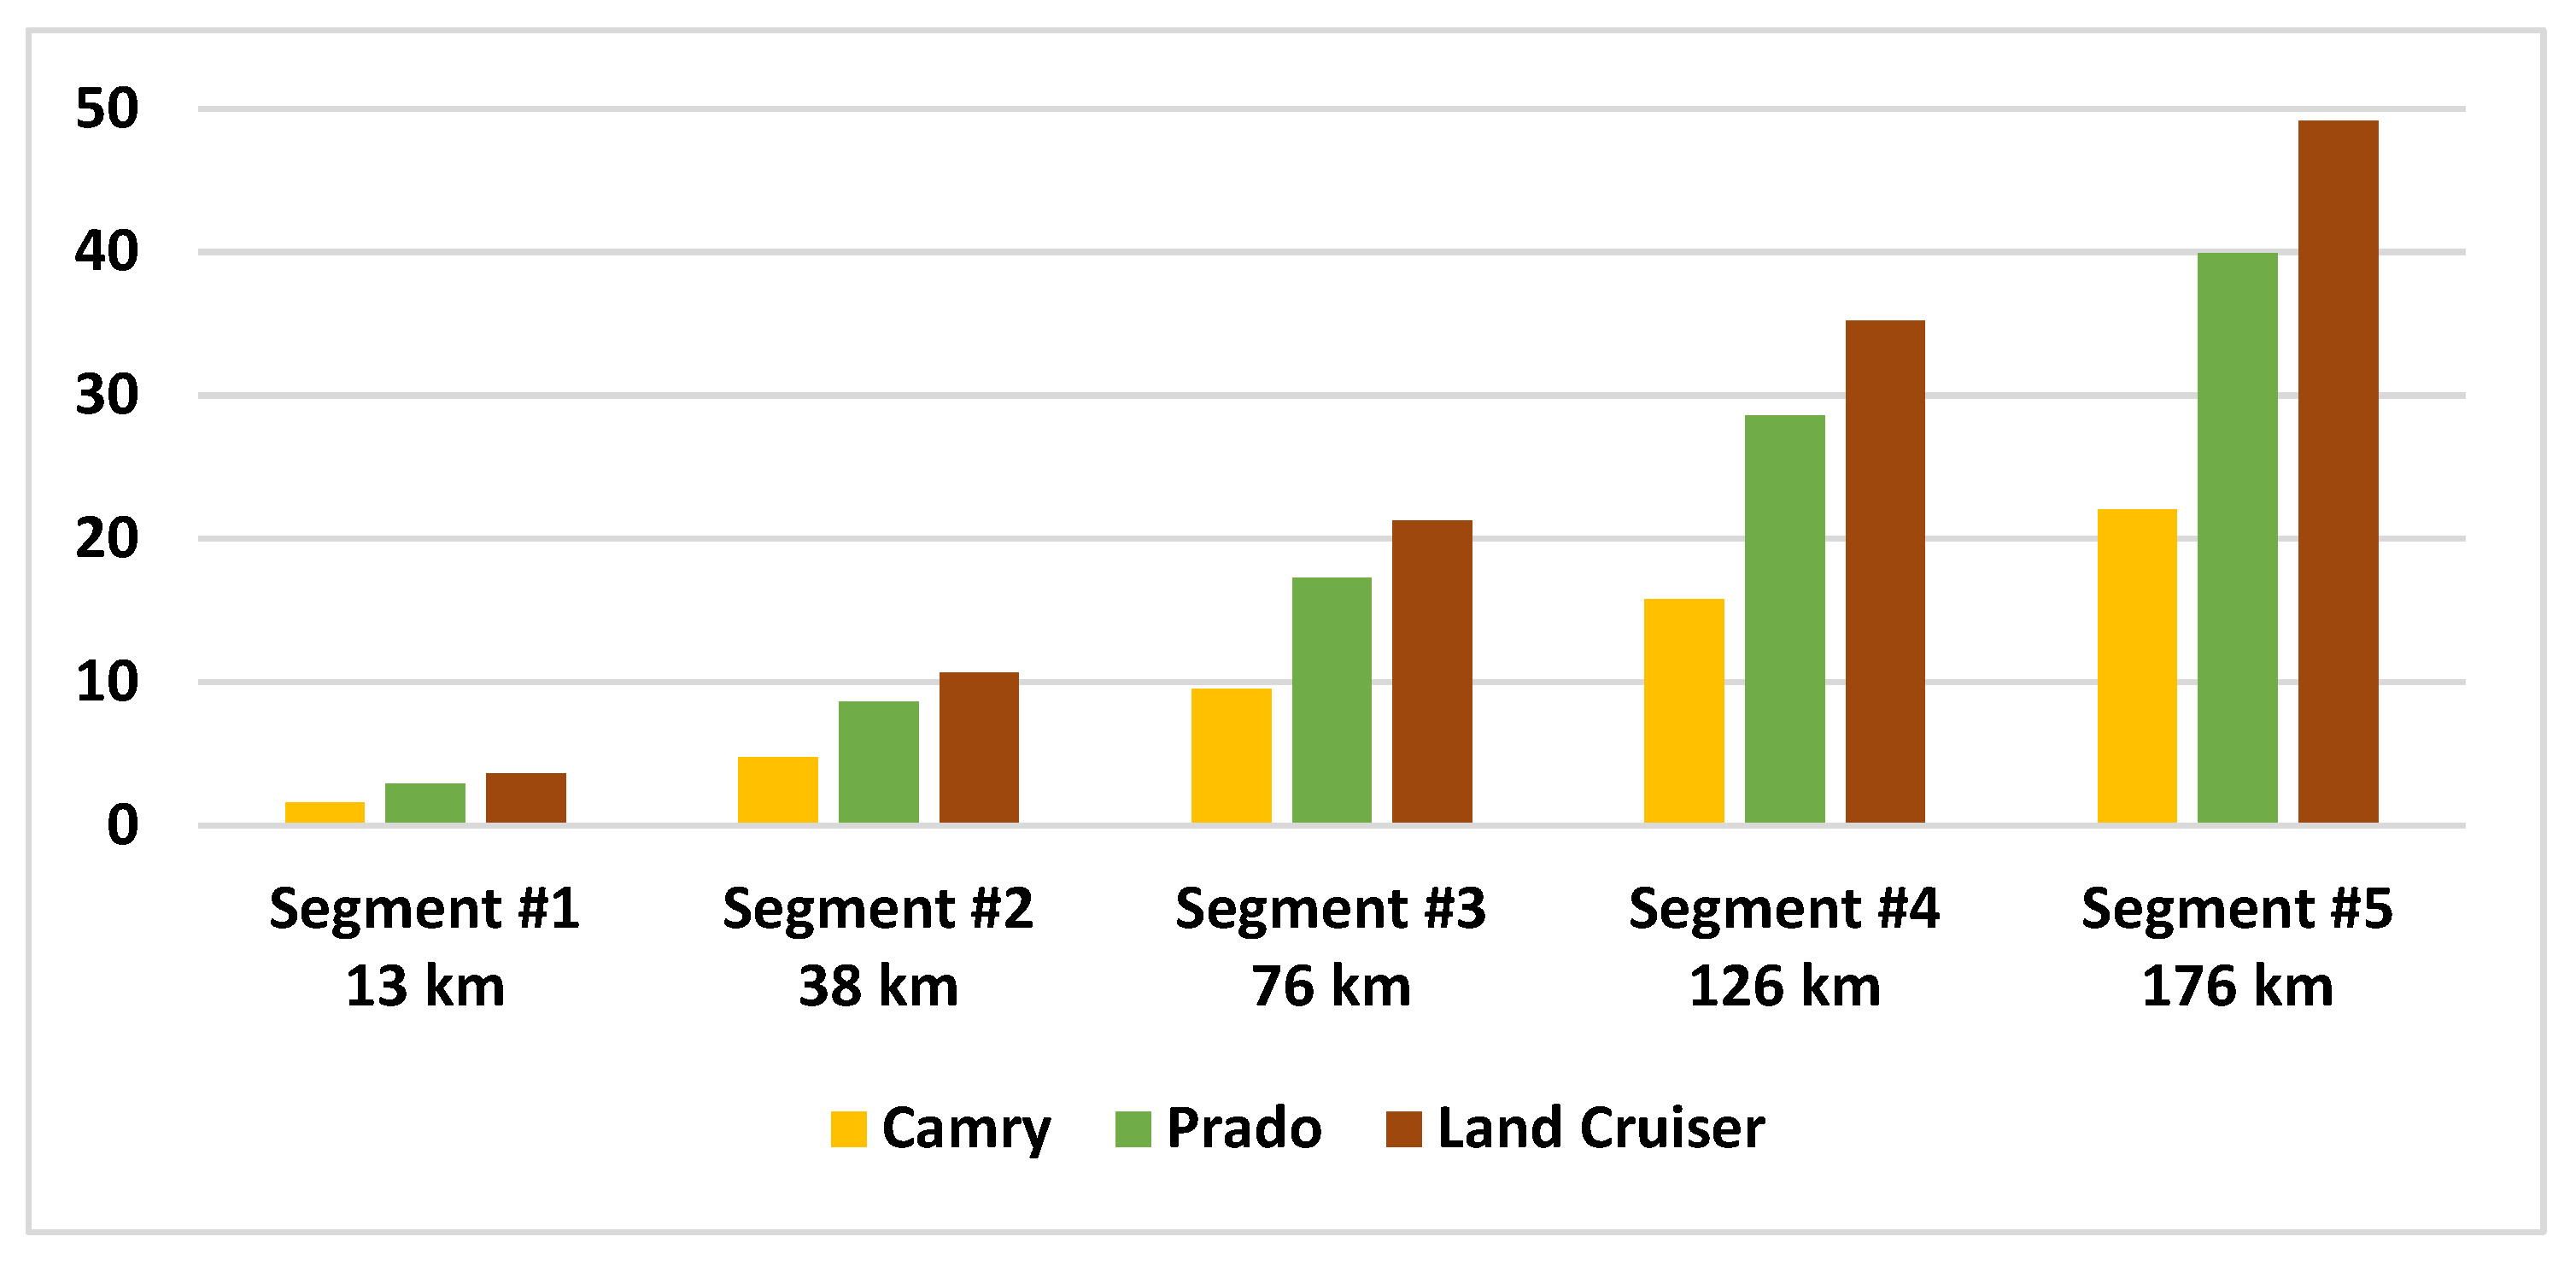
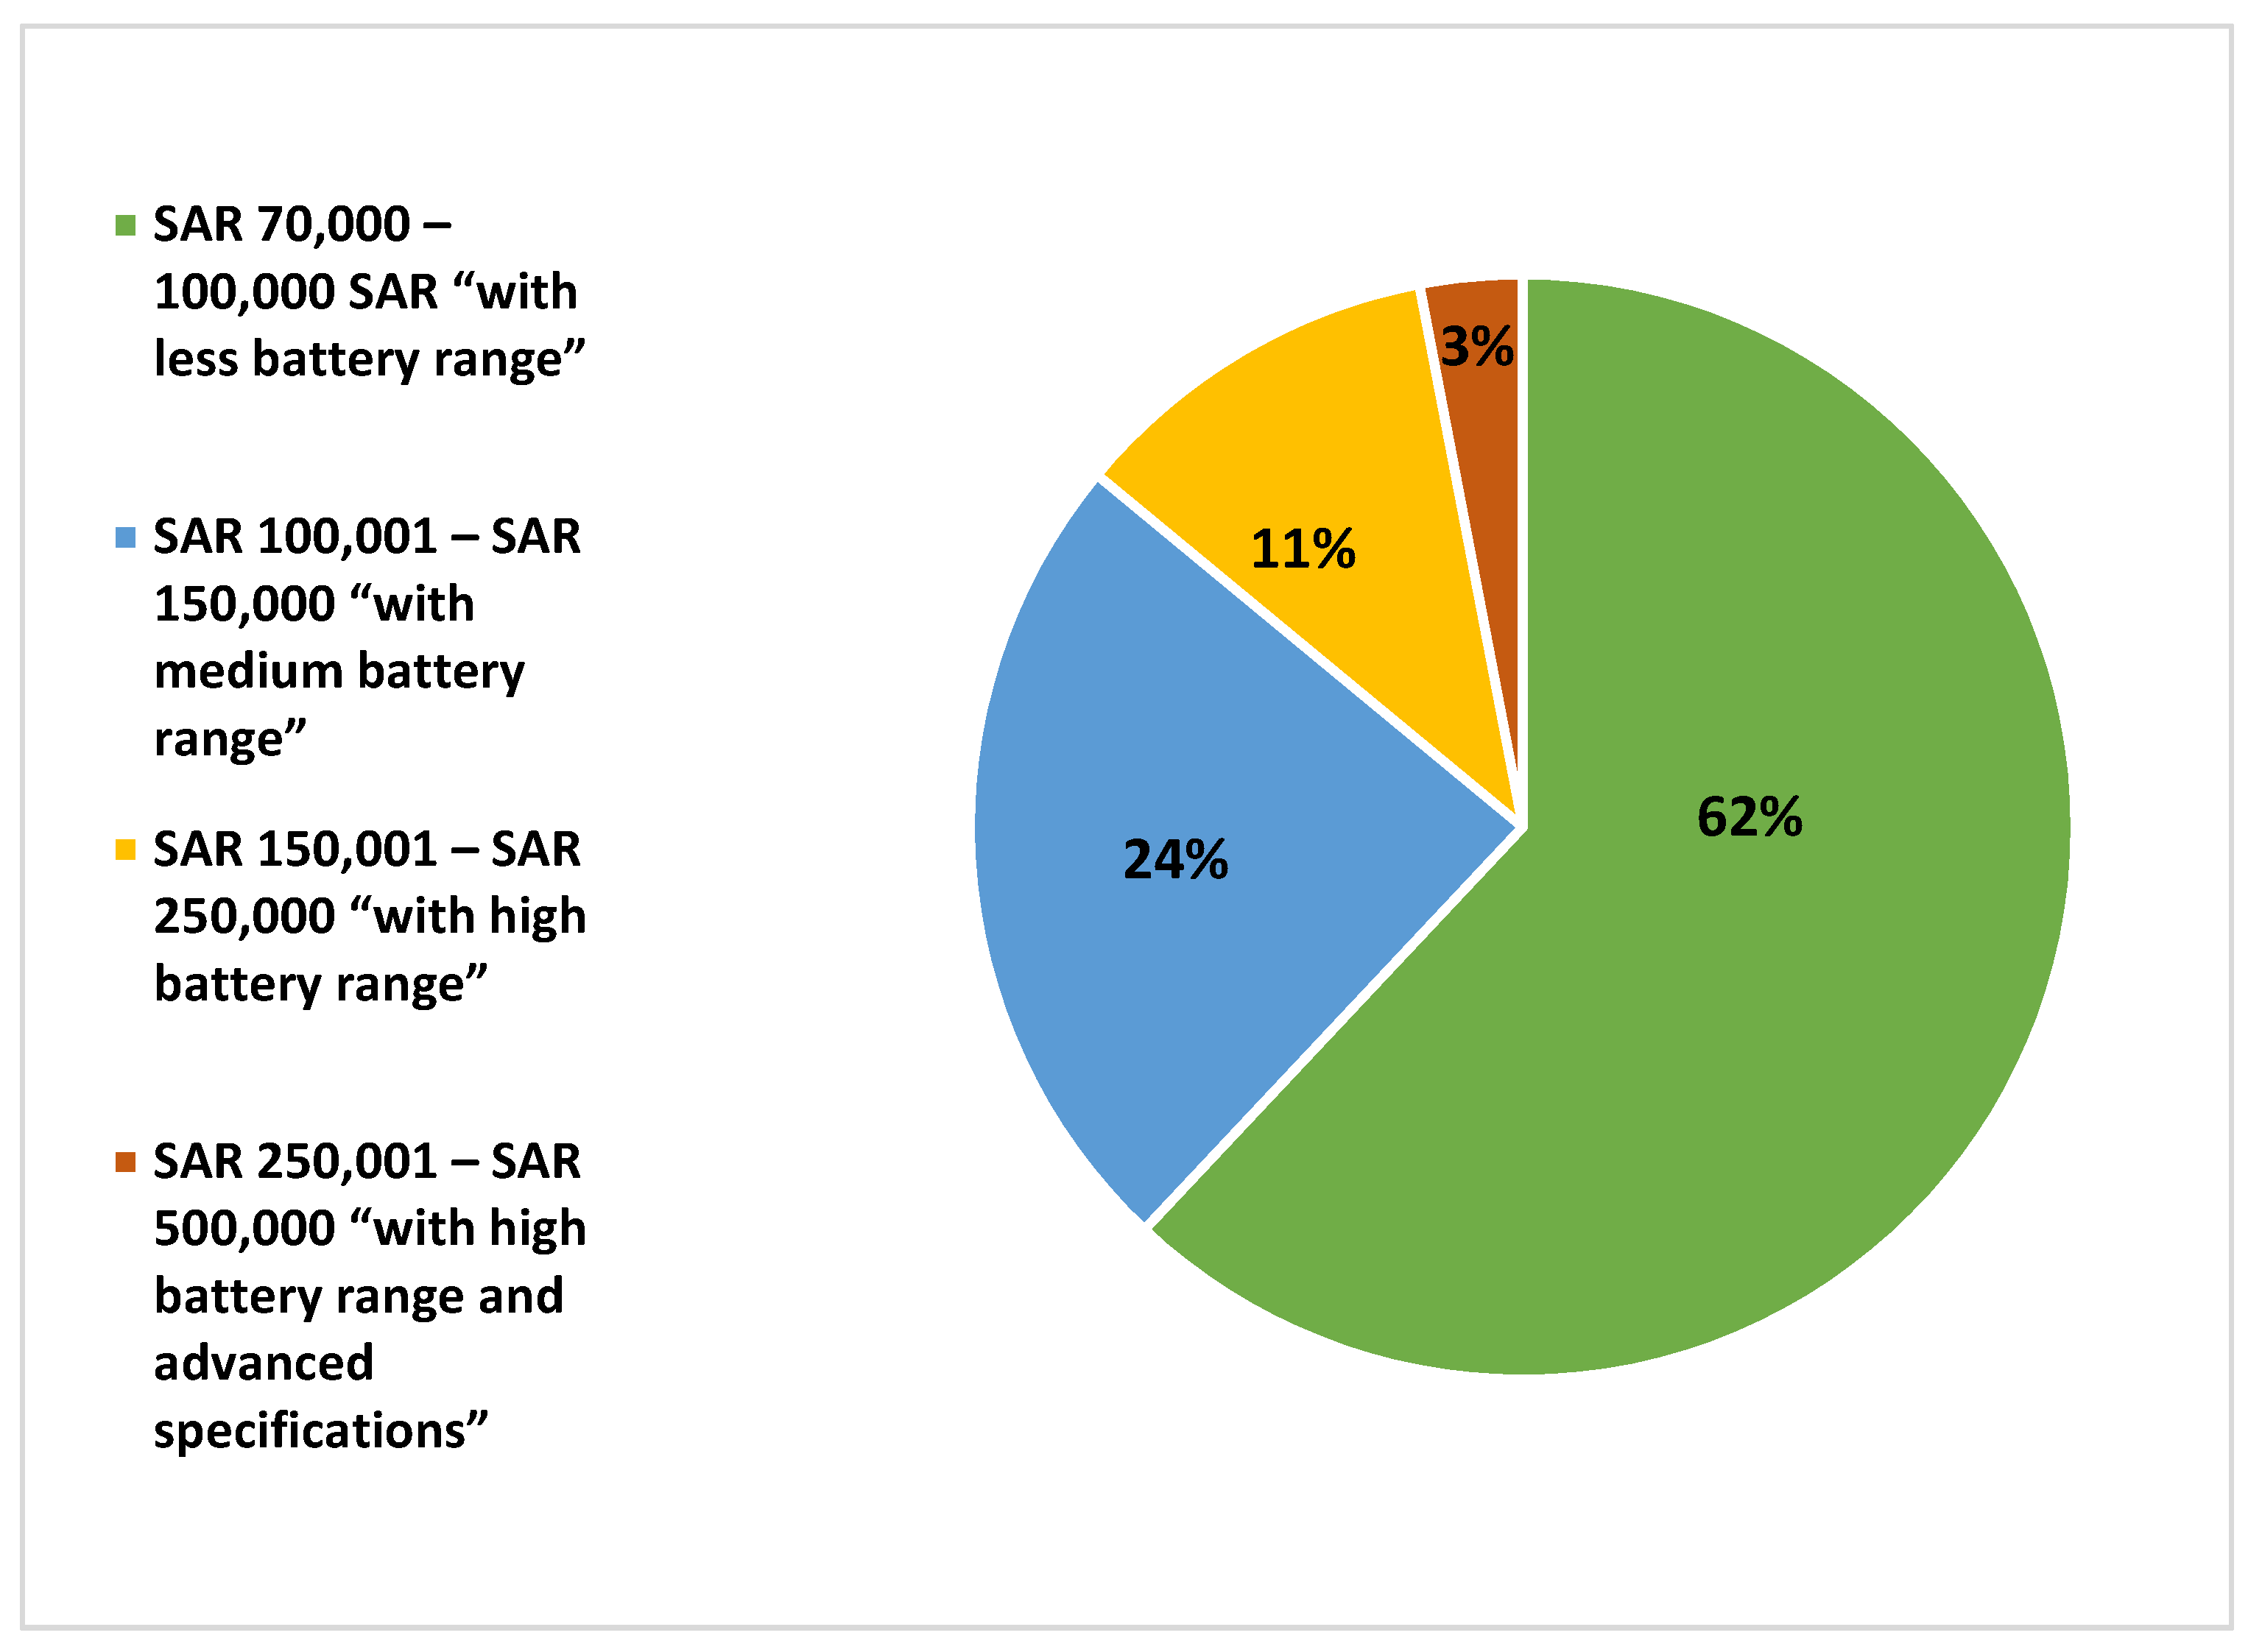
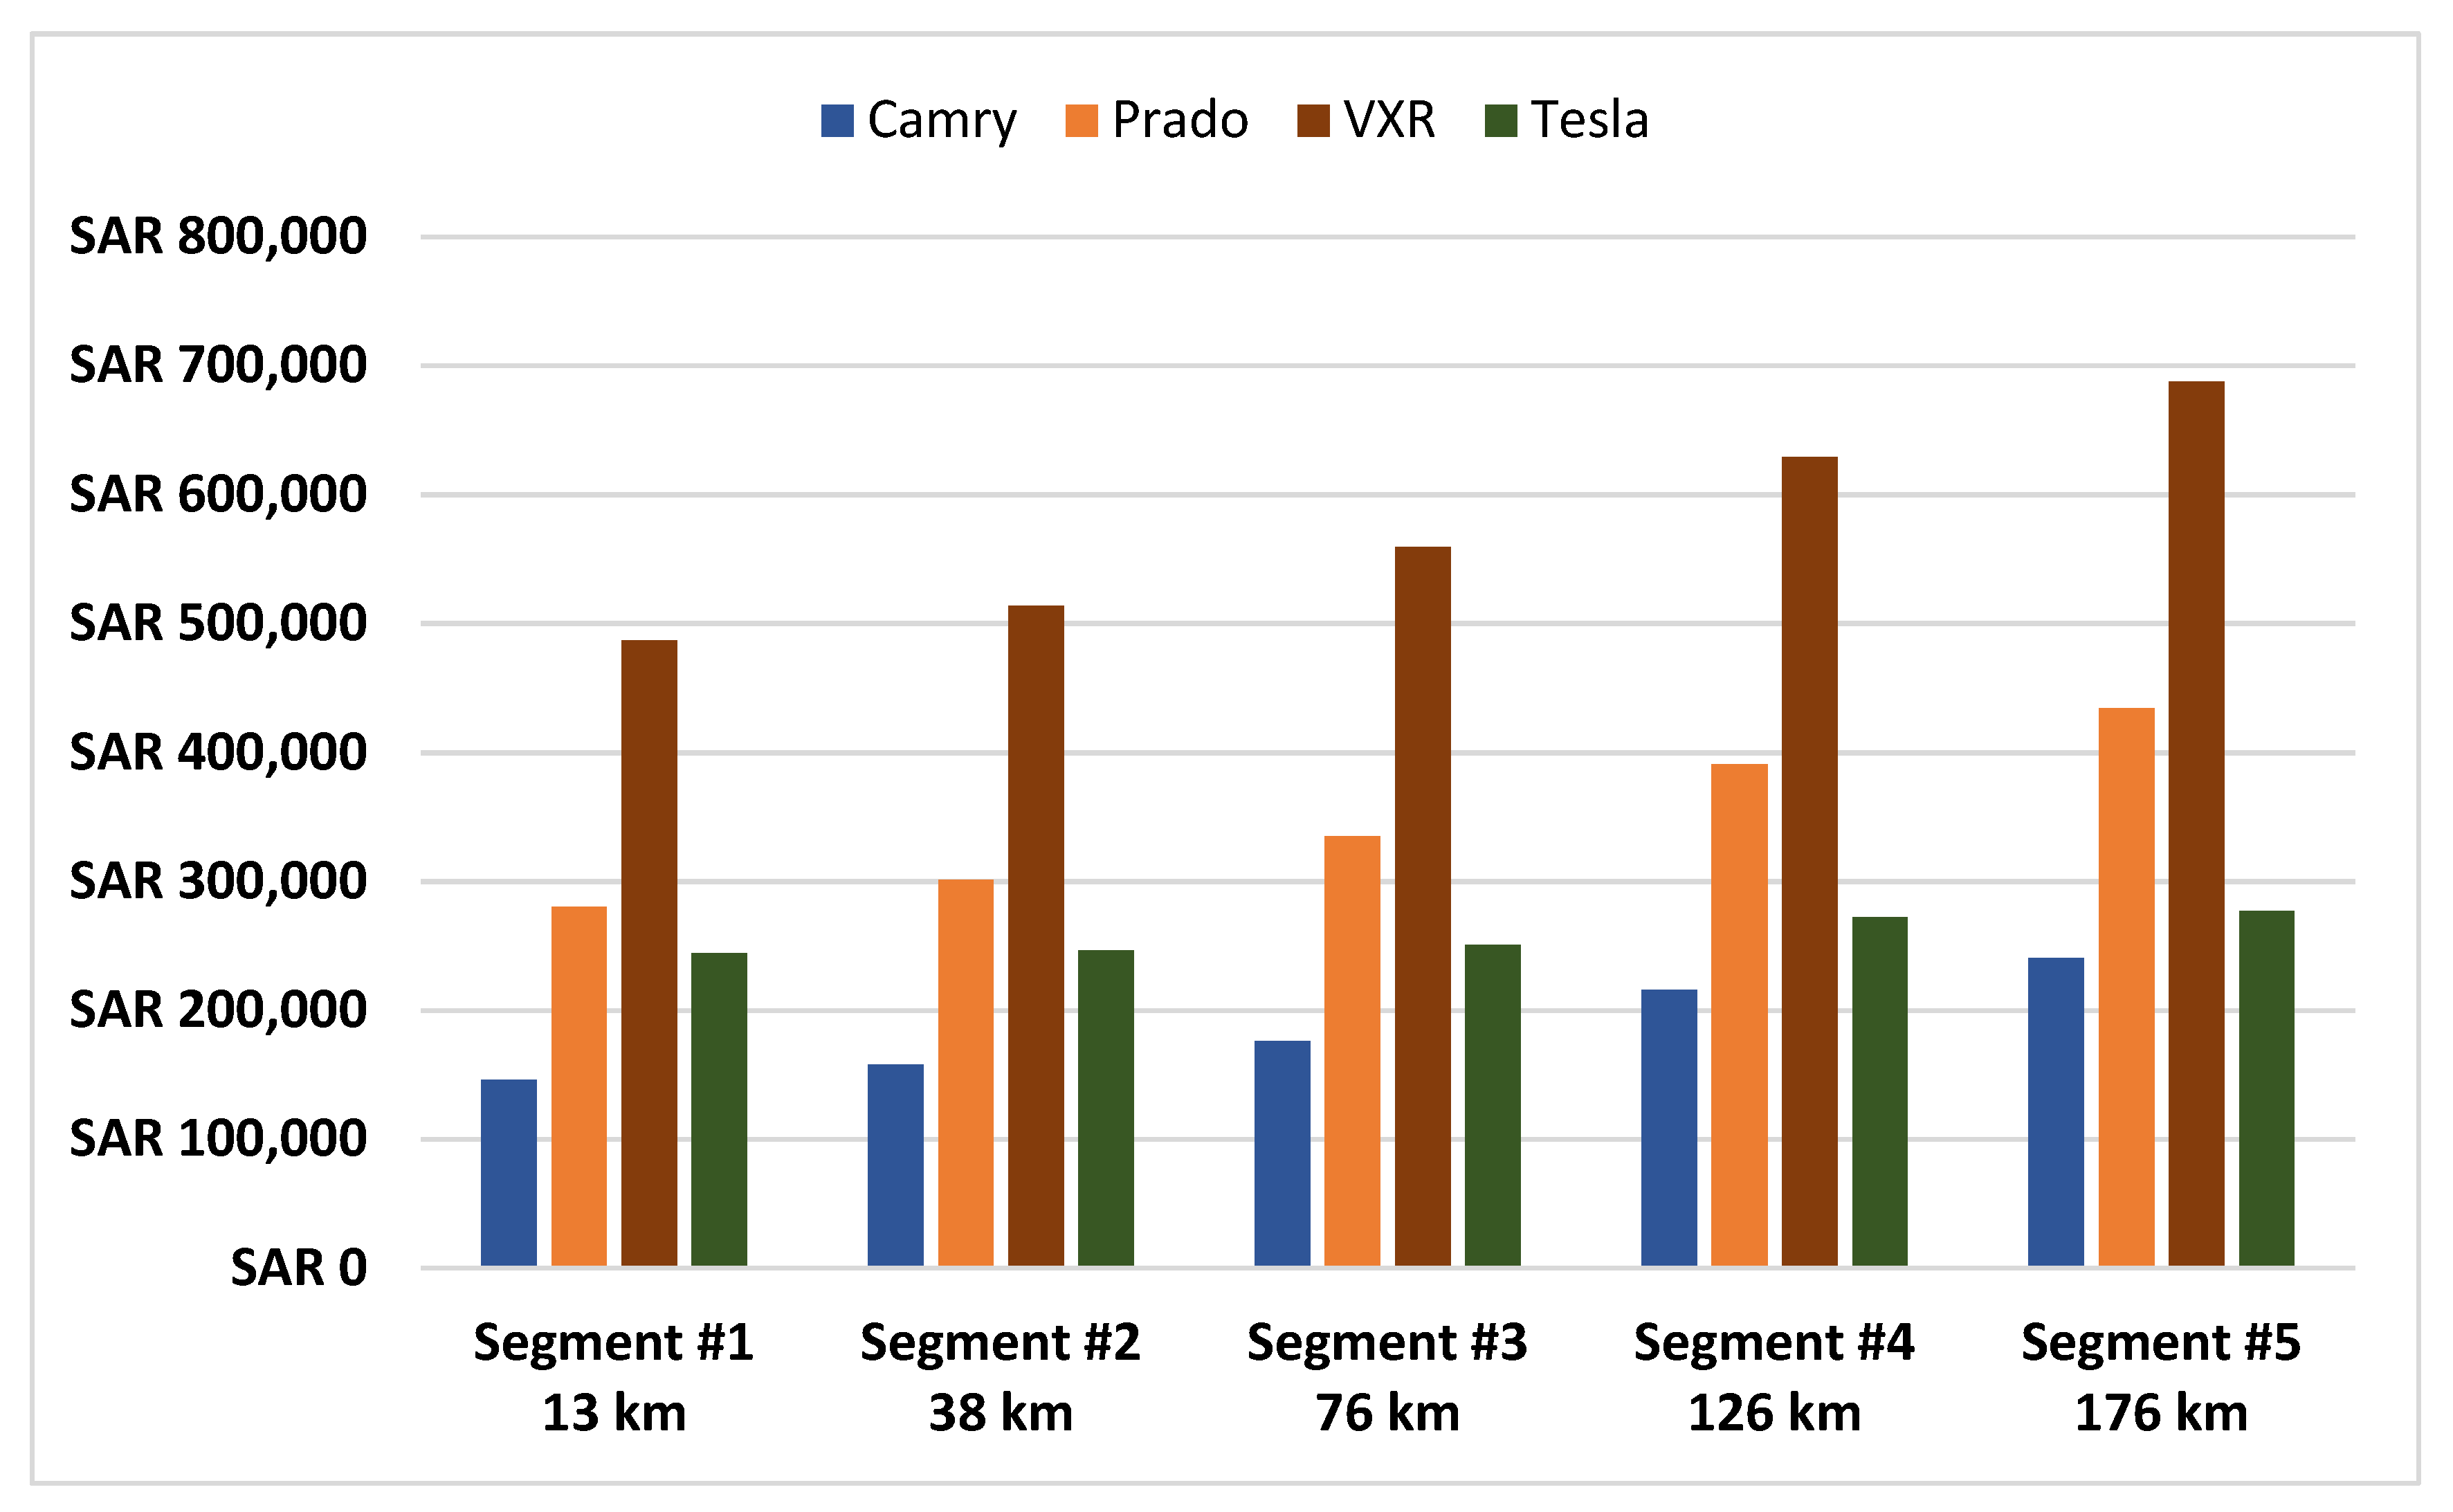
The most significant barrier in the financial category is EVs’ high purchase price, principally because batteries are expensive. However, low running costs (e.g., fuel and maintenance) make the total cost of EV ownership more competitive, especially by comparison with high-end ICEVs over longer distances (See Figure 9), and costs are expected to decline significantly in the coming decade as batteries become much cheaper [127]. The concerns expressed by some participants about the higher cost of electricity may be due to lack of knowledge about how much cheaper it is to charge an EV than to fill up an ICEV with petrol, allied to the fact that Saudi citizens now pay much more for home electricity (+260%) since subsidies were reduced [76]. Participants concerns about maintenance costs are more firmly grounded though, reflecting the fact that brand leaders, such as Mercedes and BMW, are particularly expensive to maintain in Saudi Arabia.
Both the qualitative and quantitative data reflect consumer concerns about the possible impact of EV adoption on the economy of Saudi Arabia, a country which is a major oil producer. This is a novel concern in the context of EVs; however, evidence from the Saudi Energy Efficiency Center [75] suggests that it may be misplaced. The KSA’s transportation industry currently consumes around 21% of the country’s total energy, with light duty cars accounting for 52% of the sector, and energy demand for transportation is anticipated to treble by 2030 [75]; therefore, EVs are unlikely to decrease oil production but rather help to meet rising energy demand. In addition, EVs require oil for raw materials and manufacture, and it is difficult to predict when this might no longer be the case. Finally, given the recent dramatic increases in global crude oil prices, reaching USD 128 per barrel in March 2022 [128], deploying EVs at a rate that is manageable in terms of energy consumption would mean more Saudi oil could be sold on the international market, as opposed to being supplied at low rates domestically, thereby helping the country’s economy rather than damaging it.
The last two barriers in relation to performance are the lower resale and insurance prices. Multiple factors, including mileage, modification, brand and model, condition, and cost of maintenance can impact the resale value of a vehicle, but battery replacement cost is unique to EVs and means they tend to lose value more quickly than ICEVs [129]. In addition, according to [6,130], in the early stages of EV adoption, resale values are unclear, making users of EVs more uncertain about this than with ICEVs. In terms of insurance prices, participants may be concerned that the expensive batteries in EVs will affect the insurance prices; however, research suggests that, on average, EV insurance prices are about USD 200 less per year than for a similar ICEV [131].
The social dimension is often ignored when sociotechnical systems, such as EVs, are designed [132], yet the findings of this study suggest that this is a significant barrier in the Saudi context. Part of the difficulty related to systems engineering lies in separating a system from its context, especially one which is designed for general consumers, who may be ignorant of its technical and environmental capabilities [133,134]. The qualitative data indicate that lack of consumer awareness about EVs may impact purchasing decisions, and this finding is supported in the literature [135]. While it is expected that participants in a country that has not yet deployed EVs will have less practical knowledge about them, this also indicates a lack of understanding about the sector as a whole and the benefits of EVs, both economically and environmentally, among potential users. The lack of trust in EVs in desert climates also suggests a lack of awareness, and EV manufacturers in the Saudi market need to enhance their marketing and educational efforts in order to achieve market penetration. The very fact that respondents recognise environmental sustainability as a concern in relation to EVs indicates that consumers in the KSA are becoming more environmentally aware; however, despite this, they placed relatively little importance on environmental issues in relation to EVs. This suggests that Saudi consumers may also be poorly informed about the advantages of EVs, including their potential to reduce GHG emissions. In this respect, suggesting that environmental awareness significantly influenced older users [7]. There is thus a need for more education regarding the environmental advantages of green transport, especially among younger drivers.
EV initiatives should include awareness-raising on environmental challenges and such knowledge should be disseminated from an early age through the government’s education policy. However, there are legitimate concerns about the environmental impact of EVs during their lifetime which should be addressed, especially in terms of reducing car usage and recycling. The operating phase of mobility has the greatest environmental impact, regardless of whether an ICEV or an EV is used [136], and greater investment in public transportation would reduce the number of car journeys taken. In addition, while LIBs are regarded as environmentally friendly, with a lower carbon footprint than other battery types, notably during the raw materials processing, manufacturing, and usage stages [137], waste in urban centres remains a critical issue, and a much greater understanding of all aspects of the EVs’ real-life cycle is required in order to conclusively identify them as environmentally beneficial [138].
The issue of renewable energy use and EVs is of particular interest in the Saudi context. The qualitative data show that consumers are aware of the need for alternative energy resources to be utilized to avoid overloading the grid. This concern may be explained by recent public energy awareness campaigns, and drivers wishing to ensure that future shortages will not limit their car use, hence the suggestion to employ alternative resources. Were renewable sources to be utilized, V2G technology could help to ease fluctuations and peak load shaving because parked EVs could constitute a resource during peak demand. However, concerns about V2G technology, including fears about potential reductions in battery life due to the effect of high temperatures when batteries are charged and discharged, should also be examined and addressed. In addition, financial incentives, infrastructure availability, and possible fuel-related savings are anticipated to be crucial factors influencing the adoption of EV [33], and these also have a social dimension in terms of their ability to change consumer behaviour. However, it is currently unclear how these can be deployed most effectively, and this makes it essential to investigate the social dimension further so as to promote understanding of the social features and challenges of the use and adoption of EVs.
Finally, the policy dimension, including regulation and governmental initiatives, is a significant factor, with policy on tax and infrastructure also seen as important in promoting EV adoption, alongside financial support for EV purchases and R&D projects [139]. In this context, the Lucid Motors proposal is consistent with the Saudi government’s Vision 2030 aim of technology localization. While Vision 2030 has a renewable energy component, SASO is responsible for technical regulation, and it has recently set out the minimum health and safety standards for EV consumers [140], marking a significant step towards the adoption of EVs in the country. However, the findings of this study suggest that a broader range of policy instruments, based on specific public policy goals, will be required. These should address technical EV requirements and regulations, but also improve awareness by providing accurate information on related issues, such as safety standards, guides for using and charging EVs, how to import them from abroad, how to perform maintenance in the absence of local repair centres, how to avoid the dangers of accidents, as well as guidance for firefighting personnel and others who may have to deal with incidents involving EVs.

6. Conclusions

EVs have the potential to have a substantially less negative impact on global climate than ICEVs, and governments around the world are beginning to take steps to support their adoption. With the recent deal with Lucid Motors, the Saudi government is taking a major step forward in this respect, and other initiatives in support of the low-carbon ambitions set out in Vision 2030 are also beginning to be operationalised. However, significant barriers to the widespread adoption of EVs in the KSA need to be overcome if these ambitions are to be realised. This study has examined public perceptions of EVs in the Kingdom, identified the barriers to their adoption, and created a framework which ranks them in order of their importance to potential users. The barriers have also been classified as either infrastructure, performance, financial, social, or policy concerns, without negating the connections between them. While many of these barriers are applicable internationally, others are particularly significant within Saudi Arabia, and other developing countries which share similar geographic and climatic contexts. For example, while the lack of charging infrastructure is common to many countries, the need to develop the grid infrastructure to support the additional demands of EVs is particular to a developing country with a hot climate in which the existing power systems sometimes struggles to meet demand, especially during the summer months.
Indeed, the extreme climate in the KSA and the varied terrain, encompassing both large desert areas and mountainous regions, give rise to a number of barriers, including concerns about the safety and effectiveness of batteries at high temperatures, and doubts about the overall ability of EVs to perform effectively in desert conditions. Manufacturers, such as Lucid Motors, would be advised to take steps to address these concerns if they wish to achieve market penetration in Saudi Arabia and in other countries in the region. Greater awareness raising campaigns by both manufacturers and governments are also required as the study suggests that the public do not yet fully appreciate the economic and environmental benefits of EVs, with misplaced concerns about charging costs and possible damage to the Saudi economy continuing to persist. By contrast, evidence suggests that the widespread adoption of EVs could actually benefit the economy, especially if they are powered by renewable sources of electricity, freeing up the country’s oil resources for sale at a higher price on the international market. Such a switch would also enhance EVs’ environmental credentials and reduce some of the pressures on the grid. The use of V2G technology would also help with this, but it would require both advances in charging technology and the provision of sufficient charging points to allow consumers to exchange energy freely with the grid.
Although the aims set out in Vision 2030 are beginning to be realised, Saudi Arabia is still at an early stage of EV adoption, and policy makers have not yet undertaken significant action to encourage sales. The study found that there is variation in the cost of the different EVs makes, for example, the Tesla Model 3 is up to 40% more expensive to own than a Toyota Camry, indicating that, in the absence of government subsidies or financial incentives, owning EVs may be much more expensive than owning small-sized internal combustion engine-based vehicles (ICEVs). The hope is that these findings will assist in promoting EV adoption in the country, and the wider region, by providing guidance to stakeholders, including policymakers and EV manufacturers. While some of the factors identified are country-specific, others have regional or global relevance, and this study’s results could be generalized to other contexts with similar climatic, geographic, and economic conditions, notably other Gulf states and other oil-producing nations. The proposed general framework could, however, also be used to identify and rank equivalent barriers in other regions or countries, if the analysis was customized accordingly. For example, purchase price might be seen as relatively unimportant in contexts where subsidy or other public policy support is offered, and battery cost and availability may matter less in countries with local manufacturing facilities.
The results of this study suggest that the widespread adoption of EVs in Saudi Arabia could help the country to achieve its emissions reduction goals, especially if steps are taken to develop more sustainable production processes and cleaner electricity grid mixes. This would both reduce the cost of EV charging and limit GHG emissions. While further research with the small number of drivers in Saudi Arabia who currently use EVs may reveal additional barriers, addressing the obstacles identified here would support the ambitions expressed in Vision 2030 and provide a model for EV adoption in major oil-producing states.

Author Contributions

S.O. and S.A. comprehended the presented core idea; S.A. conducted survey, formal analysis, data curation, methodology, validation, writing—original draft preparation; S.O. and Y.S. contributed to the revision of the manuscript’s draft and final version and supervised the project. All authors have read and agreed to the published version of the manuscript.

Funding

This research received no external funding.

Institutional Review Board Statement

Not applicable.

Informed Consent Statement

Not applicable.

Data Availability Statement

The data presented in this study are available on request from the corresponding author.

Conflicts of Interest

The authors declare no conflict of interest.

References

  1. Allen, M.; Dube, O.; Solecki, W.; Aragón-Durand, F.; Cramer, W.; Humphreys, S.; Kainuma, M.; Kala, J.; Mahowald, N.; Mulugetta, Y. Global Warming of 1.5 °C. IPCC Spec. Rep. Impacts Glob. Warm. 2018, in press. Available online: https://www.ipcc.ch/site/assets/uploads/sites/2/2019/05/SR15_Citation.pdf (accessed on 21 May 2022).
  2. European Environment Agency. Transport and Environment Report 2021, No. 02/2022. Available online: https://www.eea.europa.eu/publications/transport-and-environment-report-2021 (accessed on 21 May 2022).
  3. Steinhilber, S.; Wells, P.; Thankappan, S. Socio-technical inertia: Understanding the barriers to electric vehicles. Energy Policy 2013, 60, 531–539. [Google Scholar] [CrossRef]
  4. Department for Transport. Outcome and Response to Ending the Sale of New Petrol, Diesel and Hybrid Cars and Vans. Available online: https://www.gov.uk/government/consultations/consulting-on-ending-the-sale-of-new-petrol-diesel-and-hybrid-cars-and-vans/outcome/ending-the-sale-of-new-petrol-diesel-and-hybrid-cars-and-vans-government-response (accessed on 15 May 2022).
  5. Malmgren, I. Quantifying the societal benefits of electric vehicles. World Elec. Veh. J. 2016, 8, 996. [Google Scholar] [CrossRef]
  6. Chidambaram, K.; Ashok, B.; Vignesh, R.; Deepak, C.; Ramesh, R.; Narendhra, T.M.; Usman, K.M.; Kavitha, C. Critical analysis on the implementation barriers and consumer perception toward future electric mobility. Proc. Inst. Mech. Eng. Part D J. Automob. Eng. 2022, 9544070221080349. [Google Scholar] [CrossRef]
  7. Alotaibi, S.; Omer, S.; Aljarallah, S.; Su, Y. Potential implementation of EVs–Features, Challenges and User perspective. In Proceedings of the IEEE Green Energy and Smart Systems Conference (IGESSC), Long Beach, CA, USA, 1–2 November 2021. [Google Scholar]
  8. Kingdom of Saudi Arabia. The Saudi Green Initiative. 2021. Available online: https://www.saudigreeninitiative.org/about-saudi-green-initiative/ (accessed on 21 May 2022).
  9. Halawani, A.; Rehimi, F. Evaluation of the intention to shift to public transit in Saudi Arabia. Transp. Res. Part D Transp. Environ. 2021, 94, 102809. [Google Scholar] [CrossRef]
  10. Ullah, I.; Liu, K.; Yamamoto, T.; Zahid, M.; Jamal, A. Electric vehicle energy consumption prediction using stacked generalization: An ensemble learning approach. Int. J. Green Energy 2021, 18, 896–909. [Google Scholar] [CrossRef]
  11. Ludlow, E.; Martin, M. Saudi-backed Lucid in talks for electric car factory near Jeddah. Bloomberg 2021, 18, 896–909. Available online: https://www.bloomberg.com/news/articles/2021-01-07/saudi-backed-lucid-in-talks-for-electric-car-factory-near-jeddah (accessed on 21 May 2022).
  12. Schwartz, B. Lucid Motors Announces New Factory in Saudi Arabia. Available online: https://www.lucidinsider.com/2022/05/18/lucid-motors-announces-new-factory-in-saudi-arabia/ (accessed on 21 May 2022).
  13. Helmers, E.; Marx, P. Electric cars: Technical characteristics and environmental impacts. Environ. Sci. Eur. 2012, 24, 1–15. [Google Scholar] [CrossRef]
  14. Masiero, G.; Ogasavara, M.; Jussani, A.; Risso, M. Electric vehicles in China: BYD strategies and government subsidies. RAI Rev. Adm. Inovação 2016, 13, 3–11. [Google Scholar] [CrossRef]
  15. Zhou, G.; Ou, X.; Zhang, X. Development of electric vehicles use in China: A study from the perspective of life-cycle energy consumption and greenhouse gas emission. Energy Policy 2013, 59, 875–884. [Google Scholar] [CrossRef]
  16. Shen, W.; Han, W.; Chock, D.; Chai, Q.; Zhang, A. Well-to-wheels life-cycle analysis of alternative fuels and vehicle technologies in China. Energy Policy 2012, 49, 296–307. [Google Scholar] [CrossRef]
  17. Mierlo, J.; Berecibar, M.; El Baghdadi, M.; De Cauwer, C.; Messagie, M.; Coosemans, T.; Jacobs, V.; Hegazy, O. Beyond the state of the art of electric vehicles: A fact-based paper of the current and prospective electric vehicle technologies. World Elec. Veh. J. 2021, 12, 20. [Google Scholar] [CrossRef]
  18. Funke, S.; Burgert, T. Can charging infrastructure used only by electric taxis be profitable? A case study from Karlsruhe, Germany. IEEE Trans. Veh. Tech. 2020, 69, 5933–5944. [Google Scholar] [CrossRef]
  19. Pearre, N.; Kempton, W.; Guensler, R.; Elango, V. Electric vehicles: How much range is required for a day’s driving? Transp. Res. Part C Emerg. Technol. 2011, 19, 1171–1184. [Google Scholar] [CrossRef]
  20. Plötz, P.; Schneider, U.; Globisch, J.; Dütschke, E. Who will buy electric vehicles? Identifying early adopters in Germany. Transp. Res. Part A Policy Pract. 2014, 67, 96–109. [Google Scholar] [CrossRef]
  21. She, Z.-Y.; Sun, Q.; Ma, J.-J.; Xie, B.-C. What are the barriers to widespread adoption of battery electric vehicles? A survey of public perception in Tianjin, China. Transp. Policy 2017, 56, 29–40. [Google Scholar]
  22. Singh, V.; Singh, V.; Vaibhav, S. A review and simple meta-analysis of factors influencing adoption of electric vehicles. Transp. Res. Part D Transp. Environ. 2020, 86, 102436. [Google Scholar] [CrossRef]
  23. Palmer, K.; Tate, J.; Wadud, Z.; Nellthorp, J. Total cost of ownership and market share for hybrid and electric vehicles in the UK, US and Japan. App. Energy 2018, 209, 108–119. [Google Scholar] [CrossRef]
  24. Coffman, M.; Bernstein, P.; Wee, S. Electric vehicles revisited: A review of factors that affect adoption. Transp. Rev. 2017, 37, 79–93. [Google Scholar] [CrossRef]
  25. Tie, L. Status analysis and development planning for the network of charging stations. Eur. J. Elec. Eng. 2018, 20, 485. [Google Scholar]
  26. Al-Jarboua, Z. The national energy strategy for Saudi Arabia. World Acad. Sci. Eng. Tech. 2009, 3, 501–510. [Google Scholar]
  27. Hafez, O.; Bhattacharya, K. Optimal design of electric vehicle charging stations considering various energy resources. Renew. Energy 2017, 107, 576–589. [Google Scholar] [CrossRef]
  28. Egbue, O.; Long, S. Barriers to widespread adoption of electric vehicles: An analysis of consumer attitudes and perceptions. Energy Policy 2012, 48, 717–729. [Google Scholar] [CrossRef]
  29. Narassimhan, E.; Johnson, C. The role of demand-side incentives and charging infrastructure on plug-in electric vehicle adoption: Analysis of US States. Environ. Res. Lett. 2018, 13, 74032. [Google Scholar] [CrossRef]
  30. Funke, S.Á.; Sprei, F.; Gnann, T.; Plötz, P. How much charging infrastructure do electric vehicles need? A review of the evidence and international comparison. Transp. Res. Part D Transp. Environ. 2019, 77, 224–242. [Google Scholar] [CrossRef]
  31. Hardman, S.; Jenn, A.; Tal, G.; Axsen, J.; Beard, G.; Daina, N.; Figenbaum, E.; Jakobsson, N.; Jochem, P.; Kinnear, N. A review of consumer preferences of and interactions with electric vehicle charging infrastructure. Transp. Res. Part D Transp. Environ. 2018, 62, 508–523. [Google Scholar] [CrossRef]
  32. Quak, H.; Nesterova, N.; van Rooijen, T. Possibilities and barriers for using electric-powered vehicles in city logistics practice. Transp. Res. Procedia 2016, 12, 157–169. [Google Scholar] [CrossRef]
  33. Ninh, P.; Bentzen, K.; Laugesen, M.S. Why should transportation companies join Public Private Partnership (PPP) proposed by the public sector to support the implementation process of Freight Electric Vehicles (FEVs) in Copenhagen Municipality. NSR Act. 2014, 7, 4. [Google Scholar]
  34. Shareef, H.; Islam, M.M.; Mohamed, A. A review of the stage-of-the-art charging technologies, placement methodologies, and impacts of electric vehicles. Renew. Sustain. Energy Rev. 2016, 64, 403–420. [Google Scholar] [CrossRef]
  35. Yu, D.; Adhikari, M.P.; Guiral, A.; Fung, A.S.; Mohammadi, F.; Raahemifar, K. The Impact of Charging Battery Electric Vehicles on the Load Profile in the Presence of Renewable Energy. In Proceedings of the 2019 IEEE Canadian Conference of Electrical and Computer Engineering (CCECE), Edmonton, AB, Canada, 5–8 May 2019; pp. 1–4. [Google Scholar]
  36. U.S. Energy Information Administration. Saudi Arabia 2019 Primary Energy Data in Quadrillion Btu. Available online: https://www.eia.gov/international/overview/country/SAU (accessed on 21 May 2022).
  37. Noel, L.; Zarazua de Rubens, G.; Kester, J.; Sovacool, B. Vehicle-to-Grid: A Sociotechnical Transition beyond Electric Mobility; Palgrave Macmillan: London, UK, 2019. [Google Scholar]
  38. Jenkins, S.; Rossmaier, J.; Ferdowsi, M. Utilization and effect of plug-in hybrid electric vehicles in the United States power grid. In Proceedings of the IEEE Vehicle Power and Propulsion Conference, Harbin, China, 3–5 September 2008; pp. 1–5. [Google Scholar]
  39. Kester, J.; Noel, L.; De Rubens, G.; Sovacool, B. Promoting Vehicle to Grid (V2G) in the Nordic region: Expert advice on policy mechanisms for accelerated diffusion. Energy Policy 2018, 116, 422–432. [Google Scholar] [CrossRef]
  40. Weiller, C.; Neely, A. Using electric vehicles for energy services: Industry perspectives. Energy 2014, 77, 194–200. [Google Scholar] [CrossRef]
  41. Powerwall Modes. Tesla Website. Available online: https://www.tesla.com/en_gb/support/energy/powerwall/mobile-app/powerwall-modes (accessed on 21 May 2022).
  42. Ali, H.; Hussain, S.; Khan, H.; Arshad, N.; Khan, I. Economic and Environmental Impact of Vehicle-to-Grid (V2G) Integration in an Intermittent Utility Grid. In Proceedings of the International Conference on Smart Power & Internet Energy Systems (SPIES), Bangkok, Thailand, 15–18 September 2020; pp. 345–349. [Google Scholar]
  43. Sovacool, B.; Kester, J.; Noel, L.; De Rubens, G. Actors, business models, and innovation activity systems for vehicle-to-grid (V2G) technology: A comprehensive review. Renew. Sustain. Energy Rev. 2020, 131, 109963. [Google Scholar] [CrossRef]
  44. EDF. All about Electric Car Batteries. 2020. Available online: https://www.edfenergy.com/electric-cars/batteries (accessed on 21 May 2022).
  45. Andwari, A.M.; Pesiridis, A.; Rajoo, S.; Martinez-Botas, R.; Esfahanian, V. A review of Battery Electric Vehicle technology and readiness levels. Renew. Sustain. Energy Rev. 2017, 78, 414–430. [Google Scholar] [CrossRef]
  46. Coffin, D.; Horowitz, J. The supply chain for electric vehicle batteries. J. Int’l Com. Econ. 2018, 1. Available online: https://heinonline.org/HOL/LandingPage?handle=hein.journals/jice2018&div=9&id=&page= (accessed on 21 May 2022).
  47. Tang Model. BYD Company Limited Website. Available online: https://www.bydauto.eu/tang.html (accessed on 21 May 2022).
  48. ES8 Model. NIO Company Website. Available online: https://www.nio.com/es8 (accessed on 15 July 2022).
  49. M-Byte Model. BYTON Company Website. Available online: https://www.byton.com/m-byte (accessed on 15 July 2022).
  50. Lewis, M. Electric Vehicles Technology Brief, IRENA. 2017. Available online: https://www.irena.org/-/media/Files/IRENA/Agency/Publication/2017/IRENA_Electric_Vehicles_2017.pdf (accessed on 21 May 2022).
  51. Hensley, R.; Newman, J.; Rogers, M.; Shahinian, M. Battery technology charges ahead. McKinsey Q. 2012, 3, 5–50. [Google Scholar]
  52. Moses, M. Electric Cars with the Longest Range, EDF Energy 2020. Available online: https://www.edfenergy.com/for-home/energywise/electric-cars-longest-range (accessed on 21 May 2022).
  53. NIO, ES8 Model, Wattev2Buy. Available online: https://wattev2buy.com/electric-vehicles/nio-electric-vehicles/nio-es8-ev-crossover-specs-price-battery-range/ (accessed on 15 July 2022).
  54. BYTON, M-Byte Model. Wattev2Buy. Available online: https://wattev2buy.com/electric-vehicles/byton-ev-models-byton-electric-car-strategy-sales-news/byton-concept-ev-specs-range-battery-pictures/ (accessed on 15 July 2022).
  55. Office of Energy Efficiency & Renewable Energy. Alternative Fuels Data Center. Available online: https://afdc.energy.gov/fuels/electricity_infrastructure.html (accessed on 21 May 2022).
  56. Mouli, G.R.C.; Kaptein, J.; Bauer, P.; Zeman, M. Implementation of dynamic charging and V2G using Chademo and CCS/Combo DC charging standard. In Proceedings of the 2016 IEEE Transportation Electrification Conference and Expo (ITEC), Dearborn, MI, USA, 27–29 June 2016; pp. 1–6. [Google Scholar]
  57. Rumale, S.; Al Ashkar, H.; Kerner, T.; Koya, F.; Eitzenberger, M. Design and Implementation of an On-Board Vehicle CHAdeMO Interface for Vehicle-to-Grid Applications. In Proceedings of the 2020 IEEE International Conference on Power Electronics, Smart Grid and Renewable Energy (PESGRE2020), Cochin, India, 2–4 January 2020; pp. 1–6. [Google Scholar]
  58. Badallaj, V. How Many Charging Stations for Electric-Cars Are Needed in Oslo by 2020? Department of Informatics Faculty of Mathematics and Natural Sciences, University of Oslo: Oslo, Norway, 2019. [Google Scholar]
  59. Battery Lifespan. National Renewable Energy Lab Report. Available online: https://www.nrel.gov/transportation/battery-lifespan.html (accessed on 21 May 2022).
  60. WeatherOnline. Climate of the World; Saudi Arabia. Available online: https://www.weatheronline.co.uk/reports/climate/Saudi-Arabia.htm (accessed on 21 May 2022).
  61. Reddy, K. Energy sources and multi-input DC-DC converters used in hybrid electric vehicle applications—A review. Int. J. Hydrog. Energy 2018, 43, 17387–17408. [Google Scholar] [CrossRef]
  62. Battery Aging in an Electric Vehicle (EV). Battery University. Available online: https://batteryuniversity.com/learn/article/bu_1003a_battery_aging_in_an_electric_vehicle_ev (accessed on 21 May 2022).
  63. Travesset-Baro, O.; Rosas-Casals, M.; Jover, E. Transport energy consumption in mountainous roads. A comparative case study for internal combustion engines and electric vehicles in Andorra. Transp. Res. Part D Transp. Environ. 2015, 34, 16–26. [Google Scholar] [CrossRef]
  64. Keyser, M.; Pesaran, A.; Li, Q.; Santhanagopalan, S.; Smith, K.; Wood, E.; Ahmed, S.; Bloom, I.; Dufek, E.; Shirk, M. Enabling fast charging–Battery thermal considerations. J. Power Sources 2017, 367, 228–236. [Google Scholar] [CrossRef]
  65. Azorin-Molina, C.; Rehman, S.; Guijarro, J.A.; McVicar, T.R.; Minola, L.; Chen, D.; Vicente-Serrano, S.M. Recent trends in wind speed across Saudi Arabia, 1978–2013: A break in the stilling. Int. J. Climatol. 2018, 38, e966–e984. [Google Scholar] [CrossRef]
  66. Sun, P.; Bisschop, R.; Niu, H.; Huang, X. A review of battery fires in electric vehicles. Fire Technol. 2020, 56, 1361–1410. [Google Scholar] [CrossRef]
  67. Millen, S.; Page, E. Transport and Environment Statistics 2021 Annual Report; Department for Transport; UK Government: London, UK, 2021. [Google Scholar]
  68. Haddadian, G.; Khodayar, M.; Shahidehpour, M. Accelerating the global adoption of electric vehicles: Barriers and drivers. Electr. J. 2015, 28, 53–68. [Google Scholar] [CrossRef]
  69. Fulton, L. Ownership cost comparison of battery electric and non-plugin hybrid vehicles: A consumer perspective. Appl. Sci. 2018, 8, 1487. [Google Scholar] [CrossRef]
  70. Go Electric 35 Tariff. EDF Energy. Available online: https://www.edfenergy.com/electric-cars/tariffs (accessed on 21 May 2022).
  71. Zethmayr, J. Charge for Less: An Analysis of Hourly Electricity Pricing for Electric Vehicles. World Electr. Veh. J. 2019, 10, 6. [Google Scholar] [CrossRef]
  72. Vehicle Statistic Data for 1441H. Ministry of Interior. Available online: https://data.gov.sa/Data/en/dataset/vehicle-statistics-data-for-the-year-1441-ah/resource/b25cd025-8668-4c05-aff8-f7b699a3a555 (accessed on 21 May 2022).
  73. Hussain, M. Saudi Arabia to set maximum limit on car ownership. Drive Arabia. 2020. Available online: https://www.drivearabia.com/news/2020/06/23/saudi-arabia-to-set-maximum-limit-on-car-ownership/ (accessed on 21 May 2022).
  74. Al-Fouzan, S. Using car parking requirements to promote sustainable transport development in the Kingdom of Saudi Arabia. Cities 2012, 29, 201–211. [Google Scholar] [CrossRef]
  75. Enhancing Vehicles Energy Efficiency in Saudi Arabia. Saudi Energy Efficiency Center. 2018. Available online: https://theicct.org/sites/default/files/KSA_AlRoge_Enhancing%20Vehicles%20Energy%20Efficiency%20in%20Saudi%20Arabia.pdf (accessed on 21 May 2022).
  76. Aldubyan, M.; Gasim, A. Energy price reform in Saudi Arabia: Modeling the economic and environmental impacts and understanding the demand response. Energy Policy 2021, 148, 111941. [Google Scholar] [CrossRef]
  77. Tariffs and Connection Rates. Saudi Electric Company 2021. Available online: https://www.se.com.sa/en-us/customers/Pages/TariffRates.aspx (accessed on 21 May 2022).
  78. Almutairi, A. Plug-in electric vehicles and their impact on power generation availability: A real survey-based analysis in Saudi Arabia. Sustain. Cities Soc. 2021, 75, 103389. [Google Scholar] [CrossRef]
  79. Dubai Electricity & Water Authority. Available online: https://www.dewa.gov.ae/en/consumer/ev-community/ev-green-charger/ev-green-chargers-faq (accessed on 21 May 2022).
  80. Elshurafa, A.M.; Peerbocus, N. Electric vehicle deployment and carbon emissions in Saudi Arabia: A power system perspective. Electr. J. 2020, 33, 106774. [Google Scholar] [CrossRef]
  81. Alquthami, T.; Alsubaie, A.; Alkhraijah, M.; Alqahtani, K.; Alshahrani, S.; Anwar, M. Investigating the Impact of Electric Vehicles Demand on the Distribution Network. Energies 2022, 15, 1180. [Google Scholar] [CrossRef]
  82. Rahman, M.M.; Ghazi, G.A.; Al-Ammar, E.A.; Ko, W. Techno-Economic Analysis of Hybrid PV/Wind/Fuel-Cell System for EVCS. In Proceedings of the 2021 International Conference on Electrical, Communication, and Computer Engineering (ICECCE), Kuala Lumpur, Malaysia, 12 June 2021. [Google Scholar]
  83. Ghazi, A.; Petersen, K.; Reddy, R.; Nekkanti, H. Survey research in software engineering: Problems and strategies. arXiv 2017, arXiv:1704.01090. [Google Scholar] [CrossRef]
  84. Cummings, J.; Sibona, C. Crowdsourcing surveys: Alternative approaches to survey collection. J. Inf. Sys. App. Res. 2017, 10, 44–54. [Google Scholar]
  85. Vanderstoep, S.; Johnston, D. Research Methods for Everyday Life: Blending Qualitative and Quantitative Approaches; John Wiley & Sons: Hoboken, NJ, USA, 2009. [Google Scholar]
  86. Kumar, R. Research Methodology: A Step-by-Step Guide for Beginners, 3rd ed; SAGE: London, UK, 2011. [Google Scholar]
  87. Ralph, P.; Tempero, E. Construct validity in software engineering research and software metrics. In Proceedings of the 22nd International Conference on Evaluation and Assessment in Software Engineering, EASE2018, Christchurch, New Zealand, 28–29 June 2018; pp. 13–23. [Google Scholar] [CrossRef]
  88. Aljarallah, S.; Lock, R. An investigation into sustainable e-government in Saudi Arabia. Electronic J. e-Govt. 2020, 18, 1–17. [Google Scholar] [CrossRef]
  89. Braun, V.; Clarke, V. Using thematic analysis in psychology. Qual. Res. Psych 2006, 3, 77–101. [Google Scholar] [CrossRef]
  90. Makrakis, V.; Kostoulas-Makrakis, N. Bridging the qualitative–quantitative divide: Experiences from conducting a mixed methods evaluation in the RUCAS programme. Eval. Program Plan. 2016, 54, 144–151. [Google Scholar] [CrossRef]
  91. Swanson, R.; Holton, E. Research in Organizations Foundations and Methods of Inquiry; Berrett-Koehler: San Francisco, CA, USA, 2005. [Google Scholar]
  92. Field, A. Discovering Statistics Using IBM SPSS Statistics, 4th ed.; SAGE: London, UK, 2013. [Google Scholar]
  93. Saudi Arabia Population. Worldometer. Available online: https://www.worldometers.info/world-population/saudi-arabia-population/ (accessed on 21 May 2022).
  94. Rosseel, Y. Lavaan: An R package for structural equation modelling. J. Stat. Soft. 2012, 48, 1–36. [Google Scholar] [CrossRef]
  95. Wickham, H. Ggplot2: Elegant Graphics for Data Analysis; Springer: New York, NY, USA, 2016; ISBN 978-3-319-24277-4. Available online: https://ggplot2.tidyverse.org (accessed on 21 May 2022).
  96. Sullivan, G.; Artino, A. Analyzing and interpreting data from Likert-type scales. J. Grad. Med. Ed. 2013, 5, 541–542. [Google Scholar] [CrossRef] [PubMed]
  97. Faria, R.; Marques, P.; Moura, P.; Freire, F.; Delgado, J.; De Almeida, A.T. Impact of the electricity mix and use profile in the life-cycle assessment of electric vehicles. Renew. Sustain. Energy Rev. 2013, 24, 271–287. [Google Scholar] [CrossRef]
  98. Nahdi Parts. Available online: https://nahdiparts.com (accessed on 21 May 2022).
  99. Pitstop Arabia. Available online: https://www.pitstoparabia.com/en (accessed on 21 May 2022).
  100. Hawkins, T.; Singh, B.; Majeau-Bettez, G.; Stromman, A. Comparative environmental life cycle assessment of conventional and electric vehicles. J. Ind. Ecol. 2013, 17, 53–64. [Google Scholar] [CrossRef]
  101. Khan, S.; Kushler, A. Plug-in Electric Vehicles: Challenges and Opportunities; American Council for an Energy-Efficient Economy: Washington, DC, USA, 2013. [Google Scholar]
  102. Riyadh Traffic Department. Ministry of Interior. Available online: https://www.moi.gov.sa/wps/portal/Home/sectors/publicsecurity/traffic/trafficriyadh/ (accessed on 21 May 2022).
  103. Low Emission Vehicles Eligible for A Plug-In Grant. The Government of United Kingdom. Available online: https://www.gov.uk/plug-in-car-van-grants (accessed on 21 May 2022).
  104. The Benefits of Switching to an Electrical Vehicle. Department of Transport, Ireland. 2021. Available online: https://www.gov.ie/en/publication/fabfa-electric-vehicles/?referrer=http://www.gov.ie/en/service/electric-vehicle-grant-scheme/# (accessed on 21 May 2022).
  105. Arabian Drive. Available online: https://arabiandrive.com (accessed on 21 May 2022).
  106. Tesla Model 3; UAE Tesla. Available online: https://www.tesla.com/en_AE (accessed on 21 May 2022).
  107. Toyota Saudi Arabia. Available online: https://www.toyota.com.sa/en (accessed on 21 May 2022).
  108. Weldon, P.; Morrissey, P.; O’Mahony, M. Long-term cost of ownership comparative analysis between electric vehicles and internal combustion engine vehicles. Sustain. Cities Soc. 2018, 39, 578–591. [Google Scholar] [CrossRef]
  109. Reuters. Saudi King Decrees Women Be Allowed to Drive. 2017. Available online: https://www.reuters.com/article/us-saudi-women-driving/saudi-king-decrees-women-be-allowed-to-drive-idUSKCN1C12SB (accessed on 21 May 2022).
  110. Poll Reveals A Crowded List of Arabs’ Favourite Japanese Car Brands. Arab News. 2022. Available online: https://www.arabnews.com/node/1574736/%7B%7B (accessed on 21 May 2022).
  111. Tesla Model 3 is Now 16th Bestselling Car in the World. Forbes. 2021. Available online: https://www.forbes.com/sites/jamesmorris/2021/05/29/tesla-model-3-is-now-16th-bestselling-car-in-the-world/ (accessed on 21 May 2022).
  112. Tesla Model 3. Electric Vehicle Database. Available online: https://ev-database.org/car/1555/Tesla-Model-3 (accessed on 21 May 2022).
  113. Learn the Facts: Fuel consumption and CO2. National Resources Canada. Available online: https://www.nrcan.gc.ca/sites/www.nrcan.gc.ca/files/oee/pdf/transportation/fuel-efficient-technologies/autosmart_factsheet_6_e.pdf (accessed on 21 May 2022).
  114. Pimentel, J. A note on the usage of Likert scaling for research data analysis. Univ. S. Mindanao R D J. 2010, 18, 109–112. [Google Scholar]
  115. Adhikari, M.; Ghimire, L.P.; Kim, Y.; Aryal, P.; Khadka, S.B. Identification and Analysis of Barriers against Electric Vehicle Use. Sustainability 2020, 12, 4850. [Google Scholar] [CrossRef]
  116. Guo, Y.; Kelly, J.A.; Clinch, J.P. Variability in total cost of vehicle ownership across vehicle and user profiles. Commun. Transp. Res. 2022, 2, 100071. [Google Scholar] [CrossRef]
  117. Lévay, P.Z.; Drossinos, Y.; Thiel, C. The effect of fiscal incentives on market penetration of electric vehicles: A pairwise comparison of total cost of ownership. Energy Policy 2017, 105, 524–533. [Google Scholar] [CrossRef]
  118. Sovacool, B.; Hirsh, R. Beyond batteries: An examination of the benefits and barriers to plug-in hybrid electric vehicles (PHEVs) and a vehicle-to-grid (V2G) transition. Energy Policy 2009, 37, 1095–1103. [Google Scholar] [CrossRef]
  119. Palomino, A.; Parvania, M. Advanced charging infrastructure for enabling electrified transportation. Electr. J. 2019, 32, 21–26. [Google Scholar] [CrossRef]
  120. Dulău, L.; Bica, D. Effects of electric vehicles on power networks. Procedia Manuf. 2020, 46, 370–377. [Google Scholar] [CrossRef]
  121. Jackson, C. Expanding access to electric vehicles in California’s low-income communities. J. Sci. Policy Gov. 2021, 18. [Google Scholar] [CrossRef]
  122. Broadbent, G.H.; Metternicht, G.; Drozdzewski, D. An Analysis of Consumer Incentives in Support of Electric Vehicle Uptake: An Australian Case Study. World Electr. Veh. J. 2019, 10, 11. [Google Scholar] [CrossRef]
  123. Gandoman, F.H.; Ahmadi, A.; Bossche, P.V.D.; Van Mierlo, J.; Omar, N.; Nezhad, A.E.; Mavalizadeh, H.; Mayet, C. Status and future perspectives of reliability assessment for electric vehicles. Reliab. Eng. Syst. Saf. 2019, 183, 1–16. [Google Scholar] [CrossRef]
  124. Ruan, J.; Walker, P.D.; Zhang, N.; Wu, J. An investigation of hybrid energy storage system in multi-speed electric vehicle. Energy 2017, 140, 291–306. [Google Scholar] [CrossRef]
  125. Sandén, B.A. Systems Perspectives on Electromobility 2013; Chalmers Publication Library: Göteborg, Sweden, 2013. [Google Scholar]
  126. Yuksel, T.; Michalek, J.J. Effects of regional temperature on electric vehicle efficiency, range, and emissions in the United States. Environ. Sci. Technol. 2015, 49, 3974–3980. [Google Scholar] [CrossRef]
  127. Alotaibi, S.; Omer, S.; Su, Y. A review on the potential of electric vehicles in reducing world CO2 footprints. Int. J. Transp. Veh. Eng. 2020, 14, 570–578. [Google Scholar]
  128. Organization of the Petroleum Exporting Countries. OPEC Basket Price. Available online: https://www.opec.org/opec_web/en/data_graphs/40.htm (accessed on 30 May 2022).
  129. Schoettle, B.; Sivak, M. Resale Values of Electric and Conventional Vehicles: Recent Trends and Influence on the Decision to Purchase a New Vehicle; University of Michigan: Ann Arbor, MI, USA, 2018. [Google Scholar]
  130. Clean Energy Ministerial Secretariat at the U.S. Department of Energy, Understanding the Electric Vehicle Landscape to 2020. 2013. Available online: https://www.ourenergypolicy.org/wp-content/uploads/2013/09/GlobalEVOutlook_2013.pdf (accessed on 21 May 2022).
  131. CoverHound. Counting The Cost Of Electric Cars. Available online: https://www.coverhound.com/insurance-learning-center/counting-the-cost-of-electric-cars (accessed on 30 May 2022).
  132. Ferscha, A.; Zia, K.; Riener, A.; Sharpanskykh, A. Potential of social modelling in socio-technical systems. Procedia Comp. Sci. 2011, 7, 235–237. [Google Scholar] [CrossRef]
  133. Kroes, P.; Franssen, M.; De Poel, I.; Ottens, M. Treating socio-technical systems as engineering systems: Some conceptual problems. Sys. Res. Behav. Sci. 2006, 23, 803–814. [Google Scholar] [CrossRef]
  134. Aljarallah, S.; Lock, S. An exploratory study of software sustainability dimensions and characteristics: End user perspectives in the Kingdom of Saudi Arabia (KSA). In Proceedings of the ESEM 18: ACM/IEEE International Symposium on Empirical Software Engineering and Measurement, Oulu, Finland, 11–12 October 2018; pp. 1–10. [Google Scholar] [CrossRef]
  135. Carley, S.; Krause, R.M.; Lane, B.W.; Graham, J.D. Intent to purchase a plug-in electric vehicle: A survey of early impressions in large US cites. Transp. Res. Part D Transp. Environ. 2013, 18, 39–45. [Google Scholar] [CrossRef]
  136. Notter, D.A.; Gauch, M.; Widmer, R.; Wager, P.; Stamp, A.; Zah, R.; Althaus, H.-J. Contribution of Li-ion Batteries to the Environmental Impact of Electric Vehicles; ACS Publications: Washington, DC, USA, 2010. [Google Scholar]
  137. Liang, Y.; Su, J.; Xi, B.; Yu, Y.; Ji, D.; Sun, Y.; Cui, C.; Zhu, J. Life cycle assessment of lithium-ion batteries for greenhouse gas emissions. Resour. Conserv. Recycl. 2017, 117, 285–293. [Google Scholar] [CrossRef]
  138. Awasthi, A.K.; Cheela, V.S.; D’Adamo, I.; Iacovidou, E.; Islam, M.R.; Johnson, M.; Miller, T.R.; Parajuly, K.; Parchomenko, A.; Radhakrishan, L. Zero waste approach towards a sustainable waste management. Resour. Environ. Sustain. 2021, 3, 100014. [Google Scholar] [CrossRef]
  139. Cansino, J.; Sánchez-Braza, A.; Sanz-Díaz, T. Policy instruments to promote electro-mobility in the EU28: A comprehensive review. Sustainability 2018, 10, 2507. [Google Scholar] [CrossRef]
  140. Technical Regulations for Electric Vehicles. Saudi Standards, Metrology and Quality Organization. 2019. Available online: https://saso.gov.sa/en/Laws-AndRegulations/Technical_regulations/Documents/TR%20-%20Electric%20Vehicles.pdf (accessed on 21 May 2022).
Figure 1. Various battery technologies used in EVs and their specific energy and specific power ratings.
Electricity 03 00020 g001
Figure 2. Daily mileage of participants.
Electricity 03 00020 g002
Figure 3. Fuel consumption per day.
Electricity 03 00020 g003
Figure 4. CO2 emissions (kg/L).
Electricity 03 00020 g004
Figure 5. Respondents’ EV price preferences in terms of battery range.
Electricity 03 00020 g005
Figure 6. Respondents’ willingness to use V2G if they derived economic benefit from doing so.
Electricity 03 00020 g006
Figure 7. Most repeated words.
Electricity 03 00020 g007
Figure 8. Thematic framework.
Electricity 03 00020 g008
Figure 9. Cost of ownership of EVs and ICEVs over a 10-year period.
Electricity 03 00020 g009
Table 1. Major electric car manufacturers and models, showing range, battery size, battery manufacturers, location of battery pack assembly and location of battery cell production [46,47,48,49].
Car ManufacturerModelRange (km)Battery Size (kWh)Battery ManufacturerBattery Pack Assembly LocationBattery Cell Production Location
TeslaModel S & X416–539, 47475 or 100Panasonic/TeslaUSAJapan
BYDTang52886.4BYDChinaChina
BYTONM-Byte430–55072–95CALTChinaChina
TeslaModel 3354–49850–74Panasonic/TeslaUSAUSA
ChevroletBolt EV38360LG ChemUSAS Korea
NIOES842584CALTChinaChina
NissanLeaf24330Automotive energy supply corp.USAUSA
Fiat500e13524SB LiMotiveUSAUSA
VWe-Golf20235.8Samsung SDIHungaryS Korea
FordFocus Electric19033.5LG ChemUSAUSA
BMWI318322–33Samsung SDIHungaryS Korea
KiaSoul EV17827SK innovationsS KoreaS Korea
Reprinted with permission from [46]. 2022, Coffin, David.
Table 2. The most modern EVs available in the market: predicted and real-world range, home and rapid charging times [47,52,53,54].
ModelManufacturers’ Range (km)Real-World Range (km)Charging Time
Home Charging (h)Rapid Charging (min)
Tesla Roadster9989653244
Tesla Model S6035231538
Volkswagen ID. 354747512.2534
Tesla Model 354747511.7522
BYD Tango52840010.7530
BYTON M-Byte5203891230
Polestar 24984501228
Skoda vision IV49844213.2533
Jaguar I pace47040713.5044
Kia e-Niro45337810.544
Mercedes-Benz EQC45036212.7535
Hyundai Kona Electric44939410.544
NIO ES84253551290
Table 3. Chargers, miles per charging hour and charging times for each level of charging [55,58].
Charging LevelsMiles per Charging HourCharging Time for a 24 kWh Battery PackCharger Standard
AC level 12–5~17 hSAE J1772
AC level 210–20~8 hSAE J1772
DC fast charging50–70~30 minCHAdeMO, CCS, Combo, Tesla Supercharger
Table 4. Lifespans, characteristics, and applications of commonly used energy storage batteries [61].
Energy Storage TypeSpecific Energy (Wh/kg)Specific Power (W/kg)Life Cycle (Cycles)Efficiency (%)Applications
Lead–acid battery Grid energy storage, UPS, electric vehicle lighting and ignition
Lead–acid351801000>80
Advanced lead–acid452501500_
Metal foil lead–acid 30900500+_
Nickel battery Digital cameras, electric vehicles, portable electronics, and toys
Nickel–iron50–60100–150200075
Nickel–zinc75170–26030076
Nickel–cadmium (Ni–Cd)50–80200200075
Nickel metal hydride (Ni-MH)70–95200–300<300070
Lithium battery Electric vehicles, smart phones, laptops, electric toys, digital cameras
Lithium ion118–250200–4302000>95
Lithium ion polymer (LiPo)130–225260–450>1200_
Lithium iron phosphate (LiFePO4)1202000–450042,000_
Lithium ion sulphide (FeS)1503001000+80
Lithium titanate80–100400018,000_
ZEBRA battery Automobile applications
Sodium sulphur150–240150–230800+80
Sodium nickel chloride 90–1201551200+80
Metal air battery Grid storage and electric vehicles
Aluminium air22060__
Zinc air46080–14020060
Zinc460___
Lithium air1800___
Adapted with permission from [61]. 2022, Elsevier.
Table 5. EV manufacturers and models with range, battery capacity, per kWh energy consumption, and manufacturer’s suggested retail price [69].
ManufacturerModelRange (km)Battery Capacity (kWh)km/kWhMSRP (USD)
TeslaModel S 100D5641005.6594,000
TeslaModel S P100D5421005.42135,000
TeslaModel 3498786.3935,000
TeslaModel X 100D4741004.7596,000
TeslaModel X P100D4651004.65140,000
TeslaModel S 75D442755.9074,500
ChevroletBolt EV383606.3936,620
TeslaModel X75381755.0870,532
VWe-Golf20135.85.6230,495
HyundaiIoniq Electric200287.1329,900
FordFocus Electric185335.6029,120
BMWI3183335.5544,450
KiaSoul EV178305.9532,250
NissanLeaf172305.7429,900
HondaClarity Electric15025.55.6133,400
Fiat500e140245.8432,995
Table 6. Hourly and flat charging rates for Tesla and Bolt and corresponding savings over conventional petrol cars [71].
Driver Profile 1VehicleHourly (USD)Flat Rate (USD)% Saving HourlyUSD Saving Hourly
Light driverTesla37915954
Bolt40985958
Average driverTesla7418259108
Bolt8119659115
Heavy driverTesla13230357172
Bolt14332756184
Lyft/UberTesla28960752318
Bolt31565452339
1 Light driver—24 miles/day; average driver—48 miles/day; heavy driver—80 miles/day; Lyft/Uber driver—161 miles/day.
Table 7. Demographic data on survey participants.
VariableClassificationNo.
NationalitySaudi669
Non-Saudi28
GenderFemale105
Male593
Marital statusSingle169
Married520
Others9
RegionNorthern 18
Southern 52
Eastern 68
Central 419
Western 140
Age18–29123
30–39260
40–49222
Above 5093
Education levelBelow high school7
High school103
Diploma68
Bachelor’s degree359
Higher degree159
Other1
Table 8. Mean ranking of barriers.
ItemFeatureMean Ranking
Q10Availability of charging stations3.85
Q18Duration of charging3.74
Q14Lack of trust in EVs as new technology3.36
Q15High maintenance costs3.22
Q16Limited driving range3.16
Q20Terrain and weather conditions in the KSA are not suitable for EVs3.04
Q12Costs involved in charging2.84
Q13Purchase an EV is more expensive than an ICEV2.79
Q17Safety concerns about rechargeable battery2.71
Q11No need to use EVs as the KSA is one of the biggest petroleum-producing countries2.32
Table 9. Thematic analysis of the barriers to EV adoption.
ThemesFrequency%Example of Comments
Reliability2112.3“EV problems are more than its benefits”—P311
Lack of repair and maintenance workshops1910.3“Difficulty of maintenance and unqualified labour”—P85
Lack of knowledge of EVs189.6“Society needs to change its perceptions about EVs”—P646
Weather conditions and terrains189.6“EVs are not suitable with KSA weather, which is too hot in the summer season”—P311
Safety168.2“How to deal with EVs accidents and its battery fire?”—P486
Absence of awareness raising about EVs157.8“Education in the schools and universities about EVs and covering all the progress, including the positive and negative aspects”—P203
Lack of charging stations (public and private)147.1“EVs charging stations must be completed before launch it”—P554
Higher purchase price136.4“The prices of EVs are so expensive and exaggerated”—P148
Lack of trust that EVs can be used in the desert105.5“Trust of EVs for use it in desert and endurance like conventional cars”—P622
Put more load on the electricity grid94.7“Using EVs will cause electricity shortage especially in the summer when the electricity is highly demand because air conditioning”—P293
Battery replacement cost94.7“Replacement batteries are costly and will increase the running costs”—P714
Limited range83.2“Driving range is still too short in EVs for a big country like KSA”—P966
Limited battery life72.5“High temperature will affect the batteries’ life and quality”—P986
Lack of environmental sustainability72.5“EVs are not environmentally friendly, especially batteries part”—P210
Higher electricity price for charging62“EVs are high consumers of electricity and electricity is already expensive”—P94
Duration of charging41.7“It is charging very slowly, so what can I do when I have an emergency trip?”—P972
Deploying EVs will badly affect the country’s economy31“The spread of EVs will cause decreasing export of crude oil and that will strongly affect the Saudi economy”—P285
Lower resale price20.7“The resale price of EVs does not encourage consumers”—P132
Insurance price10.2“Because of the high prices of batteries, EV insurance will be very expensive”—P750
Publisher’s Note: MDPI stays neutral with regard to jurisdictional claims in published maps and institutional affiliations.

