Article

Minimizing the Cost of PHEV Usage with Price Sensitive Charging Strategies

Wireless and Mobile Communications Lab, Department of Informatics and Telecommunications, University of Peloponnese, 22100 Tripoli, Greece
*
Author to whom correspondence should be addressed.
Electricity 2021, 2(4), 459-470; https://doi.org/10.3390/electricity2040027
Submission received: 9 September 2021 / Revised: 19 October 2021 / Accepted: 20 October 2021 / Published: 25 October 2021

Abstract

:
Electric cars sales have been rising almost steadily over the past decade. Uncontrolled charging has recently emerged as the main detrimental factor to this otherwise environmentally friendly and paradigm shifting technology due to the incurred impact on the energy grid. In addition, people are usually hesitant in allowing their vehicles to be controlled by external units; therefore, controlled charging strategies that offer users the option to have some control over their vehicles seems to be a sensible choice moving towards a gasoline-free vehicles market. This work investigated two price-sensitive charging strategies that allowed users to control the charging of their vehicle in order to receive cost benefits. These strategies were of a parametric nature; thus, the analysis focused on providing useful rules of thumb to guide users in choosing the most suitable strategy and the relevant parameters according to their driving profiles. The results show that when driving less than 40 km/h on average and employing a price-sensitive charging strategy with the proposed optimized parameters, electric car users may obtain 30–40% of the running cost reduction.

1. Introduction

Since 2010, there has been a 40% increase per year in the global car stock for electric vehicles (EVs) [1]; however, since 2019 EV sales have slowed and the COVID-19 pandemic has affected the entire car market. Against this difficult market backdrop, in 2020, EVs accounted for 4.2% of global car sales [2], and this was mainly due to supportive polices that several countries worldwide have adopted over the last several years and continue to introduce.
In an effort to increase the sale of EVs and reduce fuel demand, European governments have introduced purchase incentives [3] for EV owners, reducing the large up-front cost of owning an EV.
In alignment, the research community is also focusing on proposing system-wide strategies and architectures that foster transport electrification via economic incentives for the involved parties and the diverse roles comprising the EV ecosystem. For instance, ref [4] focused on minimizing the energy consumption costs of EVs, thus mainly serving the owner; ref [5,6] proposed price incentive-based charging strategies that benefit both the EV owner and charging station owner. In [7], a contract-based model that promises benefits for the three interacting parties (i.e., the EV owner, the EV fleet operator, and the aggregator) is presented. The work in [8] aimed to optimize profits for the charging station owner and that in [9] for the operator of multi-energy systems.
EVs need to be connected to the energy grid to charge their batteries. The consumption of the energy stored in their batteries mainly depends on the consumption of the vehicle when it is moving at a certain speed. According to [10], there are three main charging strategies: uncontrolled charging (UCC), external charging strategies (ECS), and individual charging strategies (ICS). Each strategy relates to the options provided to users during a day, and most of them facilitate the network as they can employ price changes or motivate drivers to charge EVs at different times in order to properly and smoothly use energy without overloading the system, i.e., controlling electricity consumption through demand response [11].
This paper reports original work that was conducted in the context of the EU HORIZON 2020 project MERLON (Integrated Modular Energy Systems and Local Flexibility Trading for Neutral Energy Islands) [12]. It studied price sensitive ICS strategies where plug-in hybrid electric vehicle (PHEV) users decided on the charging strategy along with the associated parameters involved. Specifically, it provides insights and useful rules of thumb on how a PHEV owner can make decisions regarding the charging of their vehicle in the context of the proposed strategies. This causes charging patterns to change due to the variations in electricity during the day; the user may choose to charge his vehicle based on a lower price. Note that this kind of charging strategy allows people to have control over the charging of their vehicle, as a result users’ hesitation in adopting controlled charging, which has been shown to improve grid voltage [13], grid losses [14], and charging costs [15]. Note that relevant work targeting EVs has also been carried out by other EU funded projects such as the COMPILE project [16].
The remainder of this paper is organized as follows: Section 2 describes the simulation platform along with the specifics of the price sensitive strategies proposed, Section 3 analyzes the results with respect to the different system parameters, Section 4 discusses the results and, finally, Section 5 concludes this work, summarizing guidelines for the optimized selection of parameters that lead to minimized costs for the PHEV user.

2. Problem Formulation and Simulation Methodology

The electrical energy price is defined in the power market of each country and varies throughout the day. This study considered real data [17] on the price’s variation, p ( t ) , as shown in Figure 1 (black line). As depicted, charging at night hours can be as much as 45% cheaper than if charging early in the afternoon.
The price variation is used by providers in order to regulate the load in the energy grid, and it offers PHEV users cost incentives to adopt a controlled charging policy. In this context, the charging strategies presented in [18] are again considered here, and now their parameters are analyzed in order to lead to optimized configurations (i.e., useful rules of thumb) that can be used by PHEV owners in order to receive cost benefits.

2.1. Charging Strategies

Uncontrolled charging, referred to as scenario 1 in the following, was considered the baseline cost of PHEV usage. In scenario 1, the PHEV charges with no restrictions every time it parks. Then, two price sensitive charging policies were employed. In scenario 2, each time the PHEV can charge, two user defined parameters were considered, i.e., the price threshold, which determines the maximum provider price that the user is willing to pay in order to charge, and a parameter, S o C f l e x , that defines the minimum battery level at which controlled charging is allowed. Hence, if the battery level is under the S o C f l e x level, charging will take place without considering the electricity price. Scenario 3 follows the same policies as scenario 2, but it also introduces a discharging functionality in the context of V2G systems, and an additional parameter is considered, S o C v 2 g , i.e., the minimum battery level at which discharging is allowed. Figure 2 depicts an abstract representation of the charging policies that are employed.
As Figure 2 suggests, charging policies are based on the price threshold (red line in Figure 2), which in the context of this work was defined by the user as a percentage of the mean electricity price p ( t ) ¯ over the duration of 24 h. Hence, the user decides on the price threshold coefficient p t h , so that p r i c e   t h r e s h o l d = p t h p ( t ) ¯ . For example, when the electricity price is p ( t ) < p t h p ( t ) ¯ , the energy cost is considered low and charging is allowed for all scenarios. However, when p ( t ) > p t h p ( t ) ¯ , uncontrolled charging is only employed in scenario 1. In scenario 2, charging is allowed based on the PHEV battery SoC level and, in particular, on the S o C f l e x threshold, while in scenario 3, V2G functionality is also employed when the SoC level is higher than the S o C v 2 g threshold. Note that both the S o C f l e x and S o C v 2 g values are defined by the PHEV user.
Therefore, the aim of this work was to analyze the parameters involved in such price sensitive strategies and offer guidelines for choosing systemic parameters (i.e., p t h ,   S o C f l e x , and S o C v 2 g ) in order for the PHEV user to take advantage of the variable price offers of the provider and receive cost benefits. As the analysis in Section 3 indicates, driving speed is an important variant that affects the optimal selection of the aforementioned parameters.

2.2. Simulation

The simulation platform considers 2000 EVs the state (i.e., driving or parking) of which is stochastically determined for each time slot over a simulation period of 7 days via transition probabilities derived from the NHTS [19]. Thus, the results are based on the average values of over 1000 Monte Carlo iterations.
Figure 3 provides an abstract description of the simulation platform. Specifically, the simulation accepts two kinds of inputs: the network defined price, p ( t ) , throughout the day (Figure 1), and the user defined parameters, i.e., the average driving speed ( u ), the charging strategy (scenarios 1, 2, and 3) and the relevant parameters ( S o C f l e x and S o C v 2 g ), and the price threshold coefficient ( p t h ).
The outputs of the simulation platform are the load induced on the electrical grid from the PHEV’s charging needs averaged over 24 h, the SoC level per PHEV averaged over 24 h, and the total cost for 24 h, aggregating the charging cost as well as the fuel costs. Specifically, (1) describes the SoC calculation for the jth PHEV during the ith time slot based on the PHEV state (driving/parking) and operational mode (battery-fuel/G2V-V2G). In (1), P c h is the charging power, C m is the PHEV consumption when driving only on battery, u is the driving speed, and dt is the time slot duration. The average SoC, calculated as the simulation output, is then provided by (2), where N E V , N M C , and N s l o t 24 H r s are the number of EVs, Monte Carlo runs, and time slots over the 24 h considered in the simulations.
S o C i , j = { S o C i , j 1 + P c h d t charging S o C i , j 1 C m u · d t driving S o C i , j 1 S o C i , j 1 P c h d t driving   on   fuel discharging
S o C a v g 24 H r s = 1 N E V N M C N s l o t 24 H r s r = 1 N M C i = 1 N s l o t 24 H j = 1 N E V S o C r , i , j
Similarly, the load induced to the energy grid from the jth PHEV during the ith time slot is given in (3), while (4) provides the load induced on the grid from all PHEVs averaged over 24 h.
L o a d i , j = { P c h charging P c h discharging 0 driving   or   not   charging
L o a d a v g 24 H r s = 1 N M C N s l o t 24 H r s r = 1 N M C i = 1 N s l o t 24 H r s j = 1 N E V L o a d r , i , j
For the calculation of the total cost, the charging as well as the consumption of fuel are taken into account. The formula for the total cost is:
C i , j = { u d t F c m F p r driving   on   fuel E p r , i P c h d t charging 0 E p r , i P c h d t   parked ,   not   charging discharging
where C i , j is the cost of usage for the jth PHEV during the ith time slot, F c m is fuel consumption, F p r is the fuel price, and E p r , i is the price for charging the PHEV battery at the ith time slot (note the price varies throughout the day). The total cost per PHEV,   C t o t 24 H r s , over 24 h averaged over the N E V PHEVs and the N M C Monte Carlo iterations is then expressed as:
C t o t 24 H r s = 1 N E V N M C r = 1 N M C j = 1 N E V i = 1 N s l o t 24 H r s C i , j , r
In the context of this work, the values for the parameters included in (1)–(6) are summarized in Table 1.
In order to obtain insight into (6) and the cost calculations involved when the PHEV is in driving mode, Figure 4 is provided. Therein, cost calculations for 1 h of driving are depicted for different driving speeds under two cases: when the PHEV traveled exclusively on fuel and when the PHEV needed a charging session in order to compensate for 1 h of driving using only its battery. Note that for the second case, the cost of the charging session depended on the specific period during the day that it occurred, and Figure 4 depicts the relevant calculations for the edge values, i.e., the minimum cost at 04:30 in the morning and the maximum cost at 19:30 (see Figure 1).
Clearly, driving using the battery is less expensive than using fuel. However, greedy charging policies that disregard driving needs and target maximum SoC levels create unnecessary costs for the PHEV user.

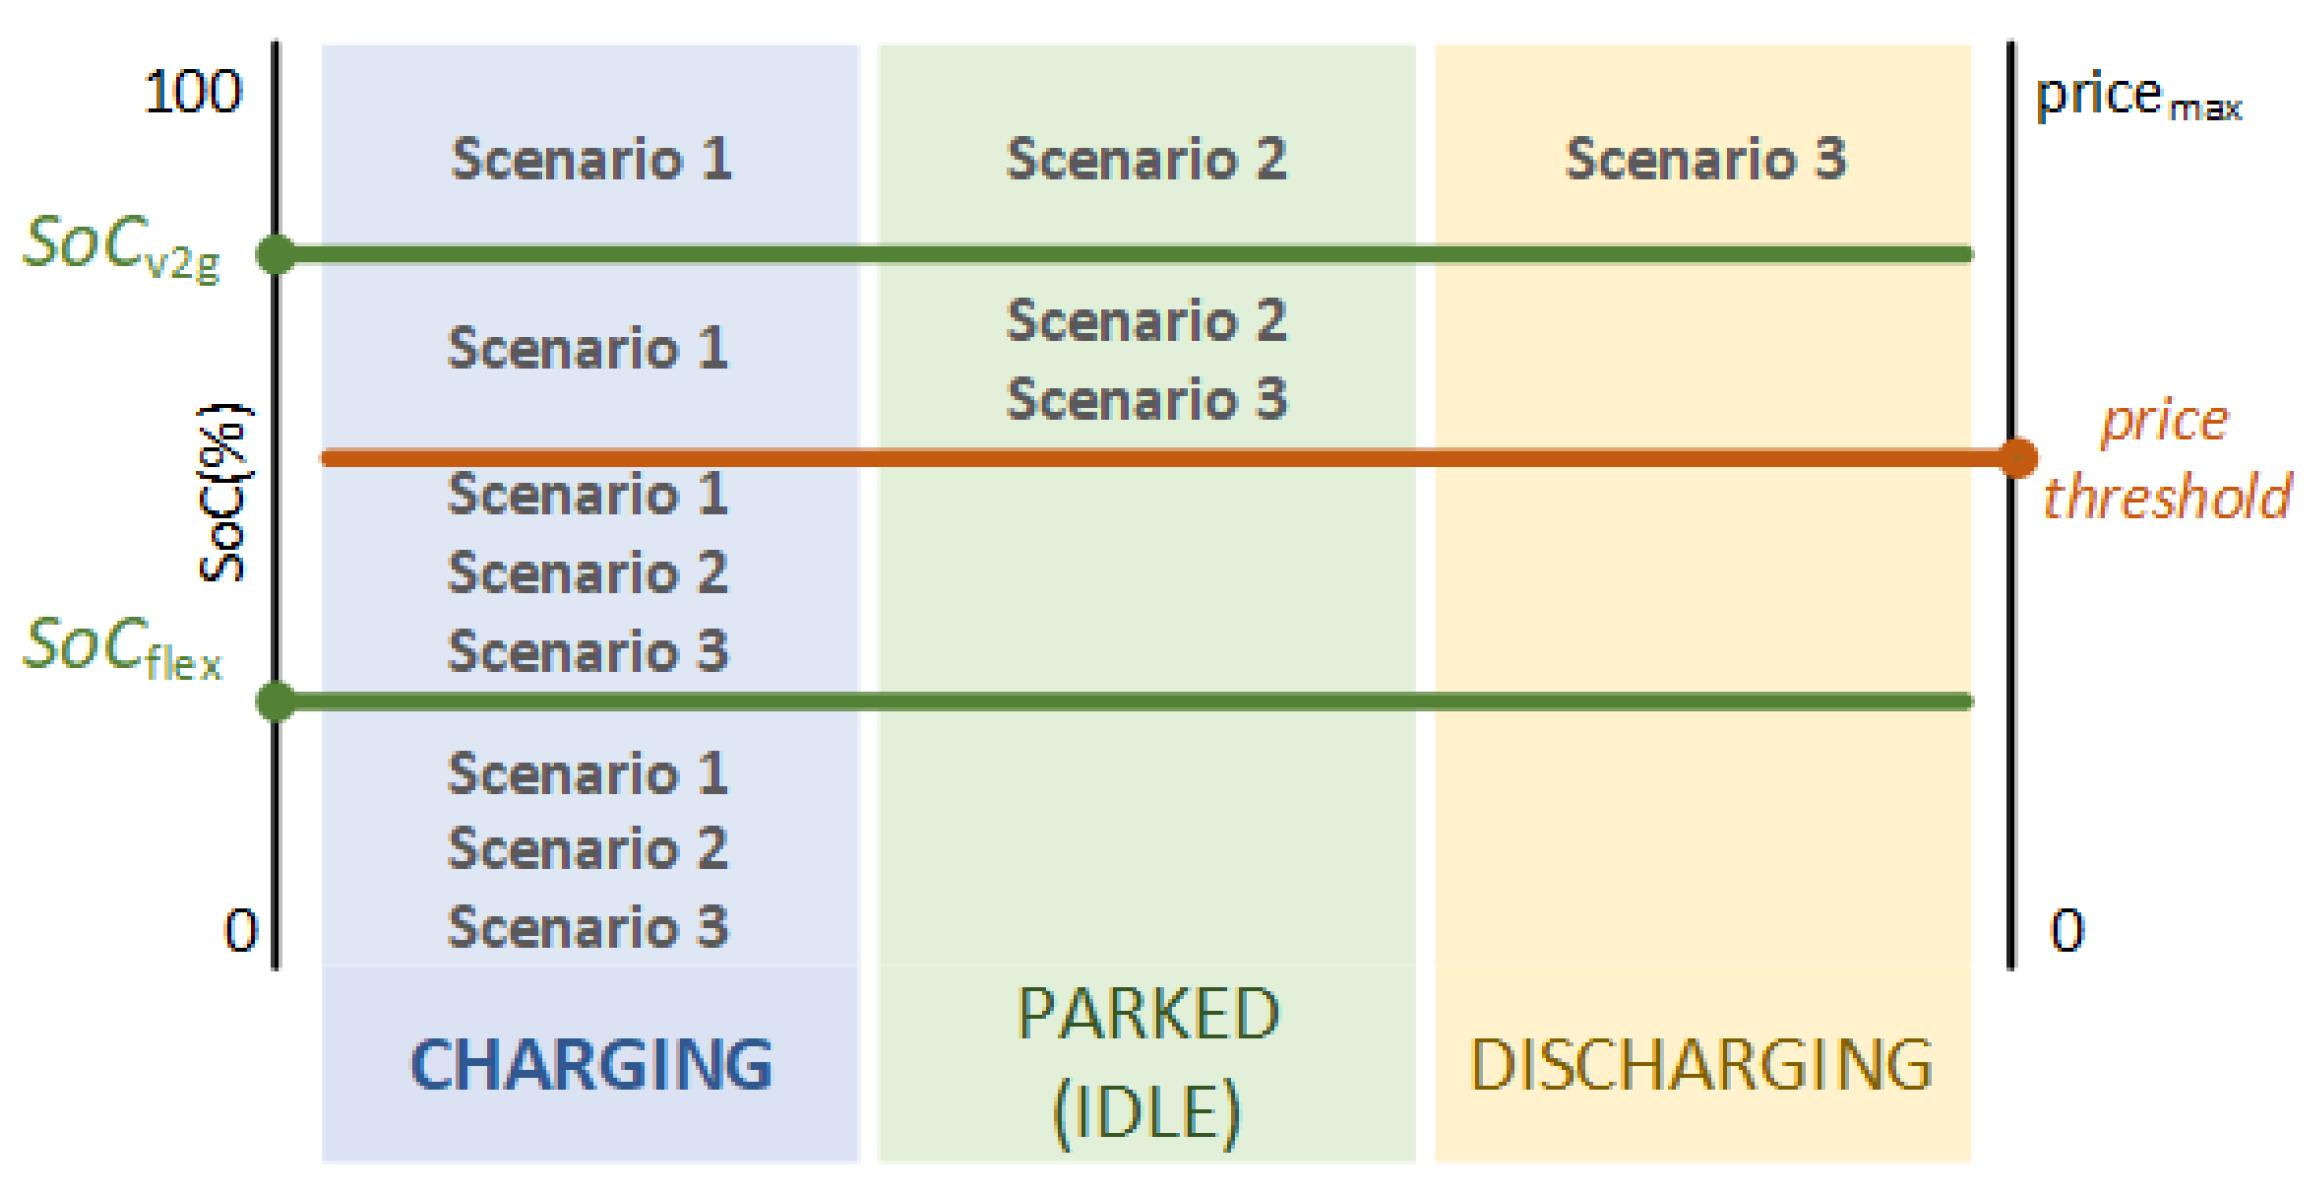
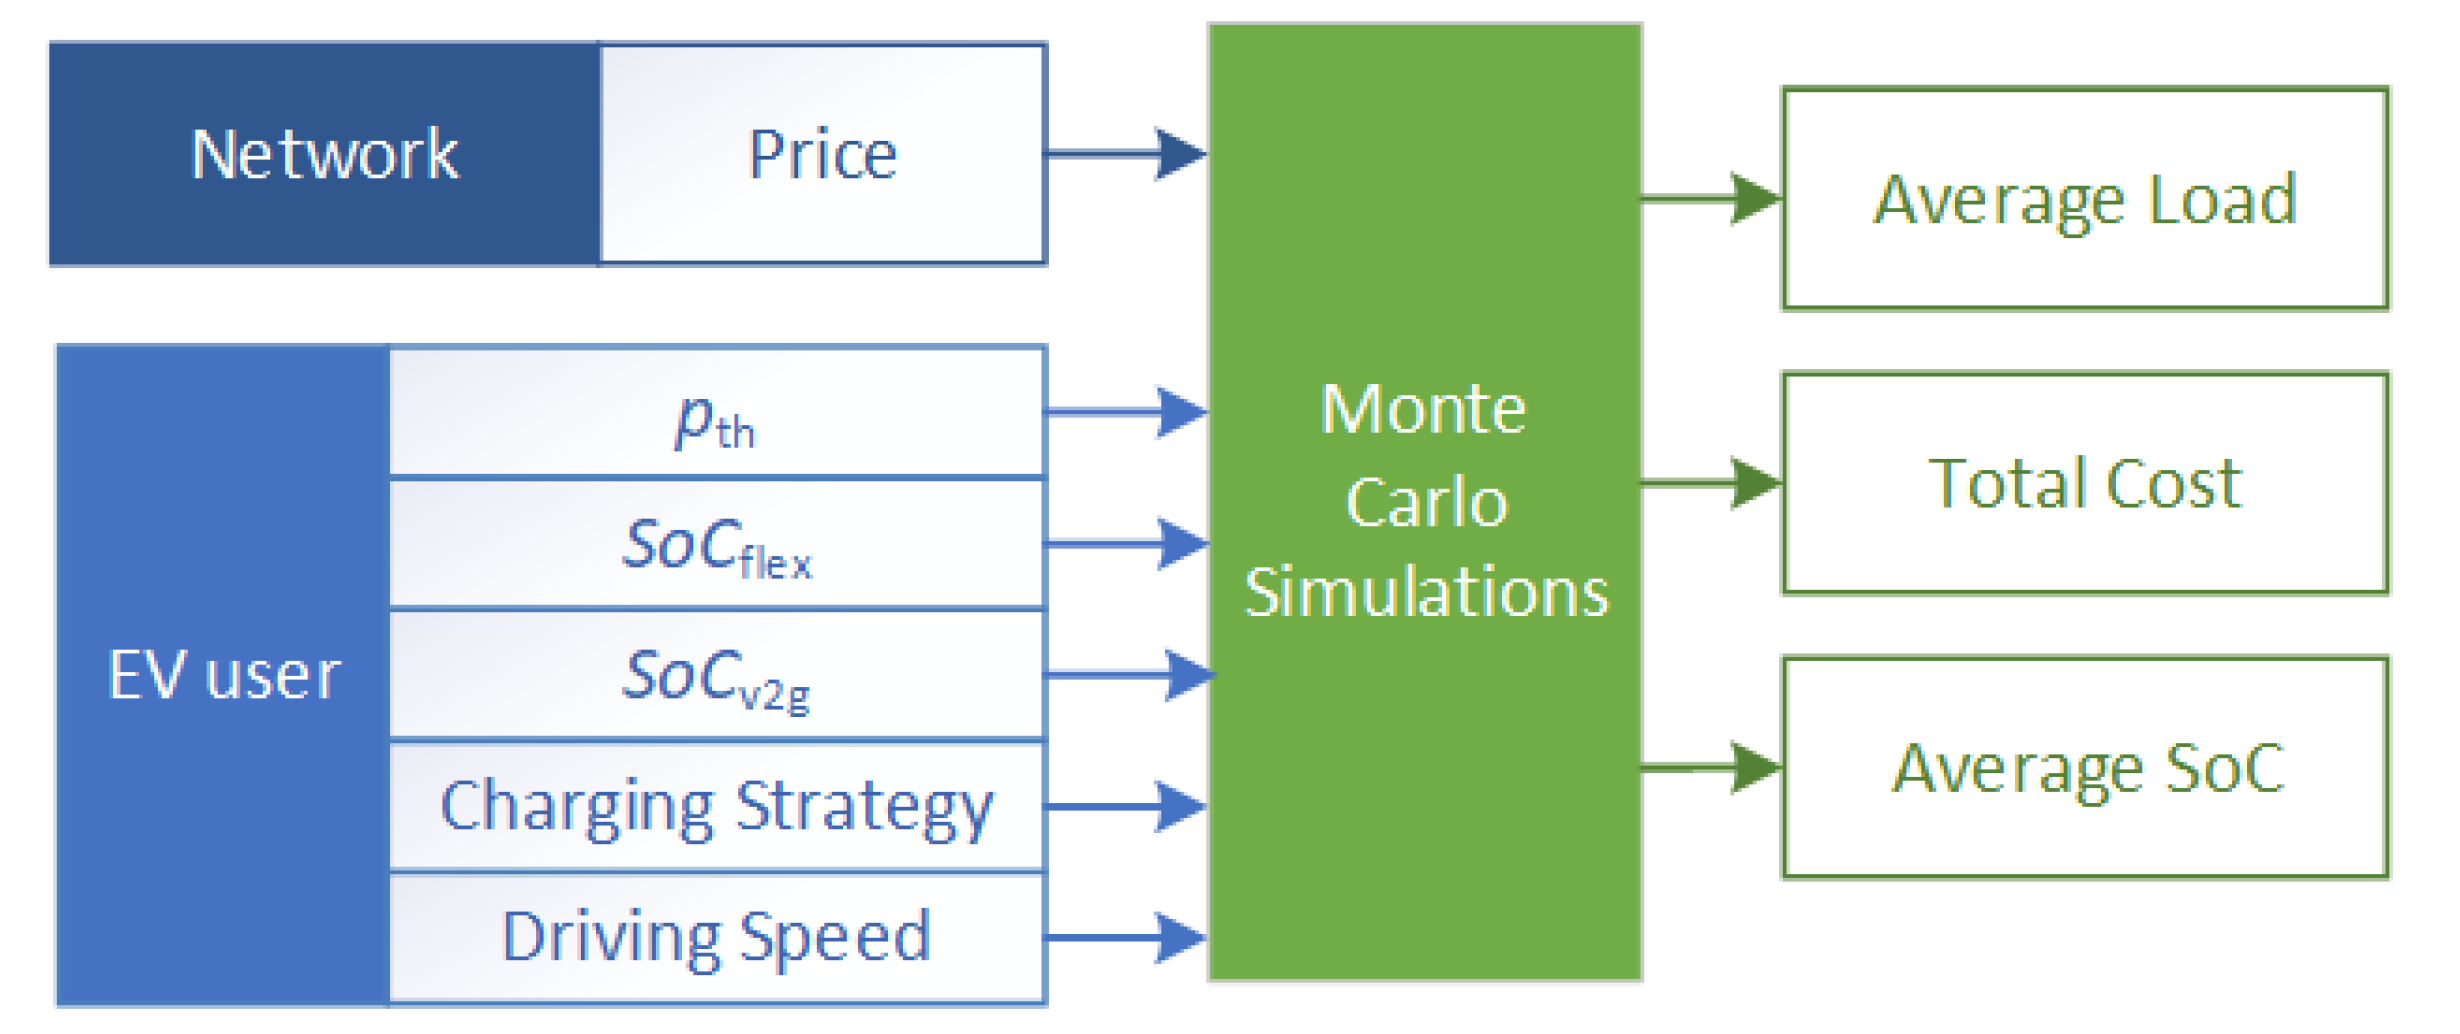
3. System Analysis Results

Our analysis started with the results for scenario 2 only, and building on these results, further improvements were examined at a later stage in scenario 3 with the V2G option enabled.
Figure 5, Figure 6 and Figure 7 present the key outputs of the simulation platform, i.e., S o C a v g 24 H r s , L o a d a v g 24 H r s , and C t o t 24 H r s for different price threshold coefficients ( p t h ) and S o C f l e x values when scenario 2 was employed by the user. Note that the results corresponding to p t h = 1.5 are identical to those of scenario 1 (reference scenario), since (see 
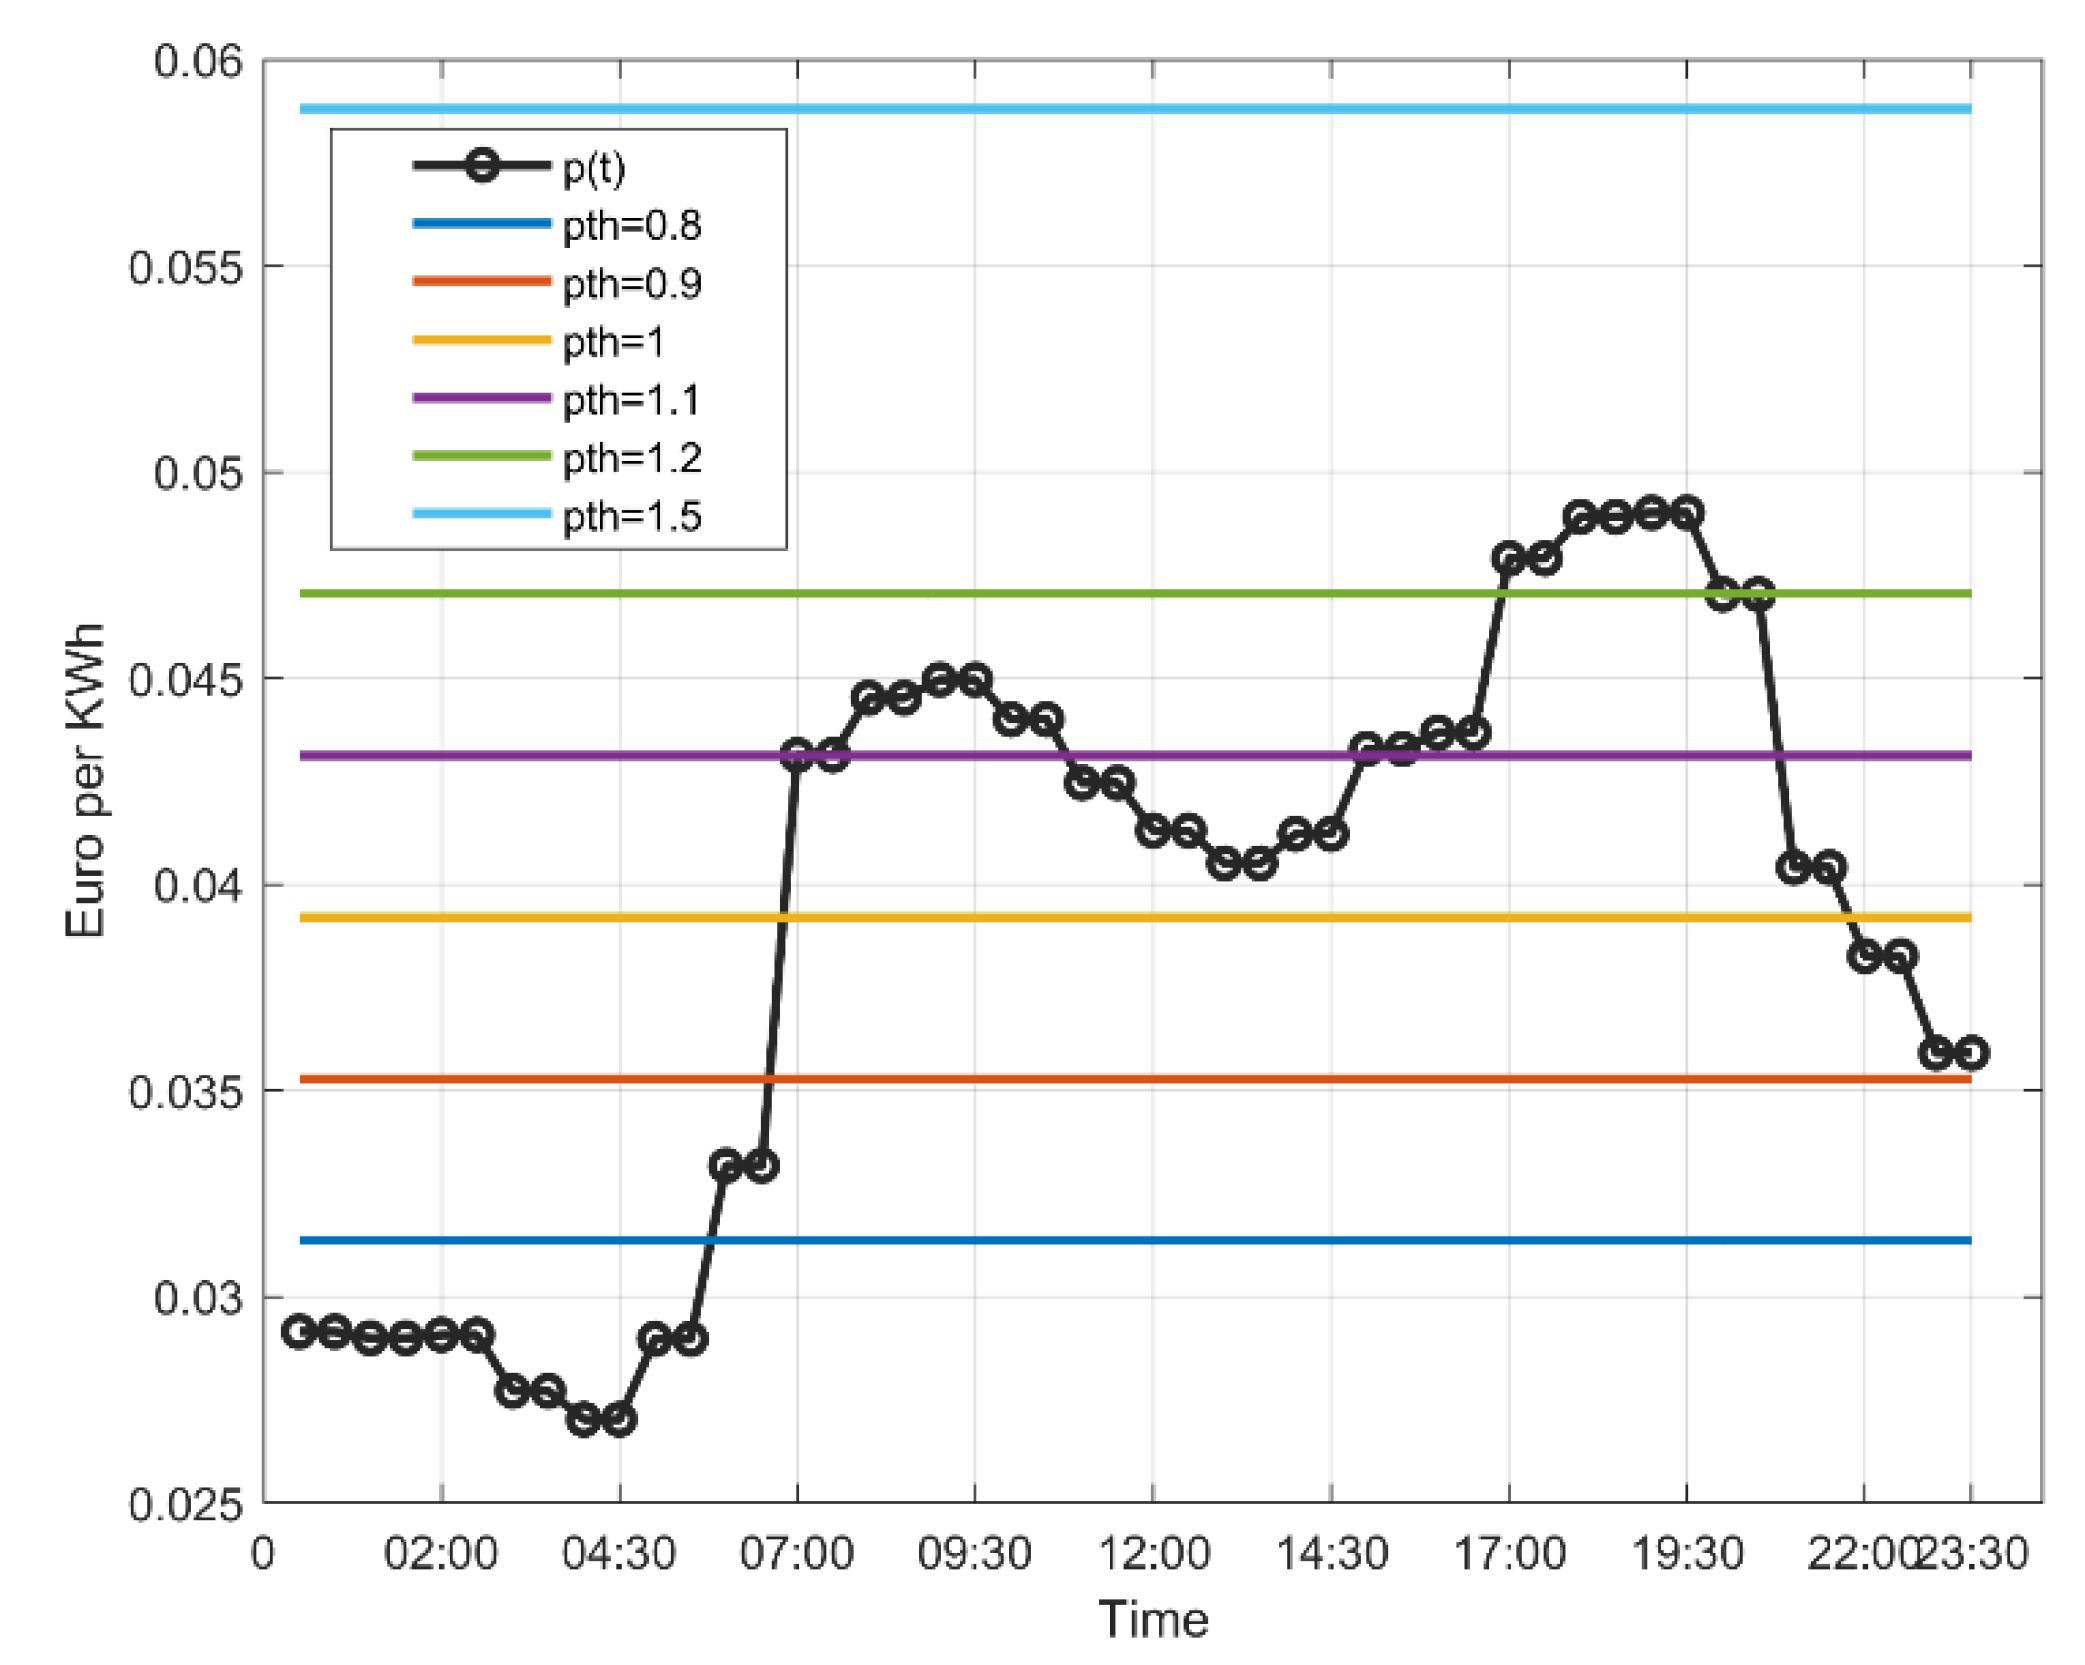
Figure 1) the relevant price threshold was higher than the maximum value of p ( t ) 
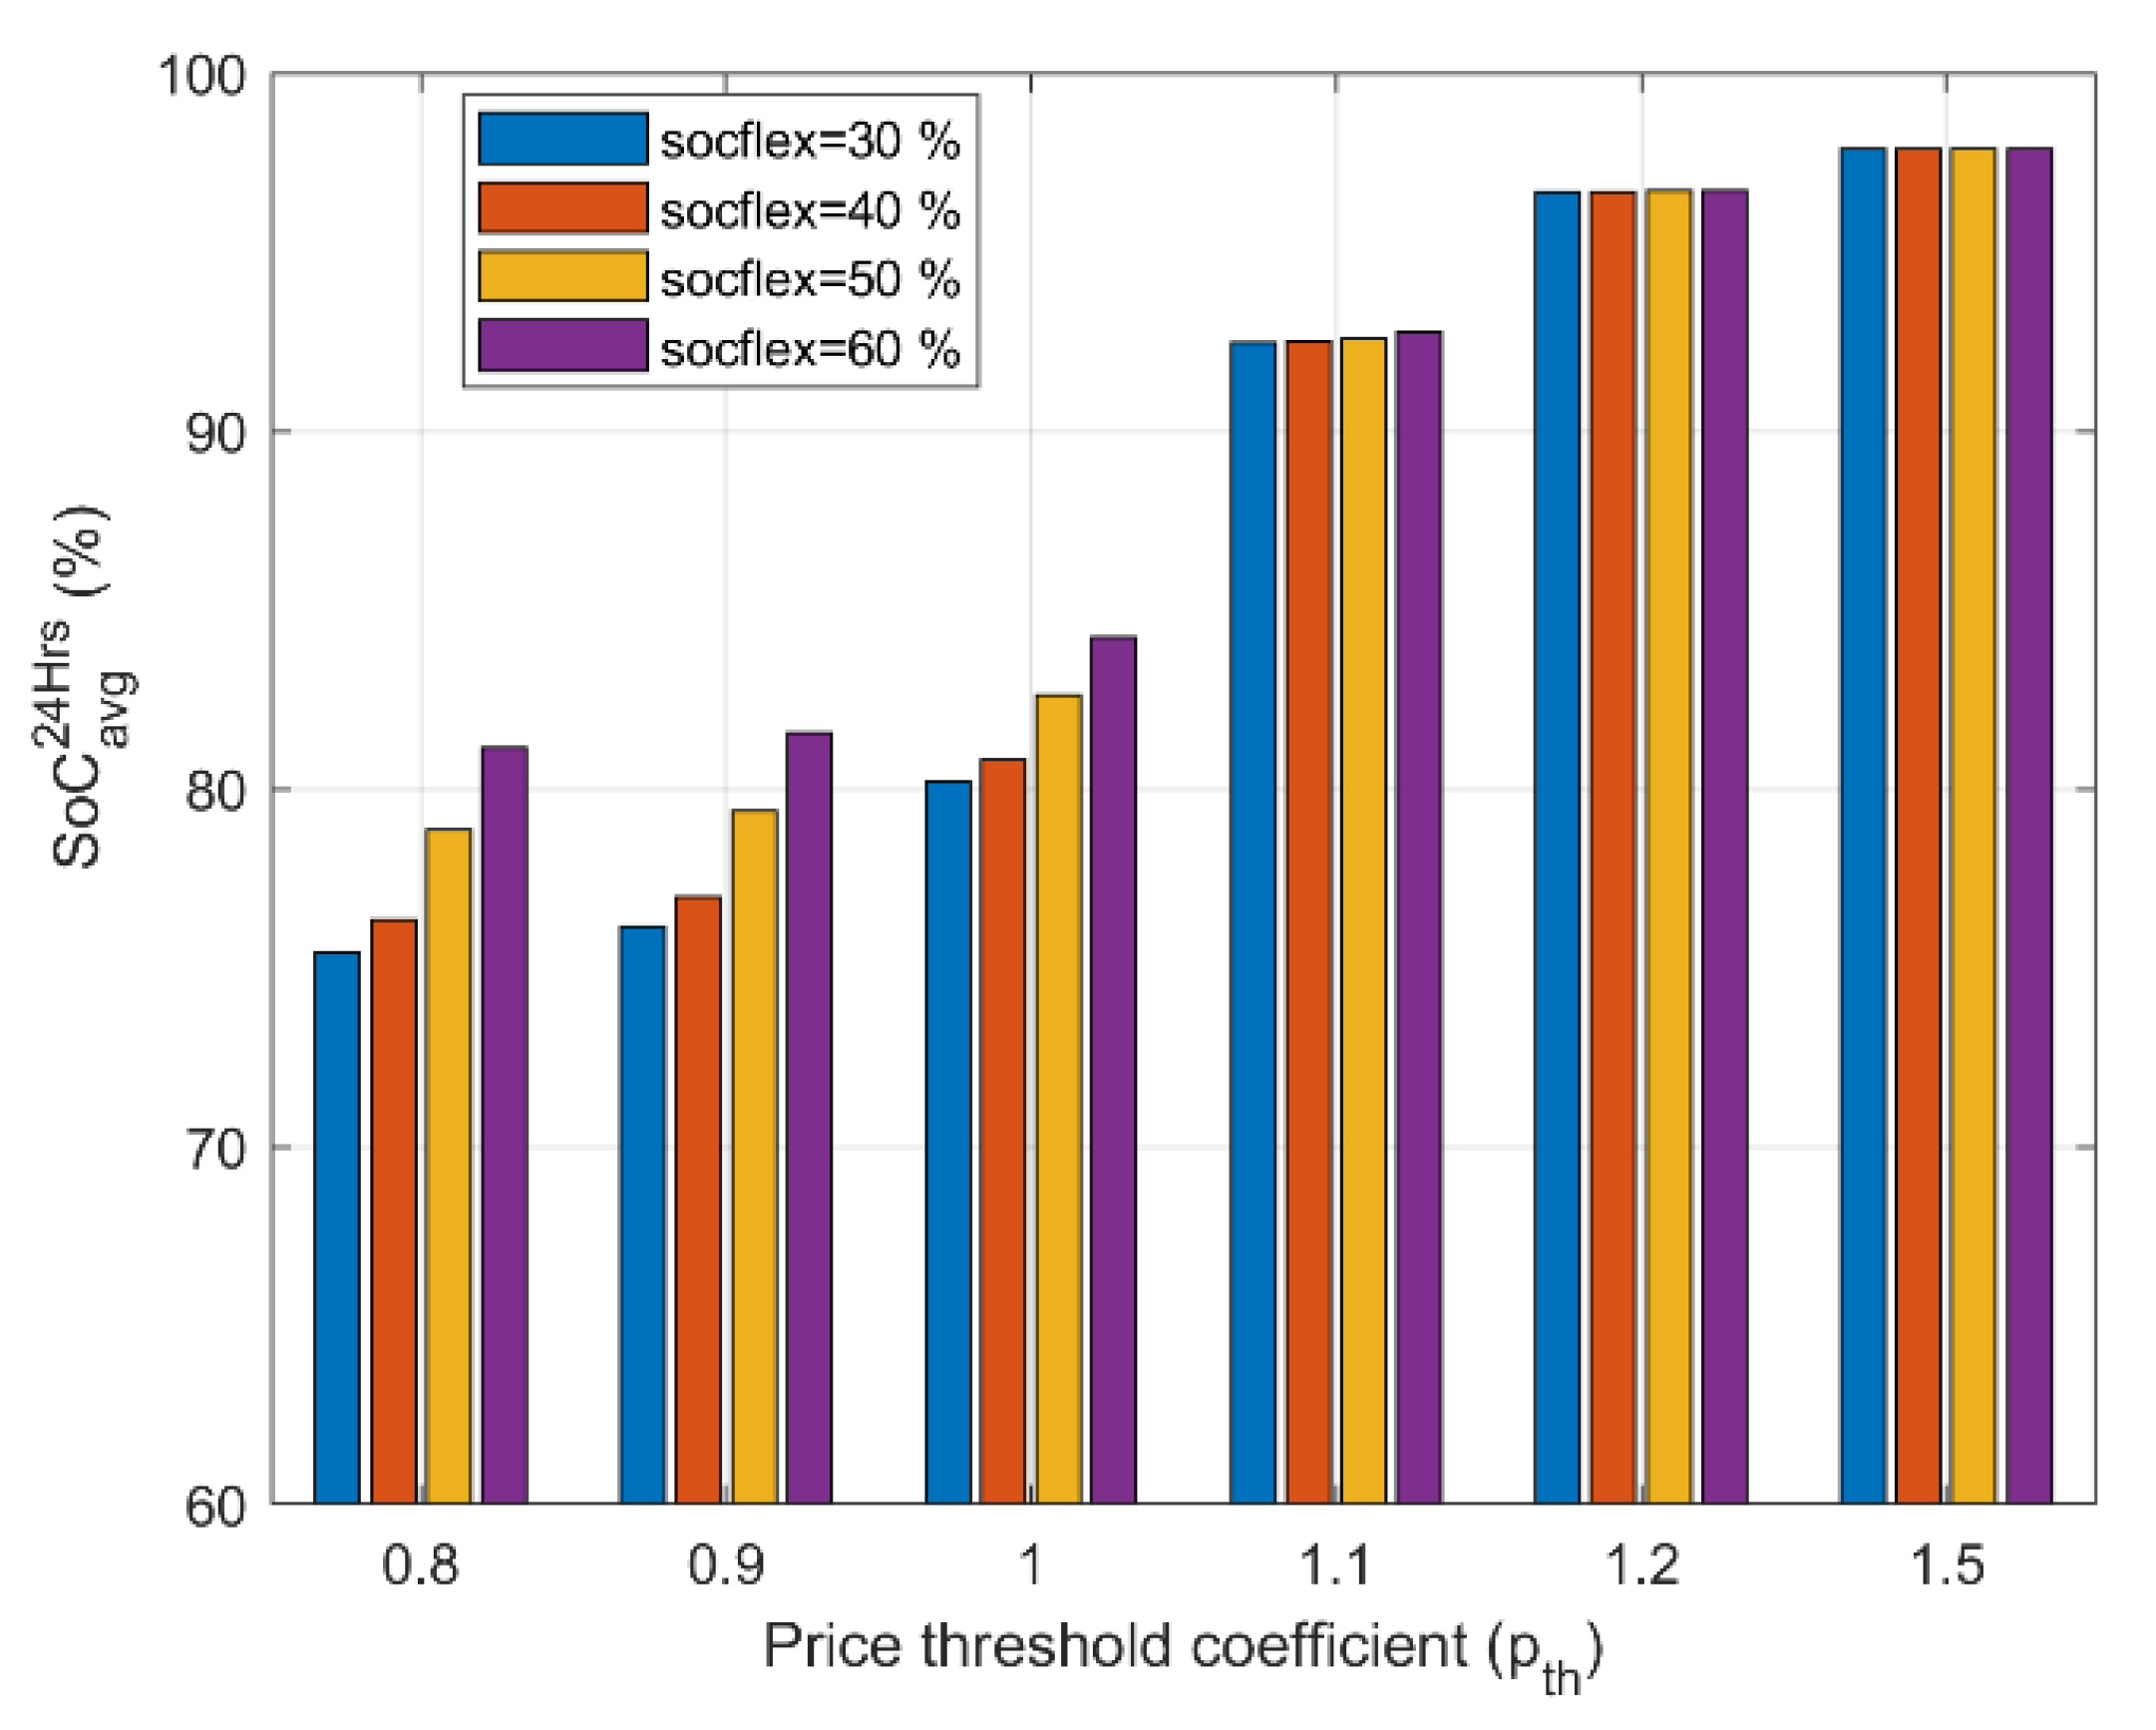
. For an average driving speed of 30 km/h, Figure 5 shows that lower price thresholds ( p t h ) lead to lower average SoC levels per PHEV, since charging after S o C f l e x is allowed only in periods when p ( t ) < p t h p ( t ) ¯ . However, SoC values will not drop lower than 75% for any configuration. For the same p t h , the average SoC level is affected by S o C f l e x in a very straightforward manner: by lowering S o C f l e x , fewer charging sessions are initiated.
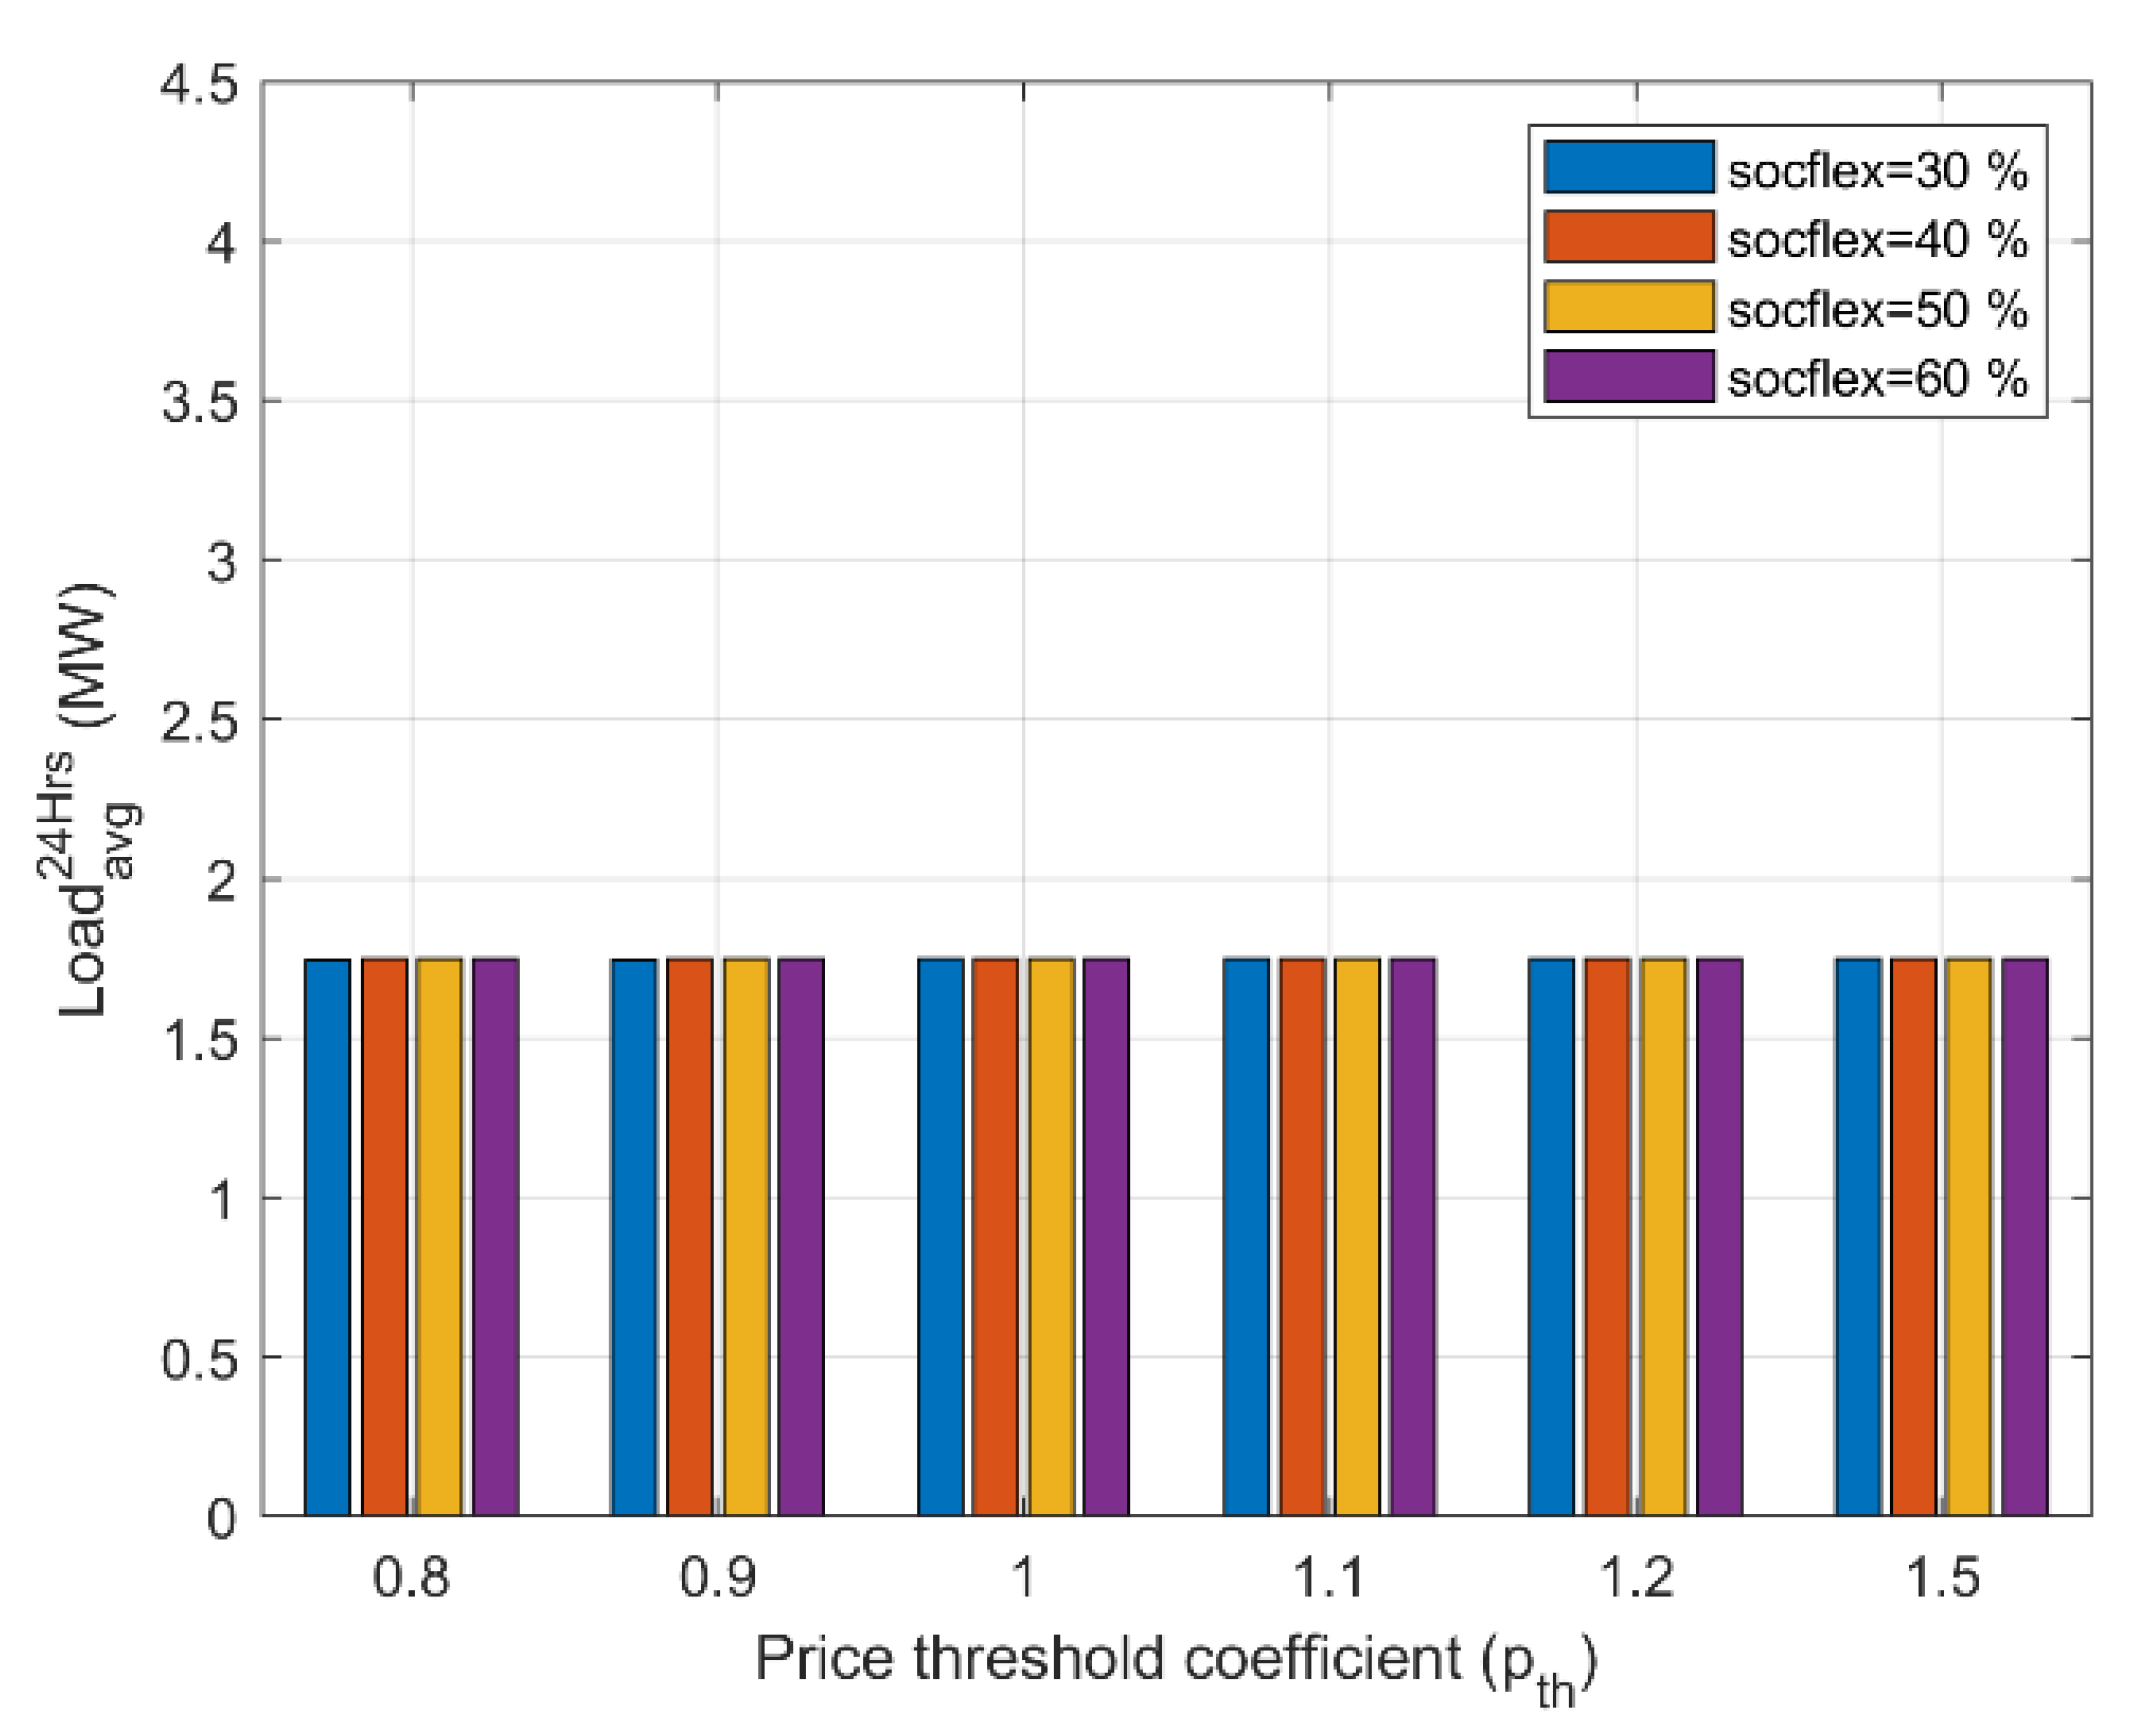
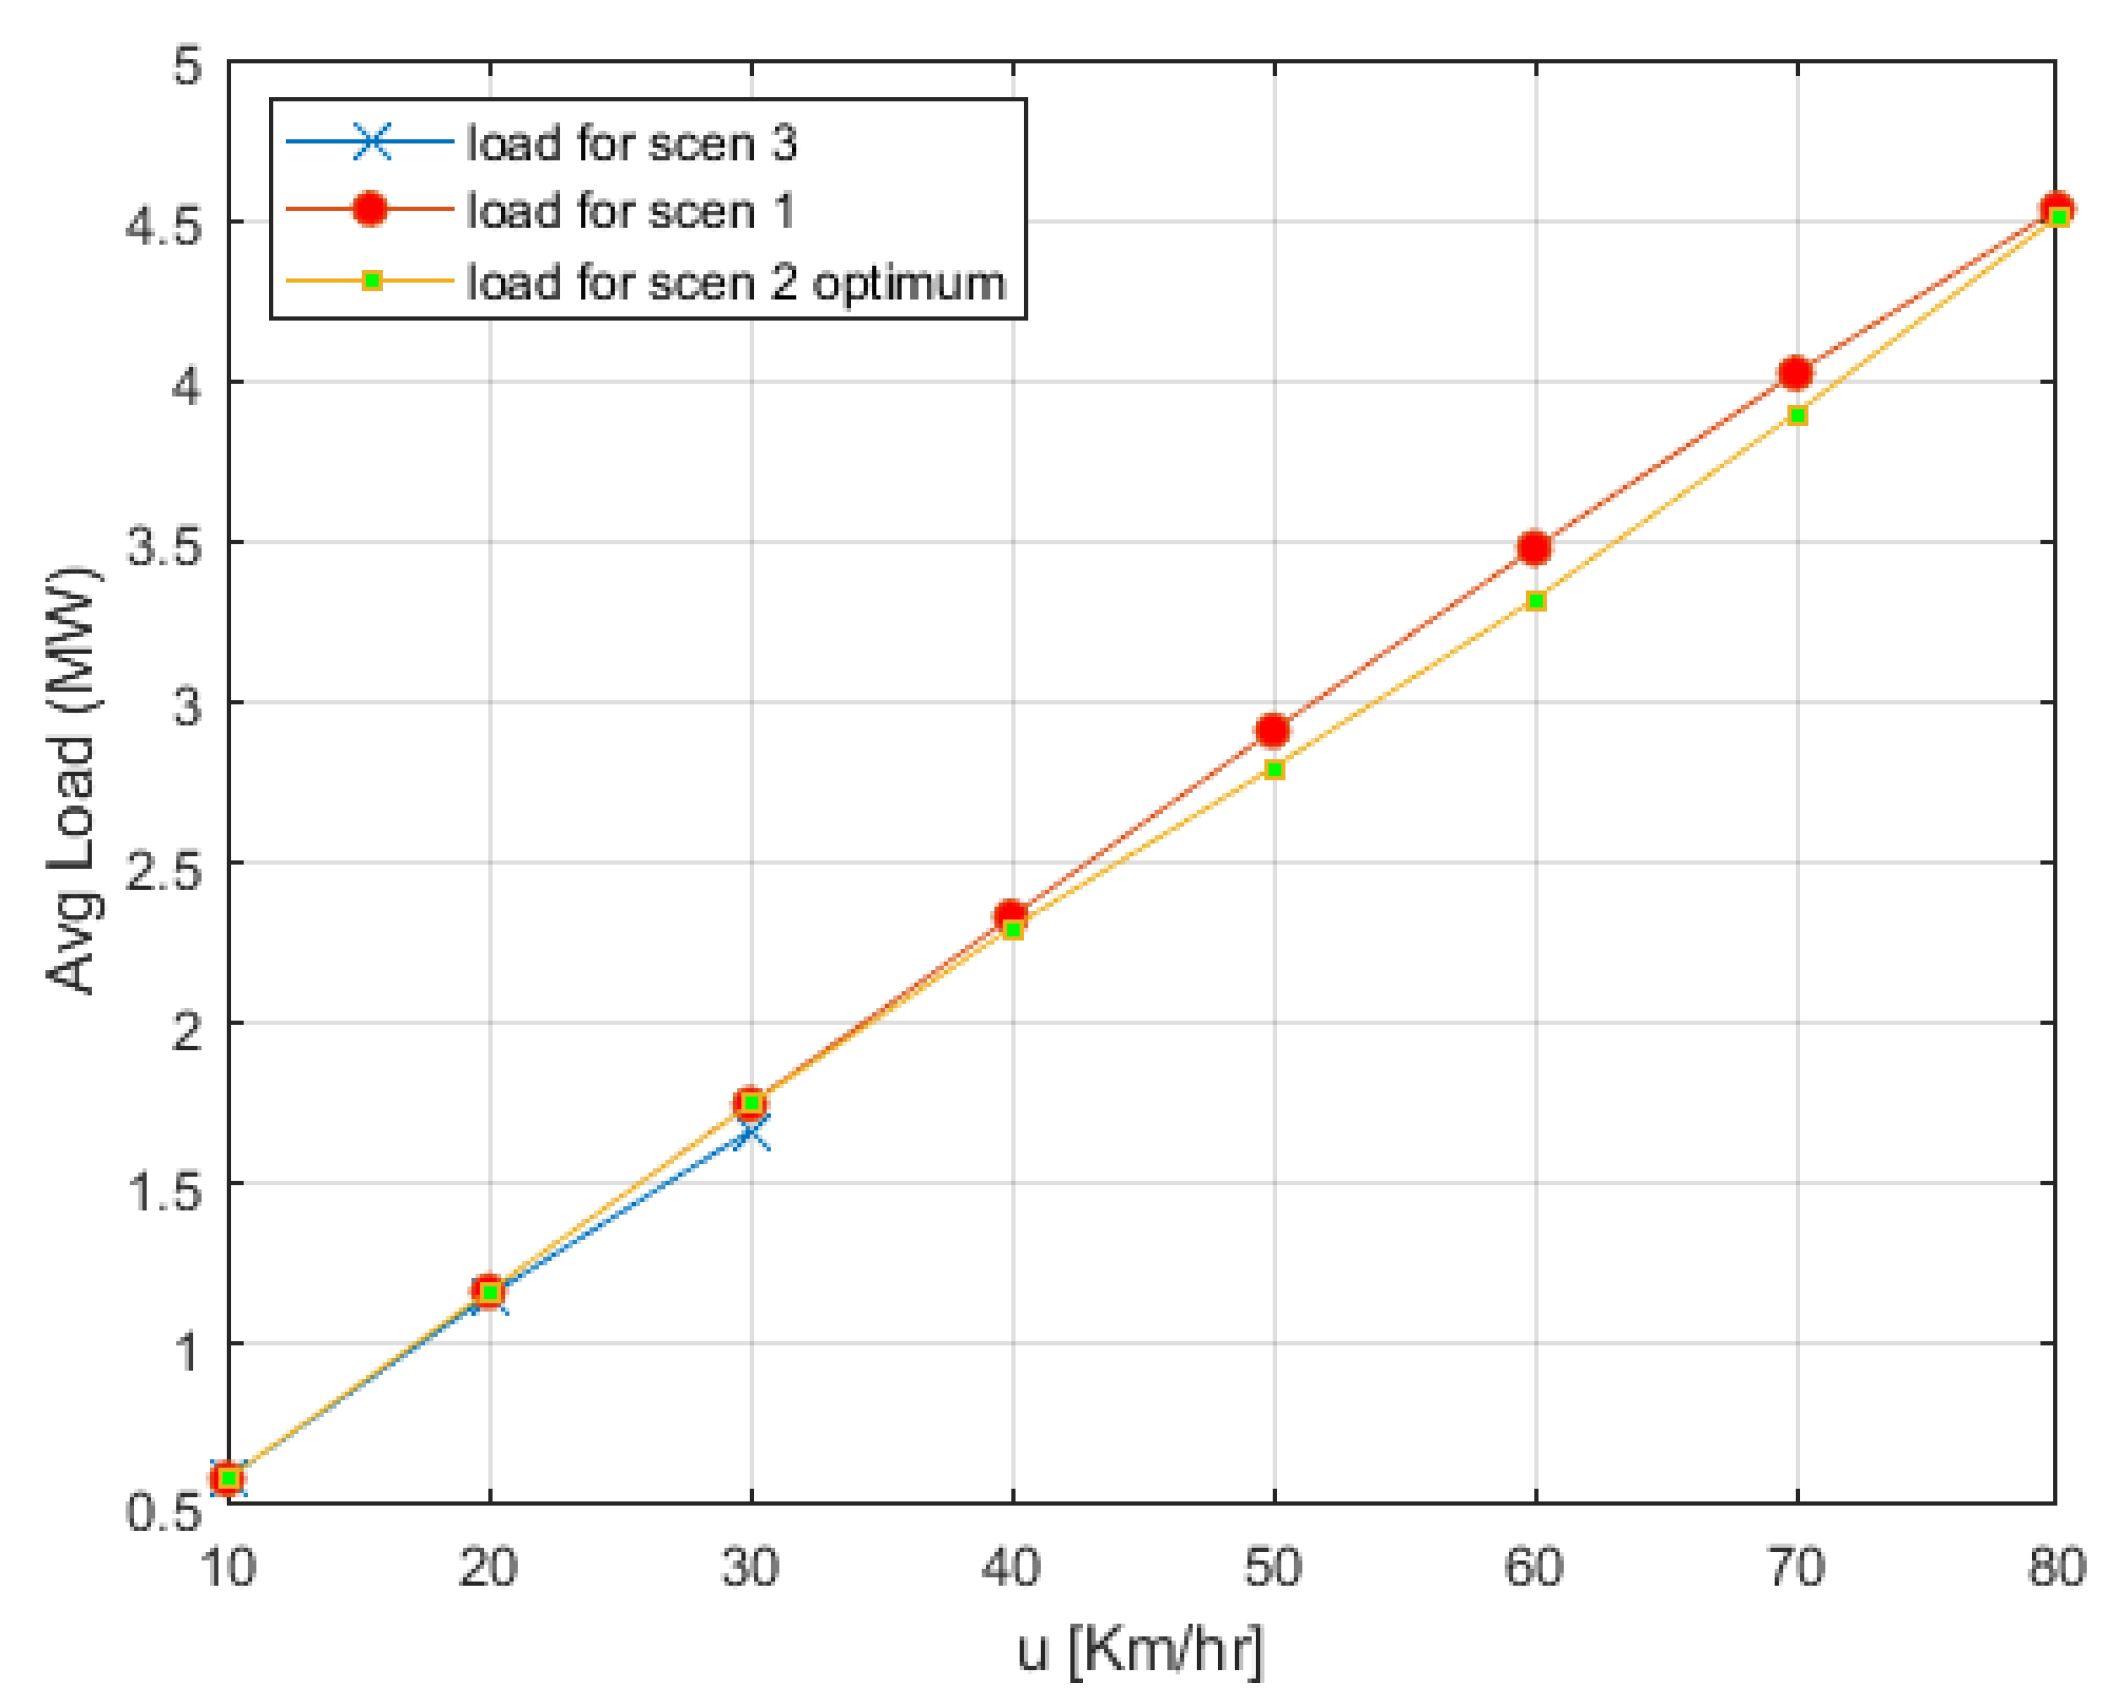
Figure 6 displays the average load over 24 h that was generated at the energy network side due to the. PHEVs’ charging needs. As can be seen, the load remained constant for the different parameters, leading to the conclusion that by employing a price-sensitive charging strategy, the average load during a specific period of time (herein 24 h) remains unaffected; the network received no additional load. Finally, Figure 7 displays the total cost per PHEV as defined in (6). Clearly, scenario 1 (pth = 1.5) involved higher costs for the PHEV owner.
The previous analysis considers only u = 30 km/h and triggered the need to investigate the performance of scenario 2 under different driving needs. Therefore, the optimal values for p t h and S o C f l e x that lead to the minimum total costs for different driving speeds are determined next.
An extensive study was held, and multiple setups were examined with respect to C t o t 24 H r s . Table 2 summarizes the values used for the three input parameters (i.e., u, p t h , and S o C f l e x ) during this study, i.e., 192 setups were simulated. 
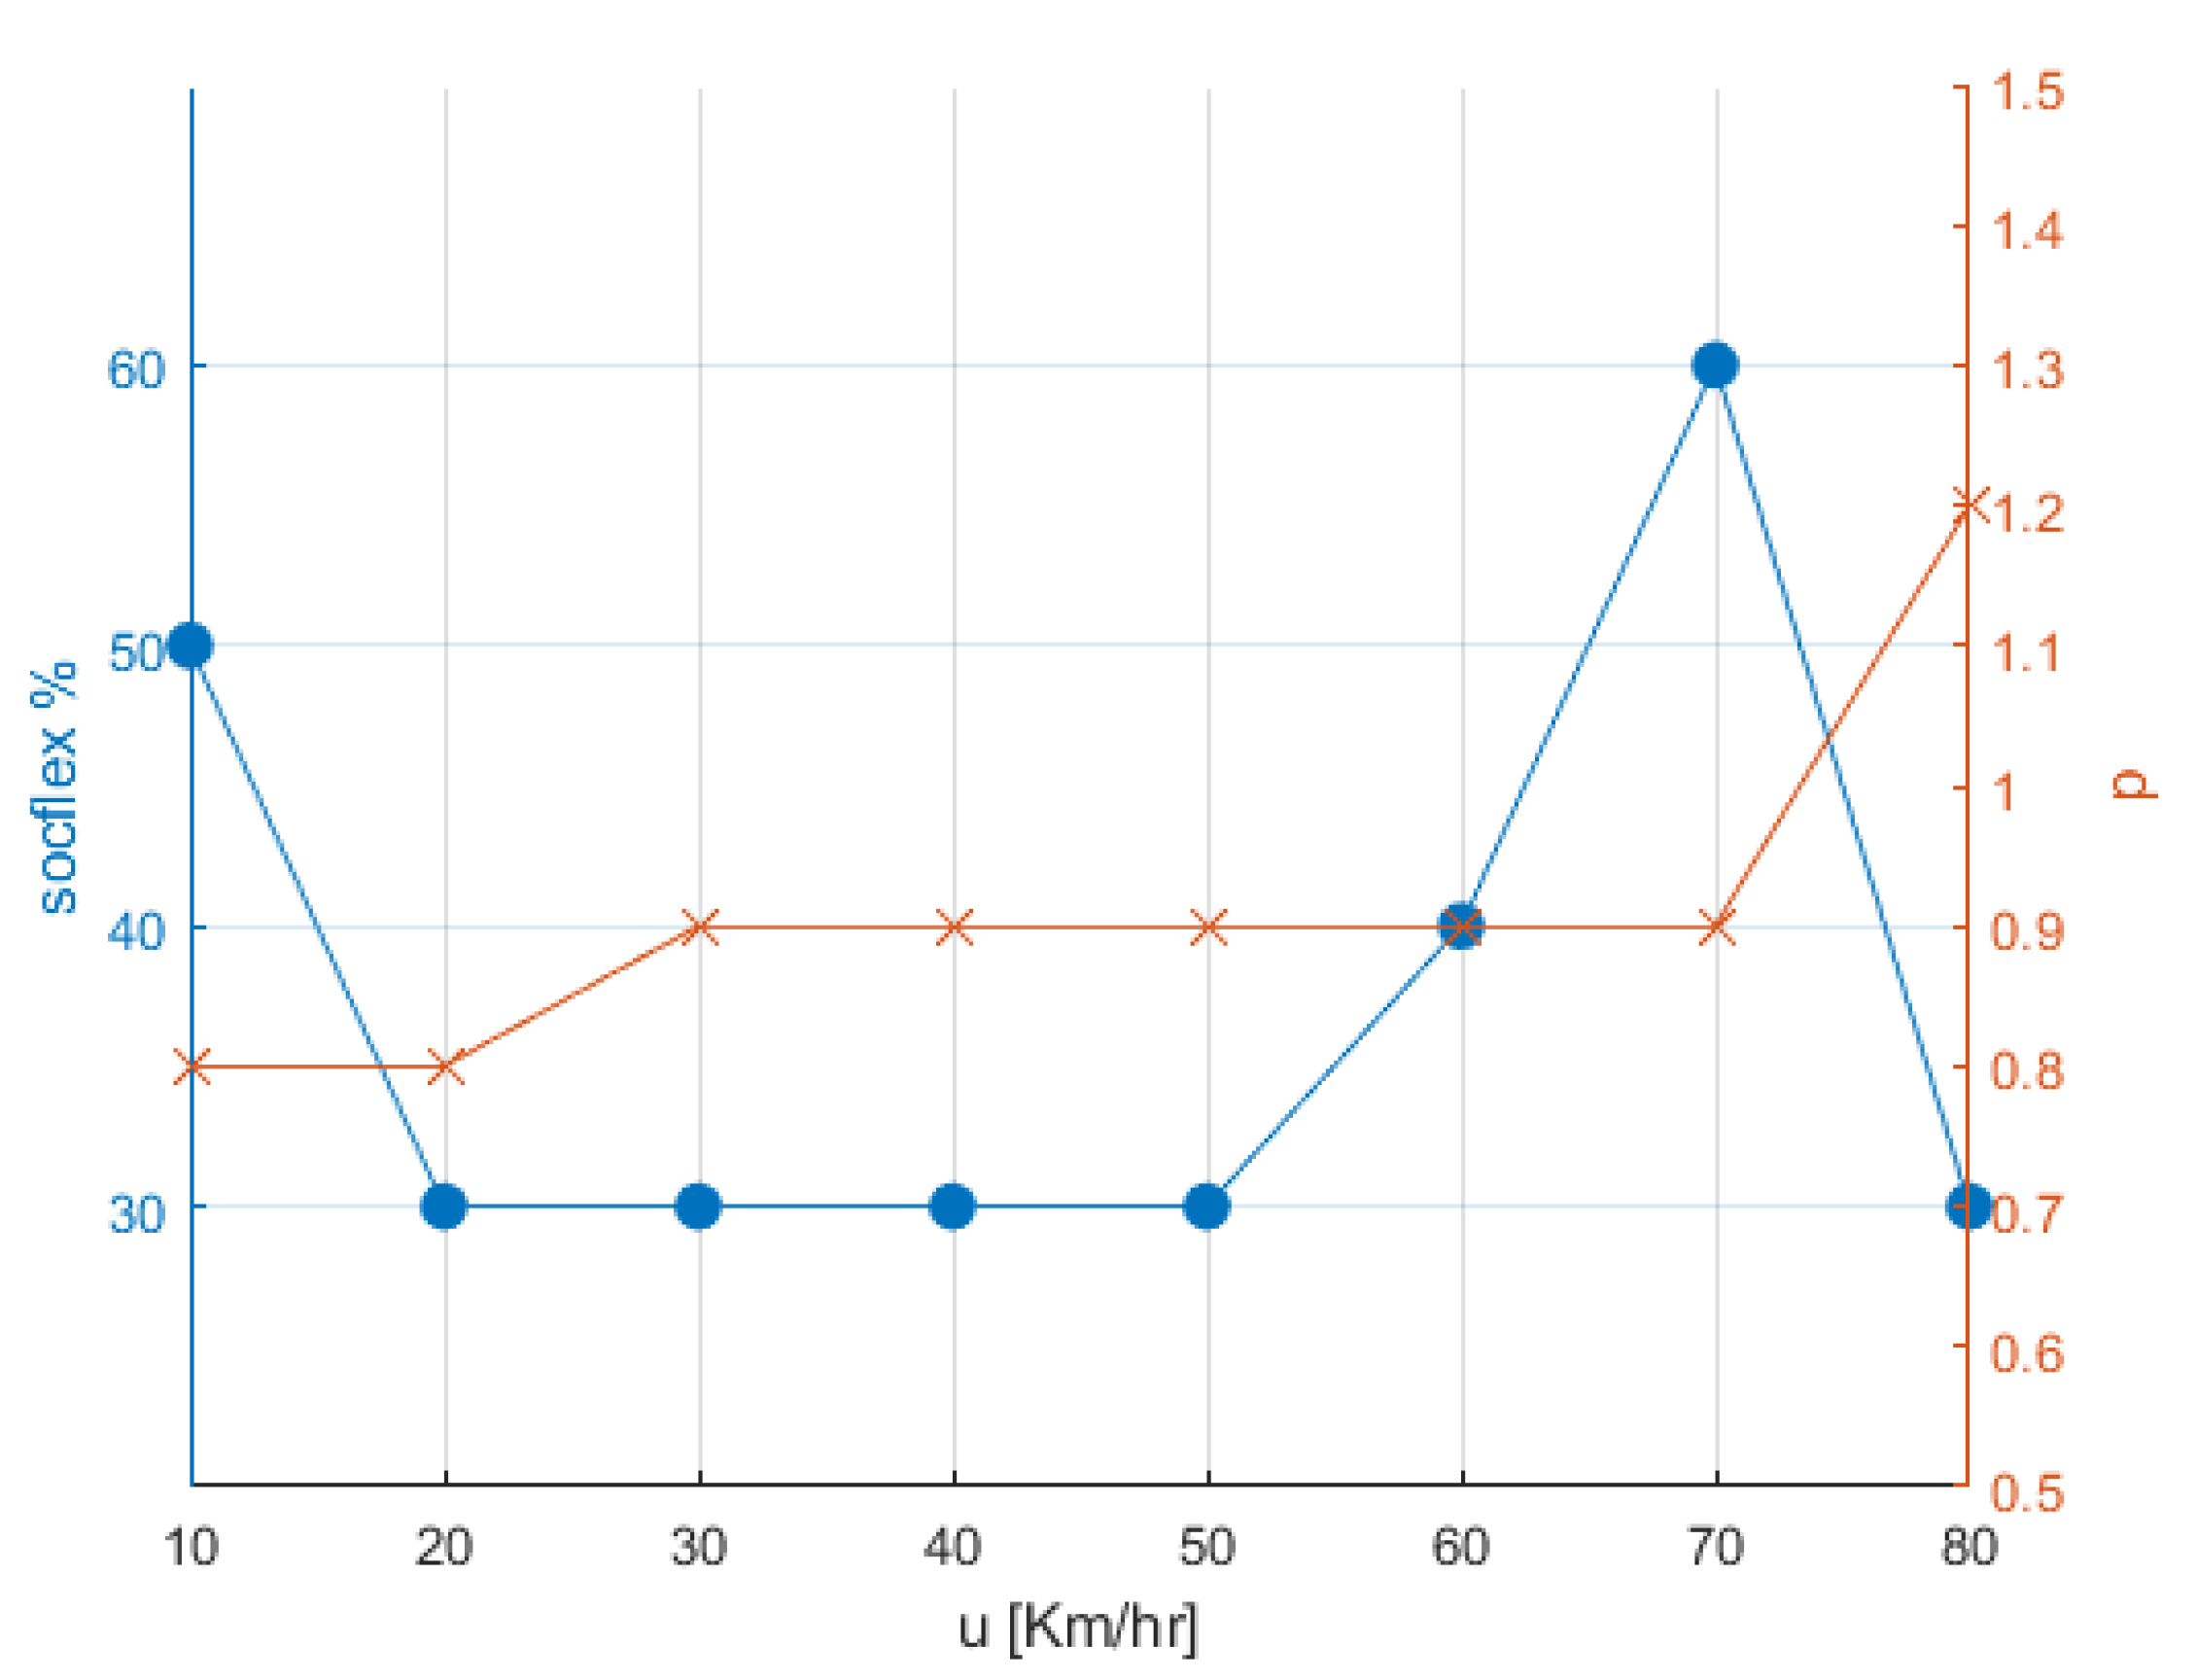
Figure 8 shows the optimized values for p t h and S o C f l e x for each speed that led to the minimum total cost for the PHEV user. These optimized values were derived after several simulations combining all possible choices from Table 2. For example, for a speed equal to 30 km/h, the optimal p t h was 0.9 and the optimal S o C f l e x was 30%, which also applies to speeds of 40 and 50 km/h. Note that for an excessive driving speed as high as 80 km/h, the system requires a large price threshold coefficient (pth = 1.2), indicating an increased charging need for PHEVs.
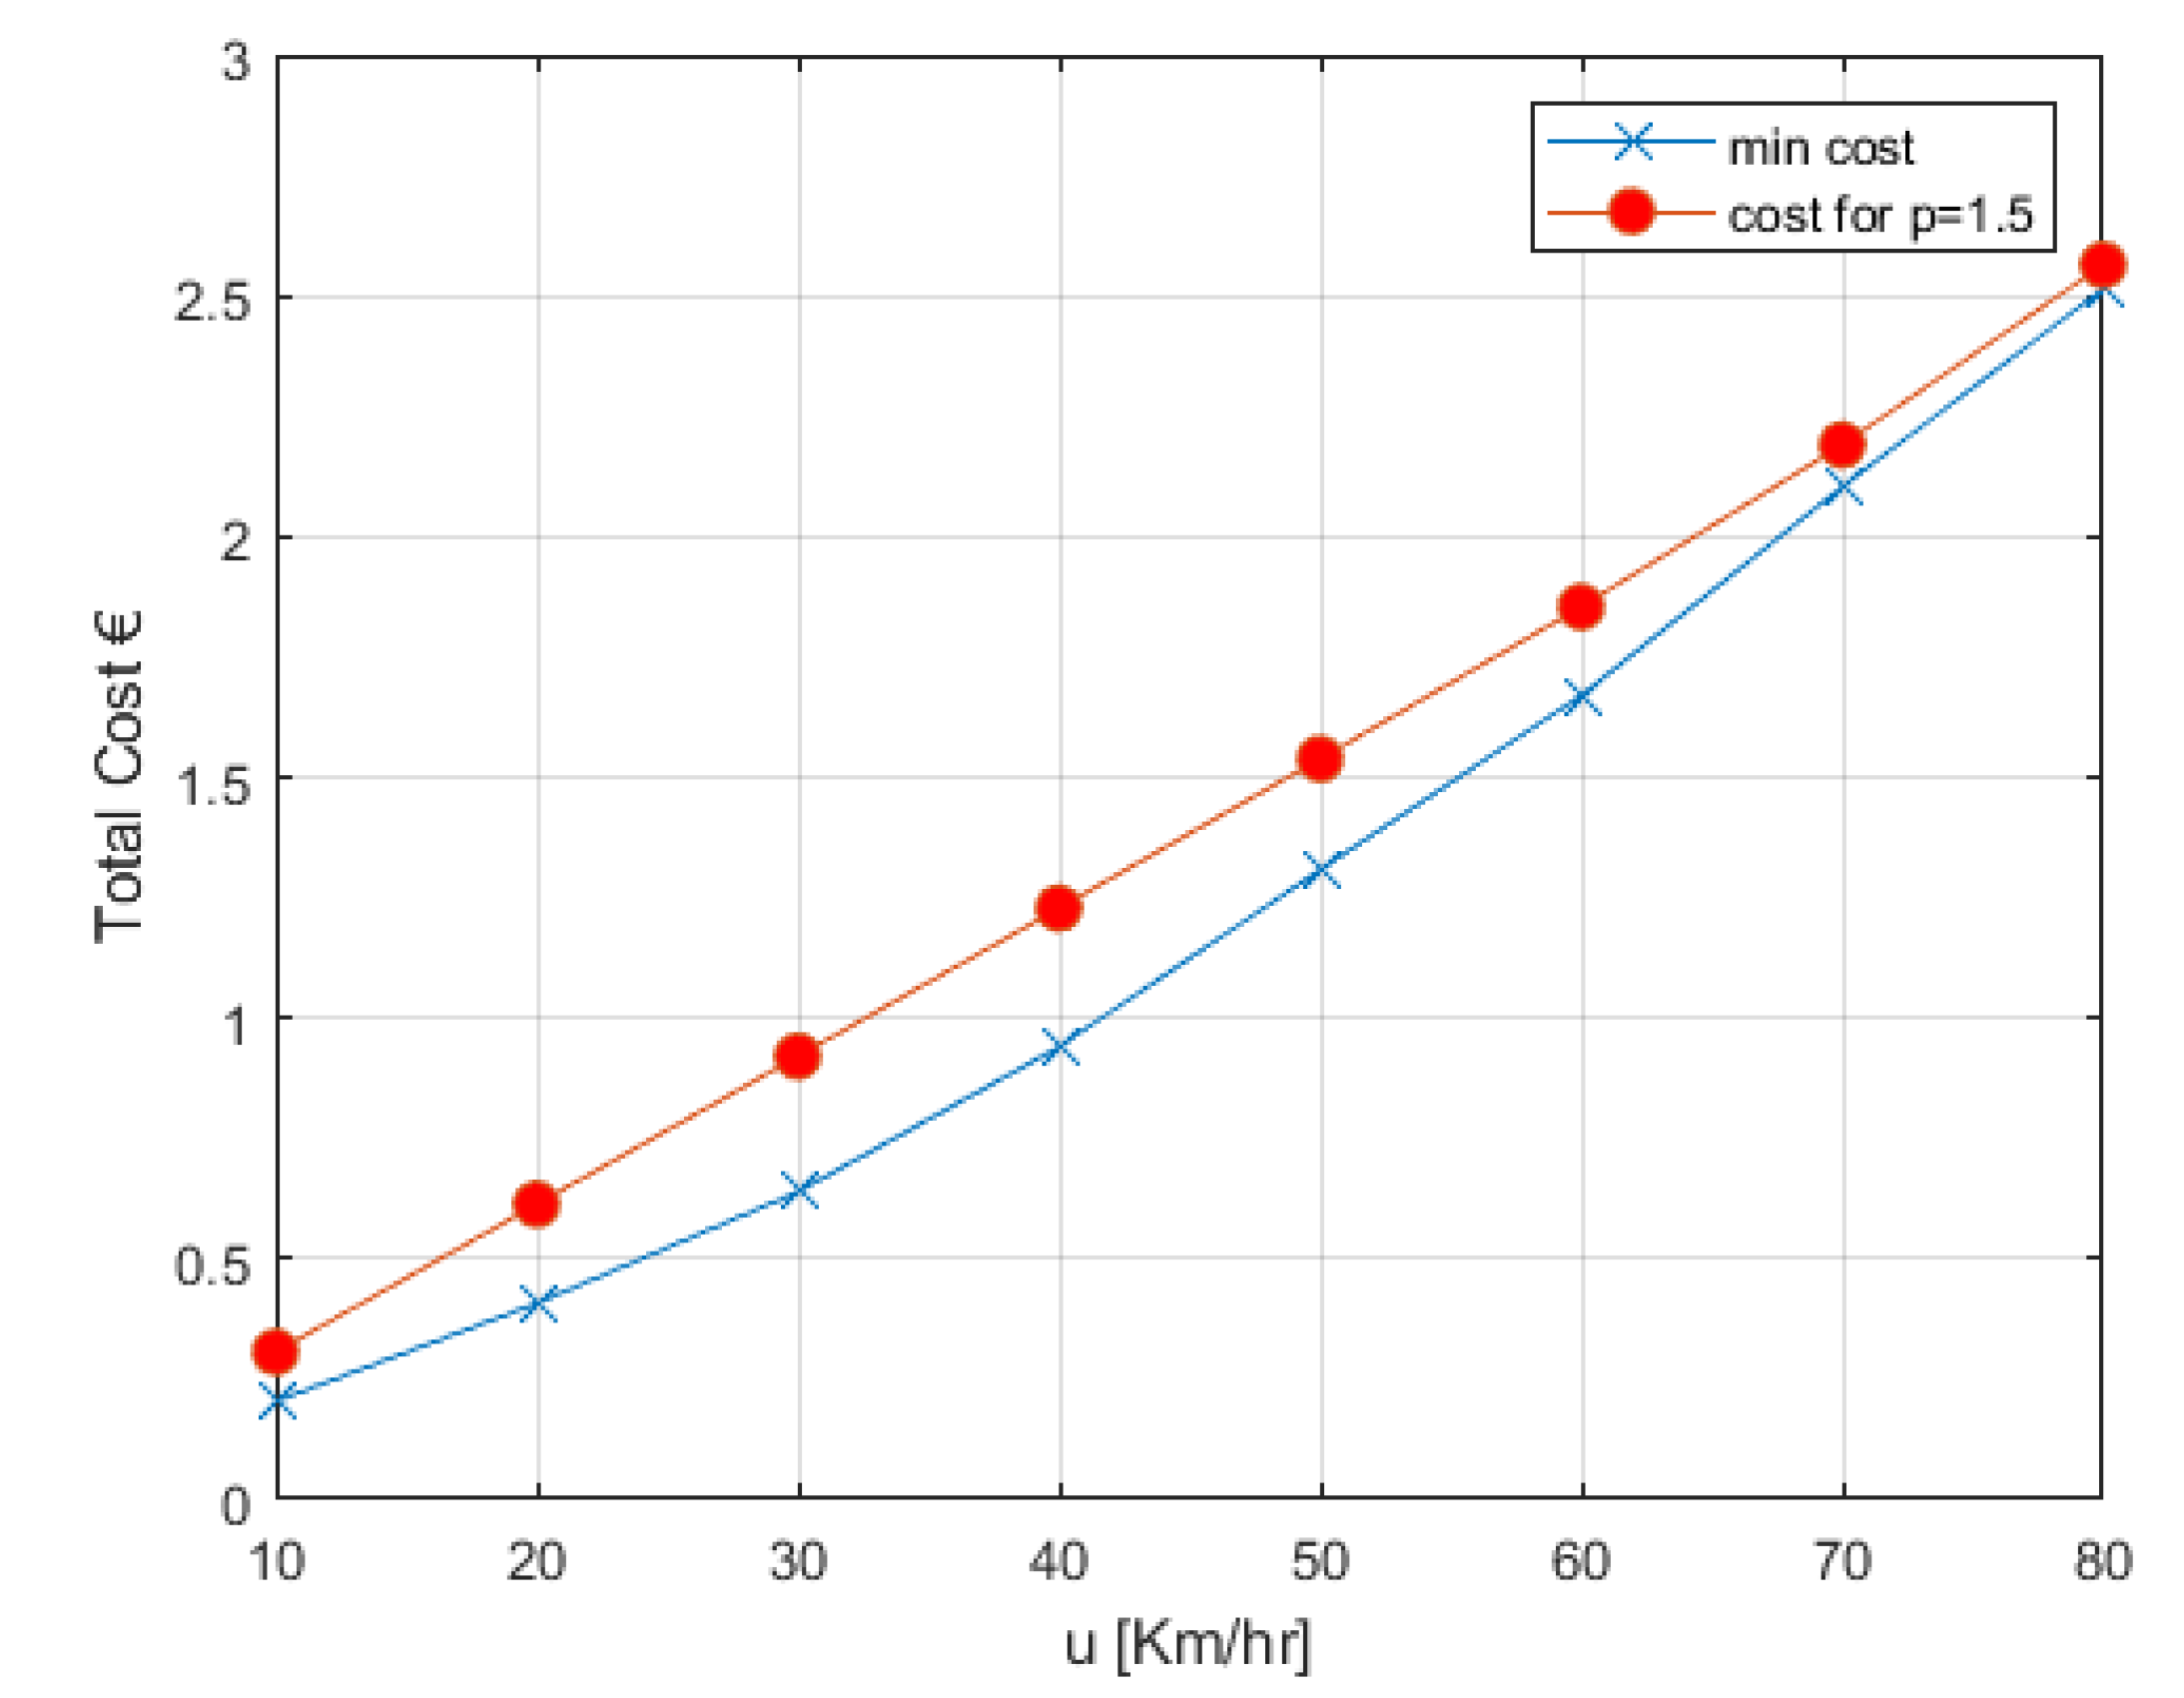
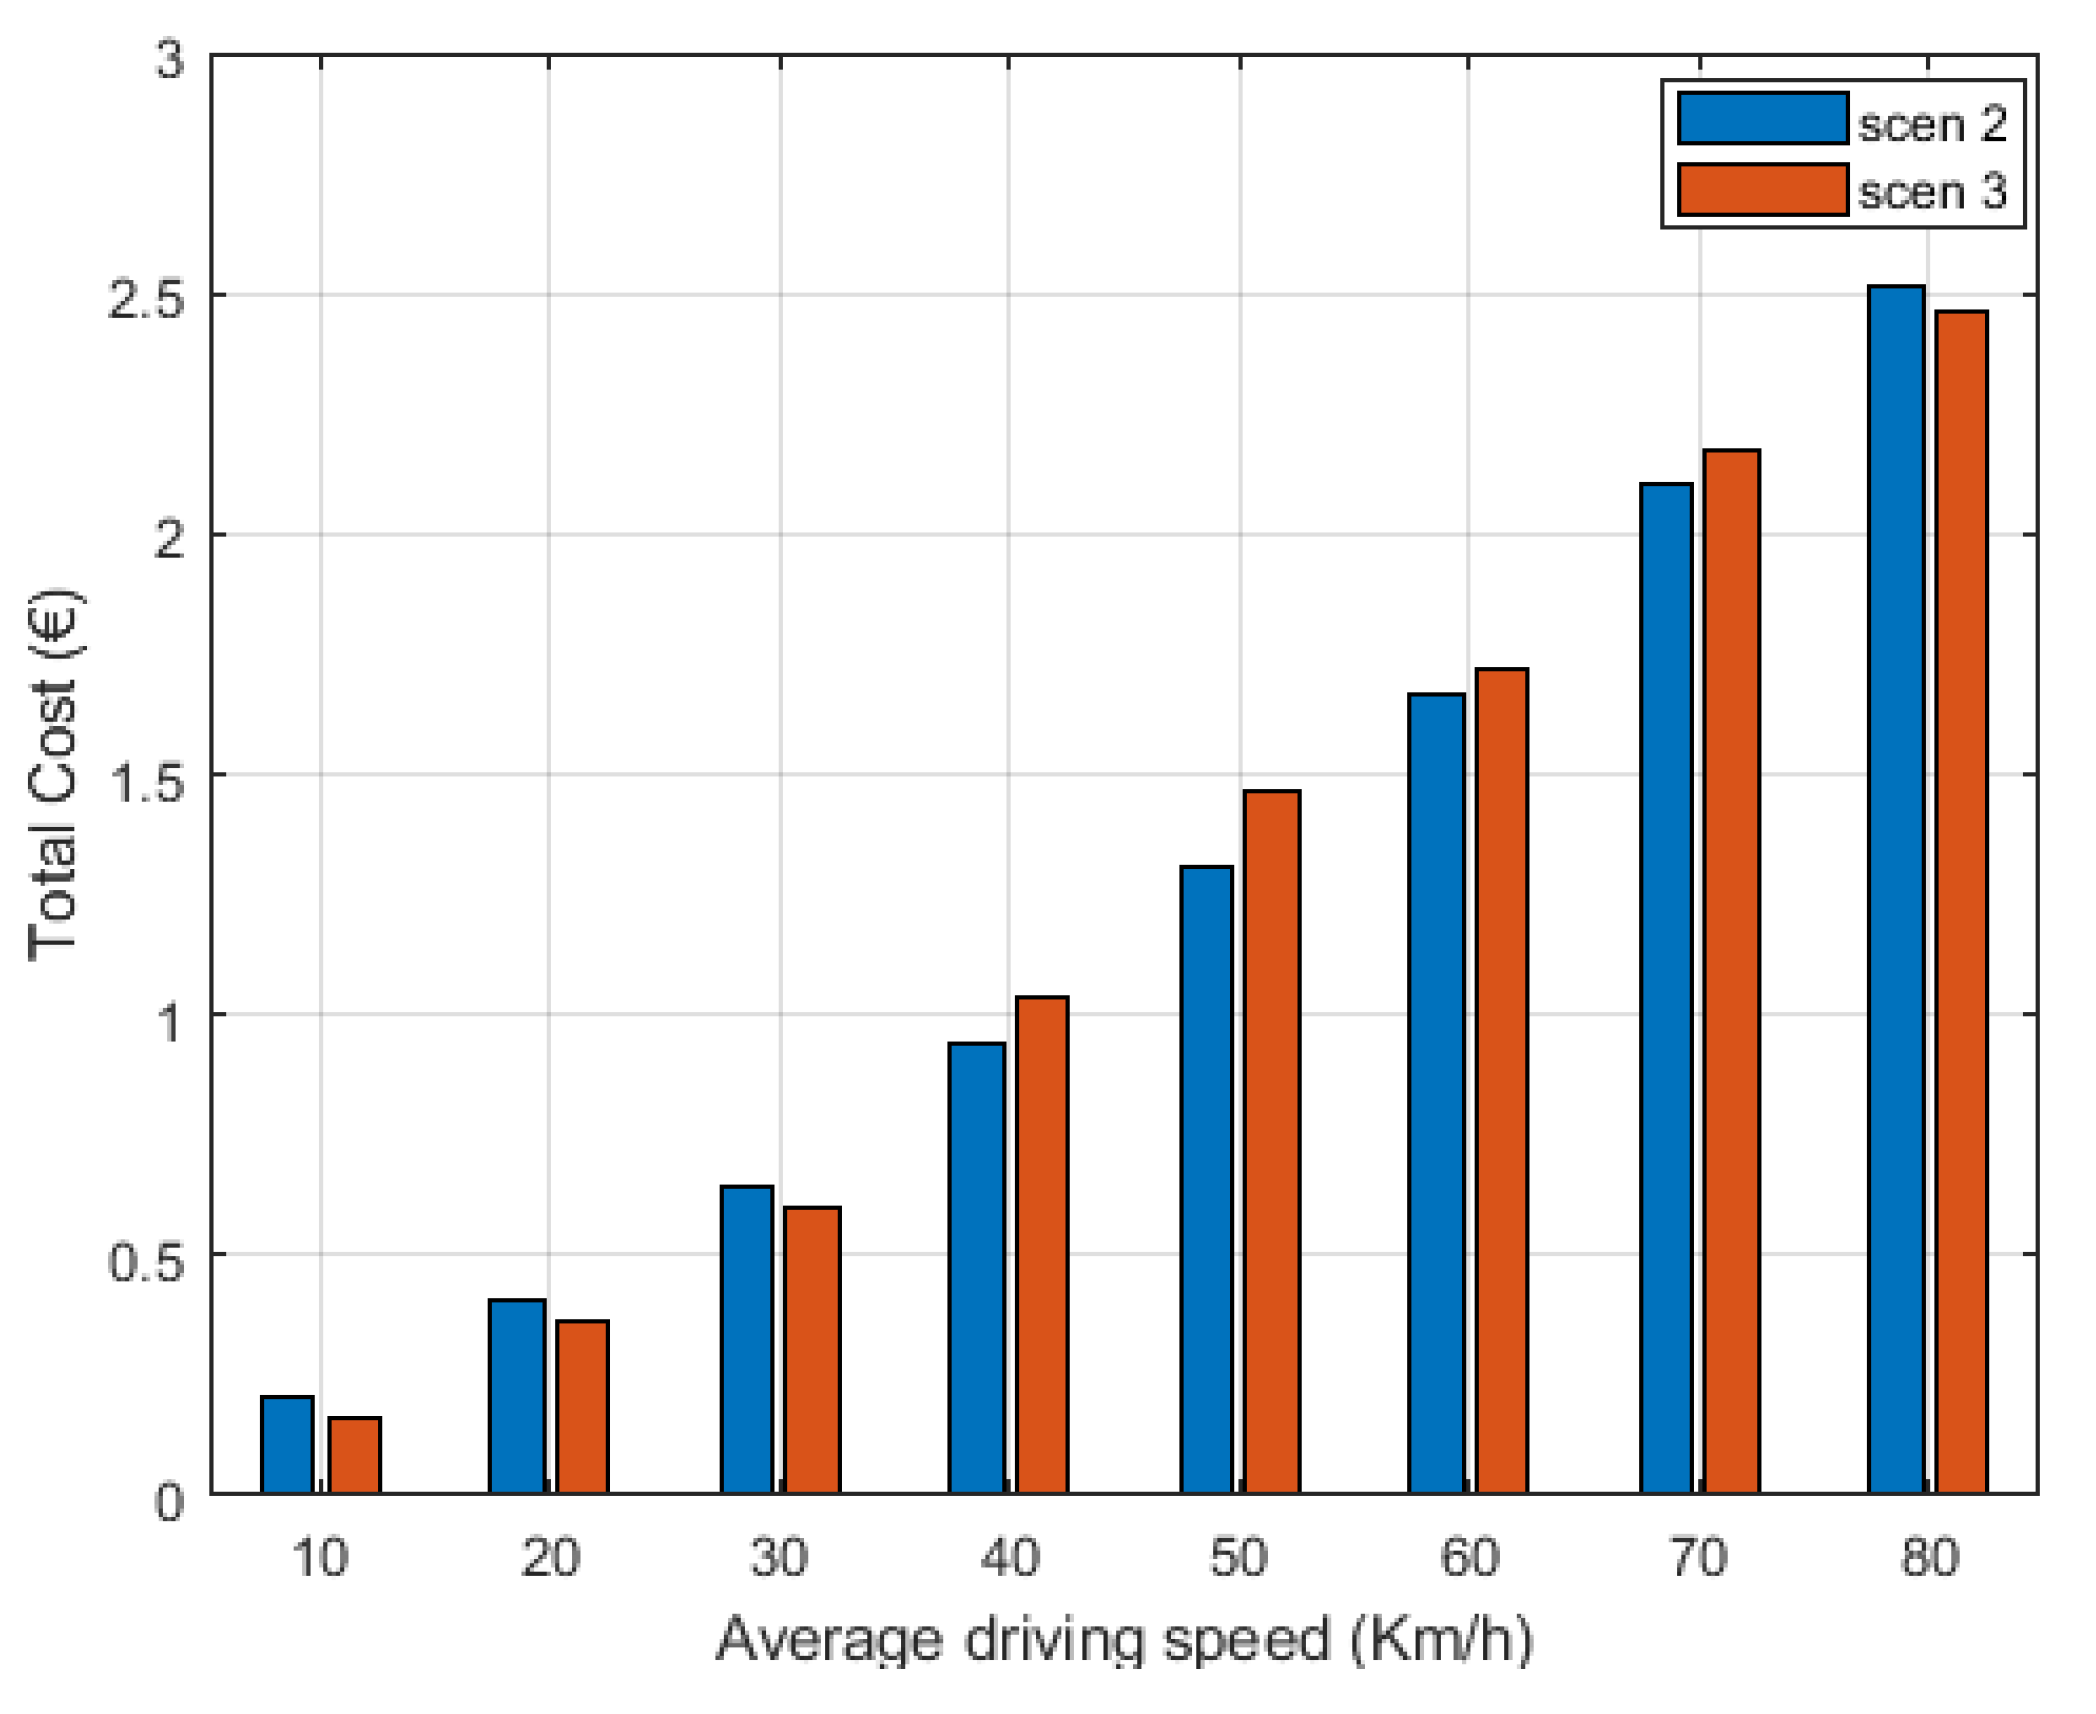
Using the optimal values from Figure 8, the total cost is shown in Figure 9 for both scenario 2 and scenario 1, i.e., for p t h = 1.5 . A higher cost gain, approximately 34%, was shown for 20 km/h. For higher driving speeds, the cost gain gradually dropped to ~31% for 30 km/h, ~23% for 40 km/h, and reaching a practically insignificant value of 2% for 80 km/h.
Next, the last charging policy that was built upon the V2G concept was investigated, again with respect to the total cost that the PHEV user is charged. Since the consideration of the V2G option was added to the already established design of scenario 2, the conclusions drawn so far regarding the optimal values for the price threshold and the S o C f l e x were used as the basis for evaluating the value of scenario 3. Thus, the optimal values for p t h and S o C f l e x (Figure 8) that led to the lowest cost for scenario 2 were now applied in scenario 3, so that a comparison could be made between scenario 2 and 3 as shown in Figure 10.
It should be pointed out that in scenario 3, an additional parameter was considered, S o C V 2 G , which practically determines at which battery level the vehicle can return power to the grid. Herein, this parameter was chosen to be 10% higher than the S o C f l e x o p t , i.e., the optimal value for the S o C f l e x that led to the minimum total cost for the respective velocity (Figure 8).
Scenario 3 offered an extra, however marginal, cost gain to the PHEV user for lower speeds (i.e., 10, 20, and 30 km/h). Specifically, the cost gain for 20 km/h increased to ~41% compared to the 34% that was derived earlier with scenario 2.
Switching back to the network perspective, Figure 11 depicts the average load over 24 h for the optimized setups regarding p t h and S o C f l e x . Note that scenario 3 was also considered in the figure but only for the three lowest driving speeds, where this scenario showed a slightly better performance regarding total cost compared to scenario 2. Figure 11 practically verifies our initial remark that the network remains unaffected from the price-sensitive charging strategies with the respect to the average load over 24 h.
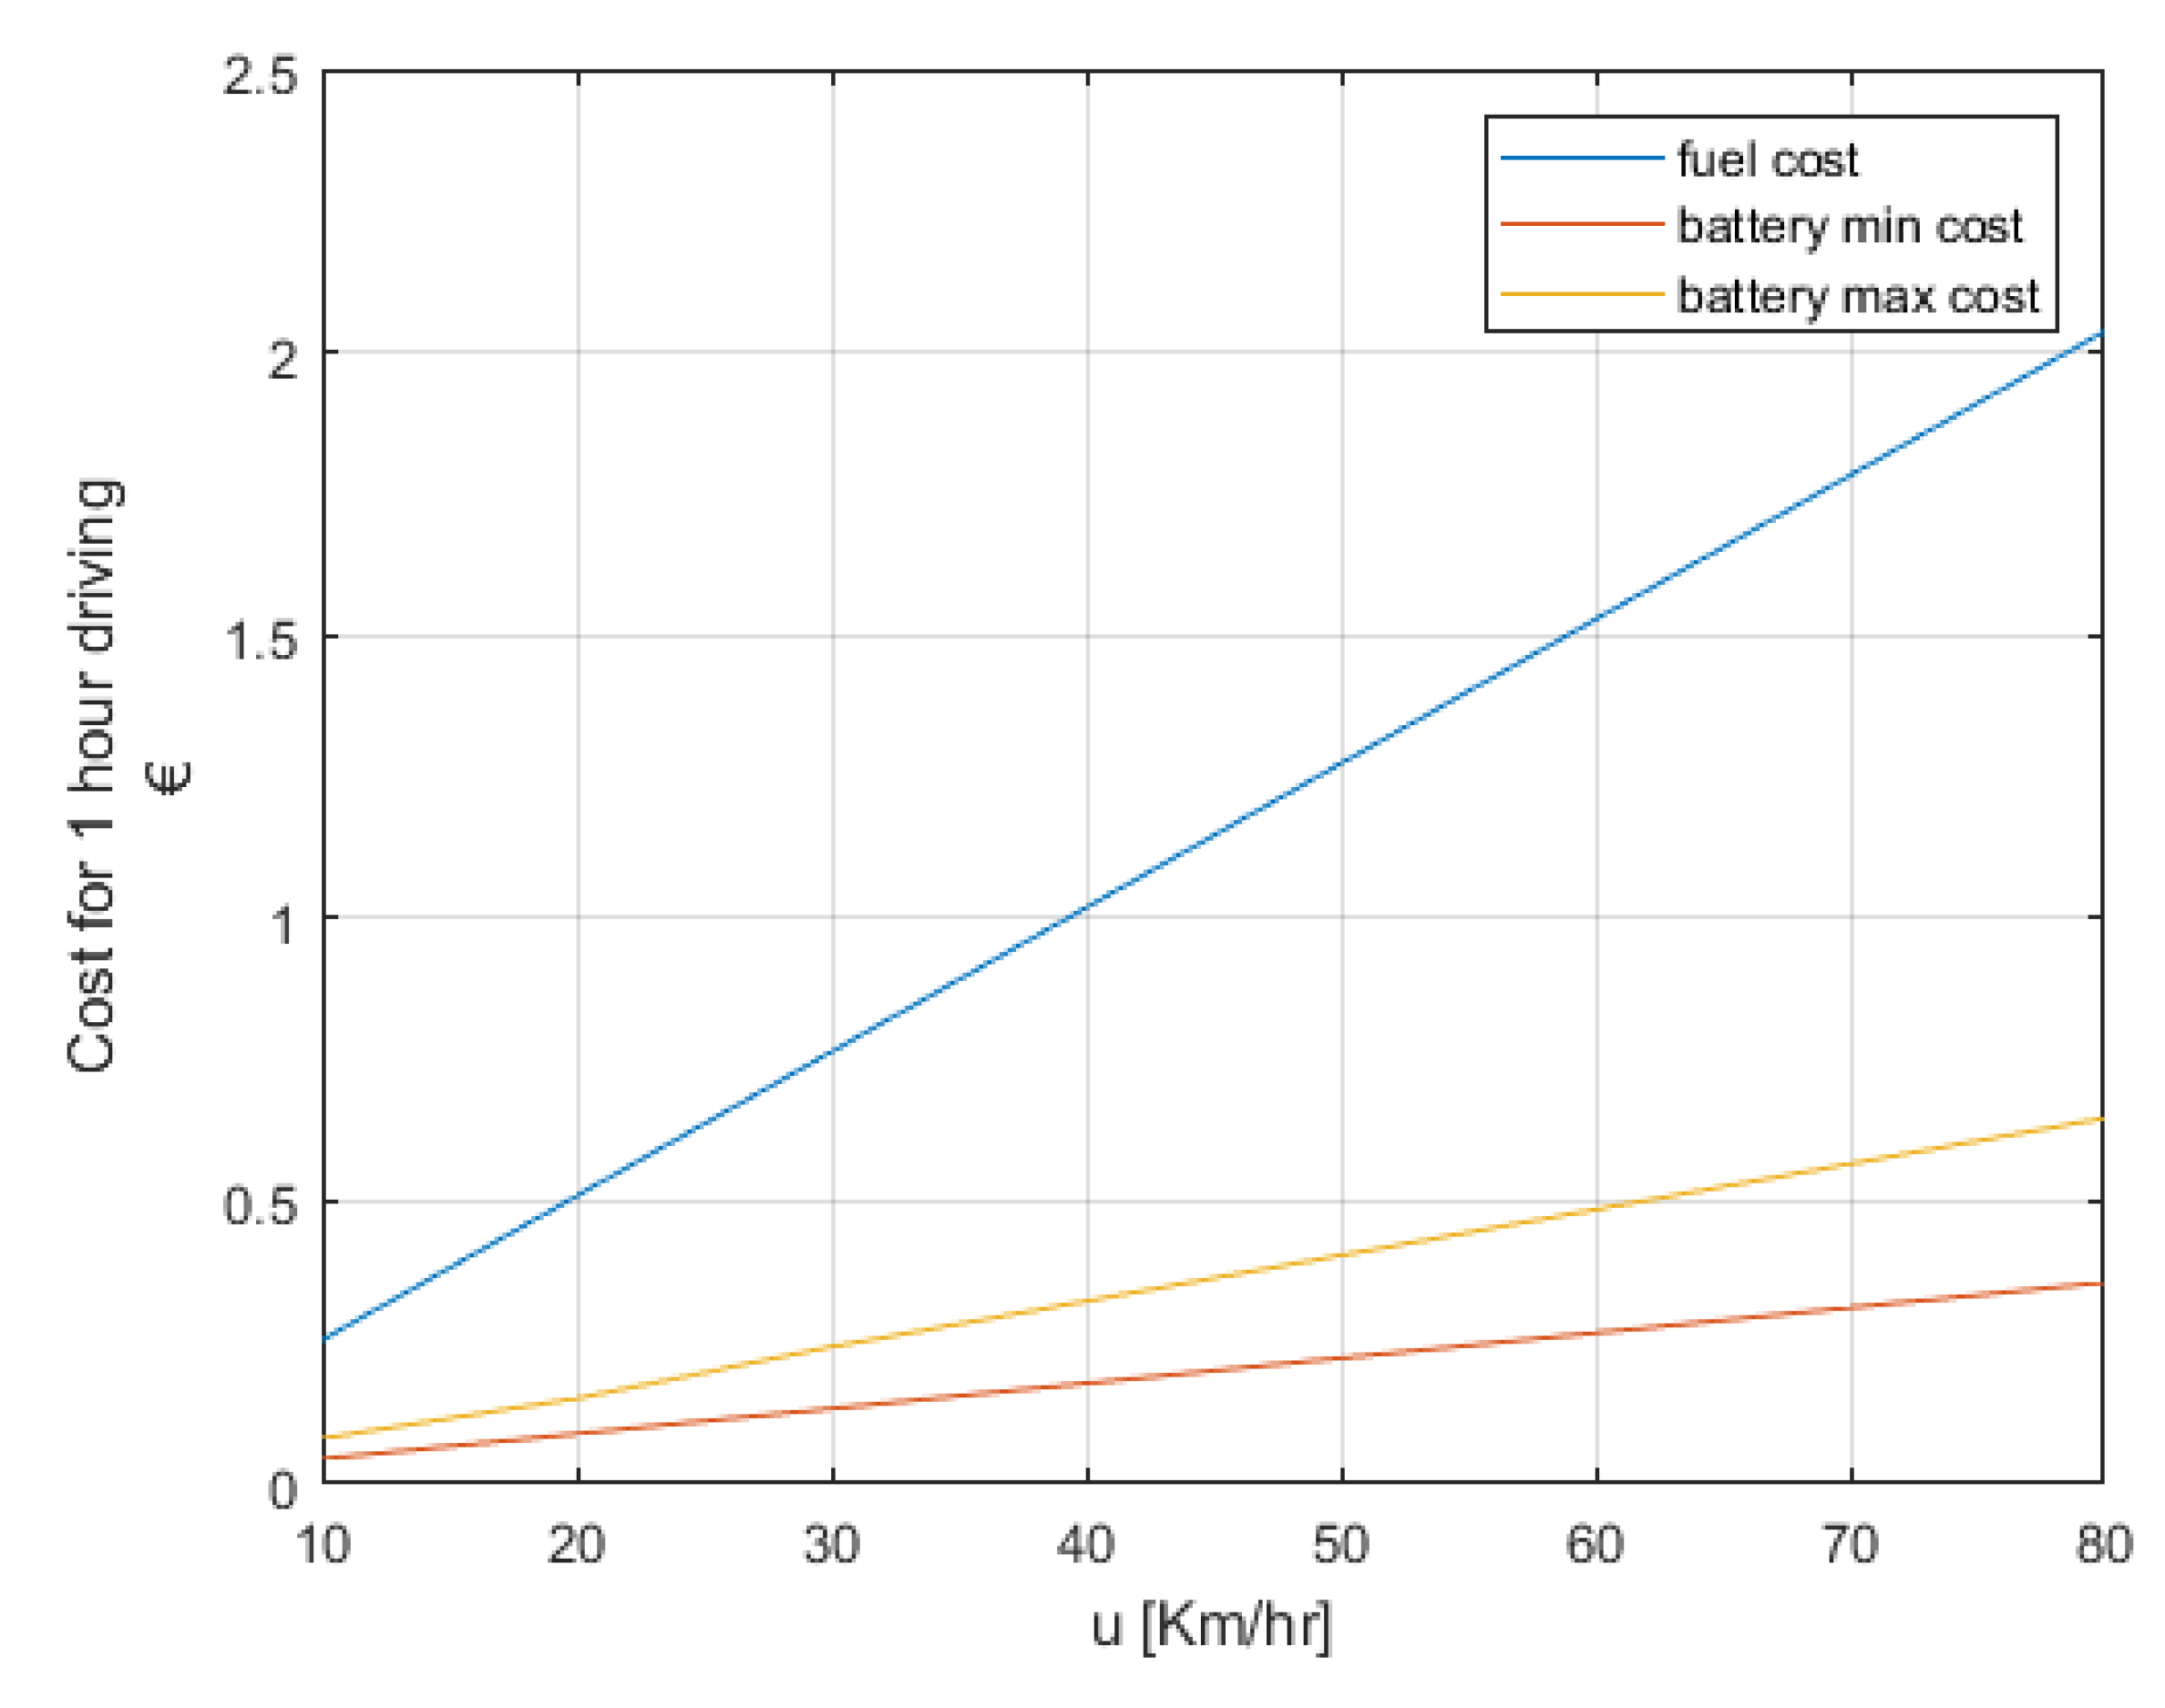
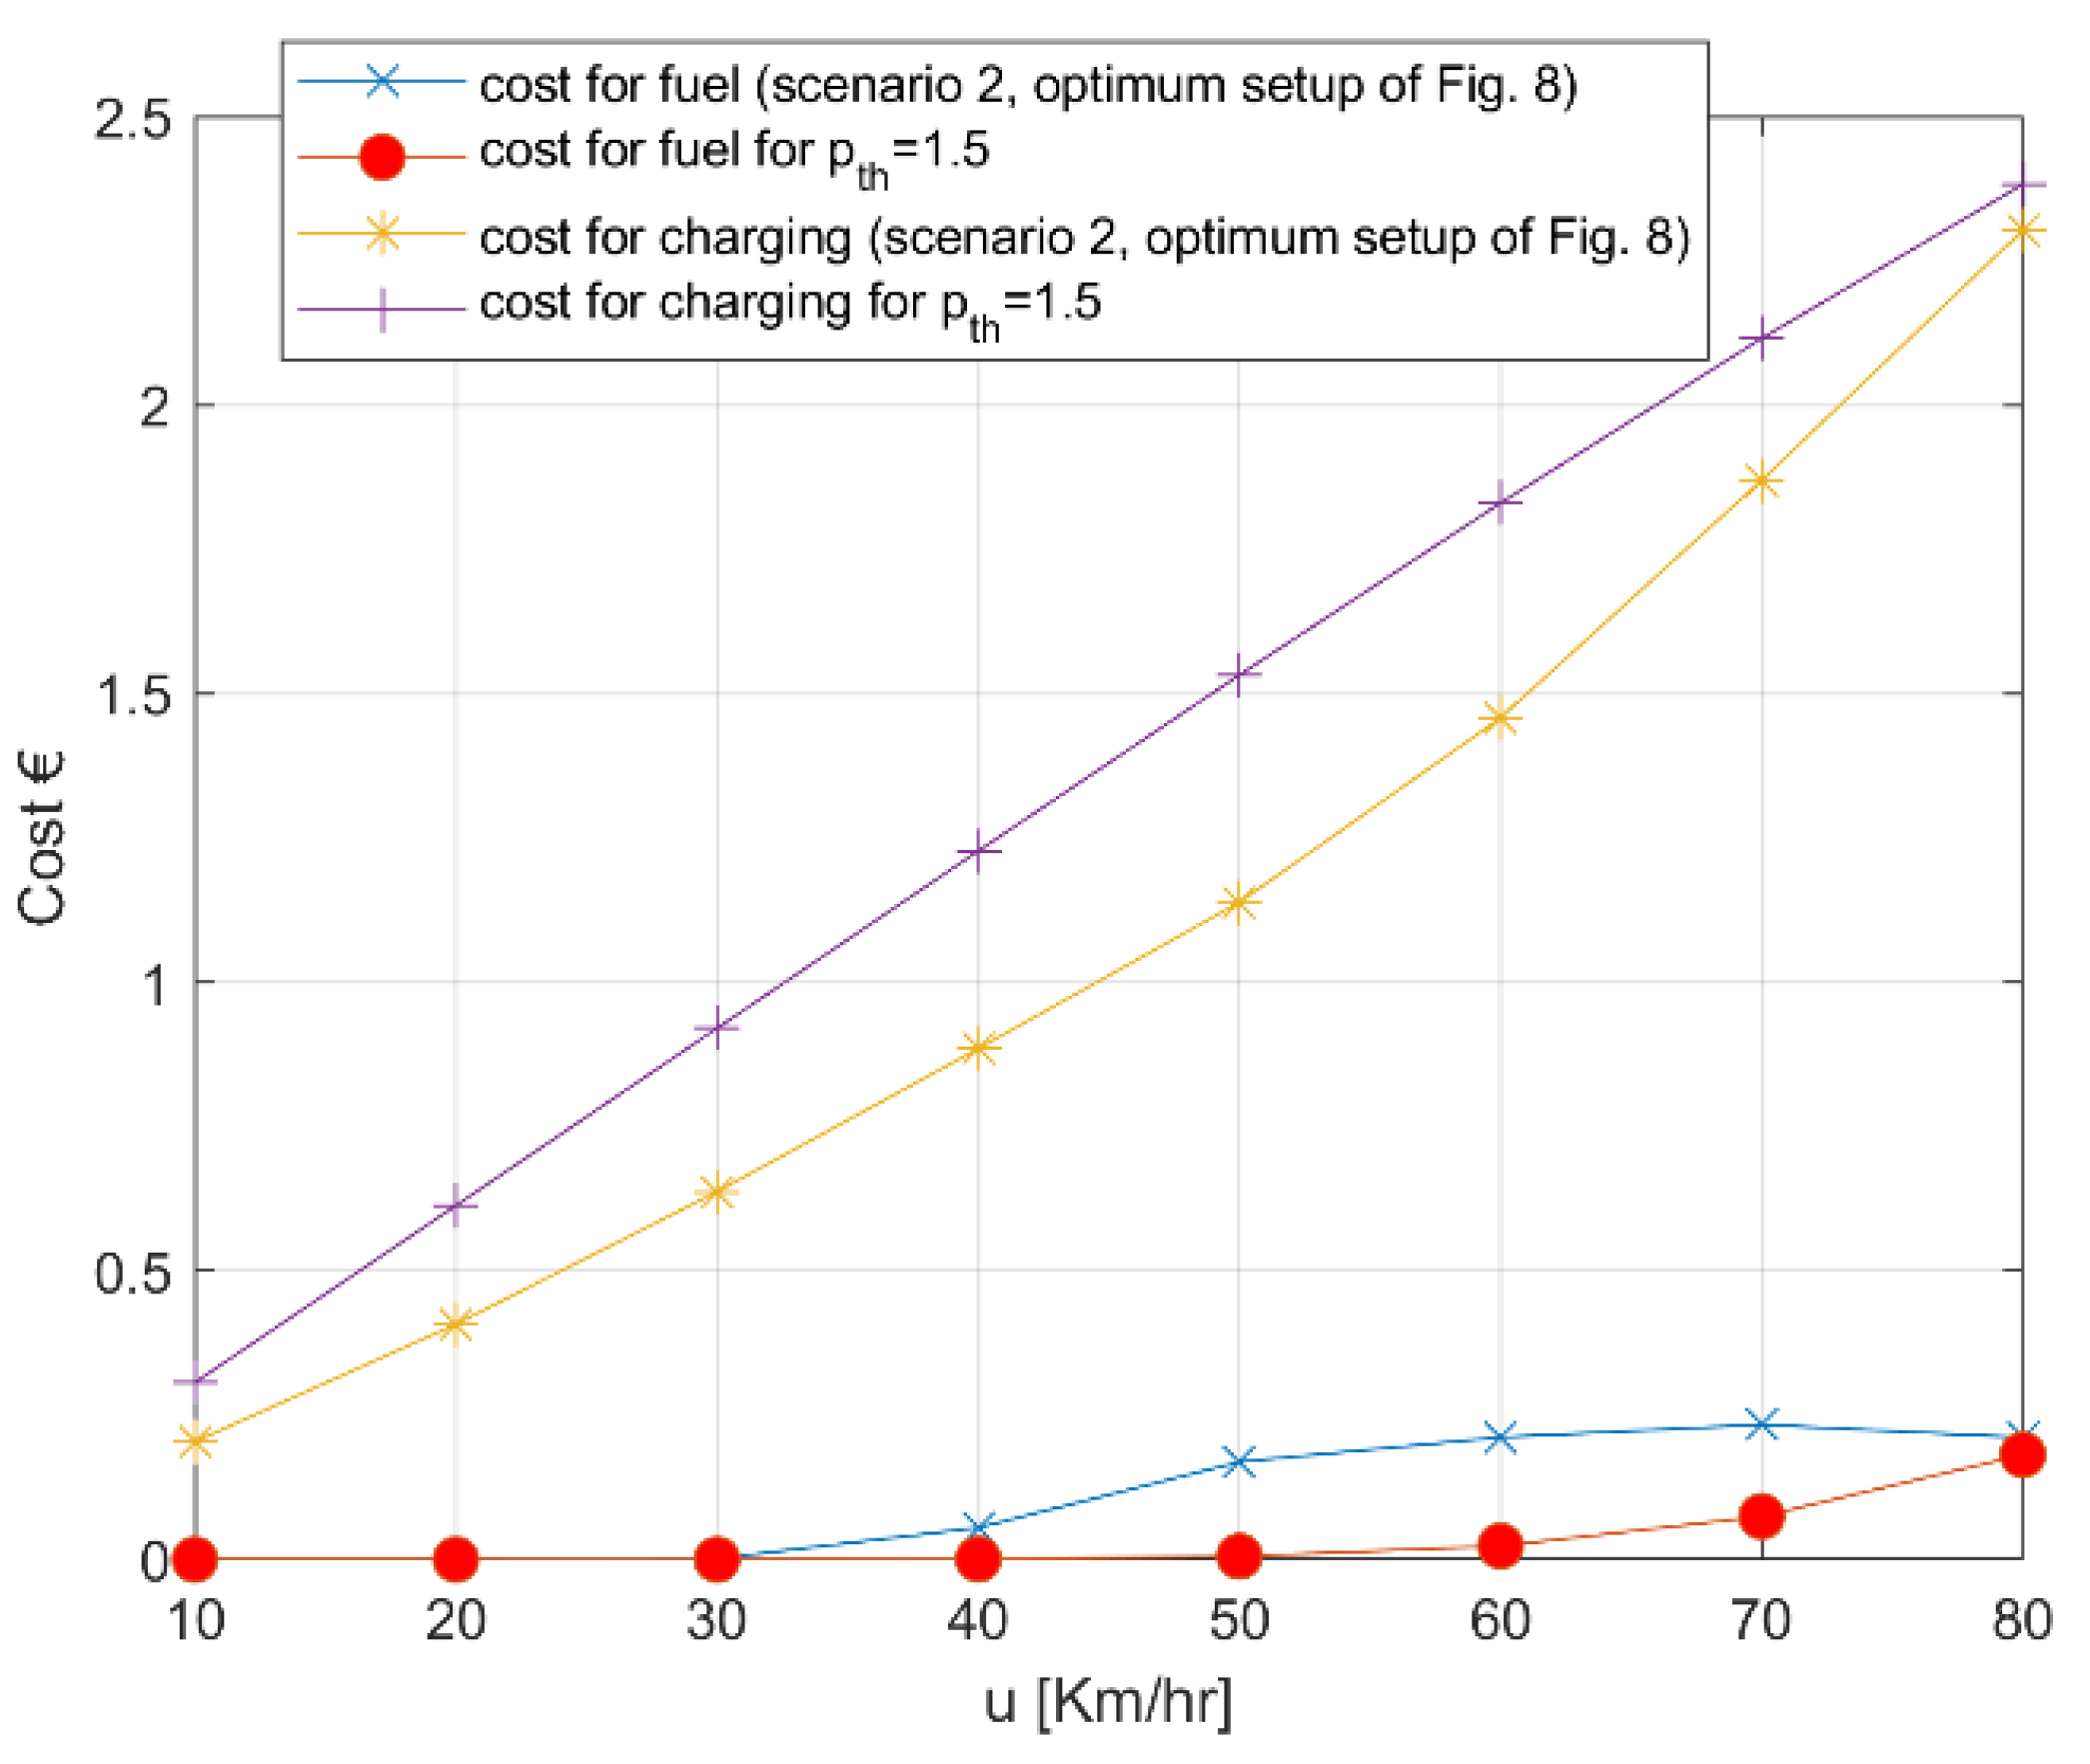
As a final comment to this study, Figure 12 provides insight into how the proposed charging strategies along with the optimized setups for the different driving speeds achieved the cost gains shown earlier. Specifically, Figure 12 analyses the total cost of Figure 9 into cost for fuel (when the PHEV is forced to switch to fuel while driving) and charging costs (produced by the charging session that the PHEV needs to initiate). For instance, at 50 km/h the total cost for the optimum setup (Figure 9) was EUR 1.31; this value was analyzed to be EUR 0.17 due to the fuel and EUR 1.14 due to the charging.
It is clear that any cost gain between the reference scenario (pth = 1.5) and the optimized setup comes from reduced charging sessions. It is worth noting that for driving speeds up to 40 km/h, the cost gain for the PHEV user comes without sacrificing the clean energy advantage that PHEVs bring to transportation; the cost for fuel (blue line) for the optimal setup of scenario 2 was practically zero, equal to the reference scenario. For higher driving speeds, the fuel cost was higher than the reference scenario. Nevertheless, in the context of this kind of study, a possible remedy for this situation could be the use of more granular values for all the parameters involved in our simulation platform than the ones used in this work. This way, optimized setups that lead to fuel costs as low as scenario 1 and, at the same time, reduce the total cost for the PHEV user might derived.

4. Discussion

In essence, this work presents a charging policy that takes advantage of the practically limited energy needs of PHEV owners (a full charge is not required for the typical PHEV driver over the course of a day [21]) in order to provide the owner with price incentives to regulate the charging of the vehicle. At first, Figure 5 shows that for a moderate driving speed, the average SoC level throughout the day was kept high (>90%), leading to the conclusion that the vehicle starts unnecessary charging cycles; imposing a price threshold to charging directly lowers the SoC level but not as low as to force the vehicle to switch to fuel. In order to prove that such a charging strategy that employs price thresholds to allow for charging that does not lead to additional energy demands throughout the day, Figure 6 is provided. Lastly, the total cost for a PHEV driver for 24 h vehicle usage comprising both charging and fuel costs is shown in Figure 7; there is a clear gain from using price constraints for charging without sacrificing user experience, since the vehicle’s average SoC level remained higher than 75%. In this context, the work in [22] acknowledges the fact that electric vehicles do not need full daily charges to meet their driving needs and investigates the impact of non-systematic plug-in behavior to the grid and to the potential for flexibility.
Part of this work further analyzed the specific parameters of the proposed charging strategies (i.e., p t h and S o C f l e x ) and offered optimized values that maximized the cost gain for PHEV owners (see Figure 8).
V2G was also considered as a means to further reduce charging costs as specifically shown in Figure 10. Therein, it was shown that in the context of the proposed charging strategy, V2G had very little to offer, showing a marginal extra cost gain for the PHEV user for low driving speeds.
In an effort to broaden the analysis of this work, Figure 12 provides an insight into the source of the costs, presenting the fuel and charging costs separately. Apparently, after the point of 40 km/h, any cost reduction available to the PHEV owner comes with an increase in fuel consumption, i.e., the driver cannot rely exclusively on the vehicle’s battery. This final remark clearly sets the path for future work involving multi-objective problems that target both the cost for the user and the efficient use of renewable energy [23].

5. Conclusions

This work focused on price-sensitive charging strategies in the context of ICS that allow PHEV users to control the charging of their vehicle in order to receive cost benefits. Two such strategies were employed, i.e., scenarios 2 and 3 compared against a reference strategy of uncontrolled charging (scenario 1).
The study was based on Monte Carlo simulations to compensate for the stochastic nature of the PHEV mobility patterns via a MATLAB simulation platform. Firstly, as it was proved in this work, price-sensitive charging policies did not bear additional load to the energy grid with respect to the average load over a period of time compared to uncontrolled charging (scenario 1). On the other hand, uncontrolled charging involved higher costs for the PHEV user compared to ICS strategies (scenarios 2 and 3). The proposed price-sensitive charging strategies resulted in cost gains for the PHEV user that were higher for lower driving speeds, i.e., lower than 40 km/h; for instance, a PHEV user with an average driving speed of 20 km/h may benefit from ~34% cost reduction under the typical G2V operation (scenario 2) and ~41% if V2G functionality is also considered (scenario 3).
Furthermore, the parametric nature of such charging strategies was tackled, and guidelines for the PHEV user to select these parameters optimally in order to receive cost benefits were derived. Finally, especially for higher driving speeds (>40 km/h), further analysis is necessary in order for both the objectives of reduced costs for PHEV users and of prioritizing the consumption of clean energy coming from PHEV batteries over fuel to be met simultaneously.

Author Contributions

Conceptualization, D.Z., E.K., G.A. and G.T.; methodology, D.Z. and G.A.; validation, D.Z. and E.K.; formal analysis, D.Z., E.K. and G.A.; investigation, G.A., D.Z. and G.T.; writing—original draft preparation, E.K. and D.Z.; writing—review and editing, G.A., G.T. and D.Z. All authors have read and agreed to the published version of the manuscript.

Funding

This work was funded by the EU HORIZON 2020 program under grant agreement no. 824386 (MERLON: Integrated Modular Energy Systems and Local Flexibility Trading for Neutral Energy Islands).

Institutional Review Board Statement

Not applicable.

Informed Consent Statement

Not applicable.

Data Availability Statement

Not applicable.

Conflicts of Interest

The authors declare no conflict of interest.

References

  1. International Energy Agency. Global EV Outlook; International Energy Agency: Paris, France, 2020. [Google Scholar]
  2. EV-Volumes—The Electric Vehicle World Sales Database. Available online: https://www.ev-volumes.com/ (accessed on 30 July 2021).
  3. ACEA—European Automobile Manufacturers’ Association. Available online: https://www.acea.auto/ (accessed on 30 July 2021).
  4. Ayyadi, S.; Bilil, H.; Maaroufi, M. Optimal charging of Electric Vehicles in residential area. Sustain. Energy Grids Netw. 2019, 19, 100240. [Google Scholar] [CrossRef]
  5. Li, X.; Xiang, Y.; Lyu, L.; Ji, C.; Zhang, Q.; Teng, F.; Liu, Y. Price Incentive-Based Charging Navigation Strategy for Electric Vehicles. IEEE Trans. Ind. Appl. 2020, 56, 5762–5774. [Google Scholar] [CrossRef]
  6. Korkas, C.D.; Baldi, S.; Yuan, S.; Kosmatopoulos, E.B. An Adaptive Learning-Based Approach for Nearly Optimal Dynamic Charging of Electric Vehicle Fleets. IEEE Trans. Intell. Transp. Syst. 2018, 19, 2066–2075. [Google Scholar] [CrossRef]
  7. Vuelvas, J.; Ruiz, F.; Gruosso, G. A time-of-use pricing strategy for managing electric vehicle clusters. Sustain. Energy Grids Netw. 2021, 25, 100411. [Google Scholar] [CrossRef]
  8. Bagherzadeh, E.; Ghiasian, A.; Rabiee, A. Long-term profit for electric vehicle charging stations: A stochastic optimization approach. Sustain. Energy Grids Netw. 2020, 24, 100391. [Google Scholar] [CrossRef]
  9. Di Somma, M.; Ciabattoni, L.; Comodi, G.; Graditi, G. Managing plug-in electric vehicles in eco-environmental operation optimization of local multi-energy systems. Sustain. Energy Grids Netw. 2020, 23, 100376. [Google Scholar] [CrossRef]
  10. Grahn, P. Electric Vehicle Charging Impact on Load Profile. Licentiate Thesis, KTH Royal Institute of Technology, Stokholm, Sweden, 2013. [Google Scholar]
  11. Hussain, M.; Gao, Y. A review of demand response in an efficient smart grid environment. Electr. J. 2018, 31, 55–63. [Google Scholar] [CrossRef]
  12. Merlon-Project.eu. Available online: https://www.merlon-project.eu/ (accessed on 9 September 2021).
  13. Mu, Y.; Wu, N.; Jenkins, H.; Jia, H.; Wang, C. A Spatial-Temporal model for grid impact analysis of plug-in electric vehicles. Appl. Energy 2014, 114, 465. [Google Scholar] [CrossRef] [Green Version]
  14. Steen, D.; Thuan, A.; Carlson, O.; Bertling, L. Assessment of electric vehicle charging scenarios based on demographical data. IEEE Trans. Smart Grid 2012, 3, 1457–1468. [Google Scholar] [CrossRef]
  15. Sachan, S.; Adnan, N. Stochastic charging of electric vehicles in smart power distribution grids. Sustain. Cities Soc. 2018, 40, 91–100. [Google Scholar] [CrossRef]
  16. Compile Project. Available online: https://www.compile-project.eu/. (accessed on 12 October 2021).
  17. See What Nord Pool Can Offer You. Available online: Nordpoolgroup.com (accessed on 30 July 2021).
  18. Koutsi, E.; Deligiannis, S.; Athanasiadou, G.; Zarbouti, D.; Tsoulos, G. Analysis of EV Cost-Based Charging Load Profiles. Proceedings 2020, 65, 2. [Google Scholar] [CrossRef]
  19. National Household Travel Survey. Available online: https://nhts.ornl.gov/ (accessed on 30 July 2021).
  20. Gasoline and Diesel Prices by Country. Available online: https://www.globalpetrolprices.com/ (accessed on 30 July 2021).
  21. Thingvad, A.; Andersen, P.B.; Unterluggauer, T.; Træholt, C.; Marinelli, M. Electrification of personal vehicle travels in cities—Quantifying the public charging demand. eTransportation 2021, 9, 100125. [Google Scholar] [CrossRef]
  22. Venegas, F.G.; Petit, M.; Perez, Y. Plug-in behavior of electric vehicles users: Insights from a large-scale trial and impacts for grid integration studies. eTransportation 2021, 10, 100131. [Google Scholar] [CrossRef]
  23. Fachrizal, R.; Shepero, M.; van der Meer, D.; Munkhammar, J.; Widén, J. Smart charging of electric vehicles considering photovoltaic power production and electricity consumption: A review. eTransportation 2020, 4, 100056. [Google Scholar] [CrossRef]
Figure 1. Price development throughout the day.
Electricity 02 00027 g001
Figure 2. The policies employed by the three charging strategies: scenario 1, scenario 2, and scenario 3.
Electricity 02 00027 g002
Figure 3. System input and output parameters.
Electricity 02 00027 g003
Figure 4. Cost for 1 h of driving.
Electricity 02 00027 g004
Figure 5. Average SoC per PHEV over 24 h, S o C a v g 24 H r s . Driving speed for the PHEV user was set at 30 km/h.
Electricity 02 00027 g005
Figure 6. Average load induced at the energy grid from 2000 EVs over 24 h, L o a d a v g 24 H r s . Driving speed for the PHEV user was set at 30 km/h.
Electricity 02 00027 g006
Figure 7. Total cost per PHEV over 24 h, C t o t 24 H r s . Driving speed for the PHEV user was set at 30 km/h.
Electricity 02 00027 g007
Figure 8. Optimal values for pth and SoCflex for each driving speed that led to the minimum total cost for the PHEV user.
Electricity 02 00027 g008
Figure 9. Total cost, C t o t 24 H r s , for scenario 1 and scenario 2 with the optimal values for p t h and S o C f l e x .
Electricity 02 00027 g009
Figure 10. Scenario 2 and scenario 3 with optimal p t h and S o C f l e x (Figure 8). In addition, scenario 3 with S o C v 2 g = 110 % S o C f l e x o p t .
Electricity 02 00027 g010
Figure 11. Average load, L o a d a v g 24 H r s , for the optimal setup leading to the minimum cost for each driving speed.
Electricity 02 00027 g011
Figure 12. Analysis of the total costs of the fuel and charging costs.
Electricity 02 00027 g012
Table 1. Simulation parameters.
Simulation ParameterValue
Charging power, P c h 11 kW
Vehicle consumption (battery)1, C m 0.165 kWh/km
Vehicle consumption (fuel)1, F m 1.9 L/100 km
Price for fuel, F p r 1.34 €/L [20]
Duration of the simulation time slot, d t 30 min
1 Figures for a BMW i3s.
Table 2. Values examined for minimizing the cost of each driving speed.
Driving Speed (km/h)Minimum Battery Required
to Allow Controlled Charging (%)
Price Threshold
Coefficient
u S O C f l e x p t h
10, 20, 30, 40, 50, 60, 70, 8020, 40, 50, 600.8, 0.9, 1.0, 1.1, 1.2, 1.5
Publisher’s Note: MDPI stays neutral with regard to jurisdictional claims in published maps and institutional affiliations.

