Article

Genomic and Chemical Markers of Contamination in Young of the Year Bluefish from Contrasting Estuaries

1
School of Natural Sciences and Mathematics, Stockton University, Galloway, NJ 08205, USA
2
NOAA Fisheries, James J. Howard Laboratory at Sandy Hook, Highlands, NJ 07732, USA
*
Author to whom correspondence should be addressed.
Deceased 1/2015.
Pollutants 2026, 6(3), 48; https://doi.org/10.3390/pollutants6030048 (registering DOI)
Submission received: 16 May 2026 / Revised: 26 August 2026 / Accepted: 31 August 2026 / Published: 5 September 2026
(This article belongs to the Section Impact Assessment of Environmental Pollution)

Abstract

To investigate the effects of habitat degradation on the genomic level, young of the year (YOY) bluefish, (Pomatomus saltatrix) from the highly urbanized Hudson Raritan Estuary (HRE) and the less impacted Mullica River-Great Bay (MRGB) estuary were analyzed for condition, level of PCBs (Polychlorobiphenyls), and pesticides, and compared in a preliminary transcriptomic study. For chemical analysis, whole juvenile fish were freeze-dried, extracted in DCM (Dichloromethane), extracts were cleaned by florisil/alumina/silica column chromatography and size-exclusion HPLC, and quantified by gas chromatography. For transcriptomic analysis, Suppression Subtractive Hybridization (SSH) libraries from the pooled livers of fish from the two sites were constructed to subtract common transcripts and recover cloned expressed sequence tag (EST) transcripts that were putatively more highly expressed in one or the other environment. Transcripts were Sanger-sequenced and identified by bioinformatic analysis. Relative quantitative PCR (polymerase chain reaction) was used to investigate a subset of the selected transcripts. MRGB fish were larger and in better condition than HRE fish. HRE fish had PCB concentrations that were, in sum, about seven times higher than MRGB fish and were more highly contaminated with pesticides including Dichlorodiphenyltrichloroethane (DDT) and its metabolites. Transcripts related to metabolic, transport, immune, detoxification, signaling, and environmental response and additional functions were associated with contrasting habitats and provide gene targets to investigate the hypothesis that the growth and condition of the HRE bluefish may be limited by their poor environmental quality.

1. Introduction

Anthropogenic impacts including chemical contamination can potentially limit the values and function of nursery habitats for reproduction and growth of estuarine-dependent fishes [1]. To investigate the genomic effects of habitat degradation, juveniles of the highly migratory bluefish, Pomatomus saltatrix, which has an estuarine-dependent juvenile stage, were compared in a preliminary transcriptomic investigation. Bluefish is a wide-ranging migratory species of commercial and sport fishery value [2]. Historically, fluctuations have been observed in bluefish populations and recent assessments (2025) indicate that bluefish stocks have been overfished in the past but are not experiencing overfishing at the current time [3]. With uncertainties in the variables surrounding recruitment from year to year in any fishery, it is particularly difficult to assess recruitment in bluefish given its complex migratory nature, little-understood spawning regime, and the attendant uncertainties of a pelagic larval stage followed by a shift to the near-shore or estuarine-dependent juvenile stage [4]. Another important variable in the dynamics of bluefish populations is that the east coast nursery areas for juveniles, the Mid-Atlantic bight (MAB), include some of the most anthropogenically altered and contaminated habitats in the species’ range [5,6].
Bluefish fry enter the estuaries along the coast after yolk development in the spring and later in the summer in two distinct cohorts due to a spring and summer spawn [7]. The first year of life is spent within the nursery estuary, feeding on progressively higher trophic-level prey and rapidly growing [2]. By the end of the first season, this ravenous predator has reached a length of ~200–250 mm and will join the offshore southerly migration [7,8]. Given the rapid growth (1.17–1.35 mm/d.) of the young of the year (YOY) [7] and their successive food choices (copepods, fry and juveniles of Atlantic silversides, bay anchovy, menhaden, clupeids, striped bass, sand shrimp, mysids, other fish and invertebrates) [2], the YOY bluefish has been shown to be a good integrator of the chemical condition of the estuary [9]. Although their first-year residence in the nursery estuaries is relatively short, significant bioaccumulation of polychlorinated biphenyls (PCBs), polybrominated diphenyl ethers (PBDEs), and organochlorine pesticides (OCPs) can occur in YOY bluefish [9,10,11]. Bluefish apparently continue to accumulate PCBs and other contaminants throughout their life [12,13].
To ensure optimal growth and development of fishes through their embryonic and juvenile stages, the underlying proper regulation of genes and the physiological processes they support is essential. Environmental degradation due to anthropogenic chemical contamination of persistent organic pollutants (POP) may contribute to poor growth and limited reproductive success due to disruption of physiological processes and mis-regulation of genes. To test this relationship, bluefish from two contrasting environments were compared to investigate the contaminant load of selected POPs and liver transcripts that might be associated with this load. Two sites with differing anthropogenic contamination were compared in this study. Site one was Newark Bay (Hoboken, NJ), which is a major east coast U.S. commercial shipping port within the Hudson Raritan Estuary (HRE) complex, with a well-documented history of industrial contamination [6]. In contrast, site two was the relatively less impacted Mullica River-Great Bay (MRGB) estuarine system primarily consisting of forested open space and suburban and rural uses, which is located within the Pinelands National Reserve, and the Jacques Cousteau National Estuarine Research Reserve (JCNERR), a part of the National Estuarine Research Reserve System administered by the National Oceanic and Atmospheric Administration (NOAA). To characterize the level of contamination at the contrasting field sites, PCBs and a suite of organochlorine pesticides including Dichlorodiphenyltrichloroethane (DDT) were determined as markers of habitat contamination in sampled fish. These are not a comprehensive inventory of potential site contamination in the HRE, which also includes Dioxins, PBDE, PFAS (Per- and Polyfluoroalkyl Substances), PAH (Polycyclic aromatic hydrocarbons), HC/VOC (hydrocarbon and volatile organic compounds), pharmaceutical and personal care products (PPCP), and heavy metal among others [5,14]. To preliminarily investigate transcriptomic differences, Suppression Subtractive Hybridization (SSH) cDNA libraries were used to enrich expressed sequence tag (EST) transcripts in bluefish livers that were present or absent in the contrasting habitats. SSH has been shown to be a useful tool to isolate potentially differentially expressed genes from the environment [15,16,17]. Isolation and identification of these putative environmentally responsive EST transcripts can also be an important step in developing bio-monitoring tools to relate genetic and physiological conditions to other indices, such as size and growth rate, which contribute to predictive models of year class recruitment.

2. Materials and Methods

2.1. Sites and Sampling

Bluefish collection occurred at two sites, at Newark Bay/Bayonne, NJ in the urbanized HRE (40°39′46.35″ N; 74° 7′59.56″ W) and Graveling Point, NJ in the less urbanized MRGB (39°32′0.85″ N; 74°23′27.14″ W), that were selected for contrasting levels of urbanized industrial anthropogenic contamination.
A total of 50 YOY bluefish were captured by hook and line or seine within one week from the two sites in August of 2004. Fish were immediately placed on dry ice after capture and stored for four months at −80 °C until processed. All fish were measured for total length, fork length and wet weight before further processing. Fulton’s condition index was calculated as K = 100,000 × weight (g)/standard length (mm)3 [18]. Twenty-two fish from each site (44 total) were randomly assigned to either chemical analysis (n = 11 per site × two) or genetic analysis (n = 11 per site × two). Chemical analyses were conducted on the whole individual fish per site, while livers were extracted and pooled by site (n = 2) for the genomic analysis to capture variability within the sites while providing enough material to perform contrasting site-specific transcript subtraction. All chemical and genomic analyses were completed within two years of initial processing. All experimental protocols were approved by the Stockton University Institutional Animal Care and Use Committee (IACUC) 20020521, 21 May 2002.

2.2. Chemical Analysis

Organic chemical analyses for two classes of POP (PCBs and Pesticides) were undertaken at the NOAA James J Howard Marine Sciences Laboratory (Sandy Hook, NJ, USA), generally following Deshpande et al. [10,12]. Briefly, the whole individual fishes were partially thawed and cut into pieces. Samples were lyophilized until dry and then ground in a blender with anhydrous sodium sulfate. A blank and a certified reference material (CRM), CARP-2 [19], were included in the analysis. Method surrogate (MS) internal standards (4,4’-dibromooctafluorobiphenyl, Sigma Aldrich, St. Louis, MO, USA; Ronnel, Ultrascientific, North Kingstown, RI; and PCB 198, AccuStandard, New Haven, CT, USA) were added to the ground sample. Samples were extracted into 400 mL Dichloromethane, (DCM) (Pesticide Residue Analysis Grade, Fisher Scientific, Pittsburgh, PA, USA) for 24 h in a Soxhlet apparatus (Organomation, Berlin, MA, USA) over an 80 °C water bath and the extract concentrated to ca. 10 mL on removal. Extracted samples were passed over a florisil/aluminum oxide/silica gel column (10/10/20 g) to remove bulk polar internal interfering compounds. Column-cleaned, extracted samples were concentrated with a Zymark Turbovap, (Hopkinton, MA, USA) using nitrogen flow and then brought to exactly 5 mL volume with DCM.
Lipid concentration was estimated by dry weight of a subsample of the concentrated extracts. Liquid chromatography (LC) internal standards (1,2,3-Trichlorobenzene, Sigma-Aldrich, St. Louis, MO and PCB-192, AccuStandard, New Haven, CT, USA) were added to another subsample of the extracts, based on lipid concentration, and brought to 5 mL. Additional interfering substances were removed by semi-preparative HPLC (Hewlett Packard 1050, Palo Alto, CA, USA, λ-254 nm) on a size exclusion 600 × 21.2 mm: Phenogel 10, 100 Å, 10 μm column (Phenomonex, Torrance, CA, USA), preceded by a 50 × 7.8 mm: Phenogel 10 μm guard column. A calibration solution was made up of 4,4’-Dibromooctafluorobiphenyl, Biphenyl and Perylene. Appropriate fraction cuts were taken at calibrated intervals, exchanged into hexane, concentrated using the Zymark Turbovap and then brought to exactly 5 mL.
Samples were screened for contaminant levels using an Agilent 5890 (Santa Clara, CA, USA) Gas Chromatograph (GC) with an electron capture detector (ECD). Based on the screening levels, final dilutions or concentrations were established. Internal surrogate GC standards of 2,4,5-Tetrachloro-m-xylene (Sigma Aldrich, St. Louis, MO, USA), PCB-103, 3,3’,4,4’-Tetrabromobiphenyl, and Octachloronapthalene (AccuStandard, New Haven, CT, USA) were added to each extract. Final extracts with internal standards were analyzed on an Agilent 5890 GC with ECD after 1 µL injection with an Agilent 7673 auto-sampler. The sample was injected in the splitless injection mode into a fused-silica capillary guard column (10 m × 0.25 mm ID) concatenated into a fused-silica capillary column (DB-5 60 m × 0.25 mm ID, 0.25 µm film thickness). The GC column was heated from 50 °C to 155 °C at 5 °C/min, 155 °C to 215 °C at 1 °C/min, 210 °C to 315 °C at 4 °C/min and held at 315 °C for 16.75 min. Hydrogen served as carrier gas with nitrogen as the make-up gas. The carrier gas pressure was held for 1 min at 19.4 psi. It was then programmed to 23.2 psi at 0.17 psi/min, to 25.3 psi at 0.04 psi/min, and then to 29.3 psi for 0.15 psi/min where it was held for 17 min. The injector temperature was 280 °C and the detector temperature was 320 °C.
The primary calibration solution contained a mixture of the PCB Calibration Check Solution C-CCSEC (20 PCB congeners, AccuStandard, New Haven, CT, USA) and chlorinated pesticides in National Institute of Standards (NIST) Standard Reference Material (SRM) 2261 (15 chlorinated pesticides) [20]. The secondary calibration solution contained a mixture of eleven PCB congeners in NIST SRM 2274 [21], eight chlorinated pesticides in NIST SRM 2275 [22], and three individual PCB congeners 87, 132, and 201 (AccuStandard, New Haven, CT, USA). Target analyte peaks were quantified with the internal standard method using the HP 3365 Series II ChemStation Software (Version A.03.34).
Calibration solutions (primary and secondary) were run after every four samples. Eight coeluting compounds, PCB 77, PCB 101, PCB 110, PCB 169, p,p’-DDD, α-BHC, mirex, and dieldrin, were omitted from the interpretation of the chemical profiles. PCB nomenclature follows Ballschmiter and Zell [23]. Total PCB concentration was reported as the sum of concentration of 26 individual PCB congeners analyzed in this study. Aroclor-equivalent PCB concentrations were generated by summing the concentrations of PCB congeners 18, 28, 44, 52, 66, 105, 118, 128, 138, 153, 170, 180, 187, 195, 206, and 209; and then doubling this sum [24]. Total DDTs were calculated as the sum of concentrations of DDTs and metabolites: Dichlorodiphenyldichloroethane and Dichlorodiphenyldichloroethylene (DDD and DDE). Total chlordanes were calculated as the sum of concentrations of α-chlordane, γ-chlordane and τ-nonachlor. Concentrations of all analytes are expressed as ng/g wet weight. Method detection limits (MDL) for PCBs range from 1.1 to 3.1 ng/g (ppb), and pesticides range from 1.1 to 3.2 ng/g (ppb) [12].
The MS internal standards, CRM, and the method blank served as quality assurance checks. In all cases, the blank had no measurable level of analytes detected. Internal method standards were recovered from all samples. The MS internal standard recoveries were as follows: 4,4’-dibromooctafluorobiphenyl (34% + /− 9), Ronnel (14% +/− 19) and PCB 198 (106% +/− 30). Ronnel is a synthetic organic thiophosphate compound. Gehrt [25] reported that the low recoveries of ronnel could likely occur because of degradation. Low recoveries of DOB have also been reported in an avian egg study [26]. The LC internal standard recoveries were: 1,2,3-Trichlorobenzene (80% +/− 14) and PCB-192 (95% +/− 16). Recoveries of analytes from the CRM CARP-2 (Appendix A, Table A1) ranged from 40 to 79% and are in line with previous recoveries based on these methods [12].

2.3. Statistical Analysis

A suite of univariate and multivariate statistical techniques was utilized to calculate differences in biometrics, chemical contaminants, and chemical assemblages between sampling locations. Significant differences in mean fish length, weight, condition, and PCB and pesticide concentrations between locations were tested with the two-tailed independent Student’s t-test following Levene’s test for equality of variance at an alpha of 0.05. Samples with unequal variance were evaluated under increased stringency of the t-test with reduced degrees of freedom. Univariate statistics were performed using IBM SPSS (package v25.0.0, Armonk, NY, USA).
To assess the relationship between PCB congeners and sample locations we employed an ordination technique known as principal component analysis (PCA). PCA reduces the number of original variables in a dataset into a smaller set of composite components by maximizing the variation among samples along their axes [27]. Thus, principal component 1 (PC1) explains the most variance in the dataset, principal component 2 (PC2), the second largest amount of variance, and so forth. The “loading” of a variable (in this case a PCB congener) describes how much it contributes to a given principal component. To perform the PCA the data were arranged in a variable-by-sample matrix, where the variables were the individual PCB congeners and normalized concentrations represented the value fields. The concentrations were normalized by dividing an individual congener concentration by the sum of the concentrations of all congeners within the sample. The PCA was conducted in R [28] and visualization was created using the “factoextra” package [29].

2.4. RNA Extraction of Liver Tissue

Genomic analyses were performed on pooled liver samples of the sub-population at each site as the SSH subtraction method was used to compare the transcriptome of one habitat versus another. As such, this study consists of one biological replicate of the transcriptomic and quantitative PCR analyses and results must be considered as preliminary. Pooling individuals can incorporate a larger range of variations in the samples while reducing costs but can lead to bias in the libraries, particularly of certain genes; therefore, alternate methods of gene expression such as quantitative polymerase chain reaction (qPCR) can be used as a check on expression [30]. Fish for genetic analysis, 11 from each site, were partially thawed and the liver dissected out on ice. A 0.25 g subsample of each liver was taken for pooled RNA extraction and stored on dry ice. Liver tissue was homogenized on ice using a Brinkman Polytron (Kinematics, AG, Lucerne, Switzerland) and extracted using the guanidine thiocyanate method with an RNAgents total RNA Isolation System (Promega, Madison, WI, USA) per standard protocol. Total RNA for each site was resuspended in nuclease-free water and quantified by Ultraviolet (UV) spectroscopy at A260 using an extinction coefficient of 40 ug/mL/A260. RNA integrity was ascertained using a BIO-Rad (Hercules, CA, USA) Experion Bioanalyzer with Experion RNA Analysis kits (chips and standards). Messenger RNA (mRNA) was purified by a streptavidin affinity magnetic separation from the total RNA using a PolyATract mRNA Isolation System (Promega, Madison, WI, USA). Isolated mRNA, eluted in nuclease-free water, was concentrated by precipitation in ethanol, resuspended in nuclease-free water and quantified by UV spectroscopy. A final precipitation, quantification by UV spectrophotometry and adjustment to concentration of 0.5 µg/µL for library construction was necessary. Total RNA and mRNA were extracted, stored at −80 °C and used within four months of fish capture. RNA for qPCR was used within two years.

2.5. Suppression Subtractive Hybridization (SSH) Libraries

SSH libraries, forward- and reverse-selected, were constructed using Clontech PCR-Selecttm cDNA (copy DNA) library construction kits (BD Biosciences, Palo Alto, CA, USA) following the manufacturer’s protocol [31]. An amount of 2 μg of mRNA was used for each first-strand synthesis. Following second-strand synthesis, the cDNA was digested with RsaI and one aliquot was ligated to Adaptor 1, another to Adaptor 2R, and the remaining used as drivers in the hybridization reaction. The forward library was selected by hybridizing adaptor-ligated cDNA from the more highly anthropogenically impacted HRE fish as the tester in the presence of cDNA from the less impacted MRGB control as the driver. The forward reaction was designed to yield clones that were more highly expressed or up-regulated in the chemically impacted fish. The reverse library used the adaptor-ligated cDNA from the control (MRGB fish) as the tester and the impacted (HRE fish) cDNA as the driver. This reverse library was designed to recover clones that are under-expressed or down-regulated in the impacted fish versus the controls. The driver cDNA was added in each case to remove common cDNAs by hybrid selection, leaving the respective unique tester cDNAs for recovery and cloning. The differentially expressed cDNAs were amplified by PCR with AdvantageR 2 polymerase mix (BD Biosciences, Palo Alto, CA, USA). Primary and secondary amplification of the reciprocal cDNA subtractions produced two SSH libraries (up- and down-regulated with anthropogenic impact) that were enriched for putative differentially expressed cDNAs. The libraries were cloned using a pGEM Easy T/A cloning vectors kit with JM108 competent E. coli (Promega, Madison, WI, USA). Transformants were plated on Luria–Bertani (LB) agar with ampicillin (100 μg/mL), 5-bromo-4-chloro-3-indolyl-β-D-galactopyranoside (X-gal) (0.5 mM) and Isopropyl β-D-1-thiogalactopyranoside (IPTG) (80 μg/mL), and white colonies were selected for overnight growth in LB broth with ampicillin (50 μg/mL). DNA plasmids were prepared with a Wizards Miniprep kit (Promega, Madison, WI, USA). Plasmid DNA was quantified by UV spectrophotometry at A260 using an extinction coefficient of 50 μg/mL/A260.

2.6. Sanger Sequencing

Plasmid double-stranded DNA template (50–100 fmoles or ~120 ng) was preheated at 94 C for 1 min and cycle sequenced in a CEQTMDCTS Quick Start PCR dye-termination reaction (Beckman Coulter, Fullerton, CA, USA) with 10 pmoles of T-7 or Sp6 sequencing primer (Promega, Madison, WI, USA). Sequence reactions were purified by ethanol precipitation in the presence of glycogen (0.8 μg/μL), 0.24 M sodium acetate (pH 5.2), and 8 mM of Na2-EDTA, washed in 70% ethanol, and dried and resuspended in deionized formamide as per the DCTS kit protocol (Beckman, Fullerton, CA, USA). DNA sequencing was performed on a Beckman Coulter CEQ 8000 using the CEQ LFR-1, long fast read, protocol (Beckman, Fullerton, CA, USA). One hundred and sixty clones were prepped and sequenced. Sequence data were analyzed with Invitrogen Vector NTI (Thermo-Fisher, Waltham, MA, USA) and trimmed to remove vector sequence. Putative transcript identifications were made using BLAST-X web resources [32] of the National Center for Biotechnology Information (NCBI) at the National Institutes of Health (NIH).

2.7. Gene Expression by Quantitative Polymerase Chain Reaction (qPCR)

To further investigate gene expressions, a relative reverse transcription (RT) qPCR method was used to compare the expression of selected transcripts from each of the contrasting sites [33]. Primers for PCR were designed from sequences of seven clones from the up-regulated contamination library using Vector NTi (Thermo-Fisher, Waltham MA, USA). Primers were synthesized by IDT (Coralville, IA) and tested by PCR of the respective plasmid clones to ensure specificity and production of a single product (dissociation curve analysis). Total RNA (5 μg/reaction), as extracted from each sample set, was reverse-transcribed with an Invitrogen Superscript II first strand synthesis kit (Thermo-Fisher, Carlsbad, CA, USA) using the kit’s polyT primer to produce cDNA first strand template for qPCR. A total of five RT reactions for each sample site, HRE and MRGB, were prepared and combined within site to provide adequate template for qPCR comparison. For each gene primer set, serial dilutions (1:10×, 1:100×, 1:1000×) of the template expected to have a higher target concentration were used to generate a standard dilution curve [33]. Standard dilutions and 1× samples (~240 ng) were cycled in triplicate (technical replicates) in a 25 μL reaction with a Stratagene Brilliant SYBRR Green qPCR master mix (Agilent, La Jolla, CA, USA) with 0.3 μM of each gene-specific primer in the presence of fluorescent, DNA binding dye SYBR Green and the reference dye ROX. An ABI 7500 Real Time PCR System (Thermo-Fisher, Waltham, MA, USA) was used to cycle the reaction using 1 cycle of 15 min. at 95 °C followed by 40 cycles of 94 °C for 40 s., 55 °C for 40 s. and 72 °C for 1 min. A no-template blank was included in each experiment. Triplicate fluorescence measurements were collected during the 72 °C step. A dissociation curve was generated for each amplification run with 15 s at 95 °C and 15 s at 60 °C followed by a 20 min ramp from 60 °C to 95 °C. Fluorescence was analyzed with the ABI 7500 Sequence Detection Software, SDS v1.2, (Thermo-Fisher, Waltham, MA, USA) as delta Rn vs. cycle, normalized to the reference dye (ROX), to generate crossing temperature Ct with a threshold value of 0.009. The mean Ct value of triplicate reference samples was plotted against the log10 of microliter template dilution (0, −1, −2, −3) to produce a straight line. The equation derived from the standard curve data was used to convert the sample Ct values to the exponent (base 10) of the equivalent microliter template volume of the tested sample, and solving the exponential equation gives the equivalent microliter template volume of the tested sample. The fold induction or inhibition was calculated by dividing the 1× volume of sample (1 μL) by the equivalent microliter template volume [33]. No endogenous control for the bluefish was available at the time, so these fold inductions are not normalized (for potential variation in the efficiency of the RT reactions) and can only be interpreted as relative differences between the sites for the purpose of supporting the subtractive library method.

3. Results

3.1. Bluefish Sites and Condition

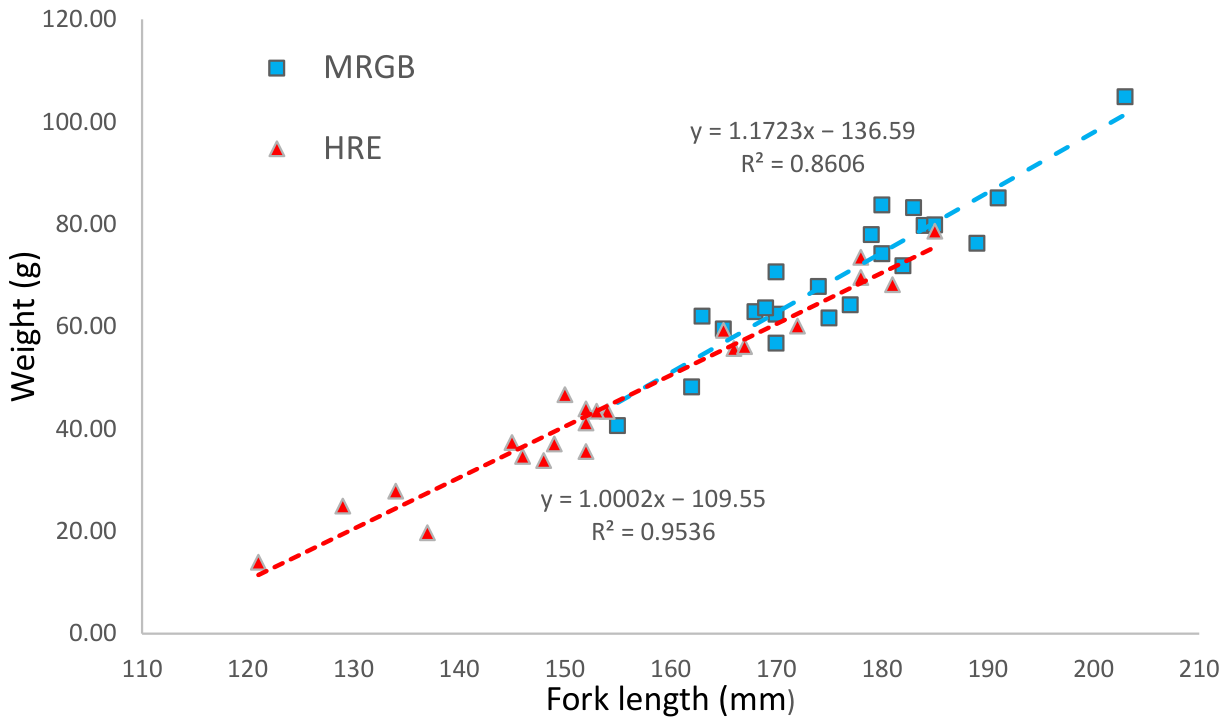
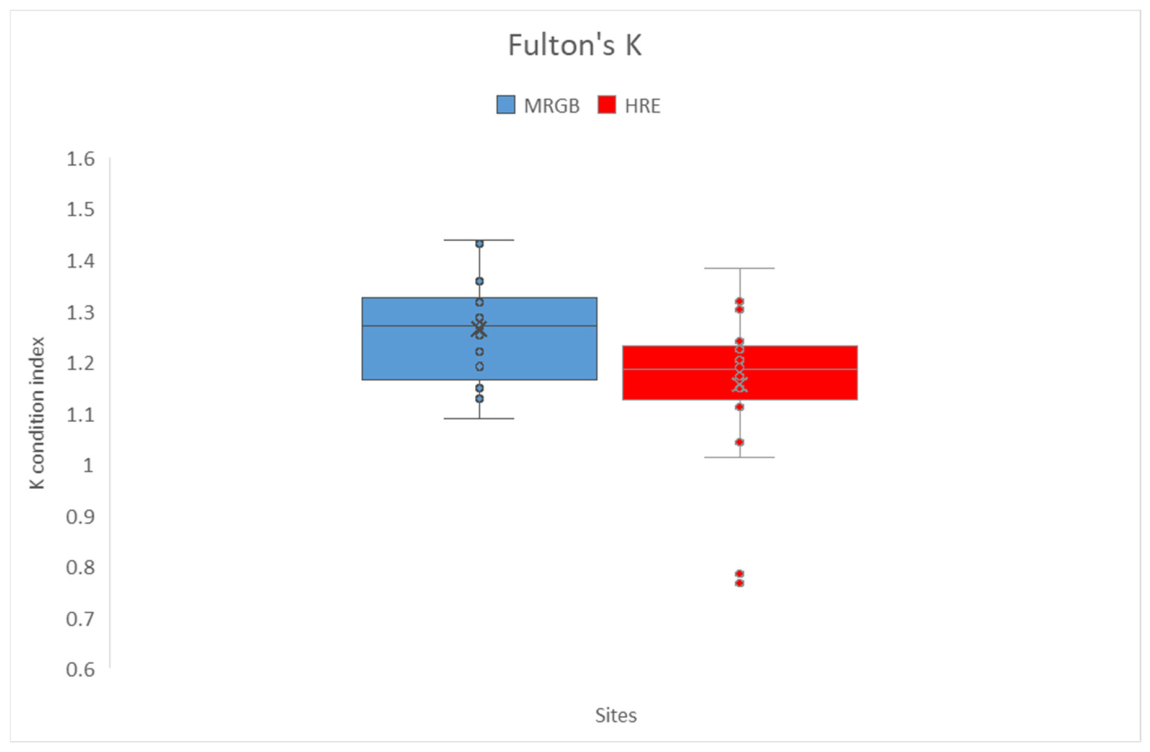
Juvenile bluefish (YOY) from the highly urbanized HRE were typically smaller in length and weight than fish from the less impacted MRGB, and mean weights for MRGB fish were significantly higher than HRE fish, as were mean fork lengths (Table 1). Fish from both sites showed a strong linear relationship between length and weight (Figure 1). Fulton’s condition index was significantly different between sites, with a wider distribution of fish in HRE exhibiting less optimal condition (Figure 2).

3.2. Polychlorobiphenyl (PCB) Analysis

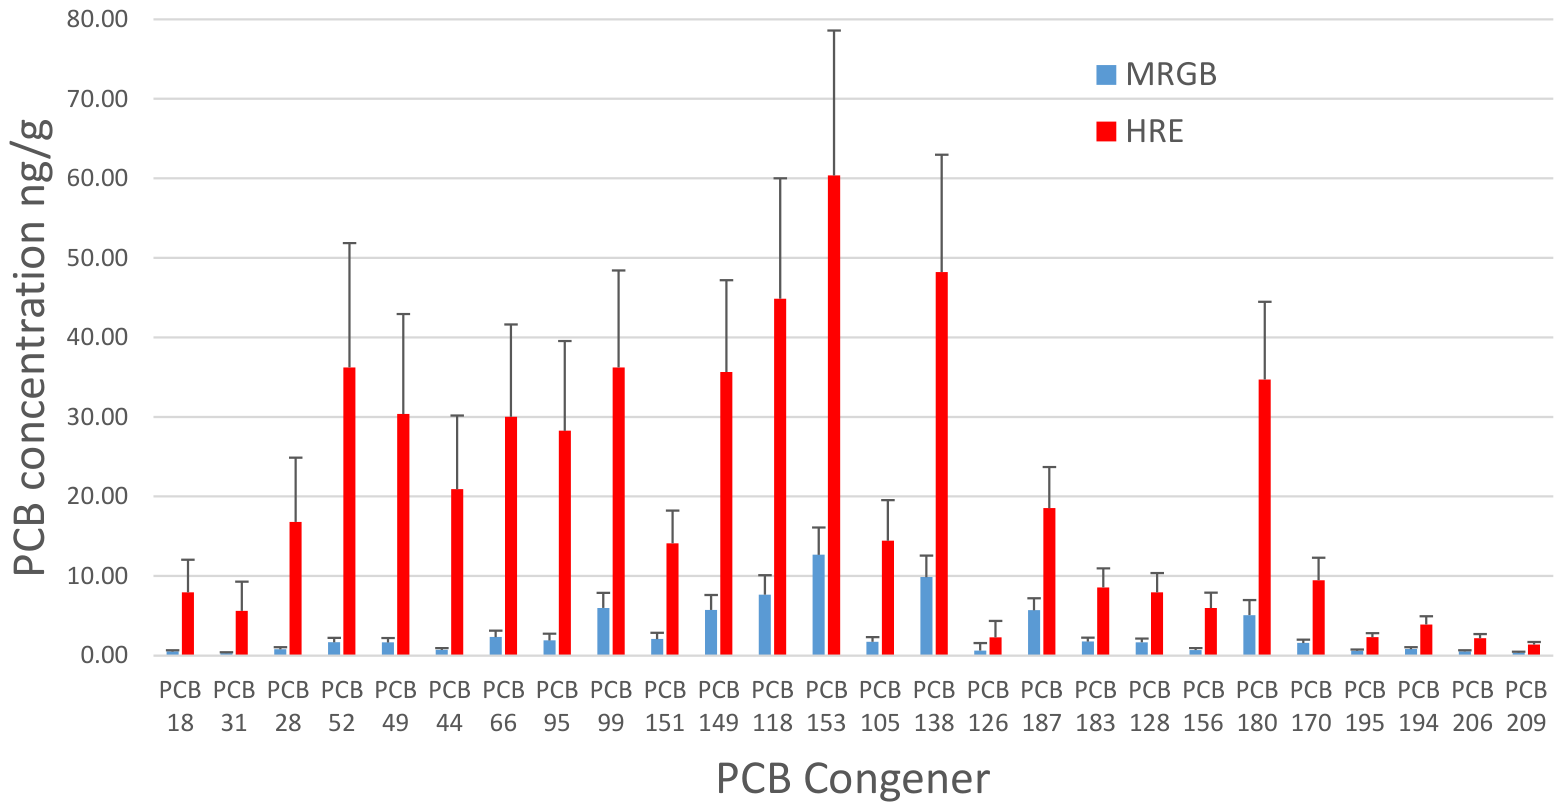
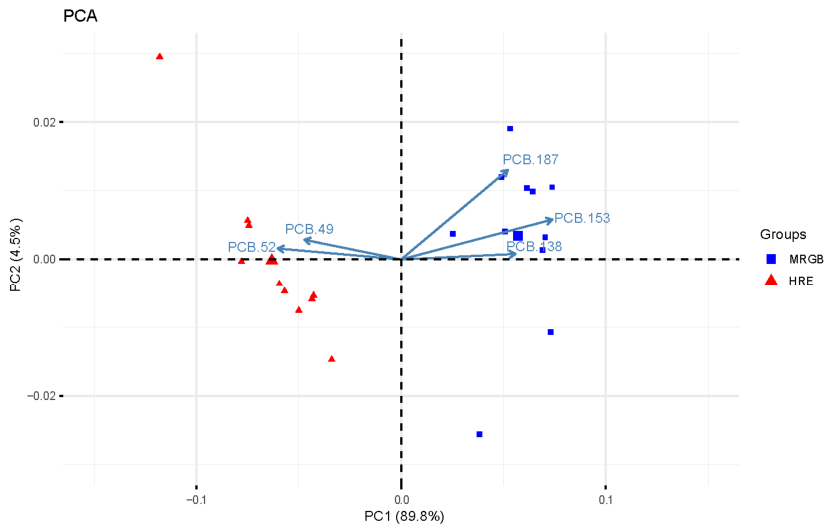
Twenty-six PCB congeners were detected in all samples of bluefish. The mean concentration for each of the PCB congeners separated was significantly higher (t-test, n = 11, α = 0.05) at HRE than MRGB (Figure 3). The sums of PCB concentrations (sum total and sum of Aroclors) at the HRE site were approximately seven times those seen at MRGB (Table 2). While individual congeners and concentrations varied by site, they represent a clear chemical fingerprint of the respective estuaries (Figure 3). Principal component analysis of the PCB congener data revealed two distinct sample groups (Figure 4). The first principal component (PC1) accounted for almost 90% of the variance between the samples.
Samples from MRGB were found on the positive side of the axis while samples from HRE grouped on the negative side of the axis. The second principal component (PC2) accounted for an additional 4.5% of the variance within the dataset. Five PCB congeners had PCA loadings that contributed greater than 0.3 to PC1: PCB 153 (0.48), PCB 138 (0.36), PCB 187 (0.34), PCB 52 (−0.39), and PCB 49 (−0.31) (See Appendix A, Table A2 for all loading scores). Since individual fish were randomly assigned to organic analysis and to genetic analysis groups per site, these results provide confidence that the fish analyzed for gene expression were similarly contaminated with the levels and chemical species observed.

3.3. Pesticide Analysis

Eighteen organochlorine pesticides were resolved in each of the bluefish samples. Overall, pesticide concentrations were higher in the HRE fish than in the MRGB fish (Table 3). In particular, the persistent organochlorine pesticide DDT (dichlorodiphenyltrichloroethane) and its breakdown products DDE (Dichlorodiphenyldichloroethylene) and DDD (dichlorodiphenyldichloroethane) were six times the total concentration (sum of DDTs) in HRE compared to MRGB. Other organochlorines, HCB (hexachlorobenzene), β-BHC (β-Hexachlorocyclohexane), heptachlor, heptachlor epoxide, oxychlordane, γ-chlordane, α-chlordane, τ-nonachlor, endrin, and endosulfan sulfate, were significantly elevated in HRE fish over MRGB fish, while lindane, aldrin, and Endosulfan II were not significantly different between sites. Total chlordane concentrations (sum of α-chlordane, γ-chlordane and τ-nonachlor) were approximately nine times higher in HRE fish than MRGB fish. These chemical analyses support the level of anthropogenic impact within each of the contrasting survey areas but are by no means the only contaminants in the environment that could potentially be affecting bluefish growth and development.

3.4. Suppression Subtraction Hybridization (SSH) Libraries

The SSH up-regulated library yielded 139 clones, of which 92 unique sequences were identified by Blast search of the DNA sequences from the library (Table 4). The SSH down-regulated library yielded 138 clones, and 23 unique sequences were identified (Table 5). The 115 unique up- and down-regulated sequences have been archived at NCBI under GenBank accession #s DY223197-DY223312. It is not known if the down-regulated library construction was less efficient or indicates that there were in fact less down-regulated genes than up-regulated genes. For both, there appears to be a mix of gene transcripts that are putatively differentially expressed across functional systems of the fish, including the immune system, environmental response, metabolism, signaling, transport and tissue proteins and ribosomal proteins.

3.5. Quantitative Polymerase Chain Reaction (qPCR)

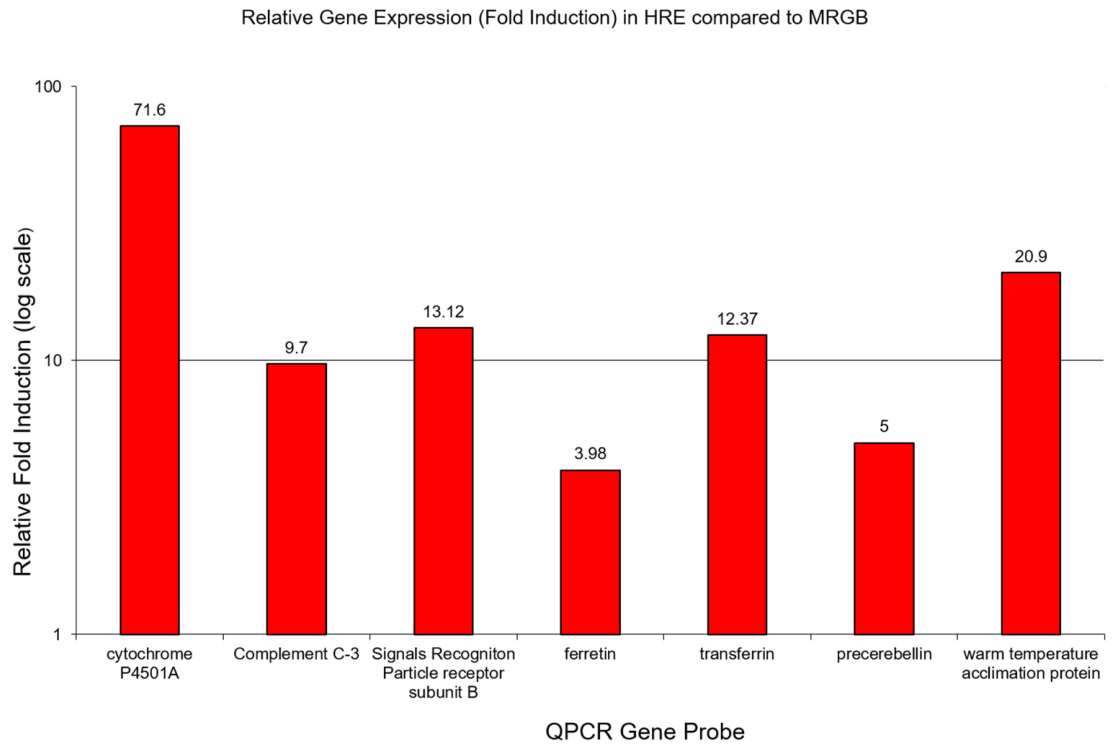
Seven putative up-regulated genes were selected for qPCR analysis. Test genes were selected as relevant targets for hepatic genes from a variety of metabolic systems. Gene-specific forward and reverse primers were designed and tested (Table 6). Each primer set was specific and produced a single product when tested with the respective plasmid DNA clone. The standard curve method of relative quantification was employed [33] with the HRE, or high-anthropogenic-impact samples, diluted (1×, 0.1×, 0.01×, 0.001×) for the standard curve and compared to MRGB controls or less impacted samples as calibrators (1x). Each of the seven gene-specific primer pairs showed a higher expression level in the high-anthropogenic-impact HRE fish versus the MRGB (Figure 5). Cytochrome P-450 1A was the most highly differentially expressed of the seven clones at nearly 72-fold relative increase. Acute phase response (APR)-related transcripts, complement component C-3, ferritin, transferrin and precerebellin all were 4 to 10 times relative induction of expression with more highly anthropogenically impacted fish versus less impacted controls. Warm temperature acclimation protein (Wap65-1) is increased 21 times and signals recognition particle receptor subunit B is increased 13 times with higher anthropogenic impact relative to less impacted control fish. Each of these gene clones, isolated from the up-regulated with contamination ibrary, supports the directional effectiveness of the SSH differential selection but, like the SSH library, are representative of only one biological replicate, so no statistical confidence can be attached to the magnitude.

4. Discussion

Degraded habitat, as evidenced by the elevated legacy contaminant levels in fish from the HRE are likely impacting the overall fitness of YOY bluefish using that habitat as a first-year nursery. Juvenile bluefish (YOY) from the HRE were significantly smaller and lighter, and had a lower Fulton’s condition index and a higher body burden of total PCBs and pesticides than the same spawning cohort found in the MRGB. An earlier laboratory study found that bluefish fed a diet of common prey (menhaden, mummichog, killifish) from contaminated habitats in the HRE for four months showed bioaccumulation of contaminants (PCBs and pesticides) and displayed significantly reduced feeding behaviors, swimming activity, and growth compared to controls fed with prey from uncontaminated sites in the MRGB [34]. Disruption of behaviors such as feeding, predator avoidance, and reproduction with increased contamination has been documented in a number of taxa [35,36] and while certain taxa may ameliorate or avoid effects of contamination through behavior, feeding modifications, and accelerated depuration, the higher trophic levels such as predatory fishes with more advanced neuroendocrine systems may be more likely affected in growth and ultimately survivorship [37].
As confirmed in this study, HRE environments have been extensively documented to be highly contaminated with PCBs and pesticides, as well as heavy metals and PAH [38]. Many of these substances have been shown to bio-magnify up the food web [37], and there have been significant fishery restrictions in the HRE system due to concern over risks to human health. In addition to total PCBs, the total congener-normalized fingerprint of PCBs was distinctive at each site, as confirmed by principal component analysis in this study and as seen by Smalling et al. [11] in Sandy Hook Bay (HRE) and Great Bay (MRGB). Chemical fingerprints are a well-established method of relating specific contamination of sites with fish body burden such as with PAH [39]. As previously noted by Deshpande et al. [9], specific PCB congener fingerprints indicate site-specific fidelity of YOY bluefish to specific estuaries where they feed and rapidly grow through their initial year(s) before undertaking adult migrations throughout the range.
Exposure to persistent organochlorinated pesticides, including many of those surveyed in this study, have also been shown to affect growth and reproductive success. These pesticides accumulate in tissues with high lipid content and can potentially affect many cellular processes, including disruption of hormones, enzymes, growth factors and neurotransmitters, and induce many metabolic pathways leading to dysregulation, contributing to the development of tumor growth [40,41]. Chronic exposure to DDT and its metabolites has been shown to disrupt estrogen activity in reproductive tissue, leading to decreased reproductive success, induce microsomal liver detoxification genes for cytochrome P450s, disrupt lipid and sugar metabolism, and promote neoplasia/carcinogenesis in some tissues [42,43,44]. Exposure of YOY bluefish to these contaminants may have significant effects on the success of year-class growth and recruitment into the fishery.
Investigation of gene expression in the liver of bluefish was undertaken in this study as the liver serves an important role in vertebrates as a site of chemical detoxification as well as a site of synthesis and degradation for many important cell constituents, including carbohydrates, fats, proteins and hormones. These and other key processes of the liver have been shown to be affected by chemical contamination [17,45]. Liver hepatocytes synthesize plasma proteins for transport, as well as oxidize triglycerides, synthesize amino acids, deaminate and transaminate amino acids, and remove toxic ammonia from protein metabolism and bilirubin from hemoglobin breakdown. The Phase I oxidation systems of the liver, including the cytochrome P450 superfamily (CYP), are induced by a wide range of alkyl and aromatic hydrocarbons, including co-planar PCBs (such as PCB 126) and DDT, either through the Aryl hydrocarbon receptor-2 (AHR2) or other receptors [46], and along with Phase II enzymes (glutathione transferase, etc.), which have served as enzymatic biomarkers of chemical contamination. As part of the detoxification role of the liver, Phase-I enzymes oxidize chemical substrates to increase their polarity. In some cases, this increases the toxicity of the chemical and may lead to increased damage of the liver [47].
In this study, metabolic protein transcripts observed that were putatively up-regulated with anthropogenic impact included the enzyme systems associated with Phase I and Phase II liver detoxification pathways. This finding was expected as Phase I involves oxidative enzyme metabolism of xenobiotics including PCBs, PAH, aromatic amines, heterocyclic amines, pesticides, herbicides, and most compounds used for drugs [48]. Although these other xenobiotic categories were not quantified in this study, the HRE is undoubtedly contaminated with many of these compounds as well as heavy metals [5]. Phase I transcripts for cyp1, cyp1A1, cyp2N, cyp2A10 and mitochondrial amidoxime-reducing component-1 (marc1) were observed in those putatively up-regulated with the anthropogenic impact library in this study. Phase II metabolism involves enzymatic conjugation to the reactive site of phase I metabolites, generally resulting in a more water-soluble compound that can be further metabolized or eliminated. Phase II-related, putative up-regulatedtranscripts with anthropogenic impact observed in this study include glutathione-S-transferases (gst) and thioredoxin (trx). Up-regulation of these phases I and II transcripts in the HRE are consistent with the increased impact of anthropogenic contaminants. Other important liver detoxification enzymes seen to be up-regulated were alcohol dehydrogenase (adh) and aldehyde dehydrogenase (aldh). Additional metabolic-related transcripts observed to be putatively up-regulated in the more anthropogenically impacted environment may be involved in pathways related to the energy metabolism of lipids, carbohydrates and proteins involved in the condition of the fish related to feeding depression documented with contamination [34]. Potentially related to fish condition as well, genes observed to be down-regulated in the more impacted environment included metabolic genes involved with general oxidative phosphorylation/energy production such as ATP synthase F0 subunit 6 (mt-atp6), NADH dehydrogenase (mt-nd1) and cytochrome c oxidase subunit 1 (mt-co1). In a transcriptome study of the Atlantic Killifish (Fundulus heteroclitus) populations from several superfund and reference sites, Oleksiak [49] found that Newark Bay, NJ in the HRE had more differentially expressed genes than other superfund sites, and that a large number of these were related to metabolism and “suggests that pollution may have a significant effect on energy metabolism in these fish” [49].
The liver is also the source of many circulating immune-related proteins. Immune-related proteins with up-regulated transcripts with anthropogenic impact that were observed included complement component-3 (C3), precerebellin-1-like C1q (cbln1), and microfibril associated glycoprotein (mfap4), which are associated with the innate immune complement system and acute phase response (APR) to inflammation and infection. Cbln1 has been shown to be part of the APR in rainbow trout challenged with bacterial infection [50]. Tapasin associated glycoprotein (flnb) was also observed as up-regulated and is part of the antibody-acquired immune system acting to mediate antigen processing and display [51]. A down-regulated immune-related transcript for leucocyte cell-derived chemotaxin-2 (lect2) was observed. Lect2 is related to cytokine-induced immune activity, including phagocytosis and bacterial activity of white blood cells [52].
Environmental response protein transcripts observed to be up-regulated in the liver with anthropogenic impact were warm temperature acclimation protein 65-1 (wap65-1), type 2-ice structuring protein (isp2) and antifreeze polypeptide precursor (afp). Wap65-1 is a hemopexin-like protein that may be involved in scavenging heme and protection under warm conditions or bacterial infection [53,54]. The function of expression of isp2 and afp, both of which contribute to low temperature survival in the blood of fish, is not known to be related to contamination but may play some protective role. A down-regulated, with contamination, transcript for type-4-ice structuring protein (isp-ls-12) was also observed.
Ribosomal proteins (Rp) levels have generally been considered to be relatively constant but recent work has shown that differential expression of Rps is correlated to the proliferative state of cells and may indicate underlying pathologies linked to nucleolar stress responses, such as P53 activation, and cancer risk [55,56]. Five up-regulated rps transcripts, S2, S3, S6, S7, and 28S, and five down-regulated rps, L3, L15, S4, S6 and S9, were observed.
Transport and tissue protein transcripts that were up-regulated in the liver in the more anthropogenically impacted environment included a number related to iron and heme metabolism and transport such as ferritin (ft1), transferrin (tfr1), hemoglobin A (hba), haptoglobin (hpt), hephaestin-like protein (hpl1) and hemopexin (hpx). Also present in the up-regulated library were the glycoproteins, vitronectin (vtnc), apolipoprotein-A1 (apoa1), and alpha-2-macroglobulin (a2mg); the serine proteases, alpha-1-antitrypsin (serpina1), and fetuin-b (fetub); and coagulation factors, plasminogen (plg), fibrinogen (fgb), kininogen (kng1), and vitamin K-dependent Protein C (proc). Chronic inflammation of the liver and APR to infection have been shown to affect iron homeostasis and a large number of APR-related liver proteins [57]. Transport/tissue proteins in the down-regulated library included fibrinogen gamma chain (fgg), hemoglobin subunit beta2 (hbb), and hemoglobin subunit alpha (hba) which is also identified in the up-regulated library but is a different unique sequence and may be an alternative splice variant.
Signal proteins observed in the liver to be up-regulated with anthropogenic impact libraries included angiotensinogen (agt), which is produced in the liver in response to low blood pressure. When agt is activated by the enzymes Renin and Angiotensin converting enzyme (ACE), the product, Angiotensin, causes constriction of smooth muscle and increased blood pressure. Potential mis-regulation of angiotensinogen could contribute to stress-related hypertension, cardiac issues and issues with ionic and osmotic balance [58]. Signal recognition particle receptor subunit beta (srpb) is a ribonucleoprotein GTPase that binds signal recognition particle (SRP) to target nascent secretory particles to the Endoplasmic reticulum, and signal peptidase complex catalytic subunit (sec11A) removes the signal peptide upon translocation into the lumen of the ER. Up-regulation of these proteins with anthropogenic impact may signal increased secretory protein metabolism related to inflammation. Other putative up-regulated-with-anthropogenic-impact transcripts involved protein synthesis, processing and targeting, including translation initiation factor (eif2b4), elongation factor-1-alpha (eef1a1), eukaryotic translation initiation factor-3 (eif3c), pre-mRNA 3’-end processing factor (f1p1), and dnaJ homolog (dnajc11). Putative down-regulated transcripts involved in signaling included pigment epithelium-derived factor (serpinf1), mid-1-interacting protein 1-B (mid1ip1) and translation initiation factor IF-2 like (if2m). Serpinf1 is a serine protease inhibitor involved in inhibiting angiogenesis through inhibition of VEGF (Vascular epidermal growth factor) and is related to wound healing as well as to the onset of age-related macular degeneration.
Experimental exposure to individual and mixed POPs such as PCBs has been shown to differentially affect gene expression in a number of fish taxa. Agrawal et al. [59] exposed zebrafish and medaka to PCB 126 (a co-planar PCB) [59]. One of the nine candidate biomarkers of PCB 126 exposure observed was cyp1a, which was also isolated in bluefish as an EST in this study. Exposure of Atlantic cod (Gadus morhua) to PCB 153 (a non-co-planar PCB) had effects on transcripts for lipid metabolism, cell cycle, tissue remodeling and wound repair, immune response, stress response, apoptosis and various signaling pathways of the liver transcriptome by microarray [60]. Breese et al. also showed significant effects on the transcriptome with single and PCB mixtures and found that PCB metabolites (produced in part by liver detoxification pathways), in many cases, had a larger effect on developing zebrafish than parent compounds [61]. In a transcriptomic study of hornyhead turbot (Pleuronichthys verticalis) dosed with PCBs and PBDE, transcripts related to immune response, lipid metabolism, xenobiotics and endocrine disruption were observed relating to each of the chemical species [62]. To approach realistic contaminant-loading in the wild, Vogs et al. [63] modeled Baltic Sea salmon exposure utilizing chemical profiles from salmon serum (including nine organohalogen mixtures of PCB, PFAS and DDT metabolites) in a zebrafish embryo RNA sequencing transcriptomic study. Thirteen transcripts isolated in this study correspond to homologs co-expressed under the various treatments in the Vogs study [63], including: cyp1a1, gsto1, gstp1, hpx, aldh1, cyp2, apob, dnajb1, gstp1, serpina1, lect2, pdia, and tubb4a.
In general, interruption of metabolic function by interference of xenobiotics can lead to effects on growth and development that can limit the success of larval fishes [64]. Reid and Whitehead [65] reviewed the applications of functional genomics as biosensors in the assessment of biological responses to marine pollution in fishes, concluding that modern genomics-based tools such as transcriptomics and proteomics offer high-throughput and information-rich methods for the characterization of molecular mechanisms by which pollutants exert toxic effects and for the estimation of pollutant impacts in the short and long term. Genomics data can also offer insight into evolutionary adaptations in polluted environments that allows the potential for population survival. For example, Wirgin et al. [66] reported that the resistance of Microgadus tomcod (tomcod) populations in the HRE to high PCB levels was related to variation in the AHR2, pointing to rapid evolutionary change due to selection at a single locus in contaminated environments. There is also extensive evidence for evolutionary adaptation in the estuarine resident Fundulus heteroclitus, which is linked with repeated exposure, high nucleotide diversity, functional divergence of gene expression and in the case of PCB and PAH exposure with changes in the sensitivity of the AHR2 signaling pathways [67].
This functional genomic study observed preliminary effects on gene expression, as determined by SSH enrichment, in the liver of bluefish from contrasting habitats with increased anthropogenic impact. SSH is useful for enriching transcripts from non-model organisms where no reference genome is available but lacks the statistical power of RNA-sequencing. Availability of these EST transcripts can also contribute to the development of environmental RNA-Sequencing and Next Gen sequencing technologies [68] for interrogating the bluefish transcriptome in further studies. Recent studies of fish populations related to pollutants [59] indicate the increased power of these RNA sequencing methods to interrogate the transcriptome over older comparative methodology such as SSH. These EST transcripts are related to important pathways of energy, transport, detoxification, immune status, stress and environmental response and signaling. While up- or down-regulation of the expression of some of these genes may be adaptive responses to habitat quality, it is likely that many may involve negative consequences to normal development, feeding, growth and survival mechanisms necessary to ensure successful recruitment into the reproducing adult population. While long-term trends in the HRE indicate that legacy contamination inputs have decreased over the past 50 years [38,69], the refractory nature and persistence of these chemicals as well as emerging classes of pollutants such as PBDE, PFAS, PPCP and microplastics may continue to exert their effects at very low concentrations by affecting physiological and developmental processes at the genomic level.


5. Conclusions

This study observed a differential effect on growth and condition and isolated a preliminary group of expressed sequence tags (EST) transcripts related to habitat quality in the liver of YOY bluefish from contrasting habitats with increased anthropogenic impact. Habitat degradation, documented in part with elevated contaminant levels measured in the HRE fish, is likely impacting the overall fitness of YOY bluefish using that habitat as a first-year nursery. Juvenile bluefish from the HRE were significantly smaller and lighter, and had a poorer condition index and a higher body burden of total PCBs and pesticides than the same spawning cohort found in the MRGB. A suite of EST transcripts for liver genes related to detoxification, metabolism, transport, signaling, immune and environmental response were putatively elevated, or depressed, in the HRE compared to the MRGB. These preliminary transcript observations can be used to investigate the hypothesis that habitat contamination is contributing to observed depression of growth and development of juvenile bluefish. As such, the putative genomic biomarkers observed may contribute to further study leading to an understanding of the cumulative effects of sub-lethal exposure to a suite of anthropogenic contaminants found in industrialized estuarine systems. This study also contributes an important time point, the early 2000s, which documents transcripts and levels of many critical POPs in bluefish that have subsequently decreased over time in the HRE due to a system-wide contaminant reduction program (CARP) that has prioritized removal of contaminated sediments through dredging and superfund site designations and cleanups [69].

Author Contributions

P.F.S. and A.D.D. designed the experiments, and the work was carried out under a sabbatical for Straub in A.D.D.’s lab at NOAA Fisheries, Sandy Hook. P.F.S. was the lead on genomic analysis, and A.D.D. in chemical analysis. M.H. of Stockton served as a technician for P.F.S. and collected and processed fish samples for chemical and genomic analysis. B.W.D. of NOAA assisted with gas chromatography and analysis of PCB and pesticide concentrations. J.M.V. of NOAA was involved with statistical analysis of the data. B.W.D. passed away during the development of the manuscript, but all the authors agree that his contribution to authorship was highly significant. All authors have read and agreed to the published version of the manuscript.

Funding

This publication is the result of research sponsored by the New Jersey Sea Grant Consortium (NJSGC), with funds from the National Oceanic and Atmospheric Administration (NOAA) Office of Sea Grant, U.S. Department of Commerce, under NOAA grant number NA16RG1047 and the NJSGC. Additional support was provided by a Mt Desert Island Biological Laboratory through a New Investigator Award supported by the National Institutes of Environmental Health Science grant NIEHS P30 ESO3828-18 to the Center for Membrane Toxicity Studies, and an award to PFS from the National Research Council, Research Associate Program at NOAA Fisheries, James J Howard Laboratory. This work was also completed under a sabbatical award to PFS from Stockton University. Authors Deshpande, Dockum and Vasslides are employed by NOAA Fisheries. Straub is employed by Stockton University and Higham was a technician at Stockton University. The authors have no additional financial considerations in this work.

Data Availability Statement

All data and materials from this study are available through the corresponding author: peter.straub@stockton.edu. DNA sequence data have been deposited in the NIH/NLM/NCBI GenBank (https://www.ncbi.nlm.nih.gov/nucleotide/) accessed on 3 September 2026, under accession #s DY223197-DY223312.

Acknowledgments

This publication is the result of research sponsored by the New Jersey Sea Grant Consortium (NJSGC) with funds from the National Oceanic and Atmospheric Administration (NOAA) Office of Sea Grant, U.S. Department of Commerce, under NOAA grant number NA16RG1047 and the NJSGC. The statements, findings, conclusions, and recommendations are those of the author(s) and do not necessarily reflect the views of the NJSGC or the U.S. Department of Commerce. Publication# NJSG-26-1036.

Conflicts of Interest

The authors declare no conflicts of interest.

Abbreviations

The following abbreviations are used in this manuscript:
APRAcute phase response
AHR2Aryl hydrocarbon receptor-2
cDNACopy DNA
β-BHCβ-Hexachlorocyclohexane
CBLNPrecerebellin-1-like C1q
CRMCertified reference material
CYPCytochrome P450
DCMDichloromethane
DDDDichlorodiphenyldichloroethane
DDEDichlorodiphenyldichloroethylene
DDTDichlorodiphenyltrichloroethane
DNADeoxyribonucleic acid
ESTExpressed sequence tag
HCBHexachlorobenzene
HC/VOCHydrocarbon/Volatile organic compounds
HREHudson Raritan Estuary
IPTGβ-D-1-thiogalactopyranoside
LBLuria–Bertani broth
LCLiquid chromatography
LECT2Leucocyte cell derived chemotaxin-2
MRGBMullica River-Great Bay (Estuary)
mRNAMesenger RNA
MSMethod surrogate
NCBINational Center for Biotechnology Information (US)
NIHNational Institutes of Health (US)
NOAANational Oceanic and Atmospheric Administration (US)
PAHPolycyclic aromatic hydrocarbons
PCAPrincipal component analysis
PCBPolychlorobiphenyl
PCRPolymerase chain reaction
PDBEPolybrominated diphenyl ethers
PFASPer- and Polyfluoroalkyl Substances
POPPersistent organic pollutants
PPCPPharmaceutical and personal care products
qPCRQuantitative PCR
RNA Ribonucleic acid
RpRibosomal protein
RTReverse transcription
SRMStandard Reference Material
SSHSuppression Subtractive Hybridization
t-testStudent’s t-test
UVUltraviolet spectroscopy
XGAL5-bromo-4-chloro-3-indolyl-β-D-galactopyranoside
YOYYoung of the year

Appendix A

Table A1. CARP-2 certified reference material recovery.
AnylateCertified Value MeanCertified Value SDRecovery Value% Recoveryz-Score
PCB 1827.3411.1640.88−4.03
PCB 28347.220.7461.00−1.84
PCB 4486.625.956.4465.17−1.16
PCB 521384381.4659.03−1.32
PCB 11814833101.8468.81−1.4
PCB 12820.44.411.1654.71−2.1
PCB 1531052258.0855.31−2.13
PCB 18053.31327.251.03−2
PCB 19410.93.18.1474.680.187
PCB2064.41.13.4879.090.202
Table A2. PCA loading scores for the PCB congeners included in the analysis. PCB congeners with loading scores larger than 0.3 for PC1 are in bold and are displayed in the PCA biplot (Figure 4).
CongenerPC1PC2
PCB 52−0.3912431870.046030553
PCB 49−0.3066682760.082704940
PCB 44−0.2631115720.132184922
PCB 95−0.249304212−0.025604428
PCB 66−0.215865398−0.063642875
PCB 28−0.2004906350.302478694
PCB 18−0.0859655930.234496099
PCB 31−0.0742973730.214990640
PCB 156−0.018221960−0.023559163
PCB 105−0.017929630−0.202887928
PCB 1510.008978884−0.134698813
PCB 2090.0190034070.028315064
PCB 2060.0255289660.017271277
PCB 1950.0312340640.024457992
PCB 1940.032328440−0.027942848
PCB 1260.035287536−0.299178745
PCB 1700.042712994−0.148183076
PCB 1800.045287309−0.626611108
PCB 1490.0525922610.061598326
PCB 1280.0626491810.003196016
PCB 1830.070039534−0.050735404
PCB 990.0768312580.060819762
PCB 1180.140269441−0.172217258
PCB 1870.3384561380.375925319
PCB 1380.3626986270.023100243
PCB 1530.4791998060.167691821

References

  1. Brown, E.J.; Vasconcelos, R.P.; Wennhage, H.; Bergström, U.; Støttrup, J.G.; van de Wolfshaar, K.; Millisenda, G.; Colloca, F.; Le Pape, O. Conflicts in the Coastal Zone: Human Impacts on Commercially Important Fish Species Utilizing Coastal Habitat. ICES J. Mar. Sci. 2018, 75, 1203–1213. [Google Scholar] [CrossRef] [Scilit]
  2. Shepherd, G.R.; Packer, D.B. Essential Fish Habitat Source Document. Bluefish, Pomatomus Saltatrix, Life History and Habitat Characteristics; NOAA Repository: Woods Hole, MA, USA, 2006. [Google Scholar]
  3. NOAA-NMFS-NEFSC. Atlantic Bluefish 2025 Management Track Assessment Report; NOAA Repository: Woods Hole, MA, USA, 2025. [Google Scholar]
  4. Able, K.W.; Fahay, M.P. The First Year in the Life of Estuarine Fishes in the Middle Atlantic Bight; Rutgers University Press: New Brunswick, NJ, USA, 1998. [Google Scholar]
  5. Crawford, D.W.; Bonnevie, N.L.; Wenning, R.J. Sources of Pollution and Sediment Contamination in Newark Bay, New Jersey. Ecotoxicol. Environ. Saf. 1995, 30, 85–100. [Google Scholar] [CrossRef] [Scilit]
  6. Crawford, D.W.; Bonnevie, N.L.; Gillis, C.A.; Wenning, R.J. Historical Changes in the Ecological Health of the Newark Bay Estuary, New Jersey. Ecotoxicol. Environ. Saf. 1994, 29, 276–303. [Google Scholar] [CrossRef] [Scilit]
  7. McBride, R.; Conover, D. Recruitment of Young-of-the-Year Bluefish Pomatomus saltatrix to the New York Bight: Variation in Abundance and Growth of Spring- and Summer-Spawned Cohorts. Mar. Ecol. Prog. Ser. 1991, 78, 205–216. [Google Scholar] [CrossRef] [Scilit]
  8. Graves, J.E.; McDowell, J.R.; Beardsley, A.M.; Scoles, D.R. Stock Structure of the Bluefish Pomatomus saltatrix along the Mid-Atlantic Coast. Fish. Bull.-Natl. Ocean. Atmos. Adm. 1992, 90, 703–710. [Google Scholar]
  9. Deshpande, A.D.; Dockum, B.W.; Draxler, A.F.J. Contaminant Bioaccumulation Dynamics in Young-of-the-Year Bluefish Subpopulations in New York Bight with a Special Reference to the Condition and Nursery Area Fidelity Subsequent to Recruitment. Can. J. Fish. Aquat. Sci. 2016, 73, 35–52. [Google Scholar] [CrossRef] [Scilit]
  10. Deshpande, A.D.; Dockum, B.W.; Cleary, T.; Farrington, C.; Wieczorek, D. Bioaccumulation of Polychlorinated Biphenyls and Organochlorine Pesticides in Young-of-the-Year Bluefish (Pomatomus saltatrix) in the Vicinity of a Superfund Site in New Bedford Harbor, Massachusetts, and in the Adjacent Waters. Mar. Pollut. Bull. 2013, 72, 146–164. [Google Scholar] [CrossRef] [Scilit]
  11. Smalling, K.L.; Deshpande, A.D.; Blazer, V.S.; Dockum, B.W.; Timmons, D.; Sharack, B.L.; Baker, R.J.; Samson, J.; Reilly, T.J. Young of the Year Bluefish (Pomatomus saltatrix) as a Bioindicator of Estuarine Health: Establishing a New Baseline for Persistent Organic Pollutants after Hurricane Sandy for Selected Estuaries in New Jersey and New York. Mar. Pollut. Bull. 2016, 107, 422–431. [Google Scholar] [CrossRef] [Scilit]
  12. Deshpande, A.D.; Draxler, A.F.J.; Zdanowicz, V.S.; Schrock, M.E.; Paulson, A.J.; Finneran, T.W.; Sharack, B.L.; Corbo, K.; Arlen, L.; Leimburg, E.; et al. Contaminant Levels in Muscle of Four Species of Recreational Fish from the New York Bight Apex; NOAA-NMFS, Ed.; NOAA technical memorandum NMFS-NE; 157; National Oceanic and Atmospheric Administration: Washington, DC, USA, 2000.
  13. United States, National Oceanic and Atmospheric Administration; United States, Food and Drug Administration; United States, Environmental Protection Agency. Report on 1984-86 Federal Survey of PCBs in Atlantic Coast Bluefish: Interpretive Report; NOAA Repository: Silver Spring, MD, USA, 1987.
  14. Carpenter, C.M.G.; Helbling, D.E. Widespread Micropollutant Monitoring in the Hudson River Estuary Reveals Spatiotemporal Micropollutant Clusters and Their Sources. Environ. Sci. Technol. 2018, 52, 6187–6196. [Google Scholar] [CrossRef] [Scilit]
  15. Alonso, M.; Leong, J.-A. Suppressive Subtraction Libraries to Identify Interferon-Inducible Genes in Fish. Mar. Biotechnol. 2002, 4, 74–80. [Google Scholar] [CrossRef] [Scilit]
  16. Marchand, J.; Tanguy, A.; Charrier, G.; Quiniou, L.; Plee-Gauthier, E.; Laroche, J. Molecular Identification and Expression of Differentially Regulated Genes of the European Flounder, Platichthys flesus, Submitted to Pesticide Exposure. Mar. Biotechnol. 2006, 8, 275–294. [Google Scholar] [CrossRef] [Scilit]
  17. Straub, P.F.; Higham, M.L.; Tanguy, A.; Landau, B.J.; Phoel, W.C.; Hales, L.S.; Thwing, T.K.M. Suppression Subtractive Hybridization CDNA Libraries to Identify Differentially Expressed Genes from Contrasting Fish Habitats. Mar. Biotechnol. 2004, 6, 386–399. [Google Scholar] [CrossRef] [Scilit]
  18. Ricker, W.E. Computation and Interpretation of Biological Statistics of Fish Populations; Stevenson, J.C., Ed.; Bull. 191; Fisheries Research Board of Canada: Ottawa, ON, Canada, 1975.
  19. Fraser, C.; Gardner, G.; Guevremont, R.; Maxwell, P.; Willie, S. CARP-2: Ground Whole Carp Reference Material for Organochlorine Compounds. Available online: https://nrc-digital-repository.canada.ca/eng/view/object/?id=aeb9ae75-b0a4-44d7-b586-0e6f98a6379d (accessed on 24 August 2026).
  20. National Institute for Standards (NIST). Standard Reference Material (SRM) 2261: Chlorinated Pesticides in Hexane. Available online: https://tsapps.nist.gov/srmext/certificates/2261.pdf (accessed on 24 August 2026).
  21. National Institute of Standards (NIST). Standard Reference Material (SRM) 2274: PCB Congener Solution-II in Isooctane. Available online: https://tsapps.nist.gov/srmext/certificates/2274.pdf (accessed on 24 August 2026).
  22. National Institute for Standards. Standard Reference Material (SRM) 2275: Chlorinated Pesticide Solution-II in Isooctane. Available online: https://tsapps.nist.gov/srmext/certificates/2275.pdf (accessed on 24 August 2026).
  23. Ballschmiter, K.; Zell, M. Analysis of Polychlorinated Biphenyls (PCB) by Glass Capillary Gas Chromatography. Fresenius’ Z. Anal. Chem. 1980, 302, 20–31. [Google Scholar] [CrossRef] [Scilit]
  24. NOAA. A Summary of Data on Tissue Contamination from the First Three Years (1986–1988) of the Mussel Watch Project, NOAA National Ocean Service, Technical Memorandum NOS OMA 49; NOAA Repository: Rockville, MD, USA, 1989.
  25. Gehrt, A.J. Methods for Determining Ronnel in Feeds and Mineral Mixtures. J. AOAC Int. 1972, 55, 710–713. [Google Scholar] [CrossRef] [Scilit]
  26. Hudson River Natural Resources Trustees. Data Quality Assessment Report: Avian Egg Study, Hudson River Natural Resource Damage Assessment; Hudson River Natural Resource Damage Assessment: Silver Springs, MD, USA, 2003. [Google Scholar]
  27. McGarigal, K.; Stafford, S.; Cushman, S. Multivariate Statistics for Wildlife and Ecology Research; Springer: New York, NY, USA, 2000. [Google Scholar]
  28. R Core Team. R: A Language and Environment for Statistical Computing, v 4.3.0. Available online: https://www.R-project.org (accessed on 18 June 2026).
  29. Kassambara, A.; Mundt, F. Factoextra: Extract and Visualize the Results of Multivariate Data Analyses, R package version 2.0.0.; R Foundation for Statistical Computing: Vienna, Austria, 2026. [Google Scholar]
  30. Mary-Huard, T.; Daudin, J.-J.; Baccini, M.; Biggeri, A.; Bar-Hen, A. Biases Induced by Pooling Samples in Microarray Experiments. Bioinformatics 2007, 23, i313–i318. [Google Scholar] [CrossRef] [Scilit][Green Version]
  31. Diatchenko, L.; Lau, Y.F.; Campbell, A.P.; Chenchik, A.; Moqadam, F.; Huang, B.; Lukyanov, S.; Lukyanov, K.; Gurskaya, N.; Sverdlov, E.D.; et al. Suppression Subtractive Hybridization: A Method for Generating Differentially Regulated or Tissue-Specific CDNA Probes and Libraries. Proc. Natl. Acad. Sci. USA 1996, 93, 6025–6030. [Google Scholar] [CrossRef] [Scilit]
  32. Altschul, S.F.; Gish, W.; Miller, W.; Myers, E.W.; Lipman, D.J. Basic Local Alignment Search Tool. J. Mol. Biol. 1990, 215, 403–410. [Google Scholar] [CrossRef]
  33. Rasmussen, R.; Morrison, T.; Herrmann, M.; Wittwer, C. Quantitative PCR by Continuous Fluorescence Monitoring of a Double Strand DNA Specific Binding Dye. Biochemica 1998, 2, 8–11. [Google Scholar]
  34. Candelmo, A.C.; Deshpande, A.; Dockum, B.; Weis, P.; Weis, J.S. The Effect of Contaminated Prey on Feeding, Activity, and Growth of Young-of-the-Year Bluefish, Pomatomus saltatrix, in the Laboratory. Estuaries Coasts 2010, 33, 1025–1038. [Google Scholar] [CrossRef] [Scilit]
  35. Kasumyan, A.O. Effects of Chemical Pollutants on Fish Foraging and Sensitivity. J. Ichthyol. 2001, 41, 76–87. [Google Scholar]
  36. Porras-Rivera, G.; Górski, K.; Colin, N. Behavioral Biomarkers in Fishes: A Non-Lethal Approach to Assess the Effects of Chemical Pollution on Freshwater Ecosystems. Environ. Res. 2024, 260, 119607. [Google Scholar] [CrossRef] [Scilit]
  37. Weis, J.S.; Bergey, L.; Reichmuth, J.; Candelmo, A. Living in a Contaminated Estuary: Behavioral Changes and Ecological Consequences for Five Species. Bioscience 2011, 61, 375–385. [Google Scholar] [CrossRef] [Scilit]
  38. Lodge, J.; Landeck Miller, R.E.; Suszkowski, D.; Litten, S.; Douglas, S. Contaminant Assessment and Reduction Project: Summary Report; Hudson River Foundation: New York, NY, USA, 2015. [Google Scholar]
  39. Spilsbury, F.D.; Scarlett, A.G.; Rowland, S.J.; Nelson, R.K.; Spaak, G.; Grice, K.; Gagnon, M.M. Fish Fingerprinting: Identifying Crude Oil Pollutants Using Bicyclic Sesquiterpanes (Bicyclanes) in the Tissues of Exposed Fish. Environ. Toxicol. Chem. 2023, 42, 7–18. [Google Scholar] [CrossRef] [Scilit]
  40. Mrema, E.J.; Rubino, F.M.; Brambilla, G.; Moretto, A.; Tsatsakis, A.M.; Colosio, C. Persistent Organochlorinated Pesticides and Mechanisms of Their Toxicity. Toxicology 2013, 307, 74–88. [Google Scholar] [CrossRef] [Scilit]
  41. Abdo, W.; Hirata, A.; Sakai, H.; El-Sawak, A.; Nikami, H.; Yanai, T. Combined Effects of Organochlorine Pesticides Heptachlor and Hexachlorobenzene on the Promotion Stage of Hepatocarcinogenesis in Rats. Food Chem. Toxicol. 2013, 55, 578–585. [Google Scholar] [CrossRef] [Scilit]
  42. Harada, T.; Ohtsuka, R.; Takeda, M.; Yoshida, T.; Enomoto, A.; Kojima, S.; Tomiyama, N.; Nakashima, N.; Ozaki, M. Hepatocarcinogenesis by DDT in Rats. J. Toxicol. Pathol. 2006, 19, 155–167. [Google Scholar] [CrossRef] [Scilit]
  43. Harada, T.; Takeda, M.; Kojima, S.; Tomiyama, N. Toxicity and Carcinogenicity of Dichlorodiphenyltrichloroethane (DDT). Toxicol. Res. 2016, 32, 21–33. [Google Scholar] [CrossRef] [Scilit]
  44. Cossaboon, J.M.; Teh, S.J.; Sant, K.E. Reproductive Toxicity of DDT in the Japanese Medaka Fish Model: Revisiting the Impacts of DDT+ on Female Reproductive Health. Chemosphere 2024, 357, 141967. [Google Scholar] [CrossRef] [Scilit]
  45. Dupuy, C.; Galland, C.; Devaux, A.; Bony, S.; Loizeau, V.; Danion, M.; Pichereau, V.; Fournier, M.; Laroche, J. Responses of the European Flounder (Platichthys flesus) to a Mixture of PAHs and PCBs in Experimental Conditions. Environ. Sci. Pollut. Res. 2014, 21, 13789–13803. [Google Scholar] [CrossRef] [Scilit]
  46. Hakkola, J.; Bernasconi, C.; Coecke, S.; Richert, L.; Andersson, T.B.; Pelkonen, O. Cytochrome P450 Induction and Xeno-Sensing Receptors Pregnane X Receptor, Constitutive Androstane Receptor, Aryl Hydrocarbon Receptor and Peroxisome Proliferator-Activated Receptor α at the Crossroads of Toxicokinetics and Toxicodynamics. Basic Clin. Pharmacol. Toxicol. 2018, 123, 42–50. [Google Scholar] [CrossRef] [Scilit]
  47. Gu, X.; Manautou, J.E. Molecular Mechanisms Underlying Chemical Liver Injury. Expert Rev. Mol. Med. 2012, 14, e4. [Google Scholar] [CrossRef] [Scilit]
  48. Iyanagi, T. Molecular Mechanism of Phase I and Phase II Drug-Metabolizing Enzymes: Implications for Detoxification. Int. Rev. Cytol. 2007, 260, 35–112. [Google Scholar] [CrossRef] [Scilit]
  49. Oleksiak, M.F. Changes in Gene Expression Due to Chronic Exposure to Environmental Pollutants. Aquat. Toxicol. 2008, 90, 161–171. [Google Scholar] [CrossRef] [Scilit]
  50. Gerwick, L.; Reynolds, W.S.; Bayne, C.J. A Precerebellin-like Protein Is Part of the Acute Phase Response in Rainbow Trout, Oncorhynchus mykiss. Dev. Comp. Immunol. 2000, 24, 597–607. [Google Scholar] [CrossRef] [Scilit]
  51. Sever, L.; Vo, N.T.K.; Bols, N.C.; Dixon, B. Tapasin’s Protein Interactions in the Rainbow Trout Peptide-Loading Complex. Dev. Comp. Immunol. 2018, 81, 262–270. [Google Scholar] [CrossRef] [Scilit]
  52. Ma, H.-L.; Shi, Y.-H.; Zhang, X.-H.; Li, M.-Y.; Chen, J. A Transmembrane C-Type Lectin Receptor Mediates LECT2 Effects on Head Kidney-Derived Monocytes/Macrophages in a Teleost, Plecoglossus altivelis. Fish Shellfish Immunol. 2016, 51, 70–76. [Google Scholar] [CrossRef] [Scilit]
  53. Dietrich, M.A.; Adamek, M.; Jung-Schroers, V.; Rakus, K.; Chadzińska, M.; Hejmej, A.; Hliwa, P.; Bilińska, B.; Karol, H.; Ciereszko, A. Characterization of Carp Seminal Plasma Wap65-2 and Its Participation in the Testicular Immune Response and Temperature Acclimation. Vet. Res. 2020, 51, 142. [Google Scholar] [CrossRef] [Scilit]
  54. Sha, Z.; Xu, P.; Takano, T.; Liu, H.; Terhune, J.; Liu, Z. The Warm Temperature Acclimation Protein Wap65 as an Immune Response Gene: Its Duplicates Are Differentially Regulated by Temperature and Bacterial Infections. Mol. Immunol. 2008, 45, 1458–1469. [Google Scholar] [CrossRef] [Scilit]
  55. Guimaraes, J.C.; Zavolan, M. Patterns of Ribosomal Protein Expression Specify Normal and Malignant Human Cells. Genome Biol. 2016, 17, 236. [Google Scholar] [CrossRef] [Scilit]
  56. Kang, J.; Brajanovski, N.; Chan, K.T.; Xuan, J.; Pearson, R.B.; Sanij, E. Ribosomal Proteins and Human Diseases: Molecular Mechanisms and Targeted Therapy. Signal Transduct. Target. Ther. 2021, 6, 323. [Google Scholar] [CrossRef] [Scilit]
  57. Ross, A.C. Impact of Chronic and Acute Inflammation on Extra- and Intracellular Iron Homeostasis. Am. J. Clin. Nutr. 2017, 106, 1581S–1587S. [Google Scholar] [CrossRef] [Scilit]
  58. Habeeb, E.; Aldosari, S.; Saghir, S.A.; Cheema, M.; Momenah, T.; Husain, K.; Omidi, Y.; Rizvi, S.A.A.; Akram, M.; Ansari, R.A. Role of Environmental Toxicants in the Development of Hypertensive and Cardiovascular Diseases. Toxicol. Rep. 2022, 9, 521–533. [Google Scholar] [CrossRef] [Scilit]
  59. Agrawal, I.; Lee, A.Q.; Gong, Z. Identifying Universal Fish Biomarker Genes in Response to PCB126 Exposure by Comparative Transcriptomic Analyses. Curr. Issues Mol. Biol. 2024, 46, 7862–7876. [Google Scholar] [CrossRef] [Scilit]
  60. Yadetie, F.; Karlsen, O.; Eide, M.; Hogstrand, C.; Goksøyr, A. Liver Transcriptome Analysis of Atlantic Cod (Gadus morhua) Exposed to PCB 153 Indicates Effects on Cell Cycle Regulation and Lipid Metabolism. BMC Genom. 2014, 15, 481. [Google Scholar] [CrossRef] [Scilit]
  61. Breese, N.M.; Truong, L.; Li, X.; Tanguay, R.L.; Lehmler, H.-J. Morphological, Behavioral, and Transcriptomic Profiling Reveals Developmental Toxicity of PCB Metabolites in Zebrafish. Toxics 2026, 14, 444. [Google Scholar] [CrossRef] [Scilit]
  62. Mehinto, A.C.; Thornton Hampton, L.M.; Vidal-Dorsch, D.E.; Garcia-Reyero, N.; Arick, M.A.; Maruya, K.A.; Lao, W.; Vulpe, C.D.; Brown-Augustine, M.; Loguinov, A.; et al. Transcriptomic Response Patterns of Hornyhead Turbot (Pleuronichthys verticalis) Dosed with Polychlorinated Biphenyls and Polybrominated Diphenyl Ethers. Comp. Biochem. Physiol. Part D Genom. Proteom. 2021, 38, 100822. [Google Scholar] [CrossRef] [Scilit]
  63. Vogs, C.; Lindqvist, D.; Wai Tang, S.; Gugescu, L.; Alenius, H.; Wincent, E. Transcriptomic and Functional Effects from a Chemical Mixture Based on the Exposure Profile in Baltic Sea Salmon, on Metabolic and Immune Functions in Zebrafish Embryo. Environ. Int. 2024, 192, 109018. [Google Scholar] [CrossRef] [Scilit]
  64. Annunziato, K.; Cooper, K.R. The Impact of Early Developmental Exposure to Stressors Related to Individual Fitness in Aquatic Organisms and the Subsequent Reproductive Success and Failure on Populations. In Development and Environment; Burggren, W., Dubansky, B., Eds.; Springer International Publishing: Cham, Switzerland, 2018; pp. 115–153. [Google Scholar]
  65. Reid, N.M.; Whitehead, A. Functional Genomics to Assess Biological Responses to Marine Pollution at Physiological and Evolutionary Timescales: Toward a Vision of Predictive Ecotoxicology. Brief. Funct. Genom. 2016, 15, 358–364. [Google Scholar] [CrossRef] [Scilit]
  66. Wirgin, I.; Roy, N.K.; Loftus, M.; Chambers, R.C.; Franks, D.G.; Hahn, M.E. Mechanistic Basis of Resistance to PCBs in Atlantic Tomcod from the Hudson River. Science 2011, 331, 1322–1325. [Google Scholar] [CrossRef] [Scilit]
  67. Whitehead, A.; Clark, B.W.; Reid, N.M.; Hahn, M.E.; Nacci, D. When Evolution Is the Solution to Pollution: Key Principles, and Lessons from Rapid Repeated Adaptation of Killifish (Fundulus heteroclitus) Populations. Evol. Appl. 2017, 10, 762–783. [Google Scholar] [CrossRef] [Scilit]
  68. Miyata, K.; Inoue, Y.; Yamane, M.; Honda, H. Fish Environmental RNA Sequencing Sensitively Captures Accumulative Stress Responses through Short-Term Aquarium Sampling. Sci. Total Environ. 2025, 959, 178182. [Google Scholar] [CrossRef] [Scilit]
  69. Lodge, J.; Landeck Miller, R.E.; Farley, K.J.; Litten, J.; Douglas, S.; Lohmann, S.R.; Vojta, S. Contaminant Assessment and Reduction Project, Phase 2, CARP II Summary Report; Hudson River Foundation: New York, NY, USA, 2024. [Google Scholar]
Figure 1. Length-weight relationship for YOY bluefish (n = 22 fish per site) with linear equation fitted to the points for each estuary site, Mullica River-Great Bay (MRGB) and Hudson Raritan Estuary (HRE).
Pollutants 06 00048 g001
Figure 2. Fulton’s condition index (n = 22 fish per site) calculated for YOY bluefish from two sites, Mullica River-Great Bay (MRGB) and Hudson Raritan Estuary (HRE). Horizontal bars (whiskers) are the minimum and maximum values respectively. Points outside the box (Interquartile Range or IQR) and whisker (1.5 × IQR) are outliers. The respective means are marked with an X and the medians are the line within the box. Means are significantly different (p < 0.007) by t-test.
Pollutants 06 00048 g002
Figure 3. Mean PCB concentration plus standard deviation in YOY bluefish (n = 11 per site) from the Mullica River-Great Bay (MRGB) Estuary and the Hudson Raritan Estuary (HRE). PCB concentration differences between the sites were significantly different at α = 0.05 by t-test for each of the measured congeners.
Pollutants 06 00048 g003
Figure 4. Principal component analysis (PCA) of the PCB congener data displaying the sample groupings by location MRGB and HRE. The top five PCB congeners contribute to the variation along PC1 are shown, with the arrows depicting the gradient for each congener.
Pollutants 06 00048 g004
Figure 5. Relative quantitative polymerase chain reaction (qPCR) comparing mean gene expression (n = 3) in individual genes expressed in the liver (pooled liver total RNA n = 11) of bluefish collected from the Hudson Raritan Estuary (HRE), compared to bluefish liver (pooled liver total RNA n = 11) from Mullica River-Great Bay estuary (MRGB). Each of the gene probes shows a relative up-regulation with contamination (fold induction) in the HRE versus the MRGB, i.e., mean HRE expression/mean MRGB expression. Note the relative fold induction values are plotted on a log scale and values are provided for each of the bars.
Pollutants 06 00048 g005
Table 1. Mean fork length and wet weight for YOY bluefish from the Hudson Raritan Estuary (HRE) and from the Mullica River-Great Bay (MRGB) Estuary. Probability (p) for t-test, * significant at α = 0.05.
Fork Length (mm)Weight (g)
SiteNMeanS.D.MeanS.D.
HRE22155.1817.1945.6717.61
MRGB22176.0811.0269.8513.92
p <0.001 * <0.001 *
Table 2. Polychlorobiphenyls (PCBs ng/g) in YOY bluefish from Hudson Raritan Estuary (HRE) and from the Mullica River-Great Bay (MRGB) Estuary. Σ = sum, p = probability of significant difference (*) in means by t-test, a < 0.05).
LocationHREMRGB
No. of Samples1111Means/t-test
AnalytemeanS.D.meanS.D.p
Sum (Σ) PCBs356.23114.8553.4414.731<0.001 *
Sum (Σ) Aroclors712.46229.70106.88629.462<0.001 *
Table 3. Organochlorine pesticides (ng/g) in YOY bluefish from the Hudson Raritan Estuary (HRE) and from the Mullica River-Great Bay Estuary (MRGB). Samples (n) = 11 per site. Σ = sum. p = probability of significant difference (*) in means by t-test, α < 0.05; ^ value is below method detection limits (MDL).
LocationHREMRGB
AnalyteMeanS.D.MeanS.D.p
HCB1.7210.7740.192 ^0.083<0.001 *
β-BHC0.2640.1310.032 ^0.014<0.001 *
Lindane0.164 ^0.250.09 ^0.1310.398
Heptachlor0.511 ^0.2220.045 ^0.021<0.001 *
Aldrin0.067 ^0.0690.03 ^0.0790.259
Heptachlor Epoxide2.5811.180.182 ^0.06<0.001 *
Oxychlordane2.2711.1830.239 ^0.096<0.001 *
γ-chlordane6.7122.0920.457 ^0.208<0.001 *
α-chlordane14.1134.4151.195 ^0.525<0.001 *
τ-nonachlor14.5765.5282.3371.122<0.001 *
Endrin8.4593.1850.642 ^0.365<0.001 *
Endosulfan II0.073 ^0.2420.204 ^0.3440.311
Endosulfan Sulfate5.1131.3690.958 ^0.294<0.001 *
o,p,p’-DDE25.3410.3070.552 ^0.592<0.001 *
p,p’-DDE116.25241.68121.7656.641<0.001 *
o,p’-DDD9.1013.4291.280.311<0.001 *
o,p’-DDT6.2191.7441.223 ^0.404<0.001 *
p,p’-DDT4.0531.8190.722 ^0.708<0.001 *
Sum (Σ) DDTs160.96553.22025.5427.894<0.001 *
Sum (Σ) chlordanes35.40111.238 3.9891.771<0.001 *
Table 4. Identification of up-regulated genes with contamination bluefish (BFu-) expressed sequence tags (ESTs) from suppressive subtraction hybridization (SSH) library. Homologs and species names were identified using BlastX (NCBI) search. The Genbank accession number of closest homolog and the expected value (E value) for each alignment.
ESTAccessionGeneHomologHomolog
Accession
E Value
Bfu- Immune system
21DY223235C3complement C3XP_008315469.13.00 × 10−51
158DY223311serping1C1 (complement) inhibitorAFO64913.18.00 × 10−86
30DY223239cbln1precerebellin-1-like-C1qXP_033503736.13.00 × 10−68
124DY223292flnbtapasin-TAP associated glycoprotein XP_031139445.18.00 × 10−29
147DY223303mfap4microfibril associated glycoprotein 4 likeXP_018548939.18.00 × 10−31
Environmental response
39DY223245wap65-1warm temperature acclimation protein 65-1CCA29189.12.00 × 10−41
70DY223261isp2type-2 ice-structuring protein XP_032362960.14.00 × 10−23
69DY223260afpantifreeze polypeptide precursorAAA49617.13.00 × 10−19
Metabolism
10DY223228txnthioredoxin XP_005807280.15.00 × 10−19
19DY223233cyp1a1cytochrome P450 1A AEX63356.12.00 × 10−36
32DY223241cyp2ncytochrome P450 CYP2NABO21079.12.00 × 10−5
87DY223273cyb561cytochrome b ascorbate XP_028434070.14.00 × 10−40
108DY223283cyp2a10cytochrome P450 2A10XP_030264280.12.00 × 10−98
137DY223298cyp1a1cytochrome P450 1A1XP_029282397.17.00 × 10−115
48DY223251selenot1aselenoprotein T1a thioredoxin reductase like XP_022063960.12.00 × 10−64
6DY223225nacanascent polypeptide-assoc. complex subunit αADX97194.13.00 × 10−63
27DY223238pdia4protein disulfide-isomerase A4XP_018548628.11.00 × 10−33
37DY223243minpp1multiple inositol polyphosphate phosphatase 1XP_029306261.11.00 × 10−36
45DY223249pla1aphospholipase A1 member AKAE8299747.11.00 × 10−36
46DY223250lyscc-type lysozymeADZ44620.14.00 × 10−37
55DY223255gcdhglutaryl-CoA dehydrogenaseXP_026204710.14.00 × 10−27
74DY223263aldhaldehyde dehydrogenaseTNN41590.19.00 × 10−63
77DY223266smasesphingomyelin phosphodiesteraseXP_030293881.18.00 × 10−48
81DY223269smcicarboxypeptidase inhibitor SmCIXP_020493765.19.00 × 10−46
83DY223270rpn1ribophorin1XP_014043427.11.00 × 10−54
84DY223271hoga4-hydroxy-2-oxoglutarate aldolaseXP_020442478.13.00 × 10−39
85DY223272gapdhglyceraldehyde-3-phosphate dehydrogenaseXP_028984894.17.00 × 10−24
92DY223277pdiprotein disulfide-isomeraseTWW59456.19.00 × 10−11
93DY223278pdiprotein disulfide isomerase precursor (PDI) geneJX891477.17.00 × 10−96
119DY223290cthcystathionine gamma-lyaseXP_022593808.13.00 × 10−94
121DY223291spp24secreted phosphoprotein 24XP_018516447.12.00 × 10−38
132DY223295adh1alcohol dehydrogenase 1XP_018553249.17.00 × 10−53
150DY223305nmt3phosphoethanolamine N-methyltransferase 3XP_023263083.13.00 × 10−111
7DY223226bhmtbetaine-homocysteine S-methyltransferaseXP_028852308.11.00 × 10−11
8DY223227limk2LIM domain kinase 2XP_024660306.12.30 × 10−1
17DY223231eno3beta-enolaseXP_012715925.21.00 × 10−35
20DY223234shmtserine hydroxymethyltransferase, cytosolicXP_026201746.17.00 × 10−121
52DY223252bhmt1betaine-homocysteine S-methyltransferase 1XP_022048002.14.00 × 10−53
54DY223254gstt1glutathione S-transferase theta-1XP_018548814.11.00 × 10−40
71DY223262dhprdihydropteridine reductaseXP_030001857.12.00 × 10−110
112DY223286gstaglutathione S-transferaseAAQ91198.17.00 × 10−56
152DY223307ubp1beta-ureidopropionaseXP_006797654.12.00 × 10−47
154DY223308marc1mitochondrial amidoxime-reducing component 1XP_022606172.13.00 × 10−57
Signal proteins
4DY223223srprbsignal recognition particle receptor subunit betaXP_010766055.11.00 × 10−66
18DY223232sec11asignal peptidase complex catalytic subunit XP_023153367.12.00 × 10−24
44DY223248eif2b4translation initiation factor eIF-2B subunit deltaXP_029966559.11.00 × 10−35
90DY223275agtangiotensinogenXP_022619392.16.00 × 10−41
78DY223267agtangiotensinogenXP_023147340.15.00 × 10−117
113DY223287dnajc11dnaJ homolog subfamily C member 11XP_029363207.12.00 × 10−81
136DY223297eef1a1elongation factor 1-alphaCAX33861.12.00 × 10−108
141DY223300f1p1pre-mRNA 3’-end-processing factor FIP1XP_026216478.12.00 × 10−7
144DY223301eif3ceukaryotic translation initiation factor 3 subunit CXP_018925779.11.00 × 10−53
Transport and Tissue proteins
5DY223224cfl2cofilin-2 XP_015248032.11.00 × 10−37
151DY223306apoa1apolipoprotein A-IXP_032365910.13.00 × 10−47
130DY223294plgplasminogenXP_023285692.11.00 × 10−105
109DY223284hpxhemopexinASV48204.15.00 × 10−63
104DY223282gtpb1GTP-binding nuclear AEM37693.11.00 × 10−23
70DY223261habp2hyaluronan binding protein 2XP_029925861.13.00 × 10−43
42DY223246apobapolipoprotein B-100TKS75535.11.00 × 10−54
1DY223221vtnvitronectinXP_031136743.18.00 × 10−80
2DY223222apoa1apolipoprotein A1TNN34591.14.00 × 10−13
11DY223229ftlferritinXP_008291313.19.00 × 10−77
22DY223236hphaptoglobinQBF53745.11.00 × 10−21
24DY223237vtnvitronectinXP_031136743.12.00 × 10−78
31DY223240fgbfibrinogen beta chainXP_023152926.12.00 × 10−22
33DY223242hba1hemoglobin subunit alphaXP_029383058.16.00 × 10−62
38DY223244kng1kininogen-1 isoform X1XP_023284563.12.00 × 10−37
57DY223256tftransferrinCAC19468.12.00 × 10−51
13DY223230tfatransferrin-a XP_008283972.16.00 × 10−73
53DY223253procvitamin K-dependent Protein CKAE8290483.11.00 × 10−52
68DY223259fetubfetuin-bXP_054646644.13.00 × 10−27
76DY223265hepl1ferroxidaseXP_071316308.12.00 × 10−61
89DY223274krt18keratin, type I cytoskeletal 18XP_020473591.17.00 × 10−61
91DY223276bsgbasigin isoform X1XP_022615278.12.00 × 10−54
94DY223279tubbbeta tubulinAAL24510.19.00 × 10−74
139DY223299tfserotransferrin-likeXP_023254217.13.00 × 10−67
146DY223302serpina1alpha-1-antitrypsin homologXP_028460829.15.00 × 10−59
160DY223312a2malpha-2-macroglobulinAAR06589.16.00 × 10−69
80DY223268actbactinXP_022594016.14.00 × 10−60
Ribosomal proteins
155DY223309rps7S7 (40S)AWP20434.11.00 × 10−75
110DY223285rps3S3 (40S)XP_003448999.41.00 × 10−112
75DY223264rps6S6 (40S)AAT01908.16.00 × 10−24
59DY223258rps2S2 (40S)XP_004558416.17.00 × 10−58
129DY223293mrps2828SXR_004329248.11.00 × 10−125
Table 5. Identification of the down-regulated genes with contamination bluefish (BFd-) expressed sequence tags (ESTs) from suppressive subtraction hybridization (SSH) library. Homologs and species name were identified using BlastX, GenBank search. The accession number of closest homologs, length of amino acid query, percent identity (%ID), percent positives (%Pos), and the expected value (E value) for each alignment.
ESTAccessionGeneHomologHomolog AccessionE Value
Bfd- Immune system
37DY223202lect2leucocyte cell derived chemotaxin-2KAF3703988.11.00 × 10−50
Environmental response
113DY223215isp ls-12type-4 ice-structuring protein LS-12XP_022603083.16.00 × 10−36
Metabolism
6DY223199eef1a1elongation factor 1-alphaKAE8282309.12.00 × 10−154
71DY223207mt-nd1NADH dehydrogenaseACR19960.13.00 × 10−47
150DY223219mt-atp6ATP synthase F0 subunit 6YP_008593748.12.00 × 10−44
86DY223209mt-co1cytochrome c oxidase subunit IYP_008593745.15.00 × 10−51
129DY223217azin1predicted antizyme inhibitor 1 (azin1) likeXM_035671848.16.00 × 10−18
Signal proteins
4DY223198serpinf1pigment epithelium-derived factorXP_026213308.13.00 × 10−109
77DY223208mid1ip1mid1-interacting protein 1-BXP_029302452.12.00 × 10−18
44DY223204if2mtranslation initiation factor IF-2-likeXP_037553016.13.00 × 10−30
Transport and Tissue proteins
46DY223206hba1hemoglobin subunit alphaXP_008301375.17.00 × 10−82
39DY223203fggputative fibrinogen gamma chain isoform 3AWP05360.12.00 × 10−29
92DY223210col1a1collagen alpha-1(I) chainRXN15115.18.00 × 10−64
118DY223216hbbhemoglobin subunit beta2APS87122.13.00 × 10−95
Ribosomal proteins
20DY223200rpl15L15 (60S) XP_008293876.12.00 × 10−65
33DY223201rps6S6 (40S) XP_018551167.11.00 × 10−73
45DY223205rps4S4 (40S) ACM41869.15.00 × 10−82
153DY223220rps9S9 (40S) AER42648.13.00 × 10−3
1DY223197rpl3L3 rAEM37694.12.00 × 10−80
Table 6. Gene-specific primers for quantitative polymerase chain reaction (qPCR) of bluefish up-regulated (bfu) clones isolated by SSH. Sequences are 5′-3′.
HomologBfu Clone5′ Forward Primer5′ Reverse Primer
signal recognition particle receptor subunit beta4CTC ATT CAG CAG CAG CTG GACT CCA CCT TCA TGG GCA
ferritin11ATG AGT GGG GCA GTG GTG TCGCA GGT TGG TCA CCC AGT CT
serotransferrin-like13CTA CGC CGT TGC CGT GGT GGCT CAC CGC CTC CTC CAC TG
cytochrome P450 1A19GCT GGA GGA ACA CAT CTG CCCA GCT CTT GGT CGT TGT G
complement C321GTG GGA CTG GTG GCA GTT GGGA CTC AAA TAA CAG CCC AGC
cerebellin-1-like30GCC CGA GTG GAG AAA CTG G GTG AAG ACG CCT GTG TCG G
warm temperature
acclimation protein
39GGT GAC CAT CTG TTC AAG GGC GTG GTC ATG ATC GGA GGG GTT GTC
Disclaimer/Publisher’s Note: The statements, opinions and data contained in all publications are solely those of the individual author(s) and contributor(s) and not of MDPI and/or the editor(s). MDPI and/or the editor(s) disclaim responsibility for any injury to people or property resulting from any ideas, methods, instructions or products referred to in the content.