Abstract
The aim of this study was to devise a methodology for the on-site evaluation of the potential presence of persistent organic pollutants (POPs) in incoming waste materials. A novel approach to POP screening was developed, integrating an excitation–emission matrix method, which facilitates facile and comprehensive measurement, with machine learning of the resulting spectral images. With this approach, it is possible to determine the presence or absence of POPs with very high accuracy for screening, with a correct response rate of ≥75% and a specificity ≥80%. Assuming that this method is applied to actual delivery, we estimate that it is possible to obtain a discrimination result in about 10 min after sample removal.
1. Introduction
In order to ensure the safety of final disposal sites where wastes are stored after stabilization, volume reduction, or other treatment, and to operate in compliance with applicable laws and regulations, it is necessary to ascertain whether incoming wastes align with the pertinent laws and regulations. Persistent organic pollutants (POPs) are a class of chemicals that have raised significant environmental concerns due to their ability to persist in the environment, bioaccumulate, and exhibit high toxicity to humans and other organisms [1,2,3]. These pollutants also demonstrate long-distance mobility, further emphasizing their potential ecological risks. In response to these concerns, the Stockholm Convention on POPs was established in 2004 with the objective of addressing these issues [4,5,6]. The convention has outlined a series of measures, including the elimination and restriction of POP production and use, reducing POP emissions, and the proper management of waste containing POPs. To promote the proper treatment of waste containing POPs in Japan, the Law on Special Measures for polychlorinated biphenyls (PCBs) was established [7,8]. Many of the substances designated as POPs are pesticides [9,10], and in the 1970s, because detoxification technology had not yet been established, these pesticides were buried in a way that ensured that they would not leak into the surrounding environment [11]. Following the ratification of the Stockholm Convention, the excavation and disposal of buried pesticides became imperative. Consequently, the Ministry of the Environment, Japan, conducted experiments on the decomposition and treatment of pesticides in which POPs were utilized and established “Technical Considerations for the Treatment of POPs Waste Pesticides” in 2004 [12]. Hazardous industrial waste associated with current POPs include those related to PCBs, such as waste PCBs, PCB-contaminated materials, and PCB-treated residues. In addition, the waste containing dioxins at concentrations exceeding regulatory thresholds—such as fly ash, incineration residues, and sludge—are also classified under this category [13].
Offshore landfill disposal sites are characterized by anaerobic conditions, resulting in markedly diminished water movement. Consequently, the process of enhancing water quality is protracted. Moreover, given the absence of contact between the water and the atmosphere, the process of carbonation is not initiated and the pH level remains constant. Consequently, the established effluent standards cannot be achieved, and estimates indicate that the maintenance period may extend beyond 100 years. The maintenance requirements for a sea-level repository are the same as those for an onshore repository. The aspect of maintenance that is unique to a sea-level repository is the “controlled water level” [14].
Prior to their delivery to an onshore or offshore landfill site, this waste must undergo sampling to ascertain the presence of POPs or other substances that may contravene applicable laws and regulations. It is challenging to remediate waste once it has been disposed of into the sea at the landfill site under study, and there are concerns about the effects of leaching into seawater [15]. The regulation of POPs is of paramount importance, as these compounds are subject to stringent international regulations. The control of POP content is typically achieved through the Soxhlet extraction of waste and subsequent analysis via gas chromatography/mass spectrometry (GC/MS) after a thorough cleanup process. However, Soxhlet extraction, which requires approximately 24 h, and GC/MS measurement, which necessitates approximately 1 h, are both time-consuming and impractical. Furthermore, there are numerous complicated operations, including cleanup [16,17].
The excitation–emission matrix (EEM) method is an analytical technique that facilitates the simultaneous measurement of multiple fluorescent chemicals in a relatively brief timeframe with a streamlined pretreatment procedure. Conversely, non-targeted analysis, not limited to the EEM method, is often combined with multivariate analysis methods due to the unclear quantitative and qualitative interpretation of the results. A notable method that has emerged as a standard approach since approximately 2013 involves a synthesis of the EEM method and the PARAFAC method [18,19]. However, this approach is not without its drawbacks, as it involves complex data processing.
Furthermore, a variety of AI-based machine learning methods have been developed recently, and algorithms can be constructed using general-purpose numerical analysis software such as MATLAB R2022b. Machine learning methods such as image analysis have been demonstrated to possess a high degree of proficiency in discriminating against and classifying complex systems [20], and they are capable of capturing minute differences that are not adequately captured by human vision alone. In the domain of food chemistry, there have been reports on the use of AI and EEM technology to identify illicit food ingredients [21]. In the domain of environmental chemistry, there have been reports of the use of AI and EEM technology, namely the “spectrAI” method, to identify pesticide contamination in river water [22].
With these considerations, the objective of this study is to devise a methodology for the on-site evaluation of the potential presence of POPs in incoming waste materials. A novel approach to POP screening was developed, integrating the EEM method, which facilitates simple and comprehensive measurement, with machine learning of the resulting spectral images. The practicality of this method was thoroughly validated.
2. Materials and Methods
2.1. Sample and Reagents
From September to October of 2019, we received a range of incoming samples in screw bottles. The samples were collected from across 31 establishments and divided into eight categories: 55 samples of soot and dust, 11 of waste soot, 86 of cinders, 8 of plating sludge, 38 of mineral waste, 33 of waste incineration ash, 14 of non-construction sludge, and 5 of construction sludge. The total number of samples was 250, based on the establishments’ declarations. The standard reagents for the eight POPs used in this experiment were as follows: heptachlor (AccuStandard, New Haven, CT, USA, C10H5Cl7, molecular weight 373.32), Kepon (also known as chlordecone, AccuStandard, C10Cl10O, molecular weight 490.63), pentachlorobenzene (AccuStandard, C6HCl5, molecular weight 250.34), Aldrin (AccuStandard, C12H8Cl6, molecular weight 364.91), Dieldrin (AccuStandard, C12H8Cl6O, molecular weight 380.91), Myrex (AccuStandard, C10Cl12, molecular weight 545.55), Endrin (AccuStandard, C12H8Cl6O, molecular weight 380.91), and Lindane (AccuStandard, C6H6Cl6, molecular weight 290.81). Each reagent was dissolved in methanol (Fujifilm Wako Pure Chemicals, Amagasaki, Japan, for LCMS) at a concentration of 100 ppm to create a stock solution. These eight reagents were then mixed and diluted to create a 1 ppm standard solution of the POP mixture.
2.2. Pretreatment and EEM Measurement
Figure 1 shows the pretreatment flow. To the waste sample (0.5 g), 200 µL of a 1 ppm mixture of eight POP standard solutions was added. This is referred to as the “Added POPs” sample, abbreviated as AP. Furthermore, 200 µL of methanol (the solvent of the POP standard solutions) was added to the sample that contained no POPs (referred to as the “No added POPs” sample, abbreviated as NP). Subsequently, 200 µL of methanol was added to the sample with NP. Then, 5 mL of purified water was added as the extraction solvent, and the sample was shaken for two minutes. The suspension was then allowed to settle and filtered using ADVANTEC circular filter paper No. 2. Any remaining suspended solids were filtered out using a PTFE membrane filter (0.25 µm).
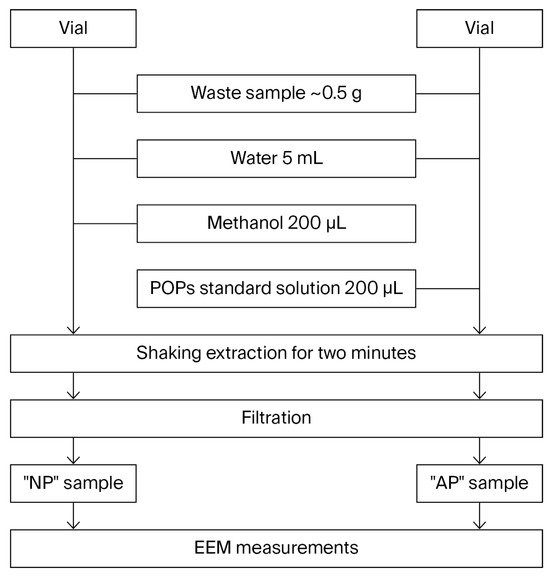
Figure 1.
Sample pretreatment flow.
The resulting extract was subjected to excitation–emission matrix (EEM) measurements. EEMs were measured using a fluorescence spectrometer (F-7100, Hitachi High-Tech Science Corporation, Tokyo, Japan). The measurement conditions were as follows: the excitation wavelength (Ex) range was set from 200 to 500 nm, and the fluorescence wavelength (Em) was similarly set from 200 to 500 nm. Measurements were taken at intervals of Ex 2 nm/Em 2 nm and Ex 10 nm/Em 5 nm. The data obtained from the EEM measurements were subtracted from the solvent blanks. The spectral images were then saved in JPEG format.
2.3. Machine Learning and Classification of Test Data
The Deep Learning Toolbox in the numerical analysis software MATLAB R2022b was utilized to train a convolutional neural network using AlexNet transition learning to classify a new set of images. The configuration parameters for machine learning are delineated in Table 1. The following categories are used for the classification of waste types: soot and dust, waste soot, cinders, plating sludge, mineral waste, waste incinerator ash, sludge (non-construction), and sludge (construction). These materials were then divided into eight distinct types and trained as supervised data. The question of whether the presence or absence of added POPs can be discerned remains a subject of scientific inquiry. To differentiate between samples containing and devoid of POPs, the dataset was segmented into two distinct categories: the first comprised samples containing added POPs (AP), and the second comprised samples devoid of added POPs (NP). These categories served as the training dataset for the machine learning model. After the transfer training, the loaded image data for validation was classified by waste type, AP or NP, and the results are displayed in Figure 2, with the code displaying the match rate for each response. To verify the validity of this system, which utilizes machine learning to ascertain the presence or absence of POPs from the spectral images of EEM, a series of trials were conducted and the percentage of correct answers for each was examined. The initial step in the waste management process was waste species classification. The second step involved the preparation of 200 spectral images for each of the NP and AP training datasets. These images were then trained and validated using 200 validation data points from each of the NP and AP training datasets. After the training phase, validation data were extracted at random from the NP and AP training datasets, with each set comprising 10 data points, and subsequently utilized as validation data. The training dataset comprised 190 training data points, while the 20 randomly selected validation data points were utilized for validation purposes.

Table 1.
Parameters of AlexNet.
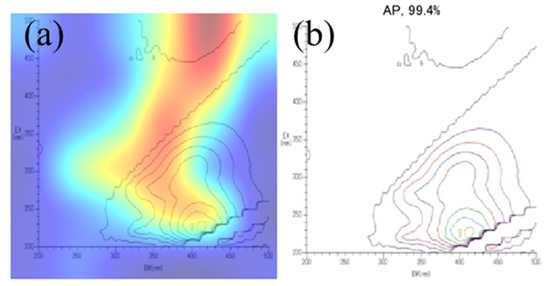
Figure 2.
An example of discrimination results obtained using AI: (a) gradCAM, (b) EEM with discrimination results; “AP, 99.4% (matching ratio)”.
3. Result and Discussion
3.1. Study of the Pretreatment and Measurement Methods
Based on scan measurements collected using liquid chromatography/mass spectrometry (LC/MS) or GCMS, the initial consideration was the application of the rapid pretreatment method, as it requires simple and rapid operation. However, since this method is designed for water samples, its adjustment was necessary for its application to solid samples such as waste. Thus, waste samples were extracted with water by shaking first, and the extracted solution was utilized in the rapid pretreatment method as a water sample. This process took about ten minutes. However, LCMS and GCMS measurements require between thirty minutes and one hour [16,17]. Therefore, we focused on measurements using absorption and fluorescence spectrophotometry, which require less time for measurement and pretreatment and do not require as much purification. Absorption spectra, which can be measured using absorbance spectrophotometry, are charts obtained by scanning a specified wavelength and measuring absorbance. However, it is difficult to compare similar spectra due to the high background noise [23]. Next, we considered the use of a fluorescence spectrophotometer for measurements. Typically, fluorescence spectra obtained with a fluorescence spectrophotometer are measured by fixing the wavelength of the excitation light specific to a substance, and then scanning the wavelength on the detection side. Therefore, if the wavelength of the excitation light changes, the substance transitioning to the excited state also changes, as does the spectral shape. Additionally, the synchronous fluorescence method can be employed to separate and analyze samples with multiple components simultaneously, in which the excitation and fluorescence spectrometer wavelengths are scanned simultaneously and at the same speed while keeping the difference (Δλ) constant, and spectra are measured. The light received by the detector is the fluorescence emitted at the wavelength excited by the wavelength of the excitation spectrometer and then shifted by Δλ. By appropriately selecting Δλ, the separation analysis of the target component is possible. In the synchronous fluorescence method, we thought that it would be possible to comprehensively capture the emission of chemical substances by changing Δλ and measuring several spectra. In this case, however, issues are encountered when combining multiple spectral data points obtained for a single sample into a single image. Therefore, we considered the application of an EEM, which is also called a fluorescence fingerprint. This is a three-dimensional representation in spatial coordinates consisting of three orthogonal axes: excitation wavelength, fluorescence wavelength, and relative fluorescence intensity (see Figure 3). In the EEM method, for example, an excitation light of 200 to 600 nm is irradiated in 5 nm increments, and the fluorescence intensity at 200 to 600 nm is measured in 5 nm increments among the emitted fluorescence. This measurement produces a chart that resembles a superimposition of fluorescence spectra obtained by changing the excitation light in multiple steps; therefore, it can be considered a method similar to non-target analysis that comprehensively captures chemical substances, although it is limited to fluorescent substances. Since this measurement method requires a short pretreatment time and does not require much purification, we decided to adopt the EEM method.
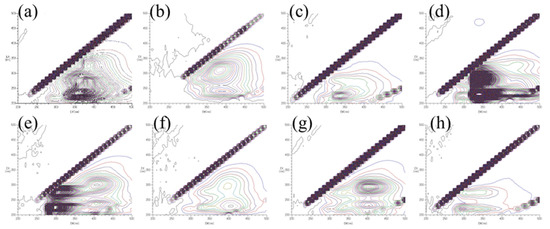
Figure 3.
Examples of EEM: (a) soot and dust, (b) waste soot, (c) cinders, (d) plating sludge, (e) mineral waste, (f) waste incinerated ash, (g) non-construction sludge, (h) construction sludge.
3.2. Analysis of the Discrepancy in EEMs According to Waste Type
The EEM of a sample devoid of POPs is illustrated in Figure 4. The EEM is represented by a contour plot, with the excitation wavelength designated on the x-axis, the fluorescence wavelength on the y-axis, and the fluorescence intensity on the z-axis. The region in which the excitation and fluorescence wavelengths coincide is designated as higher-order light and does not constitute fluorescence emanating from the specimen. A broadening of peaks can been observed at excitation wavelengths ranging from 200 to 350 nm and fluorescence wavelengths between 250 and 500 nm for all waste types. Among the parameters examined, the intensity of the fluorescence peaks of plating sludge, mineral sludge, and sludge (non-construction-type) exhibited particularly strong signal strength, as evidenced by the contour intervals. Conversely, the fluorescence peak intensity of sludge (construction-type) was found to be weak. Construction-type sludge frequently occurs in pebble-like formations, which may indicate that conventional extraction methods, such as shaking extraction with water, might not be adequate.
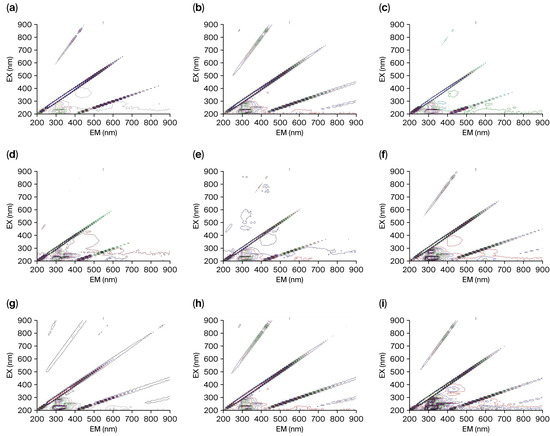
Figure 4.
EEMs of each standard POP and an 8 POP mixture: (a) heptachlor, (b) kepon, (c) pentachlorobenzene, (d) aldrin, (e) dieldrin, (f) myrex, (g) endrin, (h) lindane, and (i) 8 POP mixture.
3.3. The Discrepancy in Spectra with and Without the Addition of POPs
The EEMs of a mixture solution of eight POPs dissolved in methanol are displayed in Figure 4i. The fluorescence peak of the POPs is observed in the wavelength region from 300 to 400 nm when excited at 250 nm. Representative examples of EEMs with and without POPs are shown in Figure 5. The contour intervals reveal a greater fluorescence intensity in the absence of POP addition in comparison the samples with POPs.
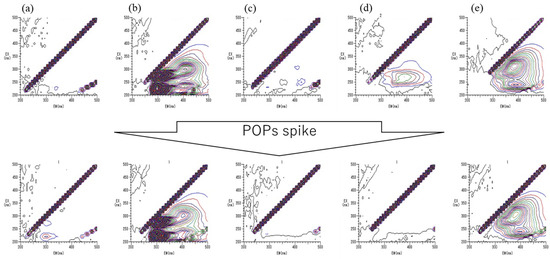
Figure 5.
EEMs of NP and AP: (a) soot and dust, (b) mineral waste, (c) construction sludge, (d) cinders, (e) waste soot.
3.4. The First Machine Learning Test: “Identification of Waste Type”
The objective of this study was to determine the feasibility of distinguishing between the eight distinct waste types present in the training data. The characteristics of the responses are enumerated below. The waste types most likely to be misidentified were soot and cinders, which are similar in nature. As demonstrated by gradCAM, which presents a color map of the region where the AI employed a judgment criterion, the fluorescence wavelength utilized for discrimination ranged from 300 to 400 nanometers, a spectrum in which fluorescence peaks are observed (see Supplementary Information Table S1). In instances where the training and validation data were congruent, the accuracy rate ranged from 78% to 83%.
3.5. The Second Machine Learning Test: “Case of Using Same Data with Validation and Training”
A total of 200 uncorrected spectra from the NP and AP training data were prepared and trained. Subsequently, the training data were validated as validation data. In summary, the data that had been initially designated for training purposes were subsequently verified without modification. The verification process ranged from 30 min to 1 h in duration, contingent upon the hardware specifications and learning conditions that were implemented to execute the machine learning. The accuracy of the validation varied with each iteration of the data learning process, with a general range of 60% to 70%. For instance, upon reading the NP validation data and comparing them with the trained data, the code returned the discrimination of NP or AP, as well as the percentage of agreement, as demonstrated in Figure 5. In Table S2 of the Supplementary Information, the percentages of correct and incorrect responses for NP and AP were 85.0% and 88.5%, respectively, yielding an overall percentage of 86.8%. Upon further examination of the samples that exhibited erroneous responses, it was observed that they were distributed uniformly across all waste types (see Table S2 in Supplementary Information).
3.6. The Third Machine Learning Test: “Case of Using Randomly Selected Validation Data from Training Data”
Ten data points were selected at random from the NP and AP training data for the purpose of validation. The training dataset comprised 190 training data points, while 20 data points were selected at random for validation purposes. This procedure was repeated on three separate occasions. The average percentage of correct answers was 75%. Given that a false negative error in which AP is mistaken for NP is more problematic than a false positive error in which NP is mistaken for AP, the degree of false positives and false negatives in the test was evaluated in terms of sensitivity, specificity, positive predictive value, and negative predictive value. The observation that the positive predictive value was lower than the negative predictive value suggests that the probability of false negatives is low. Consequently, this system can be regarded as a relatively sensitive screening method.
3.7. The POP Concentration Level Measured with This System and Its Practical Applications
The objective of this investigation was to ascertain the POP concentration level that can be determined when a low concentration of POPs is added to the system. A total of 20 nanograms of a mixture of eight POPs was added as an absolute amount; however, this absolute amount was subsequently adjusted to 2 nanograms, 0.2 nanograms, 0.02 nanograms, and so forth to obtain the correct answer rate and the matching rate. The percentage of correct answers and the percentage of conformity were determined by changing the absolute amount to 2 ng, 0.2 ng, and 0.02 ng. A total of twenty-six samples were assessed in this study, encompassing soot and dust, waste soot and dust, cinders, mineral dust, waste incineration ash, sludge (non-construction), and sludge (construction). Based on the results presented in Table 2, the percentages of correct answers were determined to be 92.3% (2 ng added), 73.1% (0.2 ng added), and 69.2% (0.02 ng added). The mean and standard deviation of the percentage matching were 93.4% ± 11.5% (2 ng added), 92.5% ± 10.2% (0.2 ng added), and 86.0% ± 14.0% (0.02 ng added). The calculated percentage exhibited a negative correlation with the amount added, and there was substantial variation in the percentage matching. The POPs incorporated into this experiment were pesticides, which are governed by the Low POP Content (LPC) standard established by the Basel Convention.

Table 2.
Analysis results for POP concentration level. correct: ○, false: ×.
This standard delineates the concentration threshold at which POP-containing waste should be deemed suitable for treatment using the decomposition technology stipulated within the guidelines. The LPC is also a criterion for confirming that POPs have undergone sufficient decomposition and treatment, since the concentration of POPs in residues after such treatment of POPs in waste materials must be below the LPC. This ensures that the characteristics of POPs are no longer exhibited. The LPC for pesticide-based POPs is 50 mg/kg, and this concentration was utilized as the standard for the detection limit of the system under investigation. In this experiment, where 20 ng of each POP was added to 0.5 g of sample, the concentration was 1/125th that of LPC, suggesting that the lower limit of detection, judged according to the percentage of correct responses or matches, is 1/1250th that of LPC when 2 ng is added.
4. Conclusions
A method for the screening of incoming waste for the presence of POPs was the subject of this study. Given that the screening inspection should be executed at the time of delivery, the emphasis was placed on the rapid and precise acquisition of results. In summary, we have developed a methodology for the automated discrimination of EEM through machine learning algorithms. This approach has been found to achieve a high degree of accuracy in the identification of POPs for screening purposes, with a success rate exceeding 75% and a specificity rate of over 80%. However, it should be noted that the efficacy of this method is contingent upon the specific conditions under which it is employed. The concentration of POPs at which the model demonstrated a significant discriminatory capacity was found to be considerably lower than that of LPC, thereby underscoring the feasibility of this method for practical applications. When applied to actual delivery scenarios, this method is estimated to yield a discrimination result in approximately 10 min following sample collection. It is important to acknowledge that the fundamental objective of this experimental system was to ascertain the distinction between the presence and absence of POPs, rather than focusing on the initial presence of POPs in the waste sample. It is currently unknown whether the criteria used by the AI are based on differences in spectral shape or fluorescence intensity resulting from the addition or non-addition of POPs. In conclusion, we underscore that the proposed approach is intended for qualitative screening purposes and should not be regarded as a substitute for quantitative analytical methods.
Supplementary Materials
The following supporting information can be downloaded at: https://www.mdpi.com/article/10.3390/pollutants5030031/s1.
Author Contributions
Conceptualization, methodology, writing—original draft preparation, M.Y.; writing—review and editing, S.S.; supervision, K.N.; project administration, S.N.; funding acquisition, W.N. All authors have read and agreed to the published version of the manuscript.
Funding
This research was funded by the Hiroshima Prefectural Environmental Conservation Corporation Proposal-based Research Grant Program.
Data Availability Statement
Data are available on request.
Acknowledgments
We would like to express our gratitude to the Hiroshima Prefectural Environmental Protection Corporation for providing us with the samples we used.
Conflicts of Interest
The authors declare no conflicts of interest.
Abbreviations
The following abbreviations are used in this manuscript:
| POPs | Persistent organic pollutants |
| GCMS | Gas chromatography/mass spectrometry |
| LCMS | Liquid chromatography/mass spectrometry |
| EEM | Excitation–emission matrix |
| AP | Added POPs sample |
| NP | No added POPs sample |
References
- Weber, R.; Girones, L.; Förstner, U.; Tysklind, M.; Laner, D.; Hollert, H.; Forter, M.; Vijgen, J. Review on the need for inventories and management of reservoirs of POPs and other persistent, bioaccumulating and toxic substances (PBTs) in the face of climate change. Environ. Sci. Eur. 2025, 37, 48. [Google Scholar] [CrossRef]
- Rashed, M.N. (Ed.) Persistent Organic Pollutants (POPs)—Monitoring, Impact and Treatment; IntechOpen: London, UK, 2022. [Google Scholar] [CrossRef]
- Dioxins and PCBs. Available online: https://www.efsa.europa.eu/en/topics/topic/dioxins-and-pcbs (accessed on 22 August 2025).
- Li, L.; Chen, C.; Li, D.; Breivik, K.; Abbasi, G.; Li, Y. What do we know about the production and release of persistent organic pollutants in the global environment? Environ. Sci. Adv. 2023, 2, 55–68. [Google Scholar] [CrossRef]
- Akinrinade, O.E.; Agunbiade, F.O.; Alani, R.; Ayejuyo, O.O. Implementation of the Stockholm Convention on persistent organic pollutants (POPs) in Africa—Progress, challenges, and recommendations after 20 years. Environ. Sci. Adv. 2024, 3, 623–634. [Google Scholar] [CrossRef]
- Guardans, R. Global monitoring of persistent organic pollutants (POPs) in biota, water and sediments: Its role in screening for unregulated POPs, in compiling time trends of regulated POPs under the Stockholm Convention (SC) and their relevance for biodiversity in a changing climate. Environ. Sci. Adv. 2024, 3, 1111–1123. [Google Scholar] [CrossRef]
- Teranishi, T. Trends in POPs Waste and Actions by Japan’s Ministry of the Environment. J. Mater. Cycles Waste 2021, 32, 3–7. (In Japanese) [Google Scholar] [CrossRef]
- Ministry of Environment, Japan. The National Implementation Plan of Japan Under the Stockholm Convention on Persistent Organic Pollutants. Available online: https://www.env.go.jp/content/000158608.pdf (accessed on 22 August 2025).
- Dvorská, A.; Sír, M.; Honzajková, Z.; Komprda, J.; Cupr, P.; Petrlík, J.; Anakhasyan, E.; Simonyan, L.; Kubal, M. Obsolete pesticide storage sites and their POP release into the environment—An Armenian case study. Environ. Sci. Pollut. Res. 2012, 19, 1944–1952. [Google Scholar] [CrossRef]
- UNEP. Module 5: Remediation Technologies and Techniques for POPs-Contaminated Sites, Stockholm Convention. Available online: https://www.pops.int/Implementation/BATandBEP/POPscontaminatedsites/Guidance/tabid/9649/Default.aspx (accessed on 22 August 2025).
- Castrejón-Godínez, M.L.; Rodríguez, A.; Sánchez-Salinas, E.; Mussali-Galante, P.; Tovar-Sánchez, E.; Laura Ortiz-Hernández, M. Soils Contaminated with Persistent Organic Pollutants (POPs): Current Situations, Management, and Bioremediation Techniques: A Mexican Case Study. In Pesticides Bioremediation; Springer: Berlin/Heidelberg, Germany, 2022. [Google Scholar]
- Ministry of Environment. POPs. Available online: https://www.env.go.jp/chemi/pops/ (accessed on 24 July 2025).
- Zhao, B.; Hu, X.; Lu, J. Analysis and discussion on formation and control of dioxins generated from municipal solid waste incineration process. J. Air Waste Manag. Assoc. 2022, 72, 1063–1082. [Google Scholar] [CrossRef] [PubMed]
- Zamrisham, N.A.F.; Wahab, A.M.A.; Zainal, A.; Karadag, D.; Bhutada, D.; Suhartini, S.; Musa, M.A.; Idrus, S. State of the Art in Anaerobic Treatment of Landfill Leachate: A Review on Integrated System, Additive Substances, and Machine Learning Application. Water 2023, 15, 1303. [Google Scholar] [CrossRef]
- EPA. Persistent Organic Pollutants, Landfill Leachate Sampling Study. Available online: https://www.epa.ie/publications/monitoring--assessment/waste/persistent-organic-pollutants-landfill-leachate-sampling-study.php (accessed on 24 July 2025).
- Peterson, J. Rapid Determination of Persistent Organic Pollutants (POPs) Using Accelerated Solvent Extraction, Thermo Fisher Application Note352. Available online: https://tools.thermofisher.com/content/sfs/brochures/AN-352-Determination-POPs-ASE-AN71008-E.pdf (accessed on 22 August 2025).
- Liu, C.; Yao, J.; Šolević Knudsen, T. Quantification of Persistent Organic Pollutants by Microwave Extraction and Soxhlet Extraction in Tailing Samples in Nandan County, Guangxi Province, China. Water Air Soil Pollut. 2024, 235, 15. [Google Scholar] [CrossRef]
- Ruan, K.; Zhao, S.; Jiang, X.; Li, Y.; Fei, J.; Ou, D.; Tang, Q.; Lu, Z.; Liu, T.; Xia, J. A 3D Fluorescence Classification and Component Prediction Method Based on VGG Convolutional Neural Network and PARAFAC Analysis Method. Appl. Sci. 2022, 12, 4886. [Google Scholar] [CrossRef]
- Rossi, G.; Durek, J.; Ojha, S.; Schlüter, O.K. Fluorescence-based characterisation of selected edible insect species: Excitation emission matrix (EEM) and parallel factor (PARAFAC) analysis. Curr. Res. Food Sci. 2021, 4, 862–872. [Google Scholar] [CrossRef] [PubMed]
- Nagi, J.; Ahmed, S.K.; Nagi, F. A MATLAB based Face Recognition System using Image Processing and Neural Networks. In Proceedings of the 4th International Colloquium on Signal Processing and Its Applications, Kuala Lumpur, Malaysia, 7–9 March 2008; pp. 83–88. [Google Scholar]
- Wu, X.; Zhao, Z.; Tian, R.; Shang, Z.; Liu, H. Identification and quantification of counterfeit sesame oil by 3D fluorescence spectroscopy and convolutional neural network. Food Chem. 2020, 311, 125882. [Google Scholar] [CrossRef] [PubMed]
- Monami, A.; Atsushi, H.; Mayuko, Y. Machine learning-based identification of pesticide presence in river water using excitation-emission matrix image analysis. Intell. Inform. Infrastruct. 2024, 5, 1–9. [Google Scholar] [CrossRef]
- Röder, L.L.; Fischer, H. Theoretical investigation of applicability and limitations of advanced noise reduction methods for wavelength modulation spectroscopy. Appl. Phys. B 2022, 128, 10. [Google Scholar] [CrossRef]
Disclaimer/Publisher’s Note: The statements, opinions and data contained in all publications are solely those of the individual author(s) and contributor(s) and not of MDPI and/or the editor(s). MDPI and/or the editor(s) disclaim responsibility for any injury to people or property resulting from any ideas, methods, instructions or products referred to in the content. |
© 2025 by the authors. Licensee MDPI, Basel, Switzerland. This article is an open access article distributed under the terms and conditions of the Creative Commons Attribution (CC BY) license (https://creativecommons.org/licenses/by/4.0/).