Review

Impact of Nitrogen Fertiliser Usage in Agriculture on Water Quality

by
Opeyemi Adebanjo-Aina
and
Oluseye Oludoye
*
School of Health & Life Sciences, Teesside University, Middlesbrough TS1 3BX, UK
*
Author to whom correspondence should be addressed.
Pollutants 2025, 5(3), 21; https://doi.org/10.3390/pollutants5030021
Submission received: 5 April 2025 / Revised: 16 June 2025 / Accepted: 30 June 2025 / Published: 14 July 2025

Abstract

Agriculture relies on the widespread application of nitrogen fertilisers to improve crop yields and meet the demands of a growing population. However, the excessive use of these fertilisers has led to significant water quality challenges, posing risks to aquatic life, ecosystems, and human health. This study examines the relationship between synthetic nitrogen fertiliser usage and water pollution while identifying gaps in existing research to guide future studies. A systematic search across databases (Scopus, Web of Science, and Greenfile) identified 18 studies with quantitative data, synthesised using a single-group meta-analysis of means. As the data were continuous, the mean was used as the effect measure, and a random-effects model was applied due to varied study populations, with missing data estimated through statistical assumptions. The meta-analysis found an average nitrate concentration of 34.283 mg/L (95% confidence interval: 29.290–39.276), demonstrating the significant impact of nitrogen fertilisers on water quality. While this average remains marginally below the thresholds set by the World Health Organization (50 mg/L NO3) and EU Nitrate Directive, it exceeds the United States Environmental Protection Agency limit (44.3 mg/L NO3), signalling potential health risks, especially in vulnerable or unregulated regions. The high observed heterogeneity (I2 = 100%) suggests that factors such as soil type, agricultural practices, application rate, and environmental conditions influence nitrate levels. While agriculture is a key contributor, other anthropogenic activities may also affect nitrate concentrations. Future research should comprehensively assess all influencing factors to determine the precise impact of nitrogen fertilisers on water quality.

1. Introduction

Water is essential to life, playing a pivotal role in biological activities, including agriculture, and covering a significant portion of the Earth’s surface [1]. Water quality is determined by its physical, biological, and chemical properties, alongside aesthetic factors such as appearance and odour [2]. Its quality is critical due to its widespread application in human consumption, environmental sustainability, industrial use, and the preservation of aquatic ecosystems [3]. Globally, water issues persist and continue to expand, negatively impacting human well-being, economic prosperity, and national security [4]. The deterioration of water quality has become a growing concern, driven by population growth, industrial expansion, agricultural intensification, and climate change [3]. Global water demand is projected to increase by 30% to 50% by 2050, with agriculture accounting for a major share due to rising food demand [5]. Only 3% of the Earth’s water is freshwater [4], meaning its availability varies significantly across regions, making water as vital as food production.
Agriculture is crucial in human survival and economic development, addressing food security, poverty alleviation, and environmental sustainability. However, agricultural practices can also contribute to environmental degradation, particularly affecting water quality. The global population is predicted to reach 8.5 billion by 2030 and 9.7 billion by 2050 [6], further straining agricultural resources. This population surge has intensified pressure on food production and land availability, as infrastructure developments such as housing, roads, industries, and healthcare facilities consume a growing share of available land. To meet increasing food demands, the agricultural sector has heavily relied on nitrogen fertilisers to enhance crop yields. The Green Revolution of the mid-20th century introduced synthetic nitrogen fertilisers, significantly improving crop productivity and reducing food insecurity [7]. While these innovations have boosted agricultural output, they have also caused unintended environmental consequences, particularly concerning water quality.
Nitrogen fertilisers are mainly produced using the Haber–Bosch process, where nitrogen ( N 2 ) reacts with hydrogen ( H 2 ) to form ammonia ( N H 3 ) [8]. This process involves natural gas reacting with atmospheric nitrogen, yielding ammonia and carbon dioxide as by-products [9]. Ammonia is oxidised to form nitric acid, which is then combined with additional ammonia to produce ammonium nitrate [10]. Nitrogen is a fundamental nutrient required for plant growth. It forms amino acids, enzymes, proteins, and chlorophyll, which are vital for photosynthesis [11]. Despite the soil’s natural nutrient composition, nitrogen remains a limiting factor for crop productivity [12]. To address this limitation, the application of nitrogen fertilisers has surged, from 10 Tg N in 1961 to 77 Tg N in 2016 [13]. Nevertheless, excessive fertiliser use poses major environmental risks. Once applied, crops either absorb nitrogen fertilisers or undergo oxidation, leaching, and volatilisation. Approximately 50% of the applied fertiliser remains unused by crops, escaping into the environment through evaporation, runoff, or groundwater infiltration [13,14,15]. Balancing optimal nitrogen supply with minimal environmental losses remains challenging [16].
There are three primary nitrogen-related water quality concerns: nitrate and nitrite contamination, un-ionised ammonia pollution, and total nitrogen accumulation [17]. When nitrogen fertiliser is introduced into the environment, it undergoes chemical transformations and is transported through ecosystems. The primary nitrogen forms, nitrate, ammonia, and ammonium [18], interact differently with soil and water systems. Understanding the fate and transport of nitrogen fertiliser in soil is essential not only for maximising crop productivity but also for minimising its environmental impact [12,19]. Ammonia is converted to nitrite and then to nitrate via nitrification, facilitating plant absorption. However, nitrate is highly soluble and mobile, making it prone to leaching into groundwater and surface water [20]. Excess nitrate in water systems negatively affects both aquatic ecosystems and human health [21].
Agricultural intensification, particularly fertiliser overuse, has been identified as a major contributor to water pollution through the release of nutrients into the watercourse [22]. Globally, agriculture is the leading source of nitrogen influx into freshwater and marine ecosystems [23]. Excess nitrogen runoff can cause eutrophication, disrupting aquatic biodiversity, reducing oxygen levels, and promoting harmful algal blooms (HABs) [24]. These blooms threaten marine ecosystems, fisheries, and drinking water sources, often leading to severe hypoxic and anoxic conditions [25]. Nitrate infiltration into groundwater contaminates drinking water [26], posing severe health risks. Research indicates that nitrate pollution is linked to serious health concerns, particularly in vulnerable populations [27]; the study in India’s Indo-Gangetic Plains (IGPs) region found that 27% of children, 19% of men, and 16% of women may be affected by nitrate exposure, with agriculture identified as the primary source [27]. Although the link between nitrogen fertiliser use and water pollution has been well documented in previous research, a systematic and quantitative synthesis of recent evidence, particularly from 2020 onward, remains lacking. Existing reviews often provide narrative summaries or focus on non-agricultural nitrogen sources such as sewage effluent or livestock manure, leaving a critical gap in our understanding of how synthetic nitrogen fertiliser alone affects water quality across diverse geographies. Moreover, few studies employ a formal meta-analytic approach that pools nitrate concentration data using robust statistical models suited to environmental sciences, such as single-group random-effects models. This review addresses that gap by systematically identifying and analysing empirical studies published between 2020 and 2024, thereby capturing the most up-to-date data under current global conditions, including climate-related shifts in nitrogen transport. In doing so, it provides a statistically grounded benchmark for nitrate concentrations in agricultural water bodies exposed to synthetic fertiliser use, offering timely insights for researchers, policymakers, and agricultural practitioners seeking to balance food security with water quality protection. While extensive research has examined the impact of nitrogen fertiliser on water quality, notable knowledge gaps persist, particularly in relation to the variability of nitrogen pollution across diverse ecosystems. This study conducts a systematic evaluation and synthesis of the existing literature to assess the environmental consequences of nitrogen fertiliser application, with a specific focus on water quality. It identifies areas where current research remains insufficient or inconclusive, offering recommendations to guide future investigations into the effects of fertiliser use on water quality.
This research will contribute to sustainable agricultural practices, policymaking, and environmental protection. It provides guidance for farmers, policymakers, and environmental organisations on balancing food security with water conservation.

2. Materials and Methods

A systematic review involves the rigorous collection and analysis of existing evidence to identify knowledge gaps and inform the development of future research directions [28] based on certain eligibility criteria to address a research problem. Meta-analysis, as part of the review, combines quantitative results from multiple studies to produce a more comprehensive understanding. Although traditionally used in health sciences, other disciplines have adopted systematic reviews [29] due to their evidence-based benefits. For example, a systematic review conducted on human adaptation to climate change in forest contexts [30].
This study adopted meta-analysis and followed the PRISMA (Preferred Reporting Items for Systematic Reviews and Meta-Analyses) guidelines [31], with a flowchart presented in Figure 1.

2.1. Search Strategy

The literature search was conducted across three databases: Scopus (Elsevier, Amsterdam, The Netherlands), Web of Science (Clarivate, London, UK), and GreenFILE (EBSCOHOST, Ipswich, MA, USA), covering the years 2020 to 2024. The timeframe (2020–2024) was selected in response to the increasing frequency of extreme weather events and the growing impact of agricultural activities on aquatic ecosystems [32,33], driven by rising population pressures. These databases were chosen for their broad coverage of scientific publications, particularly environmental science, with large numbers of publication records and subject areas. This diverse selection minimised selection bias and improved the quality of the review [34]. Each database has its strengths; for example, Scopus stands as the largest abstract and citation database of the peer-reviewed literature, encompassing 20,500 journals across STEM and social sciences, Web of Science covers 12,000+ journals across disciplines, and GreenFILE specialises in environmental studies [35,36,37,38,39].
The initial keyword combinations based on the research objectives included terms such as fertilizer, agricultural fertilizer, NPK fertilizer, water pollution, water quality, water contamination, extreme weather events, climate change, and climate condition. This broad approach was designed to capture the context of nitrogen fertiliser use within the bigger picture of climate change and growing food demand, an idea that stemmed from the study’s background. Keywords were combined using Boolean operators to construct search strings, which were then applied to searches on ScienceDirect (Table A1).
Following an initial screening of abstracts from the period 2020–2024, it was observed that a substantial number of retrieved articles were not directly relevant to the research focus, instead addressing topics such as engineering, microorganisms, and the economic dimensions of fertiliser use. However, additional relevant keywords such as watershed, catchment, and nitrate were identified within the retrieved records as being more closely aligned with the study’s objectives. These terms were subsequently incorporated to refine a second round of searches across various databases (Table A1). Despite this refinement, a considerable portion of the literature remained centered on broader themes, including storms, flooding, and general water resource management.
To achieve a balanced search strategy that maintained both precision and sensitivity, reducing the risk of bias in identifying relevant evidence, the Population, Intervention, Control, and Outcome (PICO) framework was adapted to suit the specific research context. In this study, “Population” was redefined as agriculture, “Intervention” as nitrogen fertiliser usage, and “Outcome” as the impact on water quality. Web-based searches were conducted to identify related synonyms, which were then used to construct comprehensive search strings applicable across all selected databases (Table A2). The keywords for the literature search were combined using Boolean operators (AND, OR) to retrieve a more relevant and specific set of studies as presented in Table A3.
The search, conducted on 23 February 2024, retrieved 681 English published records: 514 from Scopus, 131 from Web of Science, and 36 from GreenFILE. Duplicates were initially removed using RefWorks (56 records), followed by manual review using Microsoft Excel, but it was discovered at the screening phase that there are more duplicates. This necessitated the use of Microsoft Excel to identify the duplicates. This investigation revealed that there are cases where the following occur:
  • Sign language on letters cause discrepancies, causing RefWorks to recognize them as different articles: For example, Author name “Lawniczak-Malinska, A.; Nowak, B.; Pajewski, K.” on Web of Science and “Lawniczak-Malińska, A.; Nowak, B.; Pajewski, K.” on Scopus, if you take a deep look at the bolded part you will notice a difference of language sign on letter “n”;
  • There are cases where the author’s name is the same, but there is a difference in the title name due to a language sign in the letter and a missing letter. For example, the title name “Modelling impacts of a municipal spatial plan of land-use changes on surface water quality-example from Goriška Brda in Slovenia” on Scopus and “Modelling Impacts of a Municipal Spatial Plan of Land-Use Changes on Surface Water Quality-Example from Gorika Brda in Slovenia” on Web of Science. Again, if you check the bolded part, the sign language and misspelling caused the discrepancy;
  • There is a case where the title is the same, and the abstract seems different, but after reading through both, it was clear that the abstract is the same. For example, “Assessment of extrinsic and intrinsic influences on water quality variation in subtropical agricultural multipond systems,” on GREENFILLE and “Assessment of extrinsic and intrinsic influences on water quality variation in subtropical agricultural multipond systems” on Scopus.
The investigation using Excel, in conjunction with manual screening of article abstracts, demonstrated that relying solely on automated duplicate removal carries the risk of repetitive selection, which may compromise the quality of a systematic review. In such instances, abstract and full-text screening were employed to determine whether articles were genuinely distinct or duplicates. Through this manual verification process, an additional 57 duplicate records were identified, resulting in a final total of 568 records to be screened against the predefined inclusion and exclusion criteria.

2.2. Screening

The screening phase involved two stages: initial screening based on title and abstract, followed by full-text screening. A total of 568 records were initially screened by title and abstract, resulting in the exclusion of 369 records. Subsequent full-text screening was conducted on the remaining articles, with a further 171 records excluded based on the predefined inclusion and exclusion criteria outlined in Table A4.

2.3. Quality Assessment

A modified Newcastle–Ottawa Scale (NOS) for environmental research was used to assess the quality of included studies. The evaluation criteria included geographic representativeness, exposure definition and justification, environmental conditions description, sampling methodology, confounder control, comparison across exposure gradients, outcome measure reliability, and data collection suitability. Only studies that met the criteria and provided the variables needed for meta-analysis were included, as reflected in the PRISMA flowchart.

2.4. Statistical Analysis

2.4.1. Data Synthesis

In total, 18 studies met the inclusion criteria and provided data suitable for meta-analysis. Data extraction for this review was conducted independently by a single reviewer using a structured data extraction form (Table A5).

2.4.2. Missing Data

All included data were continuous and consistently described with statistical variables including mean, sample size, and standard deviation. In studies where the standard deviation was not reported, further assumptions and calculations were necessary. When only minimum and maximum values were provided, a normal distribution was assumed [40] to estimate the standard deviation, as shown in Equation (1).
Range = Max Min Standard   deviation   ( σ ) = R a n g e 6
In cases where studies reported multiple mean values, these were combined using Equation (2) [41].
Combined   mean   χ c = M . χ a + ( N . χ b ) ( M + N )
where M and N represent the respective sample sizes, and χ a and χ b are the respective mean values.
In cases where studies were conducted on more than one sample, multiple standard deviations were reported. In these instances, the pooled variance was used using Equation (3)
V a r P o o l e d = n a 1 X S D a 2 + n b 1 X S D b 2 n a + n b 2
where S D a and S D b   are   the   respective   standard   deviations . Since standard deviation is a function of variance, then the combined standard deviation is calculated as Equation (4).
S D c = V a r P o o l e d  
In studies where combined mean values were reported for varying sample sizes ranging from 1 to 13, the mean for a sample size of 1 is assumed to represent the single value recorded, denoted as Equation (5):
χ = x n = x 1 = x
where χ = mean; x = nitrate concentration; and n = sample size.
In situation where 1 sample size is reported, the standard deviation is assumed to be zero, denoted as Equation (6).
S D = ( x i χ ) 2 n 1 S D = ( x i χ ) 2 1 1 = ( x i χ ) 2 0 S D = 0
A study provided its results in microgram per litre ( μ / l ) and was converted into milligram per litre (mg/ l ).

2.5. Meta-Analysis Model

Given that the dataset comprises continuous variables extracted from 18 distinct studies, the application of a random-effects model for meta-analysis is justified [42]. However, as the data consist solely of intervention group results focused on nitrate concentrations—without corresponding control groups—a traditional comparative meta-analysis is not feasible. In such cases, a single-arm meta-analysis presents a suitable alternative, despite its inherent limitations.
Single-arm meta-analyses, also referred to as single-group or single-proportion meta-analyses, are commonly employed across various disciplines, particularly in healthcare research [43,44,45]. These analyses typically utilise effect measures such as risk ratios, odds ratios, or response rates, which are most appropriate for dichotomous data types. However, the selection of an effect measure must align with the nature of the data under review [42].
In the context of this study, where the available data are continuous and pertain to nitrate concentrations, a single-arm meta-analysis using a mean effect measure was deemed the most appropriate methodological approach.
A random-effects model was employed to analyse the synthesised data from the 18 included studies, using the mean effect size index. This approach was based on the assumption that the selected studies represent a random sample drawn from a broader population of water sources [46,47,48,49].
The meta-analysis was conducted using Comprehensive Meta-Analysis (CMA) software 3.0, configured specifically for single-group continuous data using a mean effect measure. The software automatically computed the standard error of the mean using the following equation:
S t e r r = S D n
where S t e r r is the standard error, SD is the standard deviation, and n is the sample size.

3. Results

3.1. Characteristics of the Included Studies

The final meta-analysis included 18 studies, representing a range of geographical locations, justifying the use of a random-effects model.
Quality assessment using an environmentally adapted version of the Newcastle–Ottawa Scale yielded scores ranging from 4 to 9, indicating that all included studies were of moderate to high quality. The criteria used in this assessment are provided in Appendix B.

3.2. Results of the Meta-Analysis

Nitrate was the most consistently reported nitrogen form in the studies, as it represents the standard form of nitrogen fertiliser used up by plants and reaches both ground and surface water. Table 1 presents the synthesised nitrate concentration data, including study ID, sample size, mean, and standard deviation.

3.2.1. Correlation Between Nitrogen Fertiliser Use and Water Pollution

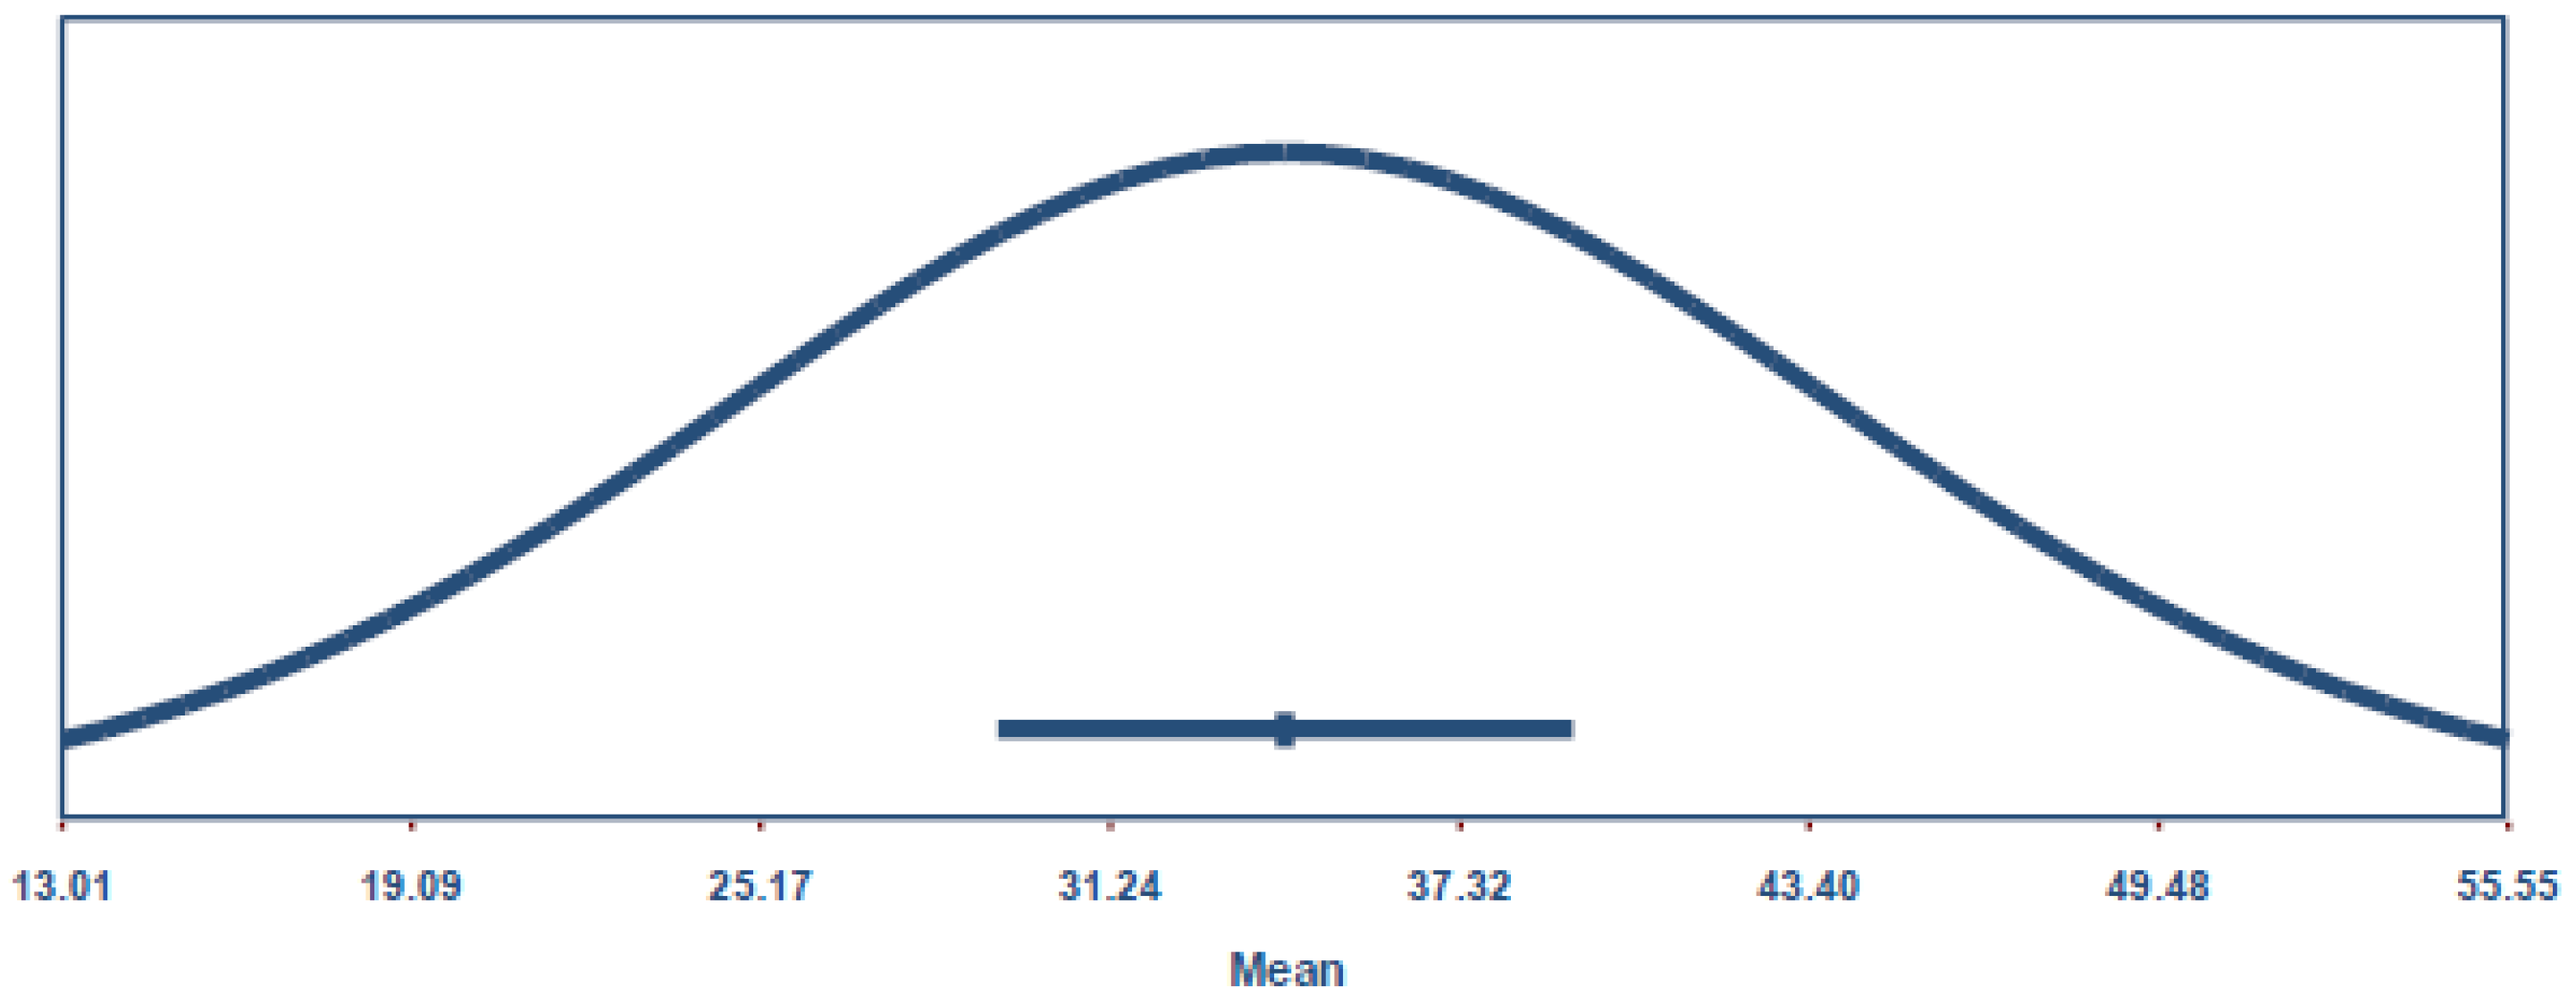
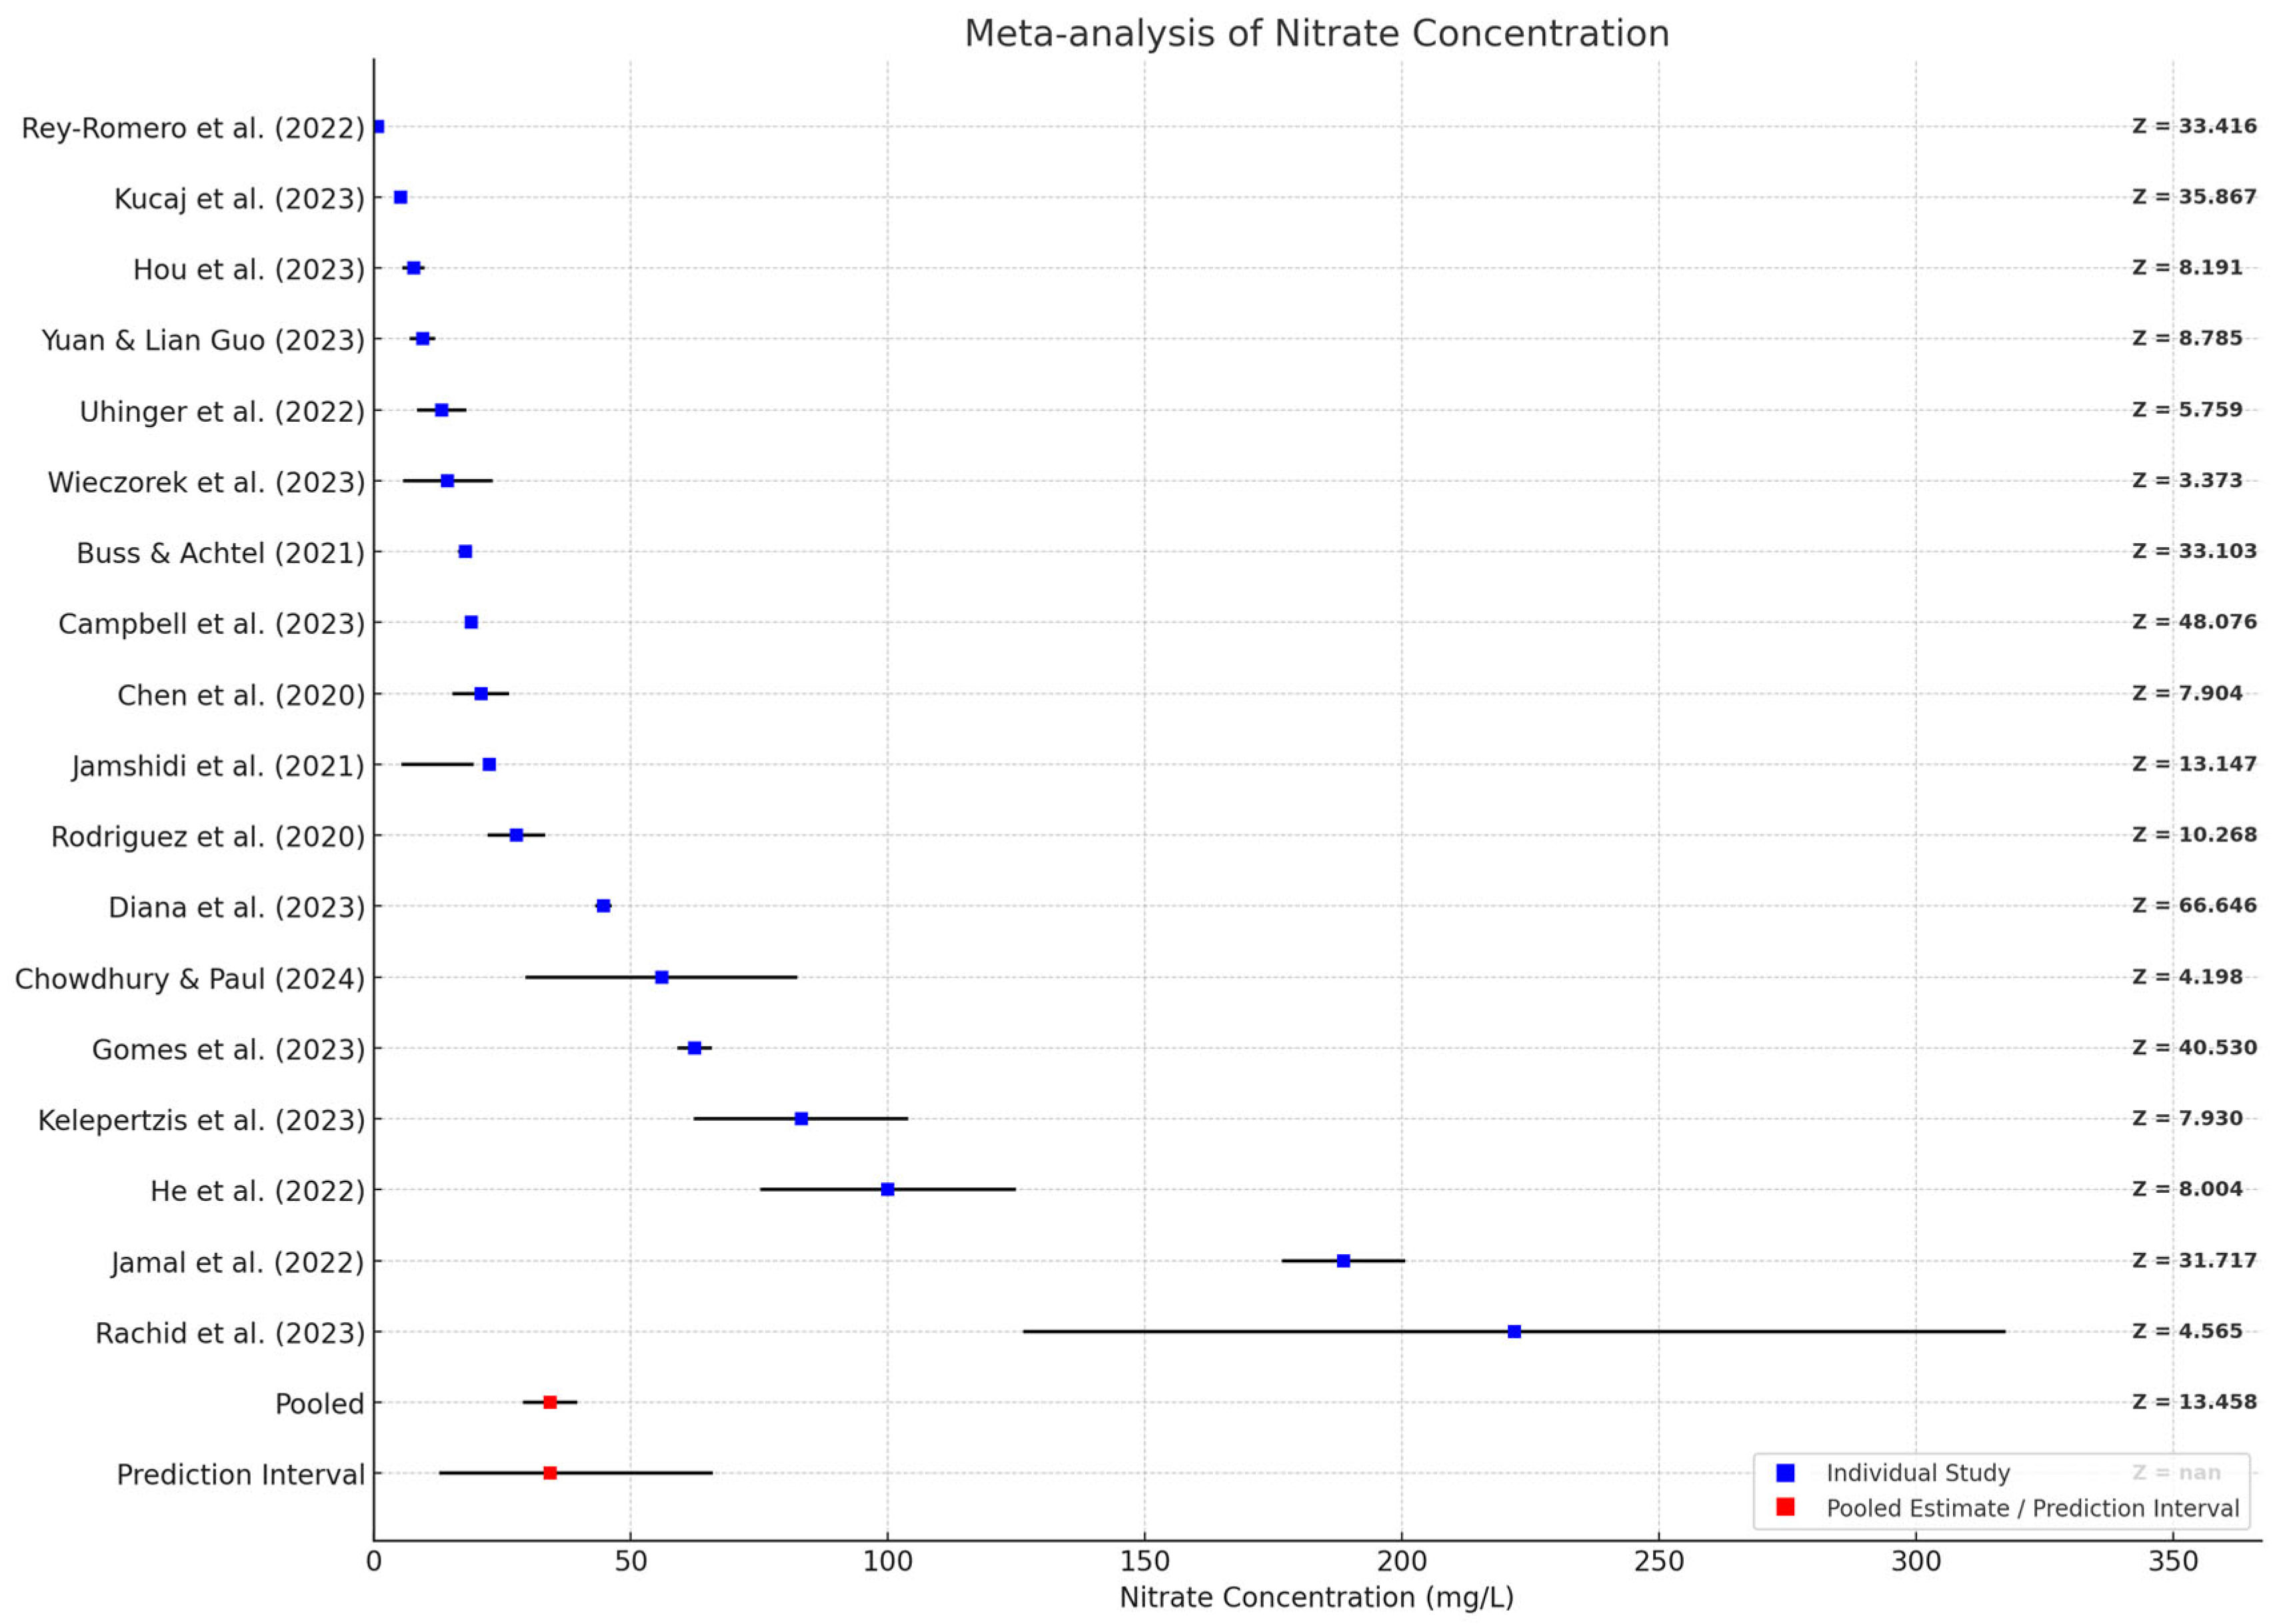
All 18 studies examined water sources in agricultural settings where nitrogen fertiliser was applied. The average nitrate concentration observed across the 18 studies was 34.283 mg/L, with a 95% confidence interval (CI) of 29.290 to 39.276 mg/L, as shown in Figure 2, indicating a statistically significant effect of nitrogen fertiliser use on water pollution. This analysis confirmed a positive correlation between fertiliser usage and elevated nitrate levels in water bodies.
Figure 3 shows that the meta-analysis produced a Z-value of 13.458 (p < 0.001), rejecting the null hypothesis and confirming that the mean nitrate concentration across the various sampled water sources is significantly different from zero.

3.2.2. Future Direction on the Impact of Fertiliser Use on Water Quality

A high degree of heterogeneity was observed among the studies. The Q-value was 11,453.208 (df = 17, p < 0.001), and the I2 statistic was 100%, indicating substantial variability in nitrate concentrations across studies.
The variance of the nitrate concentration among studies, Tau2, was 94.172, and the Tau (standard deviation) was 9.704, confirming the presence of wide dispersion in effects. The prediction interval (13.014 to 55.552) further reconfirms the likelihood of variability, which may be due to different environmental, methodological, or geographic factors.

3.3. Sensitivity Analysis

A sensitivity analysis was conducted to assess the robustness of the findings. The relative weight of each study (Figure 4) showed that no single study excessively influenced the results, demonstrating that all studies contributed meaningfully to the meta-analysis.
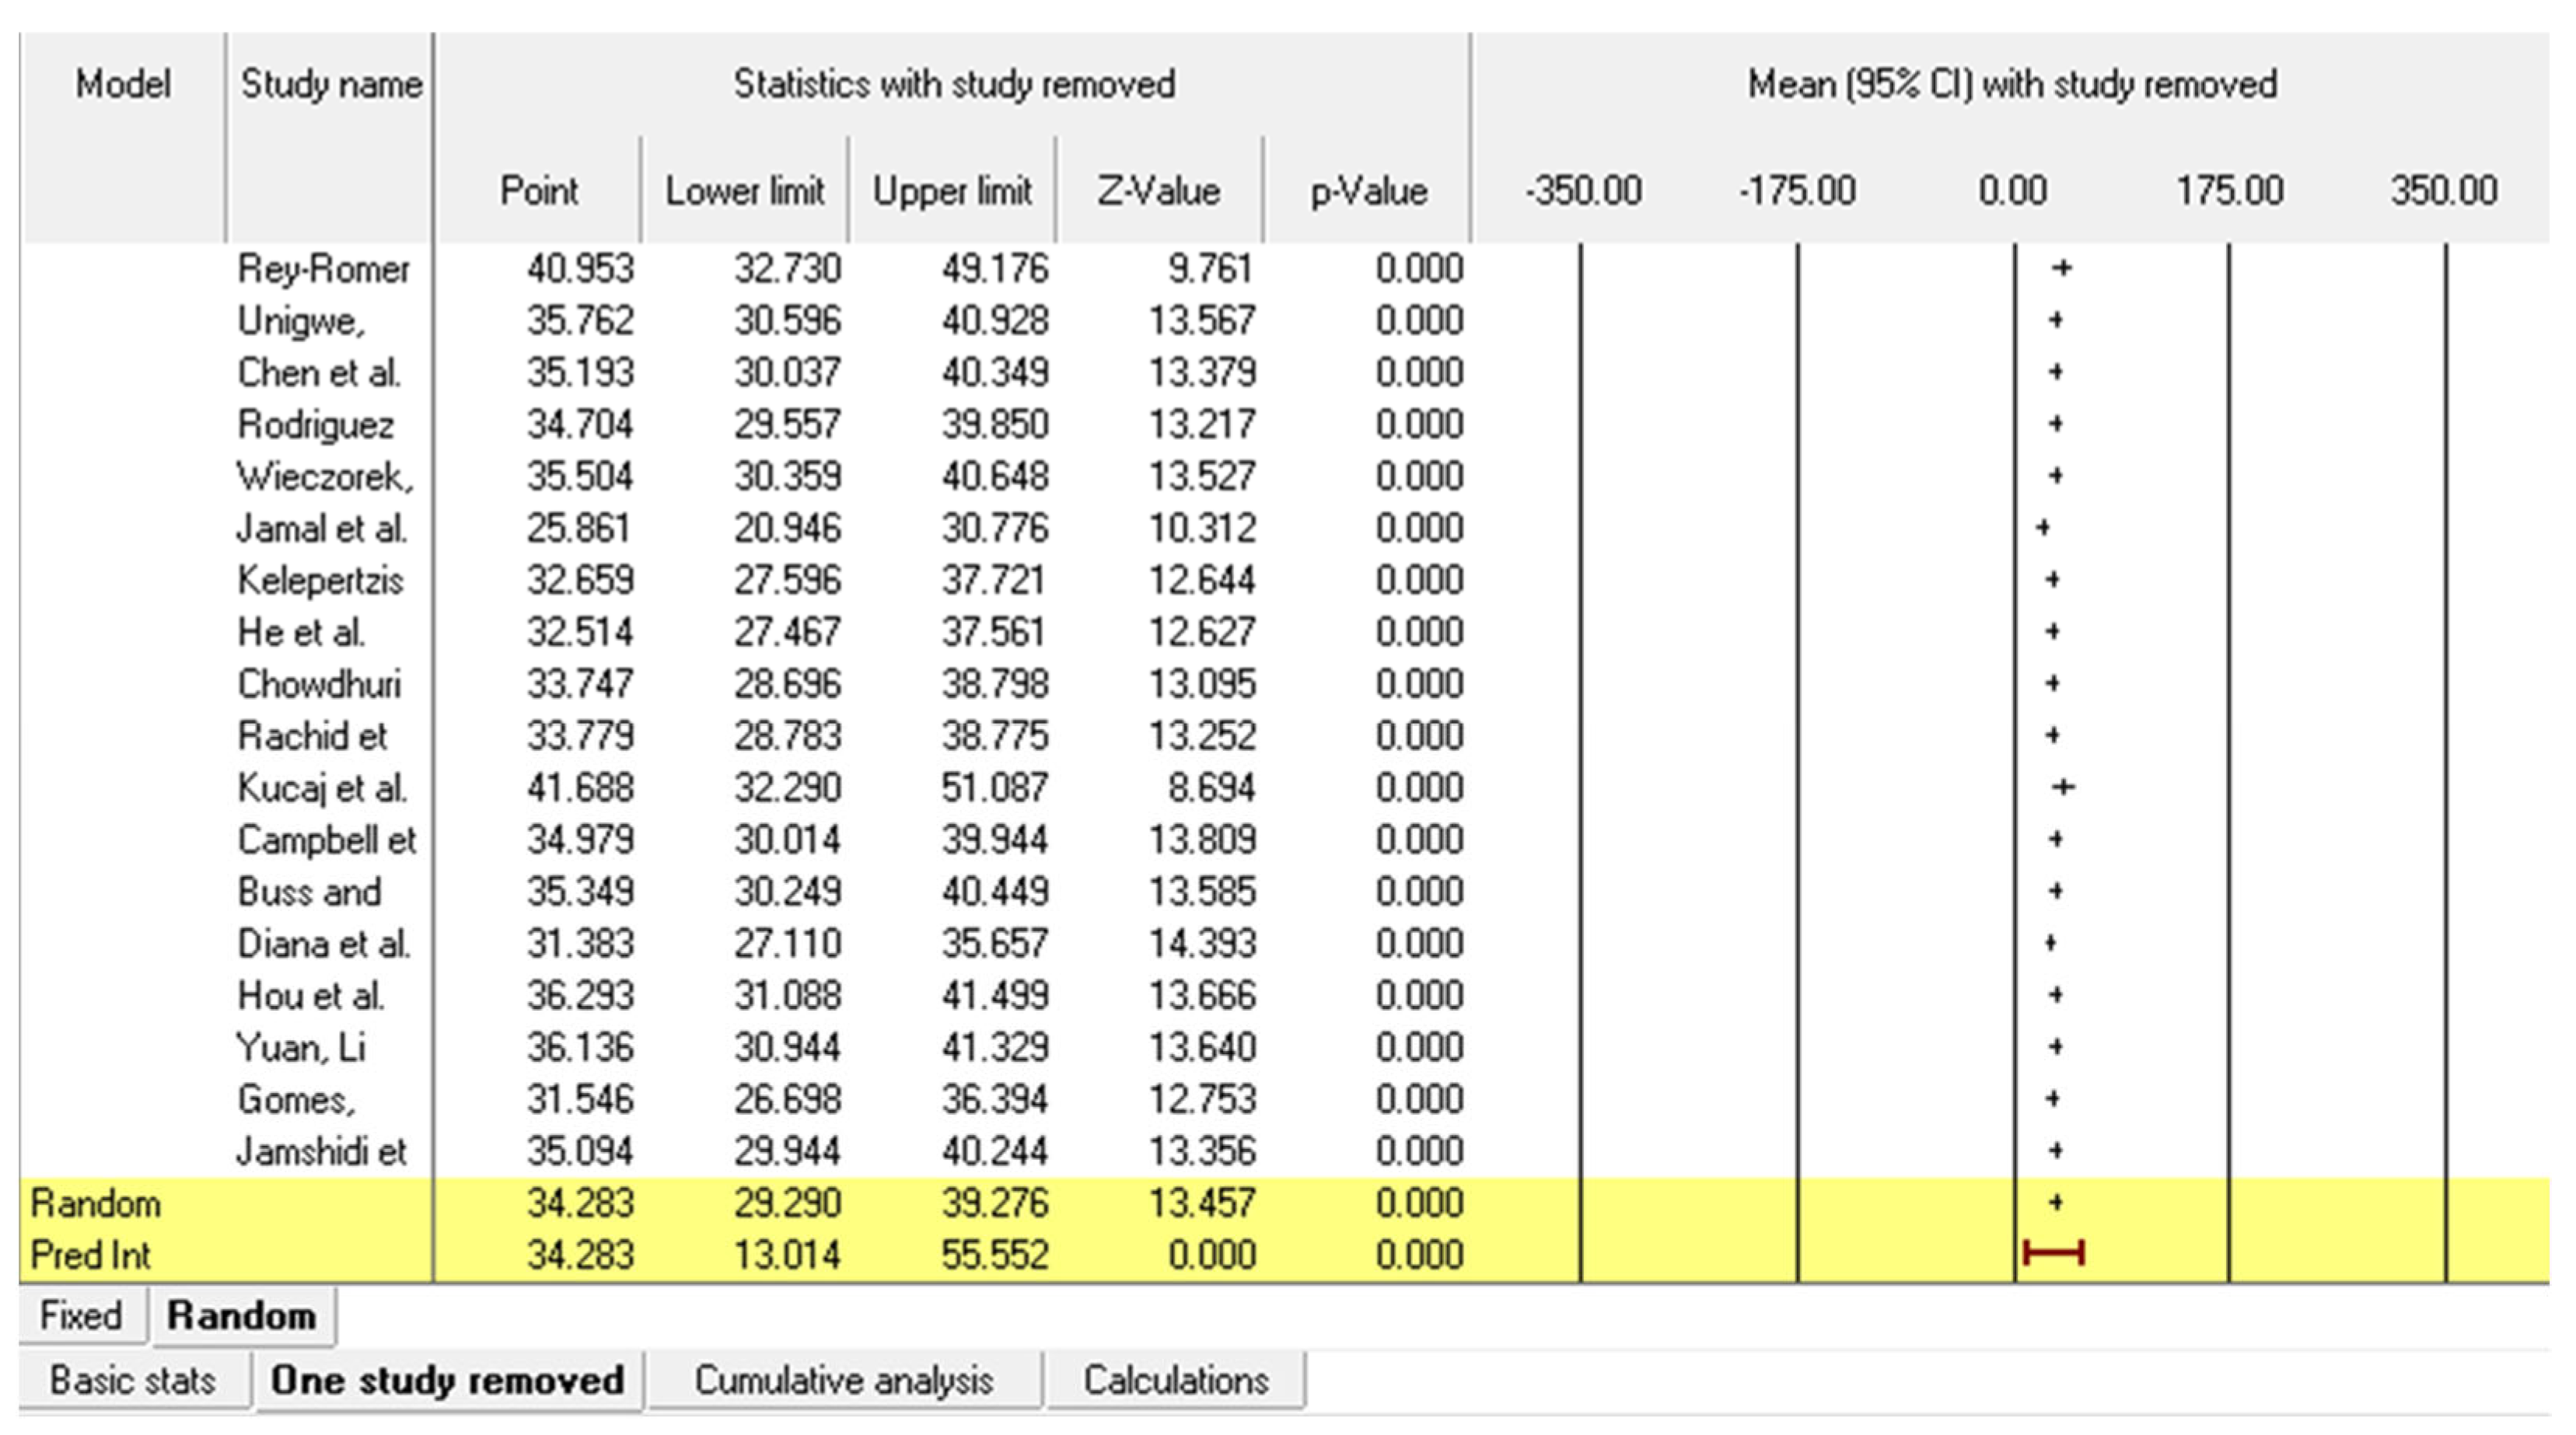
A one-study-removed approach presented in Figure 5 was used due to the noticed outlier and to evaluate its influence on the analysis conclusions. The resulting average nitrate concentration remained consistent, indicating that the overall findings are not dependent on any one study.

3.4. Assessment of Publication Bias

3.4.1. Funnel Plot Analysis

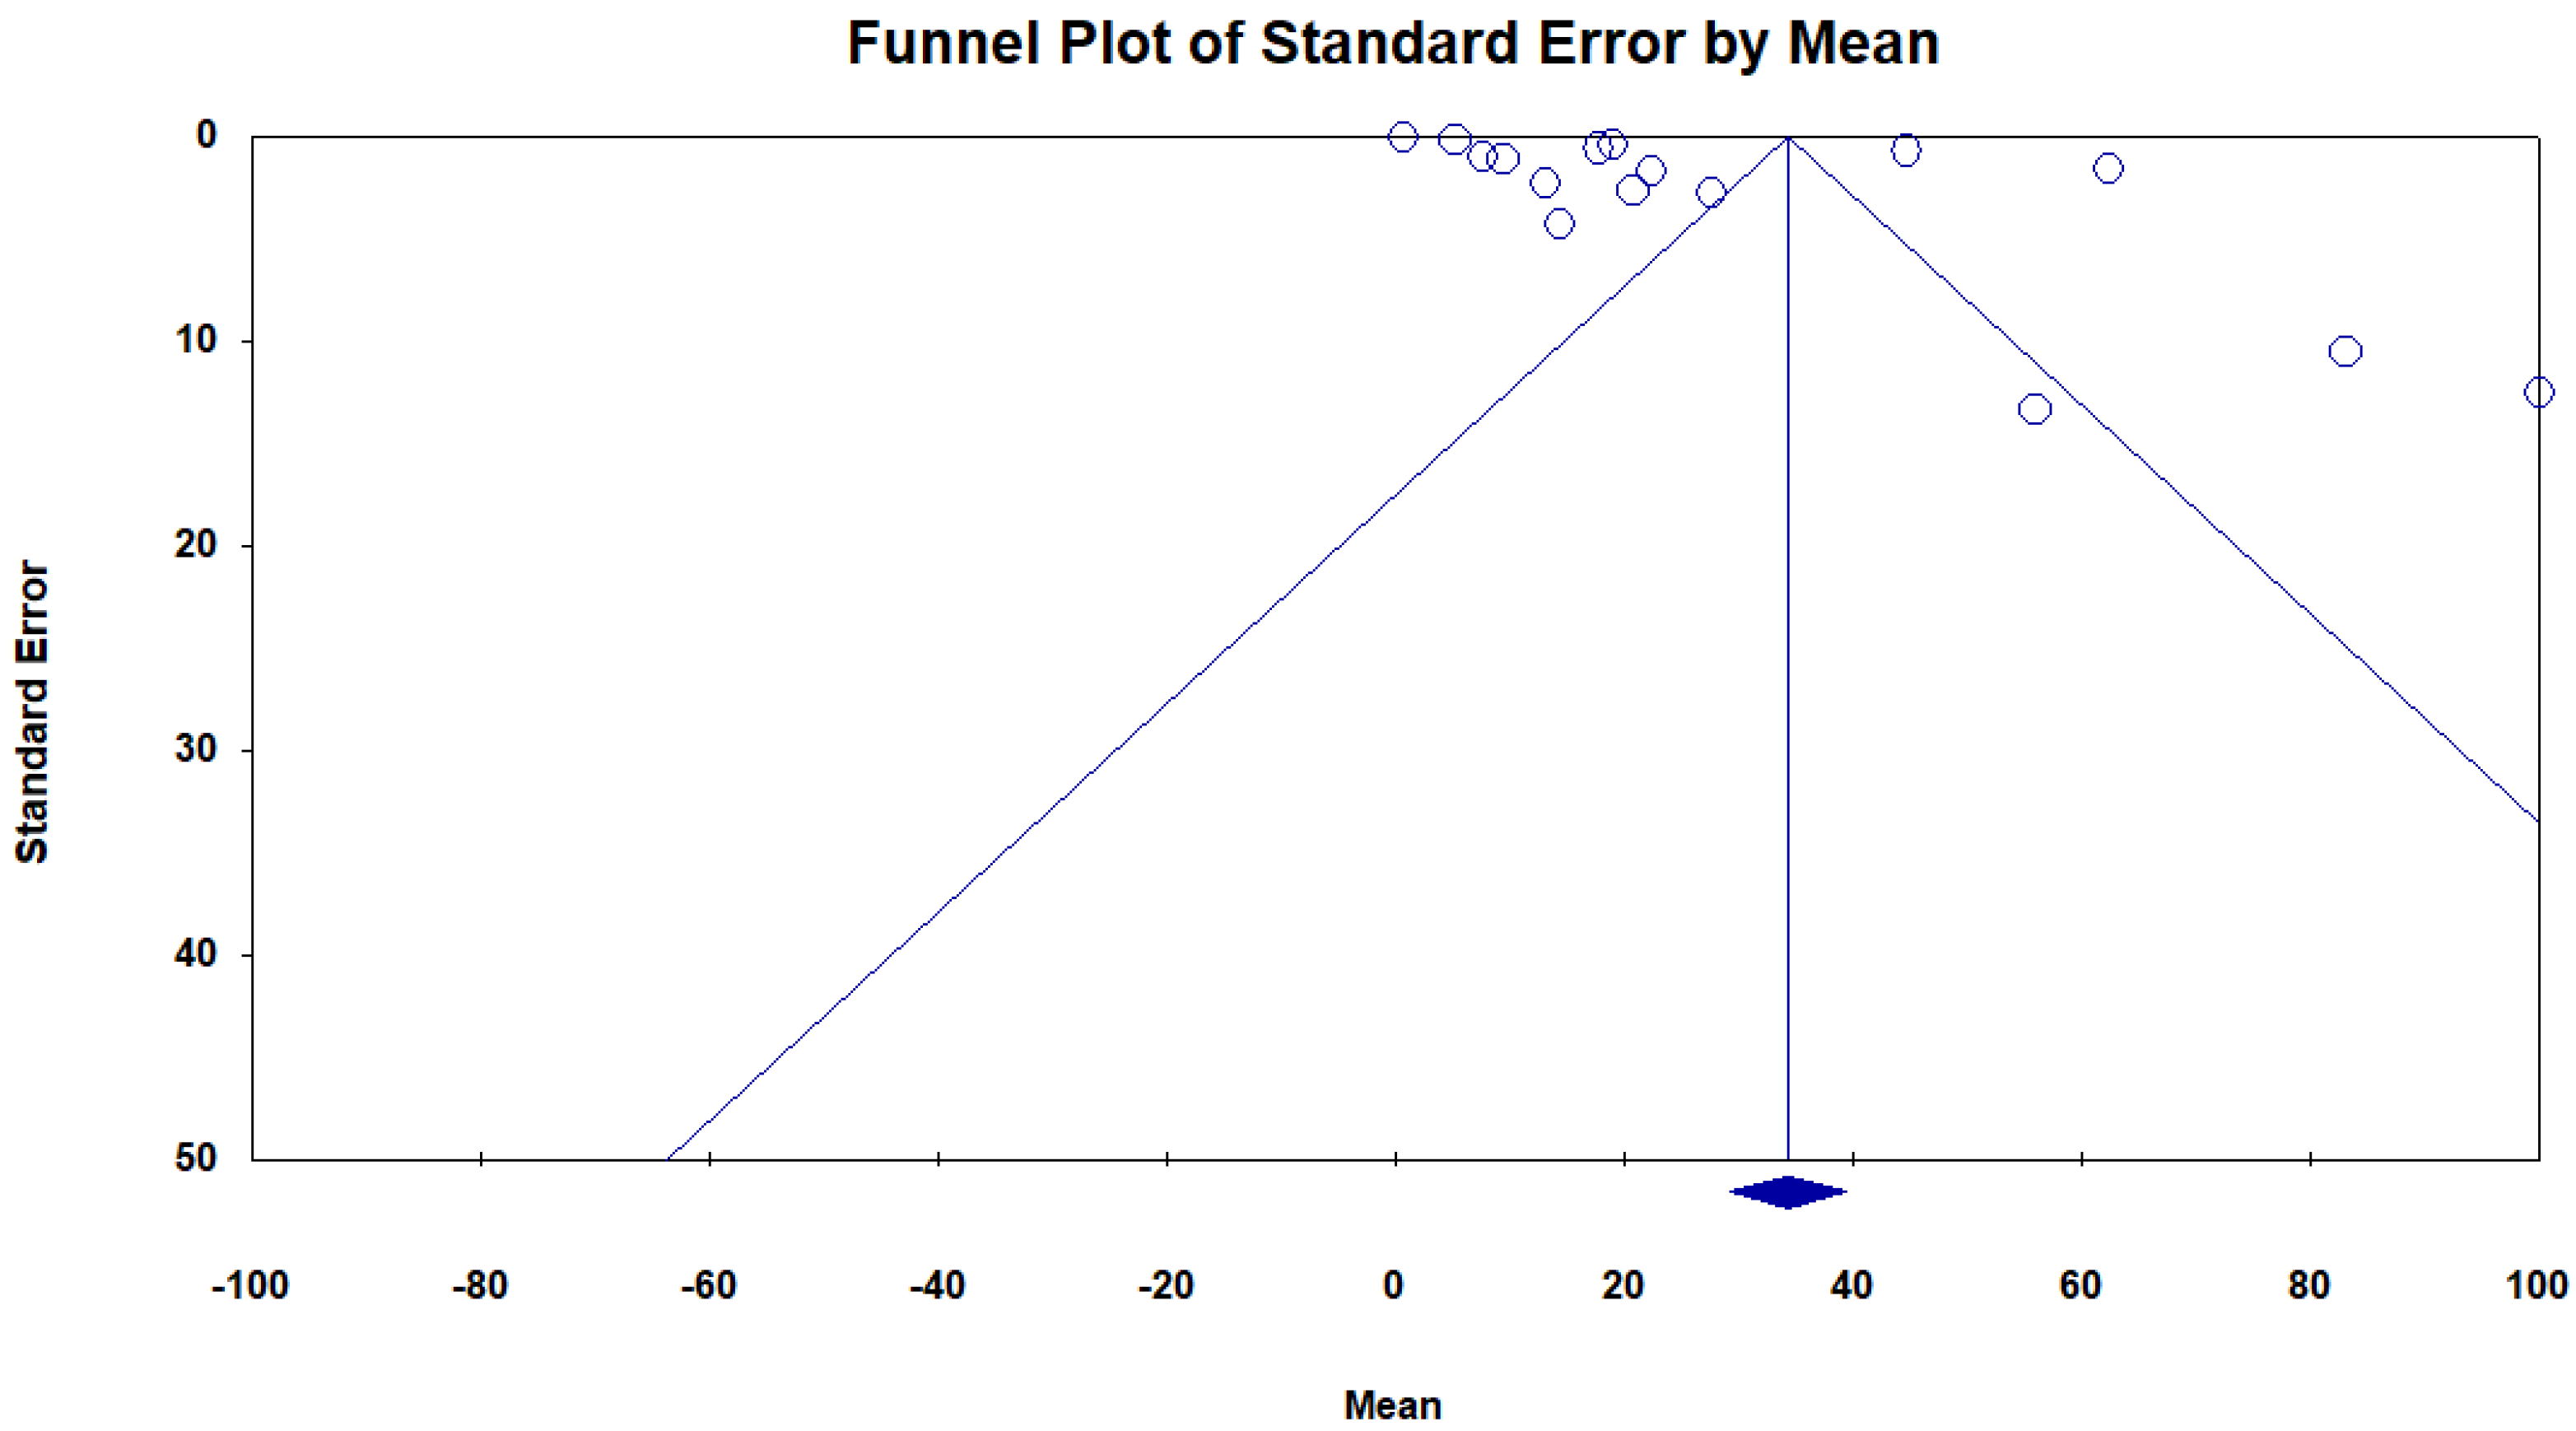
The funnel plot (Figure 6), plotting nitrate concentration against standard error, displayed asymmetry. This suggests smaller studies, which tend to have larger sampling variation, may be more likely to be published. This indicates potential publication bias, which was further explored using quantitative methods.

3.4.2. Classic Fail-Safe N Test

The classic fail-safe N estimates the number of unpublished or missing studies required to raise the combined two-tailed p-value above the conventional significance threshold of 0.050, thereby rendering the observed effect non-significant.
The classic fail-safe N value was 35,906; this suggests over 35,000 additional null-result studies would be required to overturn the significance of the findings. This equates to approximately 1994.8 missing studies per included study, also supporting the robustness of the observed effect.
The combined analysis of the 18 studies yielded a Z-value of 87.56, with a corresponding two-tailed p-value of less than 0.00001, indicating a highly significant overall effect. Given the large fail-safe N, it can be concluded that the observed robust nitrate concentration is unlikely to be solely attributable to publication bias.

3.4.3. Orwin Fail-Safe N

Orwin’s test, which adjusts the assumed mean missing studies from zero to non-zero nitrate concentration, confirmed the robustness of the findings and provided a buffer against the influence of potential unpublished results.

3.4.4. Begg and Mazumdar Rank Correlation Test

This test assesses the relationship between sample size and nitrate concentration, with an inverse correlation potentially indicating bias. It returned a Kendall’s tau-b coefficient of −0.23529 (p = 0.17269). The non-significant p-value suggests a weak correlation between sample size and nitrate concentration. Thus, no strong evidence of publication bias was found.

3.4.5. Duval and Tweedie’s Trim and Fill

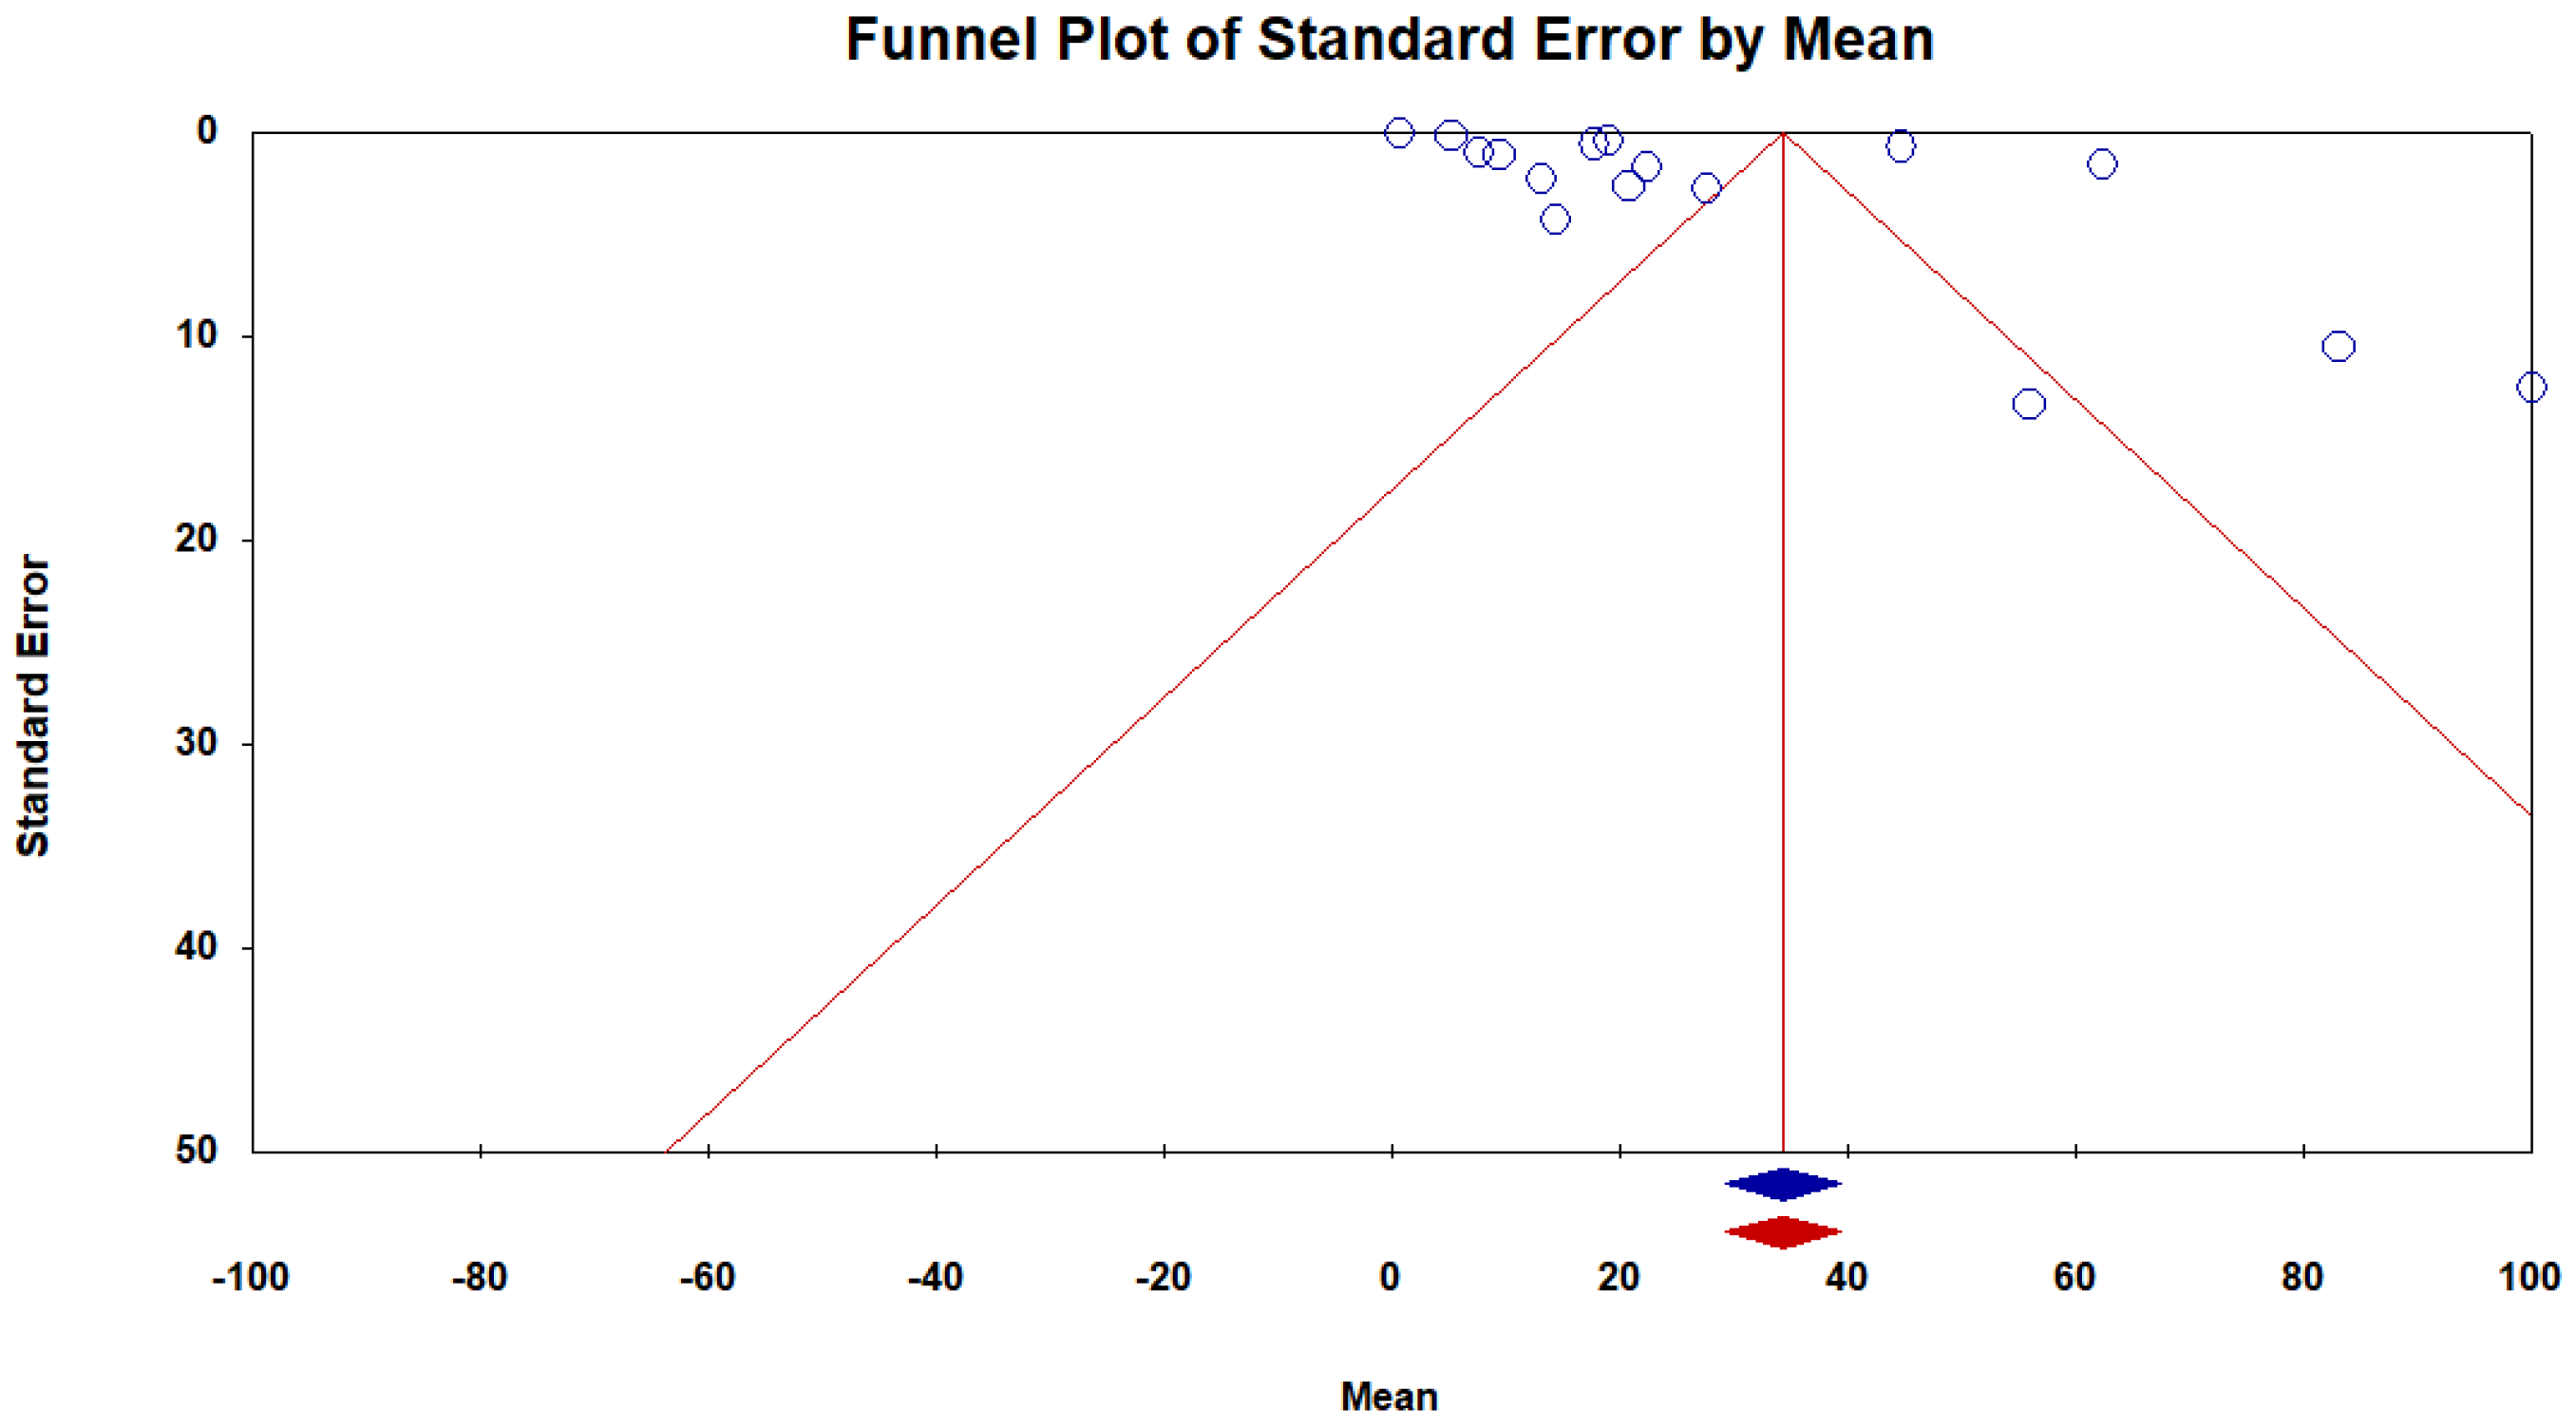
The trim and fill method, as shown in Figure 7, was applied under a random effect model. The analysis suggested that no studies were missing, resulting in unchanged point estimates and 95% confidence intervals for both fixed-effects at 1.04010 (0.99606, 1.08415) and 34.28297 (29.28961, 39.27634), respectively. This confirms that the correlation between nitrogen fertiliser use and water pollution, as well as the heterogeneity observed in this meta-analysis, is robust and can be considered an evidence-based conclusion.
This analysis reveals that, despite substantial heterogeneity, the overall impact of nitrogen fertiliser on water quality remains statistically significant and varies across studies.

3.4.6. Egger’s Regression Test

To further assess the risk of publication bias, Egger’s regression test was conducted. This method evaluates funnel plot asymmetry by regressing the standardised effect size on its standard error. A statistically significant intercept suggests potential small-study effects, where smaller studies may report disproportionately large or extreme outcomes.
The regression analysis produced an intercept of 2.87 with a standard error (SE) of 1.21, yielding a p-value of 0.026. This indicates a significant deviation from symmetry and suggests that small-study effects are likely present in the included data. Such asymmetry may arise from the preferential publication of studies reporting higher nitrate concentrations or from methodological differences in study design and reporting quality among smaller-scale studies. This result complements the observed asymmetry in the funnel plot (Figure 6) and adds further nuance to the interpretation of the classic fail-safe N and Begg and Mazumdar tests. While the overall effect remains statistically significant and robust across multiple diagnostics, the Egger’s test highlights the importance of interpreting the pooled estimate with caution, particularly in relation to smaller or non-representative studies.

4. Discussion

4.1. Interpretation of Findings

This meta-analysis confirms that nitrogen fertiliser use in agriculture significantly elevates nitrate concentrations in water bodies, with a pooled average of 34.283 mg/L (95% CI: 29.290 to 39.276 mg/L). This concentration suggests a consistent pattern of nitrate pollution across agricultural landscapes where synthetic nitrogen inputs are prevalent. Our findings are substantiated by the conclusions of a previous study, which described synthetic nitrogen fertilisers as the dominant source of anthropogenic nitrate pollution globally, with leaching losses exceeding 50% in some cropping systems [20]. Our average nitrate concentration aligns closely with empirical observations in specific agricultural regions. For instance, a large-scale analysis of irrigation water in Wisconsin’s Central Sands reported nitrate levels frequently exceeding 30 mg/L, particularly in sandy soils and vegetable-producing zones [52]. This convergence of results highlights the recurring association between intensive nitrogen fertiliser application and nitrate accumulation in water resources, regardless of the geographic context. These findings also echo the conclusions of a study that investigated agricultural nitrate contamination in Spain’s Limia River basin and found elevated concentrations closely correlated with fertiliser input rates [65]. Similarly, a study reported nitrate concentrations as high as 80–200 mg/L in irrigated apple-growing regions of China’s Loess Plateau [66], further reinforcing the global relevance of our results. Importantly, our study synthesises and standardises these disparate findings using a meta-analytic framework, providing stronger statistical confidence in the overall magnitude of the effect.
While previous studies have reported nitrate concentrations in localised case studies, our pooled estimate provides an integrated benchmark against which future evaluations can be compared. Overall, the observed average of 34.283 mg/L NO3 not only reflects current realities in agro-environmental management but also serves as a warning signal for regions where nitrate pollution remains under-monitored. These results affirm the urgent need for more targeted nitrogen management strategies, as underscored in recent reviews on global nutrient cycling [67], and point toward the value of systematic evidence synthesis in guiding policy interventions.

4.2. Environmental and Health Impacts

It is well established that a substantial portion of nitrogen fertiliser applied in agricultural systems is not taken up by crops. Research indicates that nearly 50% or more of applied nitrogen is lost to the environment through pathways such as leaching, volatilisation, denitrification, and surface runoff [13,15,68,69,70]. These nitrogen losses have far-reaching ecological consequences, particularly in aquatic systems where elevated nitrate levels can stimulate eutrophication and contribute to HABs.
Our finding of a pooled mean nitrate concentration of 34.283 mg/L NO3 highlights the scale of the problem and aligns with broader evidence of nitrogen-driven water degradation. For example, the intensification of marine HABs along U.S. coastlines links these events to excessive nutrient inputs from agricultural catchments [71]. Also, nutrient enrichment from fertiliser runoff has been shown to facilitate cyanobacterial blooms, which can outcompete native phytoplankton and produce toxins detrimental to aquatic biodiversity [72]. The ecological effects of nitrate pollution extend to food webs, habitat structure, and ecosystem services. Studies have shown that eutrophication can also facilitate the horizontal transfer of antibiotic resistance genes in microbial communities [73], posing an emerging concern in both environmental and public health contexts.
Our pooled estimate exceeds the United States Environmental Protection Agency (USEPA) threshold for drinking water safety (10 mg/L nitrate-nitrogen, equivalent to ~44.3 mg/L NO3) and approaches the World Health Organization (WHO) and EU Nitrate Directive (50 mg/L NO3) limits, signalling potential health risks, especially in vulnerable or unregulated regions [74,75]. This gives concerns about adverse health effects, such as different malignancies and reproductive abnormalities, which have been linked to long-term exposure to high amounts of nitrate in drinking water [76]. Chronic nitrate exposure through contaminated drinking water has been linked to methemoglobinemia (“blue baby syndrome”), adverse reproductive outcomes, and various cancers. Systematic reviews have connected elevated nitrate concentrations, often from fertiliser sources, with increased risks of colorectal, ovarian, and bladder cancers [74,77].
Moreover, a study conducted in India’s Indo-Gangetic Plains demonstrated that nitrate contamination is widespread, and 27% of children are estimated to be at risk of exposure above safe thresholds [27]. The nitrate values in our analysis fall within a range that warrants serious concern in such contexts, particularly where monitoring, water treatment, and public health infrastructure are weak. Thus, our findings reinforce the call for urgent, evidence-informed policies that limit excessive nitrogen application, invest in alternative fertilisation strategies, and expand water quality surveillance. This builds on prior recommendations [78], which evaluated nitrate mitigation effectiveness in vulnerable zones and found that stricter controls on fertiliser timing, type, and application rate can reduce nitrate leaching substantially without compromising yield. By synthesising these insights, our study contributes to a growing body of work demonstrating that addressing nitrogen pollution is not just an environmental imperative but also a public health priority, particularly in regions undergoing rapid agricultural intensification.

4.3. Mitigation Through Precision Agriculture

Adopting precision agriculture practices is vital for improving nitrogen use efficiency (NUE). Techniques such as controlled-release fertilisers (CRFs), site-specific nutrient management (SSNM), and sensor-based systems can significantly reduce nitrogen losses. Substantial improvements in crop yield and nitrogen use efficiency (NUE), along with reductions in leaching and emissions, have been demonstrated in previous studies [79]. For instance, SSNM has demonstrated a 23.3% increase in crop yields and a 22.6% reduction in total nitrogen losses through leaching and runoff [79]. Deep placement of fertiliser has been shown to outperform traditional broadcasting methods in terms of both productivity and environmental impact [80]. Precision technologies such as GIS, GNSS, and integrated nutrient management offer scalable solutions for improving fertiliser efficiency and reducing environmental impact [81,82].

4.4. Understanding Heterogeneity

The meta-analysis revealed very high heterogeneity among the included studies (I2 = 100%, Q = 11,453.208, p < 0.001), a result that reflects the complex and context-dependent nature of nitrogen fertiliser impacts on water quality. This level of variability is not unexpected in environmental meta-analyses and is consistent with patterns reported in prior large-scale syntheses and regional assessments. It confirms that nitrate pollution outcomes are influenced by a combination of environmental, agronomic, and methodological factors.
Studies such as [83,84] similarly reported wide spatial variability in nitrate levels across surface and groundwater systems, even within countries or single watersheds. These differences were attributed to site-specific factors including soil texture, land use intensity, cropping systems, irrigation regimes, topography, and fertiliser application rates. For instance, one study found that groundwater nitrate concentrations in Wisconsin’s Central Sands fluctuated significantly based on both soil permeability and crop type, with irrigated vegetable fields showing the highest accumulation [52]. This supports the assertion that nitrate pollution is not solely a function of fertiliser quantity but also of environmental receptivity.
Our prediction interval (13.014 to 55.552 mg/L) quantitatively illustrates this variability. It suggests that, while the average nitrate concentration is around 34.3 mg/L, some agricultural regions may experience much higher levels—well beyond safe thresholds—while others may be comparatively less impacted due to mitigating environmental conditions or more efficient fertiliser practices. Given this variability, we applied a random-effects meta-analysis model, which is appropriate when true effects are assumed to vary across studies rather than being fixed. This approach does not assume homogeneity but rather estimates the average effect across a distribution of effects, accounting for both within-study and between-study variance [48,85]. In this context, the pooled mean should be interpreted not as a universal generalisation but as a benchmark that reflects average nitrate exposure levels across diverse agricultural contexts.
While the pooled mean nitrate concentration (34.283 mg/L) provides a useful indicator of average contamination levels linked to synthetic nitrogen fertiliser use, it must be interpreted with caution. The aggregation of data across diverse water bodies, climates, and agricultural systems introduces inherent variability, as reflected in the wide prediction interval (13.014–55.552 mg/L). Although subgroup meta-analyses stratified by water type or regional context would offer more granular insight, such analyses were not feasible in this study due to inconsistent metadata reporting and limited disaggregation of sampling conditions across primary studies. As such, the pooled mean is best understood as a statistical benchmark rather than a universally generalisable threshold. We recommend that future environmental meta-analyses improve subgroup comparability by ensuring consistent documentation of water type, land use, fertiliser type, and sampling protocols.
Methodological factors may also contribute to the observed heterogeneity. Differences in monitoring frequency, sampling depth, analytical techniques, and reporting standards can affect comparability. As noted in previous studies [86,87], inconsistent methodologies across water quality studies can obscure real-world patterns and reduce the precision of cross-study syntheses. This underscores the importance of harmonising data collection protocols and improving metadata reporting in future environmental research. Future meta-analyses would benefit from subgroup analyses stratified by region, water body type, fertiliser formulation, or crop system to better resolve these context-dependent dynamics.

4.5. Limitations

Several limitations should be considered when interpreting the findings of this meta-analysis. First, while the study provides a pooled estimate of nitrate concentrations in water bodies affected by synthetic nitrogen fertiliser use, the included studies exhibited considerable methodological and contextual heterogeneity. Variations in soil types, cropping systems, climatic conditions, water sources (surface vs. groundwater), and fertiliser formulations contribute to outcome differences that could not be fully resolved due to data constraints.
Second, a significant number of studies lacked key statistical information—such as standard deviations, sample sizes, or detailed descriptions of fertiliser application protocols—limiting the precision of pooled estimates and preventing formal subgroup analyses. For example, fewer than half of the included studies reported nitrate concentrations disaggregated by water body type or fertiliser management practices. As a result, the average effect size presented should be interpreted as a contextual benchmark rather than a universally generalisable threshold.
Third, and critically, the absence of appropriate control or baseline groups in most studies limited the capacity to make direct causal attributions. Very few studies included non-agricultural reference sites, pre-fertilisation nitrate levels, or untreated comparator locations. As such, while the findings demonstrate a strong and consistent association between synthetic fertiliser use and elevated nitrate concentrations, they cannot isolate fertiliser as the sole cause. This reflects a broader limitation in environmental meta-analysis, where randomised or quasi-experimental designs are rare, and observational data often dominate the evidence base. Future studies should prioritise including untreated controls or baseline monitoring data where feasible, to strengthen causal inference.
Finally, while publication bias was assessed using multiple tools—including the funnel plot, Duval and Tweedie’s trim-and-fill, and the classic fail-safe N—the addition of Egger’s regression test provided further insight. The test yielded a statistically significant intercept (2.87, SE = 1.21, p = 0.026), indicating the likely presence of small-study effects. This suggests that smaller studies with disproportionately high nitrate concentrations may have contributed to funnel plot asymmetry and could exaggerate the pooled mean. While the large fail-safe N value suggests that the main effect is robust to a substantial number of missing studies, the Egger’s test reinforces the need for cautious interpretation of effect size magnitude, particularly given the absence of publication bias correction in most primary studies.
Despite these limitations, this study offers a timely and statistically grounded synthesis of nitrate contamination in agriculture-affected water systems. It provides a foundation for more stratified, causally robust, and bias-aware meta-analyses in the future.

4.6. Future Research Directions

Our meta-analysis highlights not only the statistical significance of nitrate pollution linked to nitrogen fertiliser use but also the substantial heterogeneity and gaps in current research. These findings point to several critical avenues for future investigation.
First, there is an urgent need for greater consistency in data reporting and methodological design. A substantial number of studies included in our review lacked essential metadata—such as control groups, baseline nitrate levels, standard deviations, or fertiliser application rates—which limited our ability to conduct more granular subgroup analyses. This concern has also been raised in previous work [88], which argues that the reliability and policy relevance of meta-analyses in environmental sciences depend heavily on the completeness and standardisation of primary data. Second, we recommend a shift toward longitudinal and seasonally resolved studies that track nitrate dynamics over time. Studies such as [89,90] have demonstrated how temporal monitoring can uncover lag effects in nitrate accumulation and reveal how seasonal rainfall, irrigation schedules, and fertiliser application timing interact to affect leaching risk. Future research should prioritise long-term, high-resolution datasets that can inform predictive modelling under different climate scenarios.
Third, our findings support the call for interdisciplinary research that links nitrate exposure to ecological and health outcomes, particularly in low- and middle-income countries (LMICs). Although some studies [27,91] have quantified groundwater nitrate risks in LMIC settings, there remains a scarcity of integrated assessments that connect nitrate levels to observed cases of disease or ecosystem degradation. Combining hydrological modelling with epidemiological surveillance, similar to the approach used in [74], would offer actionable insights for public health and water governance. In addition, future studies should incorporate farmer perceptions and behavioural dynamics, especially as they relate to fertiliser decision-making. Research presented in [23] shows that awareness, economic incentives, and access to decision-support tools greatly influence whether farmers adopt environmentally sustainable nutrient practices. Understanding these behavioural drivers can enhance the design of more effective policy instruments and extension services. Finally, we encourage comparative studies that evaluate the effectiveness of mitigation interventions across different governance regimes. For example, the EU Nitrates Directive has led to measurable improvements in water quality in certain vulnerable zones, but outcomes have varied due to enforcement capacity, stakeholder engagement, and agronomic baselines. Comparative policy analyses, such as those understood in [13], can help identify the most transferable and scalable nitrogen management strategies.
Future research should adopt a multi-scalar, integrative approach that bridges environmental science, health, agronomy, and policy. Such work is essential to improve nitrogen use efficiency, safeguard water quality, and promote sustainable agriculture in both the Global North and South.

5. Conclusions

This meta-analysis confirms that nitrogen fertiliser use is significantly associated with elevated nitrate concentrations in agricultural water bodies, with a pooled mean of 34.283 mg/L NO3. While this average remains marginally below the thresholds set by the World Health Organization (50 mg/L NO3) and EU Nitrate Directive, it exceeds the United States Environmental Protection Agency limit (44.3 mg/L NO3) and suggests that in many contexts, nitrate levels approach or exceed health-protective standards—particularly where monitoring is limited or regulations are weak. The magnitude and consistency of the observed effect signal an urgent need for enhanced nitrogen governance. Policymakers should prioritise tighter controls on fertiliser application rates, enforce nitrate-sensitive zoning regulations (e.g., NVZs), and strengthen surveillance systems in both surface and groundwater bodies. This is especially crucial in low- and middle-income countries, where exposure risks often coincide with limited water treatment infrastructure. At the farm level, strategies such as controlled-release fertilisers, site-specific nutrient management (SSNM), and improved application timing can reduce nitrate leaching without compromising yield. Incentivising the adoption of these approaches through subsidies or training programmes may offer scalable, cost-effective solutions.
For researchers, our findings reinforce the need for harmonised environmental reporting standards, including baseline measurements, control comparisons, and consistent data formats for nitrate-related studies. Further longitudinal and region-specific investigations will help unpack context-sensitive dynamics and inform better modelling of nitrate behaviour under future climate conditions. In summary, while the evidence affirms the benefits of nitrogen fertiliser in global food production, it also highlights its hidden costs to water quality, public health, and ecosystem integrity. Targeted, evidence-based responses are now essential to reconcile agricultural productivity with environmental protection.

Funding

This research received no external funding.

Conflicts of Interest

The authors declare no conflicts of interest.

Appendix A

Table A1. Search strings for pilot test.
Pilot SearchDatabaseSearch StringResult
First searchScience direct(“fertilizer” OR “Agricultural fertilizer” OR “NPK fertilizer”) AND (“water pollution” OR “water quality” OR “ water contaminantion”) AND (“Climate change” OR “Extreme weather” OR “Climate condition”)6690
Second searchScience direct(“agriculture” OR “farming practices” OR “crop production”) AND (“nutrient runoff” OR “fertilizer runoff” OR “agricultural runoff”) AND (“environmental impact” OR “ecosystem health” OR “environmental sustainability”)2660
Web of Science(“Agricultural” OR “Farm”) AND (“Nitrogen fertilizer” OR “N-fertilizer” OR “fertilizer” OR “Nutrient”) AND (“water pollution” OR “water contamination” OR “water quality” OR “ Eutrophication”) AND (“Extreme weather” OR “Storm” OR “runoff” OR “Climate change” OR “Climate condition”) (Topic) and 2024 or 2023 or 2022 or 2021 or 2020 (Publication Years)747
Table A2. PICO framework and keywords.
PICO
Framework
Research ObjectiveKeywordsSynonyms
PopulationAgricultureAgriculture, Agricultural runoffFaming practice, crop production
InterventionNitrogen fertilizer
usage
Nitrogen fertilizerNitrate, N fertilizer
Comparison---
OutcomeImpact on water qualityImpact, water, water quality, water polutionEffect, consequence, surface water, groundwater, lake, river, water contamination, eutrophication, algal bloom, nitrate pollution
Table A3. Search strings and results.
DatabaseSearch StringResult
ScopusTITLE-ABS-KEY ((“nitrogen fertilizer” OR “nitrate” OR “agricultural runoff”) AND (“water pollution” OR “water quality” OR “eutrophication” OR “algal blooms” OR “nitrate pollution”) AND (“agriculture” OR “farming practices” OR “crop production”) AND (“impact” OR “effects” OR “consequences”) AND (“surface water” OR “groundwater” OR “rivers” OR “lakes”)) AND PUBYEAR > 2019 AND PUBYEAR < 2025 AND (LIMIT-TO (LANGUAGE,”English”))514
Web of
Science
(“nitrogen fertilizer” OR “nitrate” OR “agricultural runoff”) AND (“water pollution” OR “water quality” OR “eutrophication” OR “algal blooms” OR “nitrate pollution”) AND (“agriculture” OR “farming practices” OR “crop production”) AND (“impact” OR “effects” OR “consequences”) AND (“surface water” OR “groundwater” OR “rivers” OR “lakes” (Topic) and 2023 or 2022 or 2024 or 2021 or 2020 (Publication Years) and English (Languages)131
GREENFILE(“nitrogen fertilizer” OR “nitrate” OR “agricultural runoff”) AND (“water pollution” OR “water quality” OR “eutrophication” OR “algal blooms” OR “nitrate pollution”) AND (“agriculture” OR “farming practices” OR “crop production”) AND (“impact” OR “effects” OR “consequences”) AND (“surface water” OR “groundwater” OR “rivers” OR “lakes”)
Limiters—Publication Date: 20200101–20241231
Narrow by Language:—English
Search modes—Boolean/Phrase
36
Table A4. Eligibility criteria.
CriteriaInclusionExclusion
Year of Publication2020–2024Before 2020
Journal typeOthersSystematic review, review, book series, letter, Editorial
Publication languageEnglishNon-English
Water sampling2019–2024Before 2019
Water quality parameterNutrient or physico-chemical parameterOther parameters
PollutionInorganic or nitrogen
fertilizer
Manure, wastewater and other sources
Context of studyAgricultureOthers
Table A5. Data collection form.
Focus AreaVariable
Identification informationAuthor
Title of study
Year of publication
Study designStudy design
Location of study
Study duration
FertilizerType of agriculture
Type of fertilizer
Application rate
Water quality parametersMeasured parameters
Sampling location or source
Sampling interval
Analytical method used
Impact on water qualityBaseline water quality parameter
changes in water quality parameter due to effect of inorganic fertilizer
spatial distribution of water quality changes
Temporal or seasonal trends in water quality changes
Other variablesClimate conditions
Land use/Land cover
Management practice
Resultssummary of main findings
Any associations or correlations reported between fertilizer usage and water quality
Quality assessmentStudy methods
Result validity
Study reliability

Appendix B

Quality assessment of included studies using the Environmentally Modified Newcastle–Ottawa Scale (NOS). Each coloured bar segment represents a specific criterion from the modified NOS framework, evaluating aspects such as geographical representativeness, exposure clarity, environmental condition details, sampling strategy, confounding control, exposure comparisons, outcome validity, statistical reporting, and data reliability. Total scores (out of 10) are shown on the x-axis. This assessment was used to determine the methodological rigour and environmental relevance of studies included in the meta-analysis [33,50,51,52,53,54,55,56,57,58,59,60,61,62,63,64,65,66].

References

  1. Kumar, N.; Kumar, A.; Marwein, B.; Verma, D.K.; Jayabalan, I.; Kumar, A.; Ramamoorthy, D. Agricultural Activities Causing Water Pollution and Its Mitigation—A Review. Int. J. Mod. Agric. 2021, 10, 2021. [Google Scholar]
  2. Ayana, E. Determinants of Declining Water Quality; World Bank: Washington, DC, USA, 2019. [Google Scholar] [CrossRef]
  3. Obilonu, A.; Chijioke, C.; Igwegbe, W.; Ibearugbulem, O.; Abubakar, Y. Water Quality Challenges and Impact. Int. Lett. Nat. Sci. 2013, 4, 44–53. [Google Scholar] [CrossRef]
  4. Wouters, P. Global, Regional and Local Challenges; Institute for Public Policy Research (IPPR): London, UK, 2010; Available online: http://www.jstor.org/stable/resrep16067 (accessed on 1 February 2024).
  5. Cousin, E.; Kawamura, A.G.; Rosegrant, M.W. The Threat of Water Scarcity. In From Scarcity to Security; Chicago Council on Global Affairs: Chicago, IL, USA, 2019; pp. 12–25. Available online: http://www.jstor.org/stable/resrep21409.6 (accessed on 1 February 2024).
  6. United Nations Department of Economic and Social Affairs, Population Division. World Population Prospects 2022: Summary of Results; United Nations: New York, NY, USA, 2022; Available online: https://www.un.org/development/desa/pd/sites/www.un.org.development.desa.pd/files/wpp2022_summary_of_results.pdf (accessed on 5 February 2024).
  7. Nelson, A.R.L.E.; Ravichandran, K.; Antony, U. The impact of the Green Revolution on indigenous crops of India. J. Ethn. Foods 2019, 6, 8. [Google Scholar] [CrossRef]
  8. Walling, E.; Vaneeckhaute, C. Nitrogen Fertilizers and the Environment. In Nitrate Handbook; CRC Press: Boca Raton, FL, USA, 2022; pp. 103–135. [Google Scholar]
  9. Ghavam, S.; Vahdati, M.; Wilson, I.A.G.; Styring, P. Sustainable Ammonia Production Processes. Front. Energy Res. 2021, 9, 580808. [Google Scholar] [CrossRef]
  10. Tyldesley, A. Ammonium Nitrate, a Simple Fertiliser, or Dangerous Explosive? 1974. Available online: https://www.chem.ox.ac.uk/files/ks4ammoniumnitrate.pdf (accessed on 10 June 2025).
  11. Zayed, O.; Hewedy, O.A.; Abdelmoteleb, A.; Ali, M.; Youssef, M.S.; Roumia, A.F.; Seymour, D.; Yuan, Z.-C. Nitrogen Journey in Plants: From Uptake to Metabolism, Stress Response, and Microbe Interaction. Biomolecules 2023, 13, 1443. [Google Scholar] [CrossRef] [PubMed]
  12. Anas, M.; Liao, F.; Verma, K.K.; Sarwar, M.A.; Mahmood, A.; Chen, Z.-L.; Li, Q.; Zeng, X.-P.; Li, Y.-R. Fate of nitrogen in agriculture and environment: Agronomic, eco-physiological and molecular approaches to improve nitrogen use efficiency. Biol. Res. 2020, 53, 47. [Google Scholar] [CrossRef]
  13. Martínez-Dalmau, J.; Berbel, J.; Ordóñez-Fernández, R. Nitrogen Fertilization. A Review of the Risks Associated with the Inefficiency of Its Use and Policy Responses. Sustainability 2021, 13, 5625. [Google Scholar] [CrossRef]
  14. Liu, C.-W.; Sung, Y.; Chen, B.-C.; Lai, H.-Y. Effects of Nitrogen Fertilizers on the Growth and Nitrate Content of Lettuce (Lactuca sativa L.). Int. J. Environ. Res. Public Health 2014, 11, 4427–4440. [Google Scholar] [CrossRef]
  15. Dimkpa, C.O.; Fugice, J.; Singh, U.; Lewis, T.D. Development of fertilizers for enhanced nitrogen use efficiency—Trends and perspectives. Sci. Total. Environ. 2020, 731, 139113. [Google Scholar] [CrossRef]
  16. Cassman, K.G.; Dobermann, A. Nitrogen and the future of agriculture: 20 years on. AMBIO 2021, 51, 17–24. [Google Scholar] [CrossRef]
  17. McIsaac, G. Surface Water Pollution by Nitrogen Fertilizers. In Encyclopedia of Water Science; CRC Press: Boca Raton, FL, USA, 2003. [Google Scholar]
  18. Mengel, D. AY-204; Purdue Extension: West Lafayette, IN, USA, 2019; Available online: https://www.extension.purdue.edu/extmedia/AY/AY-204.html (accessed on 15 March 2024).
  19. Guo, S.; Jiang, R.; Qu, H.; Wang, Y.; Misselbrook, T.; Gunina, A.; Kuzyakov, Y. Fate and transport of urea-N in a rain-fed ridge-furrow crop system with plastic mulch. Soil Tillage Res. 2019, 186, 214–223. [Google Scholar] [CrossRef]
  20. Singh, B.; Craswell, E. Fertilizers and nitrate pollution of surface and ground water: An increasingly pervasive global problem. SN Appl. Sci. 2021, 3, 518. [Google Scholar] [CrossRef]
  21. Giordano, M.; Petropoulos, S.A.; Rouphael, Y. The Fate of Nitrogen from Soil to Plants: Influence of Agricultural Practices in Modern Agriculture. Agriculture 2021, 11, 944. [Google Scholar] [CrossRef]
  22. Holden, J.; Haygarth, P.M.; MacDonald, J.; Jenkins, A.; Sapiets, A.; Orr, H.G.; Dunn, N.; Harris, B.; Pearson, P.L.; McGonigle, D.; et al. Agriculture’s Impacts on Water Quality; Global Food Security Programme: Swindon, UK, 2015. [Google Scholar]
  23. Vilas, M.P.; Thorburn, P.J.; Fielke, S.; Webster, T.; Mooij, M.; Biggs, J.S.; Zhang, Y.-F.; Adham, A.; Davis, A.; Dungan, B.; et al. 1622WQ: A web-based application to increase farmer awareness of the impact of agriculture on water quality. Environ. Model. Softw. 2020, 132, 104816. [Google Scholar] [CrossRef]
  24. Bashir, I.; Lone, F.A.; Bhat, R.A.; Mir, S.A.; Dar, Z.A.; Dar, S.A. Concerns and Threats of Contamination on Aquatic Ecosystems. In Bioremediation and Biotechnology; Hakeem, K.R., Bhat, R.A., Eds.; Springer: Cham, Switzerland, 2020; pp. 1–26. [Google Scholar] [CrossRef]
  25. Anderson, D.M.; Fensin, E.; Gobler, C.J.; Hoeglund, A.E.; Hubbard, K.A.; Kulis, D.M.; Landsberg, J.H.; Lefebvre, K.A.; Provoost, P.; Richlen, M.L.; et al. Marine harmful algal blooms (HABs) in the United States: History, current status and future trends. Harmful Algae 2021, 102, 101975. [Google Scholar] [CrossRef] [PubMed]
  26. Addy, K.; Green, L.; Herron, E. Nitrogen and Water Quality; University of Rhode Island, College of the Environment and Life Sciences: Kingston, RI, USA, 2005. [Google Scholar]
  27. Verma, A.; Sharma, A.; Kumar, R.; Sharma, P. Nitrate contamination in groundwater and associated health risk assessment for Indo-Gangetic Plain, India. Groundw. Sustain. Dev. 2023, 23, 100978. [Google Scholar] [CrossRef]
  28. Abushouk, A.I.; Yunusa, I.; Elmehrath, A.O.; Elmatboly, A.M.; Fayek, S.H.; Abdelfattah, O.M.; Saad, A.; Isogai, T.; Shekhar, S.; Kalra, A.; et al. Quality Assessment of Published Systematic Reviews in High Impact Cardiology Journals: Revisiting the Evidence Pyramid. Front. Cardiovasc. Med. 2021, 8, 671569. [Google Scholar] [CrossRef]
  29. Hogg, J. LibGuides: Systematic Reviews: Home. Available online: https://libguides.tees.ac.uk/systematic_reviews (accessed on 14 March 2024).
  30. Fischer, A.P.; Shah, M.A.R.; Segnon, A.C.; Matavel, C.; Antwi-Agyei, P.; Shang, Y.; Muir, M.; Kaufmann, R. The Global Adaptation Mapping Team Human adaptation to climate change in the context of forests: A systematic review. Clim. Risk Manag. 2023, 43, 100573. [Google Scholar] [CrossRef]
  31. Page, M.J.; McKenzie, J.E.; Bossuyt, P.M.; Boutron, I.; Hoffmann, T.C.; Mulrow, C.D.; Shamseer, L.; Tetzlaff, J.M.; Akl, E.A.; Brennan, S.E.; et al. The PRISMA 2020 statement: An updated guideline for reporting systematic reviews. BMJ 2021, 372, n71. [Google Scholar] [CrossRef]
  32. Furtak, K.; Wolińska, A. The impact of extreme weather events as a consequence of climate change on the soil moisture and on the quality of the soil environment and agriculture—A review. CATENA 2023, 231, 07378. [Google Scholar] [CrossRef]
  33. Kucaj, E.; Gjoni, I.A.; Osmani, M.; Çela, G.; Bardhi, A.; Baxhija, Z.; Kucaj, B. Impact of Human Activity on the Water Quality of Lake Mullinjëza, Belsh, Albania. In Proceedings of the 4th International Conference on Environmental Design (ICED 2023), Athens, Greece, 20–22 October 2023. E3S Web of Conferences. [Google Scholar] [CrossRef]
  34. Dahiya, D.; Laishram, B. Life cycle energy analysis of buildings: A systematic review. Build. Environ. 2024, 252, 111160. [Google Scholar] [CrossRef]
  35. King, N. LibGuides: Environment: Journal Articles & Databases. Available online: https://libguides.tees.ac.uk/environment/journal (accessed on 20 March 2024).
  36. Burnham, J.F. Scopus database: A review. Biomed. Digit. Libr. 2006, 3, 1. [Google Scholar] [CrossRef]
  37. Li, K.; Rollins, J.; Yan, E. Web of Science use in published research and review papers 1997–2017: A selective, dynamic, cross-domain, content-based analysis. Scientometrics 2017, 115, 1–20. [Google Scholar] [CrossRef] [PubMed]
  38. InCites Help Center Web of Science Research Areas. Available online: https://incites.help.clarivate.com/Content/Research-Areas/wos-research-areas.htm (accessed on 20 March 2024).
  39. GreenFILE|EBSCO. 2020. Available online: https://www.ebsco.com/products/research-databases/greenfile (accessed on 20 March 2024).
  40. Hozo, S.P.; Djulbegovic, B.; Hozo, I. Estimating the mean and variance from the median, range, and the size of a sample. BMC Med. Res. Methodol. 2005, 5, 13. [Google Scholar] [CrossRef]
  41. Stephanie. Combined Mean: Definition, Examples. Statistics How to. 2018. Available online: https://www.statisticshowto.com/combined-mean/ (accessed on 13 April 2024).
  42. Cochrane Training. Chapter 10: Analysing Data and Undertaking Meta-Analyses. Cochrane Training. 2024. Available online: https://training.cochrane.org/handbook/archive/v6.2/chapter-10#:~:text=Random%2Deffects%20meta%2Danalyses%20allow (accessed on 13 April 2024).
  43. Piscopo, A.; Seaman, S.C.; Beer, M.A.; Torner, J.C.; Greenlee, J.D. A meta-analysis of proportions of single arm observational series for anterior skull base meningiomas comparing supraorbital craniotomy to the endoscopic endonasal approach. Interdiscip. Neurosurg. 2021, 26, 101303. [Google Scholar] [CrossRef]
  44. Gutsmiedl, K.; Krause, M.; Bighelli, I.; Schneider-Thoma, J.; Leucht, S. How well do elderly patients with major depressive disorder respond to antidepressants: A systematic review and single-group meta-analysis. BMC Psychiatry 2020, 20, 102. [Google Scholar] [CrossRef]
  45. Bighelli, I.; Huhn, M.; Schneider-Thoma, J.; Krause, M.; Reitmeir, C.; Wallis, S.; Schwermann, F.; Pitschel-Walz, G.; Barbui, C.; Furukawa, T.A.; et al. Response rates in patients with schizophrenia and positive symptoms receiving cognitive behavioural therapy: A systematic review and single-group meta-analysis. BMC Psychiatry 2018, 18, 380. [Google Scholar] [CrossRef]
  46. Borenstein, M. Common Mistakes in Meta-Analysis and How to Avoid Them. Available online: https://www.Meta-Analysis-Books.com. (accessed on 22 March 2024).
  47. Borenstein, M.; Hedges, L.V.; Higgins, J.P.T.; Rothstein, H. Fixed-Effect Versus Random-Effects Models. Available online: https://meta-analysis.com/pages/books?cart= (accessed on 22 April 2024).
  48. Borenstein, M.; Hedges, L.V.; Higgins, J.P.T.; Rothstein, H.R. A basic introduction to fixed-effect and random-effects models for meta-analysis. Res. Synth. Methods 2010, 1, 97–111. [Google Scholar] [CrossRef]
  49. Hedges, L.V.; Vevea, J.L. Fixed- and random-effects models in meta-analysis. Psychol. Methods 1998, 3, 486–504. [Google Scholar] [CrossRef]
  50. Gomes, E.; Antunes, I.; Leitão, B. Groundwater management: Effectiveness of mitigation measures in nitrate vulnerable zones—A Portuguese case study. Groundw. Sustain. Dev. 2023, 21, 100899. [Google Scholar] [CrossRef]
  51. Diana, C.C.; Balint, A.C.; Neamțu, C.V.; Moșneag, S.C.; Bordea, D.; Dîrjan, S.; Odagiu, A.C.M. Assessment of Groundwater Quality in Relation to Organic versus Mineral Fertilization. Water 2023, 15, 2895. [Google Scholar] [CrossRef]
  52. Campbell, T.A.; Masarik, K.C.; Heineman, E.M.; Kucharik, C.J. Quantifying the spatiotemporal variability of nitrate in irrigation water across the Wisconsin Central Sands. J. Environ. Qual. 2023, 52, 1102–1114. [Google Scholar] [CrossRef]
  53. Hou, L.; Liu, Z.; Zhai, B.; Zhu, Y.; Xu, X. Contrasting water quality in response to long-term nitrogen fertilization in rainfed and irrigated apple-producing regions on China’s Loess Plateau. Agric. Ecosyst. Environ. 2023, 354, 108561. [Google Scholar] [CrossRef]
  54. Chowdhuri, I.; Pal, S.C. Hydrochemical properties of groundwater and land use and land cover changes impact on agricultural productivity: An empirical observation and integrated framework approaches. J. Geochem. Explor. 2024, 258, 107402. [Google Scholar] [CrossRef]
  55. Rey-Romero, D.C.; Domínguez, I.; Oviedo-Ocaña, E.R. Effect of agricultural activities on surface water quality from páramo ecosystems. Environ. Sci. Pollut. Res. 2022, 29, 83169–83190. [Google Scholar] [CrossRef]
  56. Wieczorek, K.; Turek, A.; Wolf, W.M. Combined Effect of Climate and Anthropopressure on River Water Quality. Int. J. Environ. Res. Public Health 2023, 20, 3032. [Google Scholar] [CrossRef]
  57. Kelepertzis, E.; Matiatos, I.; Botsou, F.; Antonopoulou, C.; Lappas, I.; Dotsika, E.; Chrastný, V.; Boeckx, P.; Karavoltsos, S.; Komárek, M. Assessment of natural and anthropogenic contamination sources in a Mediterranean aquifer by combining hydrochemical and stable isotope techniques. Sci. Total. Environ. 2022, 858, 159763. [Google Scholar] [CrossRef]
  58. Unigwe, C.O.; Egbueri, J.C.; Omeka, M.E. Geospatial and statistical approaches to nitrate health risk and groundwater quality assessment of an alluvial aquifer in SE Nigeria for drinking and irrigation purposes. J. Indian Chem. Soc. 2022, 99, 100479. [Google Scholar] [CrossRef]
  59. Buss, J.; Achten, C. Spatiotemporal variations of surface water quality in a medium-sized river catchment (Northwestern Germany) with agricultural and urban land use over a five-year period with extremely dry summers. Sci. Total. Environ. 2022, 818, 151730. [Google Scholar] [CrossRef]
  60. Rachid, B.; Lamri, D.; Alibrahmi, E.; Slimane, H.; Boujdi, R.; Lamrioui, D.; Hassouni, T.; Mehdi, E.; Ibrahimi, A. Water Pollution and Degradation in the SEBOU Watershed and Their Impact on Human Health (Region of GHARB-Morocco). Int. J. Chem. Biol. Sci. 2023, 24, 346–358. [Google Scholar]
  61. He, S.; Li, P.; Su, F.; Wang, D.; Ren, X. Identification and apportionment of shallow groundwater nitrate pollution in Weining Plain, northwest China, using hydrochemical indices, nitrate stable isotopes, and the new Bayesian stable isotope mixing model (MixSIAR). Environ. Pollut. 2022, 298, 118852. [Google Scholar] [CrossRef]
  62. Jamal, S.; Ahmad, W.S.; Ajmal, U.; Aaquib; Ali, A.; Ali, B.; Ahmed, S. An Integrated Approach for Determining the Anthropogenic Stress Responsible for Degradation of a Ramsar Site—Wular Lake in Kashmir, India. Mar. Geodesy 2022, 45, 407–434. [Google Scholar] [CrossRef]
  63. Jamshidi, A.; Morovati, M.; Mofrad, M.M.G.; Panahandeh, M.; Soleimani, H.; Alamdari, H.A. Water quality evaluation and non-cariogenic risk assessment of exposure to nitrate in groundwater resources of Kamyaran, Iran: Spatial distribution, Monte-Carlo simulation, and sensitivity analysis. J. Environ. Health Sci. Eng. 2021, 19, 1117–1131. [Google Scholar] [CrossRef]
  64. Chen, J.; Luo, M.; Ma, R.; Zhou, H.; Zou, S.; Gan, Y. Nitrate distribution under the influence of seasonal hydrodynamic changes and human activities in Huixian karst wetland, South China. J. Contam. Hydrol. 2020, 234, 103700. [Google Scholar] [CrossRef]
  65. Rodriguez, J.; Perez, B.; Nebot, C.; Falque, E.; Simal-Gandara, J. Food production link to underground waters quality in A Limia river basin. Agric. Ecosyst. Environ. 2020, 297, 106969. [Google Scholar] [CrossRef]
  66. Ge, D.; Gao, X.; Jiang, P.; Li, B.; He, N.; Wu, Y.; He, Q.; Cai, Y.; Li, C.; Zhao, X. Deep soil desiccation hinders nitrate leaching to groundwater in the global largest apple cultivation area. J. Hydrol. 2024, 637, 131334. [Google Scholar] [CrossRef]
  67. Zhang, X.; Ward, B.B.; Sigman, D.M. Global Nitrogen Cycle: Critical Enzymes, Organisms, and Processes for Nitrogen Budgets and Dynamics. Chem. Rev. 2020, 120, 5308–5351. [Google Scholar] [CrossRef]
  68. Ma, Z.; Yue, Y.; Feng, M.; Li, Y.; Ma, X.; Zhao, X.; Wang, S. Mitigation of ammonia volatilization and nitrate leaching via loss control urea triggered H-bond forces. Sci. Rep. 2019, 9, 15140. [Google Scholar] [CrossRef]
  69. Govindasamy, P.; Muthusamy, S.K.; Bagavathiannan, M.; Mowrer, J.; Jagannadham, P.T.K.; Maity, A.; Halli, H.M.; K., S.G.; Vadivel, R.; K., D.T.; et al. Nitrogen use efficiency—A key to enhance crop productivity under a changing climate. Front. Plant Sci. 2023, 14, 1121073. [Google Scholar] [CrossRef]
  70. Sainju, U.M. Determination of nitrogen balance in agroecosystems. MethodsX 2017, 4, 199–208. [Google Scholar] [CrossRef]
  71. Anderson, D.M.; Fachon, E.; Pickart, R.S.; Lin, P.; Fischer, A.D.; Richlen, M.L.; Uva, V.; Brosnahan, M.L.; McRaven, L.; Bahr, F.; et al. Evidence for massive and recurrent toxic blooms of Alexandrium catenella in the Alaskan Arctic. Proc. Natl. Acad. Sci. USA 2021, 118, e2107387118. [Google Scholar] [CrossRef]
  72. Paerl, H.W.; Otten, T.G.; Kudela, R. Mitigating the Expansion of Harmful Algal Blooms Across the Freshwater-to-Marine Continuum. Environ. Sci. Technol. 2018, 52, 5519–5529. [Google Scholar] [CrossRef]
  73. You, Z.; Wang, C.; Yang, X.; Liu, Z.; Guan, Y.; Mu, J.; Shi, H.; Zhao, Z. Effects of eutrophication on the horizontal transfer of antibiotic resistance genes in microalgal-bacterial symbiotic systems. Environ. Res. 2024, 251, 118692. [Google Scholar] [CrossRef]
  74. Hamlin, Q.F.; Martin, S.L.; Kendall, A.D.; Hyndman, D.W. Examining Relationships Between Groundwater Nitrate Concentrations in Drinking Water and Landscape Characteristics to Understand Health Risks. GeoHealth 2022, 6. [Google Scholar] [CrossRef]
  75. European Environmental Agency. Nitrate in Groundwater. Available online: https://www.eea.europa.eu/en/analysis/indicators/nitrate-in-groundwater-8th-eap#:~:text=The%20Groundwater%20Directive%20and%20the (accessed on 8 April 2024).
  76. Ward, M.H.; Dekok, T.M.; Levallois, P.; Brender, J.; Gulis, G.; Nolan, B.T.; VanDerslice, J. Workgroup Report: Drinking-Water Nitrate and Health—Recent Findings and Research Needs. Environ. Health Perspect. 2005, 113, 1607–1614. [Google Scholar] [CrossRef]
  77. Ward, M.; Jones, R.; Brender, J.; de Kok, T.; Weyer, P.; Nolan, B.; Villanueva, C.; van Breda, S. Drinking Water Nitrate and Human Health: An Updated Review. Int. J. Environ. Res. Public Health 2018, 15, 1557. Available online: https://www.ncbi.nlm.nih.gov/pmc/articles/PMC6068531/ (accessed on 3 April 2024). [CrossRef]
  78. Serra, J.; Marques-Dos-Santos, C.; Marinheiro, J.; Cruz, S.; Cameira, M.; de Vries, W.; Dalgaard, T.; Hutchings, N.; Graversgaard, M.; Giannini-Kurina, F.; et al. Assessing nitrate groundwater hotspots in Europe reveals an inadequate designation of Nitrate Vulnerable Zones. Chemosphere 2024, 355, 141830. [Google Scholar] [CrossRef]
  79. Yi, B.; Zhang, Q.; Gu, C.; Li, J.; Abbas, T.; Di, H. Effects of different fertilization regimes on nitrogen and phosphorus losses by surface runoff and bacterial community in a vegetable soil. J. Soils Sediments 2018, 18, 3186–3196. [Google Scholar] [CrossRef]
  80. Wu, M.; Li, G.; Li, W.; Liu, J.; Liu, M.; Jiang, C.; Li, Z. Nitrogen Fertilizer Deep Placement for Increased Grain Yield and Nitrogen Recovery Efficiency in Rice Grown in Subtropical China. Front. Plant Sci. 2017, 8, 1227. [Google Scholar] [CrossRef]
  81. Shaheb, M.R.; Sarker, A.; Shearer, S.A. Precision Agriculture for Sustainable Soil and Crop Management. In IntechOpen eBooks; IntechOpen: London, UK, 2022. [Google Scholar] [CrossRef]
  82. Graham, R.F.; Wortman, S.E.; Pittelkow, C.M. Comparison of Organic and Integrated Nutrient Management Strategies for Reducing Soil N2O Emissions. Sustainability 2017, 9, 510. [Google Scholar] [CrossRef]
  83. Rey-Romero, D.C.; Méndez, Y.L.; Daza-Torres, M.C.; Domínguez, I.; Oviedo-Ocaña, E.R. Challenges and opportunities for the sustainable nitrogen management in a páramo agroecosystem: Insights from local soil knowledge and farming practices. Agroecol. Sustain. Food Syst. 2025, 1–36. [Google Scholar] [CrossRef]
  84. Wang, C.; Wang, X.; Zhang, G.; Zhang, F.; Li, J.; Chen, S.; Sauvage, S.; Sánchez-Pérez, J.-M.; Han, Y.; Liu, J. Identification of critical effect factors for prediction of spatial and intra-annual variability of shallow groundwater nitrate in agricultural areas. Sci. Total. Environ. 2023, 891, 164342. [Google Scholar] [CrossRef]
  85. Viechtbauer, W. Conducting Meta-Analyses in R with the metafor Package. J. Stat. Softw. 2010, 36, 1–48. [Google Scholar] [CrossRef]
  86. Perivolioti, T.-M.; Zachopoulos, K.; Zioga, M.; Tompoulidou, M.; Katsavouni, S.; Kemitzoglou, D.; Terzopoulos, D.; Mouratidis, A.; Tsiaoussi, V. Monitoring the Impact of Floods on Water Quality Using Optical Remote Sensing Imagery: The Case of Lake Karla (Greece). Water 2024, 16, 3502. [Google Scholar] [CrossRef]
  87. Wieczorek, K.; Turek, A.; Szczesio, M.; Wolf, W.M. A holistic approach to the spatio-temporal variability investigation of the main river water quality—The importance of tributaries. Sci. Total. Environ. 2023, 906, 167588. [Google Scholar] [CrossRef]
  88. Nakagawa, S.; Yang, Y.; Macartney, E.L.; Spake, R.; Lagisz, M. Quantitative evidence synthesis: A practical guide on meta-analysis, meta-regression, and publication bias tests for environmental sciences. Environ. Evid. 2023, 12, 8. [Google Scholar] [CrossRef]
  89. Wey, H.; Hunkeler, D.; Bischoff, W.-A.; Bünemann, E.K. Field-scale monitoring of nitrate leaching in agriculture: Assessment of three methods. Environ. Monit. Assess. 2021, 194, 4. [Google Scholar] [CrossRef]
  90. Assa, B.G.; Bhowmick, A.; Cholo, B.E. Assessing Nitrate Leaching and Runoff Coefficients in the Dynamic Interplay of Seasonal Crop Biomass: A Study of Surface and Groundwater Nitrate Contamination in the Bilate Cropland Watershed. Environ. Adv. 2024, 16, 100528. [Google Scholar] [CrossRef]
  91. Liu, Y.; Zhang, Y.; Lv, H.; Zhao, L.; Wang, X.; Yang, Z.; Li, R.; Chen, W.; Song, G.; Gu, H. Research on the traceability and treatment of nitrate pollution in groundwater: A comprehensive review. Environ. Geochem. Health 2025, 47, 107. [Google Scholar] [CrossRef]
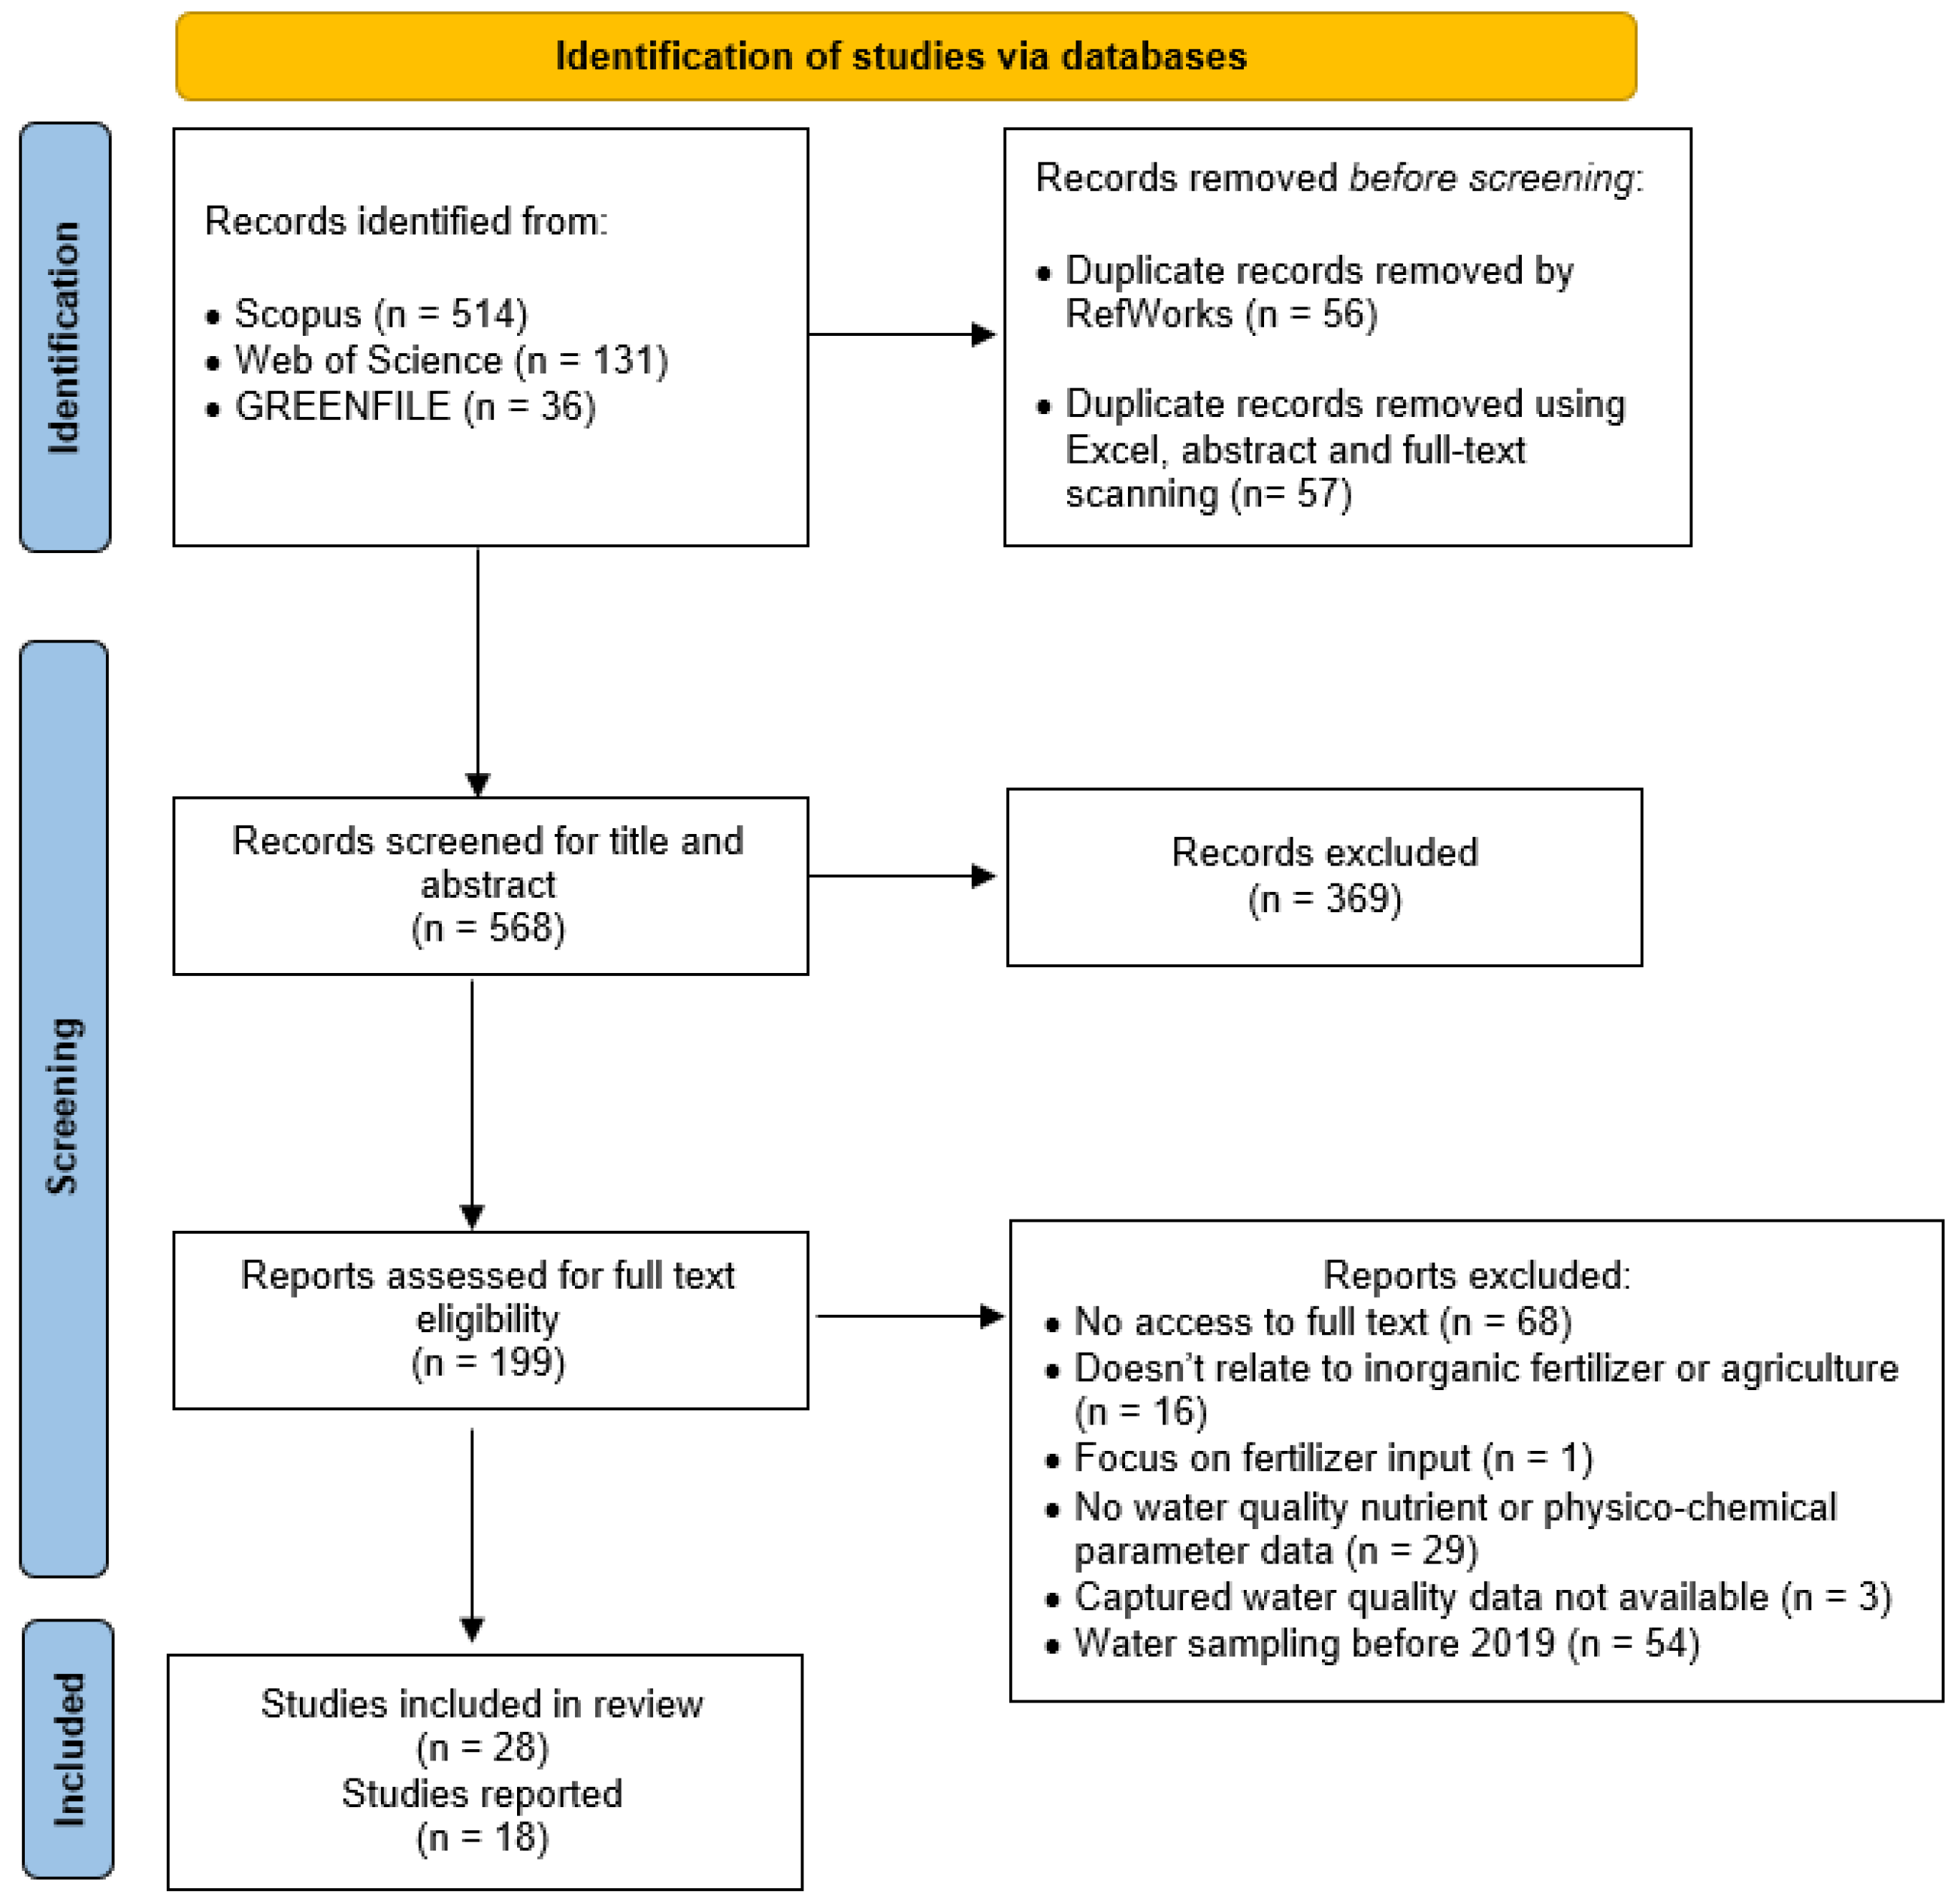
Figure 1. PRISMA flow chart showing the study selection process.
Pollutants 05 00021 g001
Figure 2. Distribution of true effects for nitrate concentration across 18 included studies using a random-effects model.
Pollutants 05 00021 g002
Figure 3. Meta-analysis of nitrate concentrations in various water bodies across the 18 included studies [33,50,51,52,53,54,55,56,57,58,59,60,61,62,63,64,65,66].
Pollutants 05 00021 g003
Figure 4. Heterogeneity assessment of nitrate concentration effects across studies using relative weights in the random-effects model [33,50,51,52,53,54,55,56,57,58,59,60,61,62,63,64,65,66].
Pollutants 05 00021 g004
Figure 5. Sensitivity analysis showing the effect of removing one study at a time on the overall estimate of nitrate concentration [33,50,51,52,53,54,55,56,57,58,59,60,61,62,63,64,65,66].
Pollutants 05 00021 g005
Figure 6. Initial funnel plot.
Pollutants 05 00021 g006
Figure 7. Funnel plot with Trim and Fill adjustment. The blue circles represent the mean nitrate concentration reported in each of the 18 included studies. The blue diamond indicates the observed pooled effect size from the included studies. The red diamond shows the adjusted effect size after accounting for potential publication bias using the Trim and Fill method.
Pollutants 05 00021 g007
Table 1. Synthesised data for meta-analysis.
S/NStudySample SizeMean *
(mg/L NO3)
SD *
(mg/L NO3)
1[50]172862.464
2[33]105.240.462
3[51]1044.682.12
4[52]344197.33
5[53]807.728.43
6[54]3755.9781.09
7[55]360.7630.137
8[56]1714.3817.58
9[57]4183.167.1
10[58]1913.169.96
11[59]51917.812.25
12[60]20221.81217.28
13[61]122100138
14[62]7188.5715.73
15[63]4522.4211.44
16[64]5820.8420.08
17[65]12027.6929.54
18[66]2049.4615.38
* Mean and standard deviation (SD) values represent the nitrate concentration.
Disclaimer/Publisher’s Note: The statements, opinions and data contained in all publications are solely those of the individual author(s) and contributor(s) and not of MDPI and/or the editor(s). MDPI and/or the editor(s) disclaim responsibility for any injury to people or property resulting from any ideas, methods, instructions or products referred to in the content.