Article

Assessment of Possibly Toxic Elements in Landfill Soils and Their Impacts on the Ecosystem in Alice, South Africa

by
Nontobeko Gloria Maphuhla
* and
Opeoluwa Oyehan Oyedeji
Department of Chemistry, Faculty of Science and Agriculture, University of Fort Hare, 1 King Williams Town Road, Private Bag X1314, Alice Campus, Alice 5700, South Africa
*
Author to whom correspondence should be addressed.
Pollutants 2024, 4(2), 291-301; https://doi.org/10.3390/pollutants4020019
Submission received: 10 March 2024 / Revised: 20 April 2024 / Accepted: 21 May 2024 / Published: 3 June 2024

Abstract

:
Soil contamination by metallic components is an obscure, detrimental, protracted, and irreparable predicament. Dumping of waste containing heavy metals into landfills, fertilizer and pesticide application, and coal combustion results in high toxicity of metallic elements, and their continuous accumulation in soil pollutes the environment, which, in turn, poses a threat to human health. The specimens were subsequently dehydrated, processed for mineralization, and carefully examined microscopically by scanning electron microscopy and energy-dispersive X-ray spectroscopy (SEM/EDX), which examined their mineral substance, crystalline configuration, and chemical composition. Thirteen (13) elements were detected, and only eight (8) metals were discovered (K, Mg, Na, Ca, Al, Fe, Au, Ba), including non-metals (C, O, Cl, P) and a metalloid (Si). The concentrations of possibly toxic elements obtained showed no consistent succession, as they fluctuated across the examined sites. The Al concentration ranged from 3.78 ± 0.23 wt% to 10.23 ± 0.31 wt%, while the Fe concentration fluctuated from 4.14 ± 0.40 wt% to 13.13 ± 1.07 wt%. Na and Mg levels were present in all samples, but their availability was minimal, at less than 2.0 wt%, ranging between 1.44 ± 0.20 wt% and 0.31 ± 0.08 wt%. The concentrations of Ca and K were low in all soil samples, ranging from 0.91 ± 0.14 wt% to 5.56 ± 0.47 wt% for Ca and from 1.32 ± 0.25 wt% to 4.87 ± 0.18 wt% for K. During the investigation at the designated and control areas, it was discovered that the concentrations of potentially hazardous metals exceeded the accepted limits established by the World Health Organization (WHO) > 100 ppm. The findings provide proof of metallic contaminants in the study region, which calls for proper monitoring, management, and remedial measures of metal-tainted sites, since the residents of this locality are at a significantly elevated risk of experiencing adverse effects due to their heightened exposure to these elements. As a result of that, there is an imperative need to monitor and regulate this area regularly and appropriately. The study recommends sustainable farming practices, where farmers could use natural fertilizers and compost, as well as, the implementation of proper waste management, effective recycling techniques, and proper disposal of substances containing heavy metals as byproducts. Further implement remediation techniques that effectively and safely restore soils contaminated by metals in an environmentally sustainable and economically efficient manner.

1. Introduction

Alice is a small town surrounded by numerous economic and academic activities, and faces the challenges of a densely populated area and increasing pollution. Recent studies have shown that the environmental condition in the community is deteriorating due to the presence of suppurating waste, poor solid waste management, and mismanaged landfill sites [1,2]. The waste removal service has become inadequate and ineffective, leading to individuals disposing of their waste indiscriminately, even in areas where waste bins are available. However, these bins are constantly full as they serve a large population, resulting in unattended waste being left in the environment. The municipality still relies on landfilling as a waste management practice, but the Alice landfill site is poorly managed, and there is no proper waste management within the site. The soil is filled with waste products, such as plastics, gadgets, power sources, chemicals, and other hazardous materials, which are scattered carelessly. The accumulation of waste in the environment has compelled waste pickers to burn the garbage, resulting in the emission of hazardous fumes. These fumes linger above settlements, causing distress and discomfort to individuals with respiratory illnesses and other complications, while also exposing everyone to a harmful mixture of micro-chemicals [3]. These substances, when released into the environment, emit toxic compounds, such as heavy metals, that have the potential to poison animals, contaminate water sources, and negatively impact human health as they infiltrate the soil [4]. Potentially toxic elements (heavy metals) are defined as those elements with a density greater than 5.0 g·cm−3, such as Cd, Pb, Fe, Hg, Mn, Zn, and Cu. Although some elements (Fe and Zn) are essential for the growth and functioning of microorganisms, they can be harmful when present in large amounts. Local communities face the potential danger of being exposed to high levels of metal contamination, which is one of the most severe forms of environmental pollution due to its inherent toxicity and ability to infiltrate the soil, air, and water systems when present in large amounts [3]. Metal pollution in soils impacts biological function, leading to a slowdown in decomposition processes, which are crucial for providing the necessary nutrients for the growth of plants and organisms [3,5]. Soil can naturally contain metallic elements due to pedogenetic processes, as well as being released into the environment through human activities, including vehicle emissions, energy production, industrial activities, and waste disposal [5].
The study aims to critically evaluate the presence of potentially toxic elements in soil and their effects on human health, and to devise remediation processes to mitigate the growing problem of environmental pollution caused by potentially toxic metals. This research will assist municipal authorities in developing diverse methods to remediate soil contamination, with the goal of safeguarding all aspects of the environment (soil, water, and atmosphere), as well as public health, to promote a healthy and eco-friendly ecosystem [6].

2. Materials and Methods

2.1. Description of the Study Area

The research team carried out the research in Alice township, Nkonkobe Municipality, in the Eastern Cape Province, focusing on the Alice dumpsite and the University of Fort Hare east campus as examination sites (Figure 1). Latitudes 32°48′24.88″ S mark the location of the landfill. The landfill is approximately 2 km from the Happy Rest residential area, and the east campus, used as a control site, is 4 km from the disposal site. Vegetation surrounds the unpolluted site (Site 2 or D), located opposite the university barrier, providing it with effective protection from the natural environment. A, B, and C are the three sections that make up the landfill (Site 1), each with its own distinctive characteristics and waste management activities.

2.2. Collection and Preparation of Soil Sample

Soil samples were taken at random at depths, ranging from 0 to 25 cm, over a period of four weeks. A clean soil auger was used to collect samples from three portions of Site 1 and Site D (reference site). The dry soil samples were collected and then placed in clean, labeled plastic bags before being sent to the laboratory for further examination [7]. The soil samples were ground with a pestle and mortar and then strained through a 2 mm mesh to obtain uniform and acceptable samples. Each sample was divided in half and stored at room temperature until the analysis [8].

2.3. Elemental Analysis by SEM/EDX Spectrophotometry

The soil samples were dried in an oven at 60 °C for 4 h to reduce moisture content and were crushed using an agate mortar into a fine powder, which was then sieved through a 0.2 mm screen. A scanning electron microscopy (SEM) and energy-dispersive X-ray spectroscopy (EDX) instrument was set to examine the samples. The instrument was operated at a working distance of 15 mm, with analytical conditions set at 15 kV. Count rates were adjusted to achieve more than 15–20 thousand counts per second (kcps), and the beam intensity was standardized using a clean copper (Cu) reference [9,10].
The concentration of metals has been determined at specific sites by using pollution load index (PLI); PLI is defined by the following equation:
P L I = C i C b
where Ci stands for metal concentration in investigated soil and Cb measures the concentration of reference value of the metal in soil [11,12]

2.4. Statistical Analysis

The IBM Statistical Package for the Social Sciences (SPSS) 28, version 28.0, was utilized for data analysis (IBM, Armonk, NY, USA). Pearson’s correlation was used to examine relationships between identified heavy metals and selected enzymatic activity. The Fort Hare University Research Ethics Committee (UREC) granted ethical approval for this project, with certificate number OYE021SMAP01/19/E.

3. Results

3.1. Soil Morphology

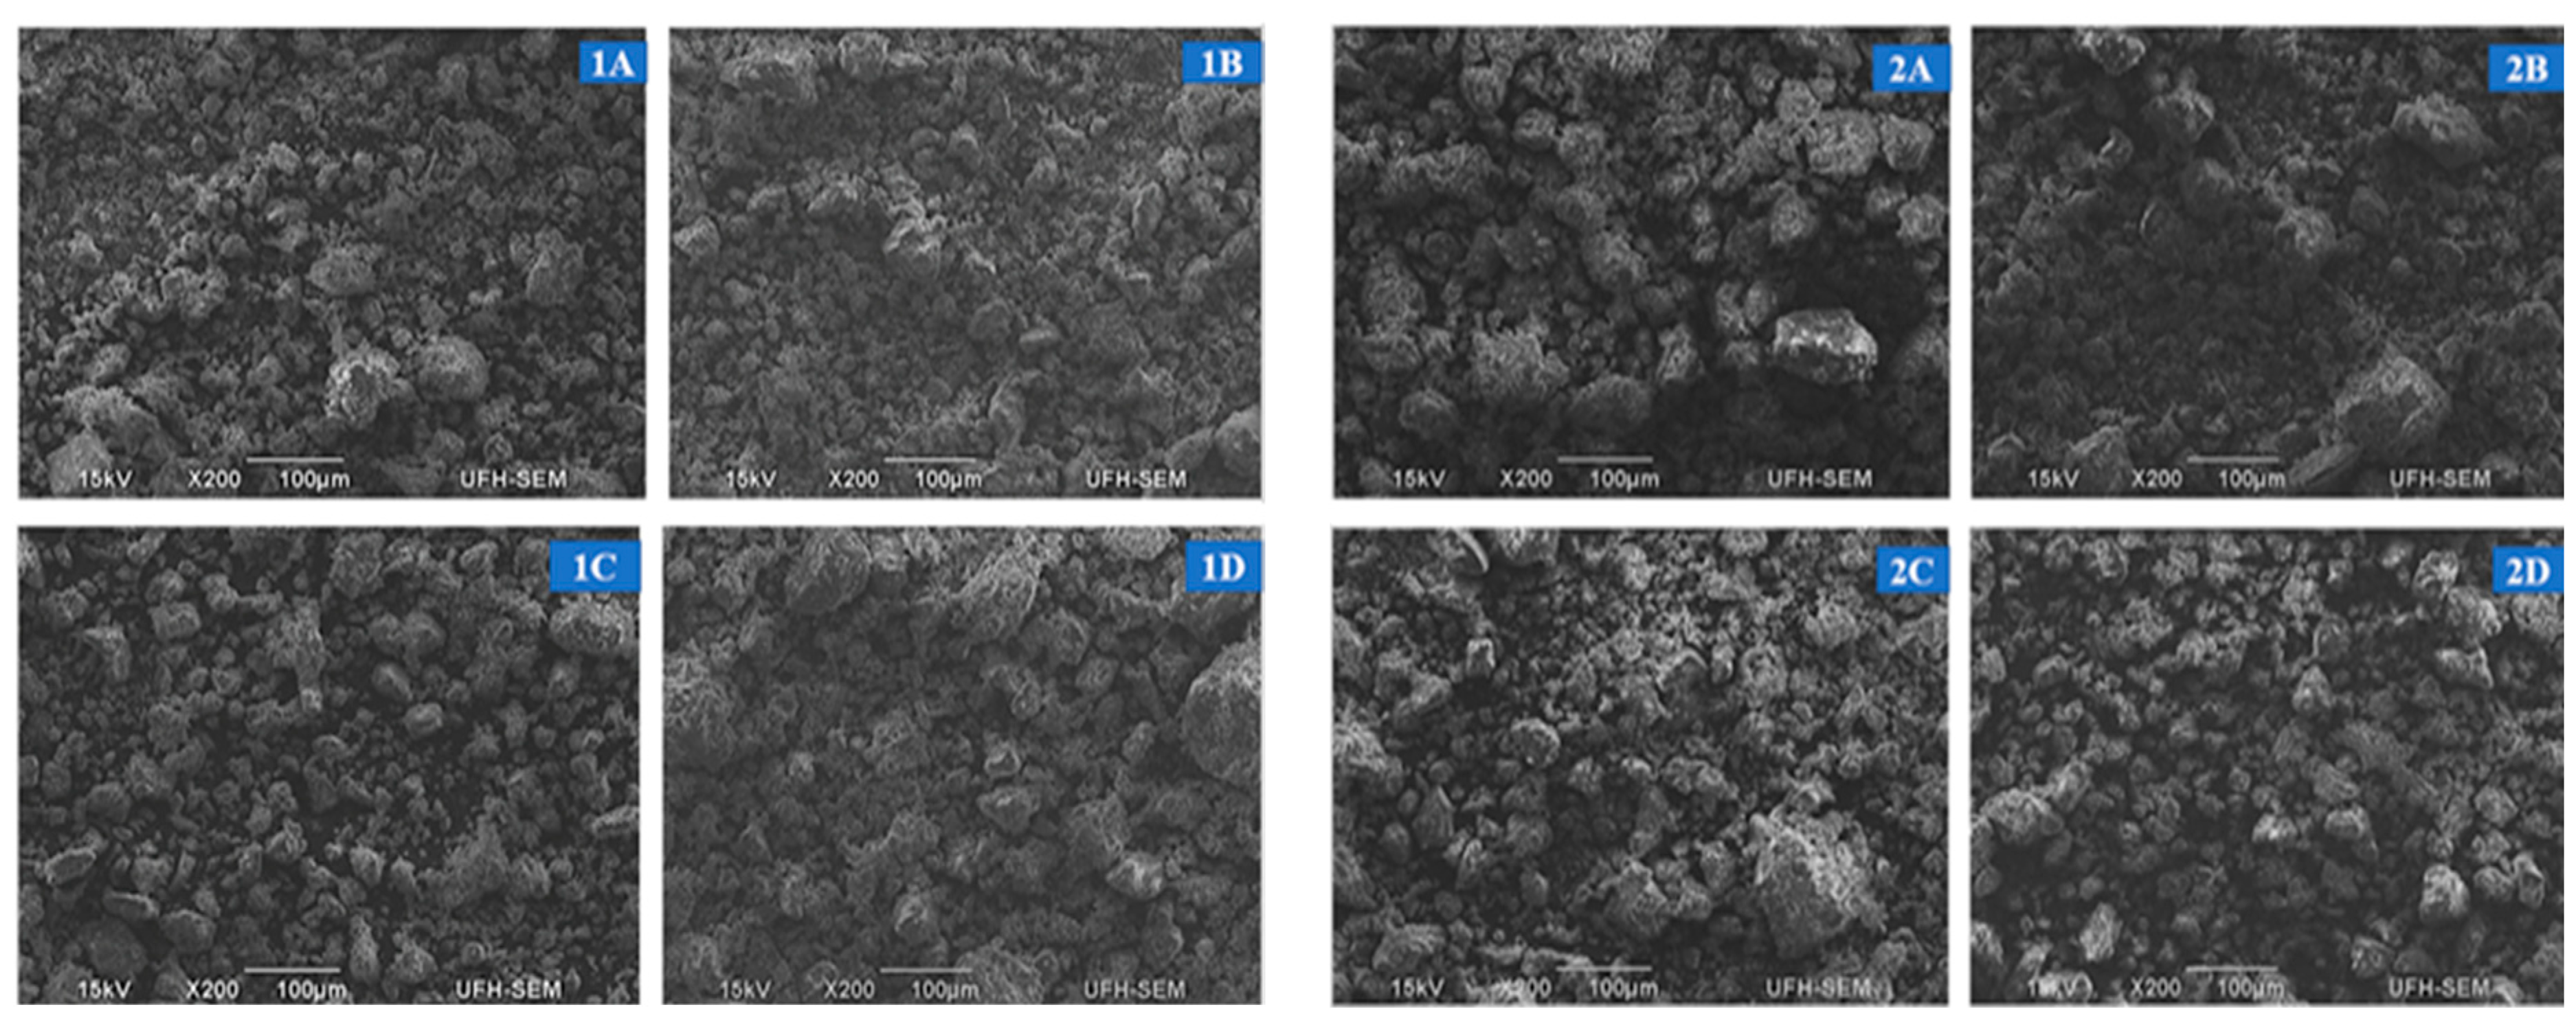
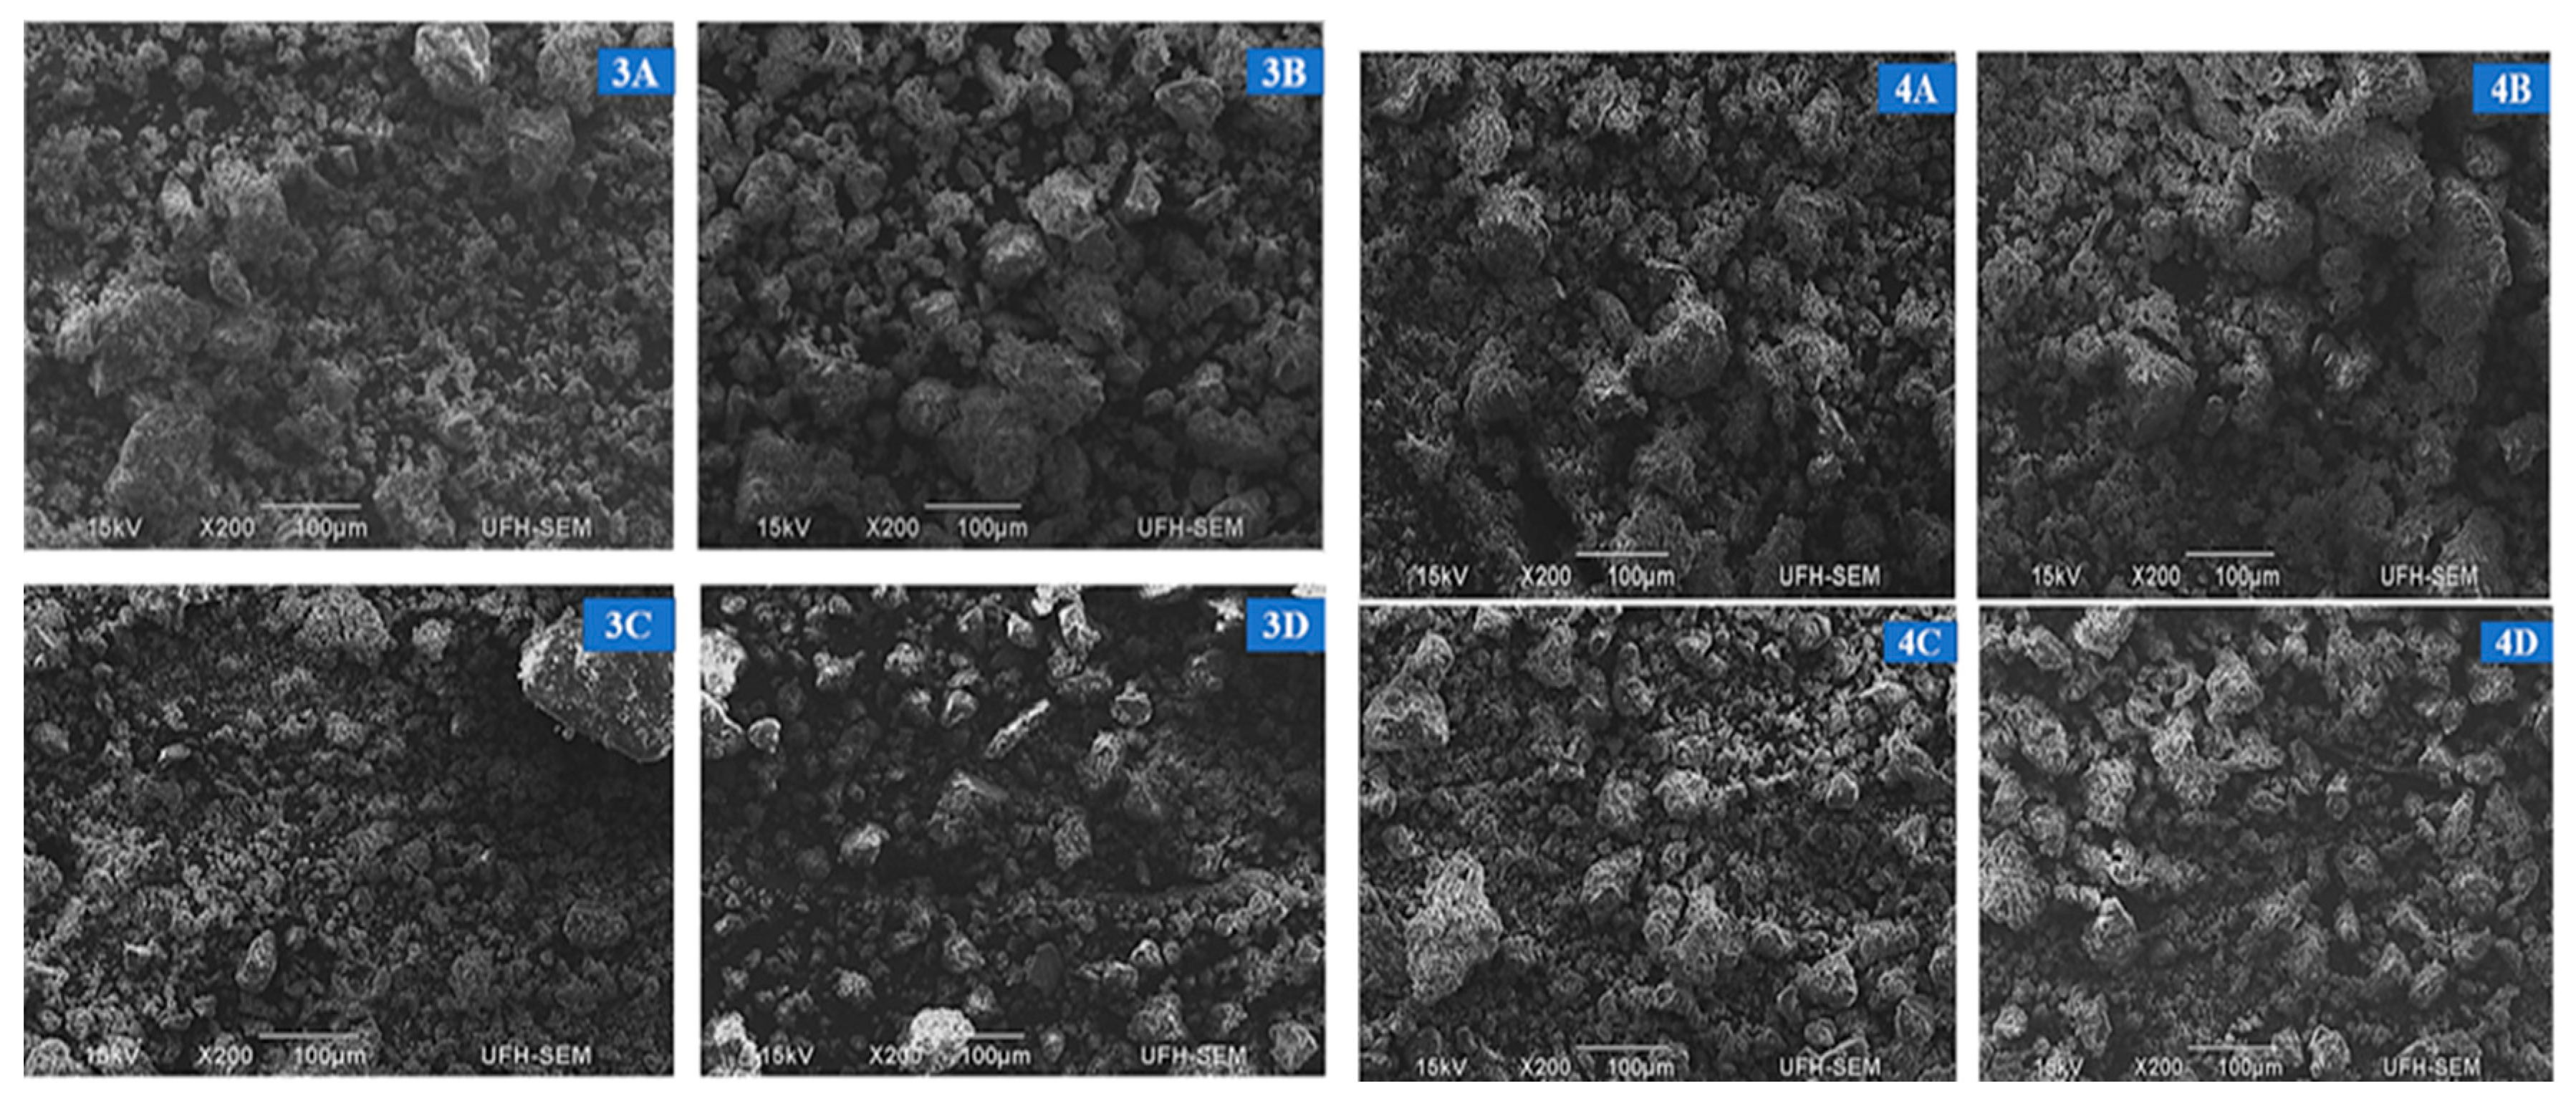
Scanning electron microscopy (SEM) analyzes soil samples’ surface morphology and structure. SEM images showing the topography of the soil samples from three sections of the landfill site and one control site are presented in Figure 2 and Figure 3. All the soil samples consisted of micrometer-scale grains of varying particle sizes and non-uniform structures. The morphology and surface characteristics of the sample fragments exhibited significant variation due to their diverse sources, including partial oxidation of surface components, veld wildfires, and waste incineration. The samples’ surfaces appear uneven and rough in the SEM photos. The SEM images of the particles reveal irregular and asymmetrical shapes, as well as the presence of tiny pores. Pore size is crucial because it affects the permeability of the compost, which, in turn, determines the soil’s water retention capacity [10]. Samples displayed both large particle aggregates and a wide distribution of particle sizes.

3.2. Distribution of Major Elements

The concentration of the thirteen (13) identified elements is tabulated in Table 1 and measured in weight percentage (wt%).
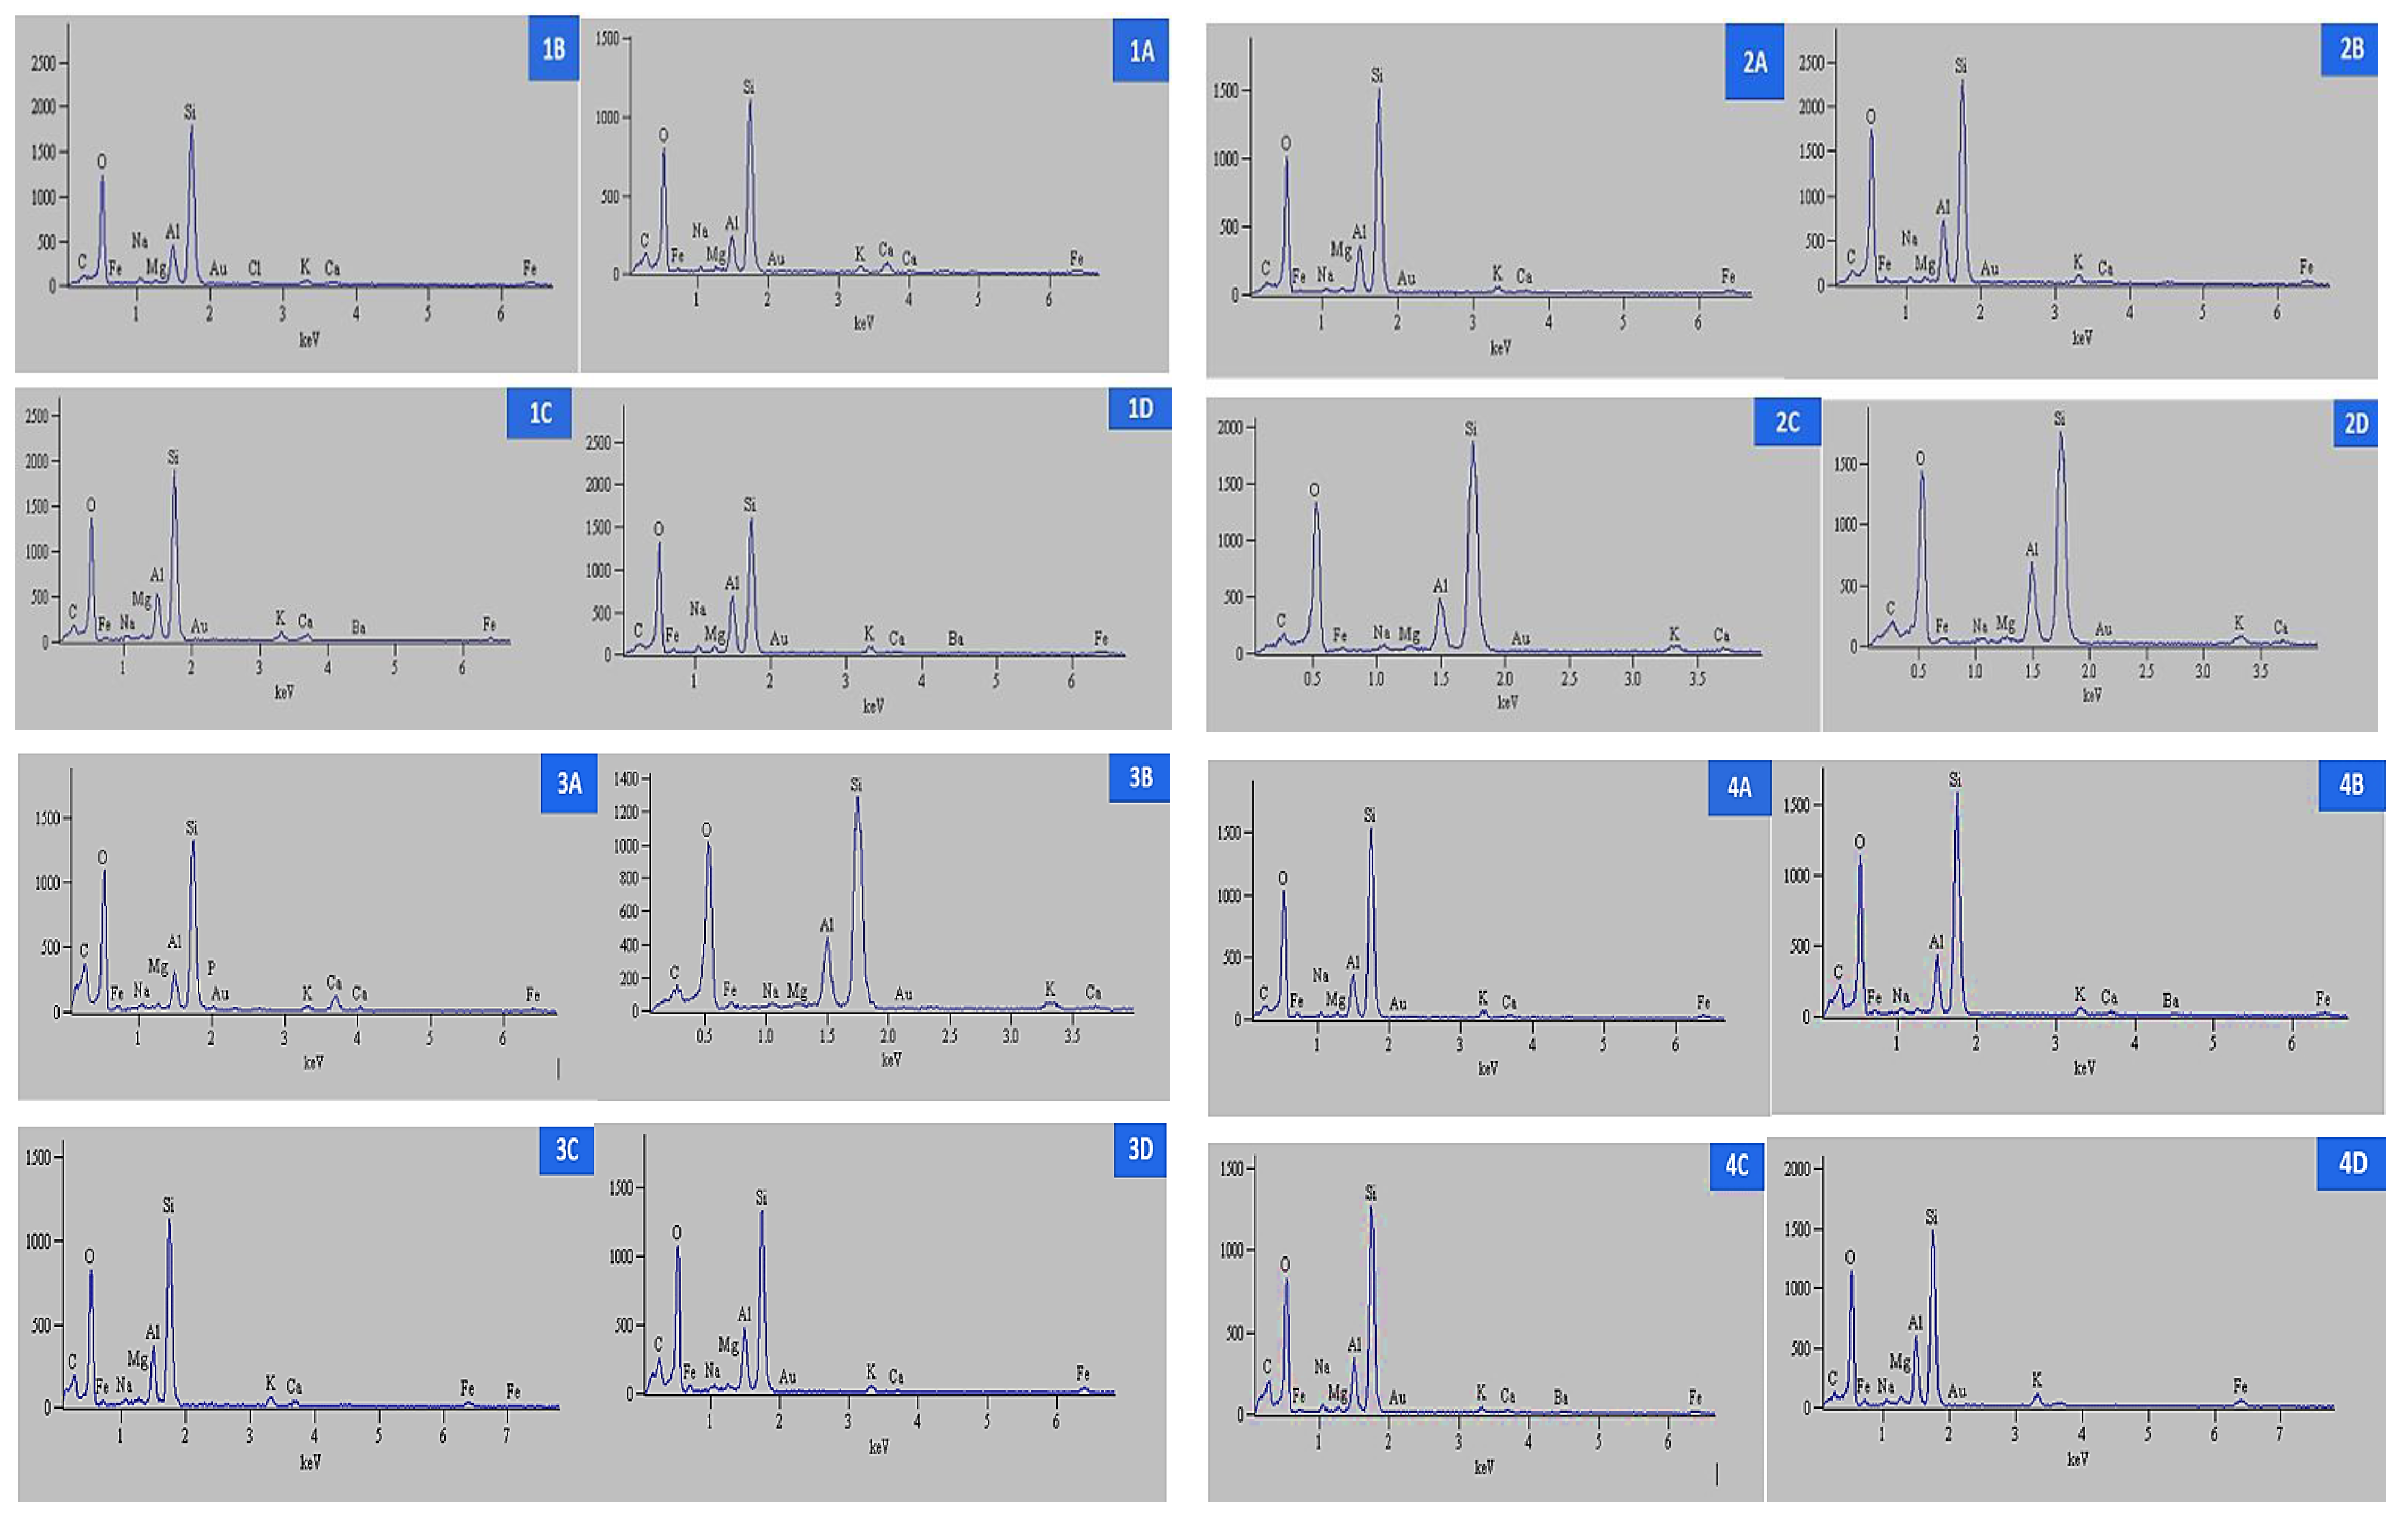
The concentrations of detected elements are presented in Table 1 and were measured in weight percent (wt%) due to the elevated elemental content found in the analyzed samples. Thirteen elements were detected in soil samples through EDX analysis, namely: sodium (Na), calcium (Ca), aluminum (Al), potassium (K), magnesium (Mg), iron (Fe), silicon (Si), gold (Au), carbon (C), barium (Ba), oxygen (O), chlorine (Cl), and phosphorus (P). The spatial distribution of these components on the surface displays non-uniformity, suggesting a profoundly heterogeneous molecular structure and provenance. Elements such as Na, C, Ca, O, Fe, Mg, K, Al, and Si were detected in all soil specimens, albeit with varying levels from one sampling location to another. The soil samples manifested a notable chemical constitution, predominantly characterized by elevated concentrations of Al and Fe across all sampling sites, with Al levels ranging from 3.78 ± 0.23 wt% to 10.23 ± 0.31 wt%, and Fe levels oscillating between 4.14 ± 0.40 wt% to 13.13 ± 1.07 wt%. Despite the ubiquitous presence of Na and Mg in the samples, their abundance remained minimal, constituting less than 2.0 wt%, within the range of 1.44 ± 0.20 wt% to 0.31 ± 0.08 wt%. The concentrations of Ca and K were relatively scant in all soil specimens, varying from 0.91 ± 0.14 wt% to 5.56 ± 0.47 wt% for Ca and from 1.32 ± 0.25 wt% to 4.87 ± 0.18 wt% for K. Both the investigated and reference sites exhibited metal concentrations surpassing the permissible thresholds (>100 ppm) recommended by the World Health Organization (WHO), as delineated in Table 1 and Figure 4. The results reported correspond with the documented findings by Shaibu et al., 2023, demonstrating heightened concentrations of Ca, Na, K, Mg, and Fe, while still adhering to the permissible ranges specified by the World Health Organization, apart from Fe levels that went beyond the acceptable limits [16]. The pollution load index defined the detected elements to have moderate contaminant effects on the surroundings, specifically Si and Ca, which were recorded between 1 to 3 (Appendix A).
Au, Ba, Cl, and P were present in trace amounts, each constituting less than 1 wt%. These elements were not present in all samples; they were found at other sites with lower concentrations. Cl content was present during the first week of sampling at Site 1B, with a minimum concentration of 0.84 ± 0.11 wt%.
Gold (Au) concentration was observed in some sampling sites but not in others, ranging from 0.26 ± 0.16 wt% to 7.43 ± 4.67 wt%. Meanwhile, the Ba composition was found in several locations, with recorded content ranging between 1.72 ± 0.47 wt% and 4.73 ± 0.44 wt%, which is less than 5 wt%. The P element was only discovered at Site 3A, with a concentration of 0.57 ± 0.10 wt%.

3.3. Pearson Correlation Matrix

The trace elements that were identified exhibited a robust correlation with each other as presented in Table 2. A notable positive statistically significant correlation was observed between Fe, Mg, Al, and K, while Fe correlated statistically significantly negatively with Ca concentration. A robust association among the detected metallic elements suggests their shared provenance within the studied area, with their alignments influenced by similar determining factors [17]. Conversely, a significant negative correlation was found between calcium (Ca) and Al, Na, Mg, and K. These data indicate that these elements originated from a shared source throughout the study area. Kadhim et al., 2023, found significant differences in metals, where metals (Ca, Mg, Na, Cu, Zn, Mn, and Fe) were significantly different (p < 0.05) across study sites [18].

4. Discussion

Soil specimens are comprised of clearly defined, heterogeneous particles exhibiting asymmetrical and porous configurations, as well as irregular fragments and elongated shapes. Scanning electron microscope (SEM) images reveal that soil specimens originating from diverse geographical locations possess unique morphologies and surface composition ratios. Clay, fine sand, and high-density fractions exhibit perforated surfaces, with textures ranging from fine to coarse. These results corroborate the discoveries made by Polakowski and colleagues (2021) [19]. The microscopic structure and distribution of soil aggregates have a significant influence on the biological, chemical, and physical attributes of the Earth’s surface. Various human activities, such as agricultural practices, interactions, and processes involved in soil development, can introduce changes to the arrangement and constitution of soil aggregates [20].
The ordering of the heavy metal elements with the highest potential for harm in this investigation were recorded in the following manner: iron (Fe) > aluminum (Al) > potassium (K) > calcium (Ca) > sodium (Na) > magnesium (Mg). An assessment was conducted to compare the levels and intensities of the identified elements at the contaminated locations against a control site. Kafle et al., 2022, reported a similar sequence of determined elements, where concentration and abundance of studied elements were found to be in the order of Si > Al > K > Fe > Ca > Na > Mg > Ti > P > S > Mn > Zn > Cr > Cd > V > Pb > Cu > Ni > As > Se [21]. The findings suggest that the polluted areas displayed elevated concentrations of Ca and Fe, in contrast to the reference site which showcased minimal levels. The increased presence of Fe in the soil can be linked to various factors, such as tire degradation, combustion of oil, wear of mechanical parts, and lubrication with oil. The concentration levels demonstrated variations within three specific areas of the observed vicinity [22]. Asafew and Chandravanshi (2021) observed the similar readings, and reported the higher concentration values of Na, Fe, Ca, Zn, and Pb obtained in the analyzed soil samples [23]. The variations in concentration levels at the monitored locations may be associated with land utilization, leaching processes, and adsorption [22]. Conversely, the reference sample exhibited higher concentrations of Na, Al, and Mg compared to the sample from the landfill site. It is of significance to highlight that all concentrations of the identified elements surpassed the recommended thresholds established by the World Health Organization (WHO) (refer to Table 1). Recently, Kadhim et al., 2023, found the Fe in soil to have exceeded the concentration of the threshold limit recommended by WHO and FAO/WHO [18].
The findings of this study reveal exceedingly high levels of metal contamination in soil (landfill sites and the control site). This study’s findings corroborate the outcomes published by Abdullah et al. (2019), where they reported the metal concentrations to be elevated and recorded above the permissible limits suggested by the WHO [24]. Parvez and colleagues (2023) documented the elevated levels of Al, Co, Fe, and Pb in soil samples [17]. Meanwhile, the most substantial average levels in various soil categories for Ca, Mg, K, Na, and Mn were identified by Khan and Shah in 2023 [25].
Nyika et al., 2019, reported the similar findings where the examination revealed that certain elements, such as Fe, Zn, Mn, Cu, and Ni, exhibited concentrations that exceeded the established threshold values at the majority of sampling locations, regardless of their proximity and depth relative to the landfill area [14].
The study by Wanjala et al. (2019) reported different findings from this study; the Ca concentration was below WHO < 100 ppm, while Mg, Na, K, and Ni concentrations were recorded within the allowable limits set by WHO. The high values of Na were attributed to land-use practices [15]. In agreement with this study, Ullah et al. (2022) reported a similar finding, where polluted soil samples carried high potential toxic element concentrations, which were recorded above the permitted limits recommended by WHO [26].
The increased occurrence of metallic elements in this region may be ascribed to anthropogenic endeavors, such as inadequate management of waste containing metals, incineration methods performed at the Alice landfill location, emissions from vehicles, and agricultural activities, which could also play a role in the buildup of toxic metals in the surrounding ecosystem. Agriculture plays a significant role in the local economy by providing livelihoods, ensuring food production, and generating income. Consequently, it is possible that these heavy metal contaminants originated from agricultural practices, particularly the use of fertilizers, such as P-fertilizers, which have been found to contain high levels of heavy metals. For example, superphosphate fertilizer, which contains Cd, Co, Cu, Pb, Zn, Cr, and Ni, may leach these contaminants into the soil [27].
Some farmers in the region utilize livestock manures, primarily derived from poultry, cattle, and pig farming, as organic fertilizers. The application of these manures and the resulting compost to farmland is a common practice in agricultural crop production. However, these organic materials contain significant concentrations of elements such as Cu, Zn, Cd, Ni, Cr, As, Pb, and Hg, which can introduce a large number of contaminants into the soil [27]. Furthermore, the elevated concentration levels of metals in the soil may be attributed to the types of waste disposed of in the area, which contain these metals as by-products of their manufacturing processes. Additionally, high levels of automobile emissions and other human activities along the highways passing through the region could contribute to the presence of these toxic substances in the environment [22,24,28]. These metals can enter the human body through the consumption of contaminated food or beverages, inhalation, or direct contact with the skin. Although they are essential elements, their elevated amounts have potential to cause damage to vital organs, such as the liver, nervous system, bladder, lungs, abdomen, skin, and reproductive systems [24].
Silicon and oxygen are the most abundant elements in the Earth’s crust and combine to form silicates, which are highly concentrated. Kafle et al., 2023 reported elemental concentration of Si as the most abundant (53.4%) element, followed by Al (12%) and K (11.4%) [21]. The level of silicon (Si) detected in our findings surpassed the typical average concentration of 29% found at the Earth’s crust’s outer layer, posing a potential environmental hazard to its surroundings [21]. Excessive amounts of silicon (Si) can lead to a condition known as silicosis, posing a significant health risk. Silica, a crystalline form of silicon, can interact with lung tissue cells and become toxic. The particles of silicates embed themselves in lung tissue, leading to the formation of nodular lesions and impairing breathing. Over time, this weakens the immune system and overall body condition [29,30]. Soil dust primarily consists of silica and aluminosilicates, which have irregular shapes. Aluminosilicates with high levels of aluminum (Al), silicon (Si), and potassium (K) can originate from various sources, including the lithosphere, agricultural activities, fuel combustion, and waste incineration. Incineration processes release hazardous smoke into the environment, containing CO2 and CH4. The release of these gases significantly contributes to the global aerosol mass and the accumulation of greenhouse gases in the atmosphere [31].

5. Conclusions

The Alice landfill has experienced insufficient management of solid waste, leading to a substantial buildup of metallic elements within the soil. Given the elevated levels of metallic elements reported in this study, the city must undertake joint efforts to mitigate pollution, promote sustainable practices, and safeguard both human health and the environment. Although, in general, the detected elements are significant in soil, they should be closely monitored to prevent potential ecotoxicity to the ecosystem. It is crucial for authorities to regularly monitor the soil and utilize soil testing methods to assess the concentrations of heavy metals present. Therefore, the study recommends sustainable farming practices, where farmers could use chemical-based natural fertilizers, pesticides, and compost. Also, the implementation of proper waste management, effective recycling techniques, and proper disposal of substances containing potential toxic elements as byproducts is imperative. Further application of novel and efficient site-specific remediation strategies, such as phytoremediation and bioremediation, can play a crucial role in this region, since these strategies could efficiently and securely rehabilitate soils and have environmentally friendly and cost-effective characteristics. Further investigation is needed to gain a more comprehensive understanding of metal dynamics in ecosystems unaffected by human activities in order to preserve soil quality. This will supply the necessary data to policymakers, which is essential for formulating efficient strategies for pollution control.

Author Contributions

Conceptualization, N.G.M.; methodology, N.G.M.; software, N.G.M. and O.O.O.; writing and editing, N.G.M.; investigation, N.G.M.; data curation, N.G.M.; data analysis and interpretation, N.G.M.; data verification, O.O.O.; supervision, O.O.O.; funding acquisition, N.G.M. and O.O.O. All authors have read and agreed to the published version of the manuscript.

Funding

This research was funded by Govan Mbeki Research and Development Centre (GMRDC).

Data Availability Statement

Data are available upon request.

Acknowledgments

The authors are grateful to the Govan Mbeki Research and Development Centre (GMRDC) for funding this study, the University of Fort Hare Directorate of Research and Development, and the University of Fort Hare Chemistry Department.

Conflicts of Interest

The authors declare no conflicts of interest for this study.

Appendix A. The Description of Metal Pollution Load Index (PLI)

Pollution Load IndexDescription
0 < PLI ≤ 1Moderate contamination
1 < PLI ≤ 2Medium high contamination
3 < PLI ≤ 4Relatively high contamination
PLI ≥ 5Extremely high pollution

References

  1. Iweriebor, B.C.; Gaqavu, S.; Obi, L.C.; Nwodo, U.U.; Okoh, A.I. Antibiotic susceptibilities of Enterococcus species isolated from hospital and domestic wastewater effluents in alice, eastern cape province of South Africa. Int. J. Environ. Res. Public Health 2015, 12, 4231–4246. [Google Scholar] [CrossRef]
  2. Maphuhla, N.G.; Oyedeji, A.O.; Lewu, F.B.; Oyedeji, O.O.; Lewu, M.N. Physicochemical Properties and Heavy Metals Accumulation in the Plant, Soil and Water from Municipal Landfill in Alice, South Africa. In Chemistry for a Clean and Healthy Planet; Springer International Publishing: Berlin/Heidelberg, Germany, 2019; pp. 247–267. [Google Scholar]
  3. Naudé, A.L.; Snyman, R.G.; Odendaal, J.P. Aluminium and Iron Contamination of Soil, Leaf Litter and Bioindicators in Selected South African Forest Pockets. Water Air Soil Pollut. 2021, 232, 304. [Google Scholar] [CrossRef]
  4. Okello, C.; Tomasello, B.; Greggio, N.; Wambiji, N.; Antonellini, M. Impact of population growth and climate change on the freshwater resources of Lamu Island, Kenya. Water 2015, 7, 1264–1290. [Google Scholar] [CrossRef]
  5. Masindi, V.; Muedi, K.L. Environmental contamination by heavy metals. Heavy Met. 2018, 10, 115–132. [Google Scholar]
  6. Saha, L.; Kumar, V.; Tiwari, J.; Rawat, S.; Singh, J.; Bauddh, K. Electronic waste and their leachates impact on human health and environment: Global ecological threat and management. Environ. Technol. Innov. 2021, 24, 102049. [Google Scholar]
  7. Parajuli, P.B.; Duffy, S. Evaluation of soil organic carbon and soil moisture content from agricultural fields in Mississippi. Open J. Soil Sci. 2013, 3, 81. [Google Scholar] [CrossRef]
  8. Li, T.; Meng, L.; Herman, U.; Lu, Z.; Crittenden, J. A survey of soil enzyme activities along major roads in Beijing: The implications for traffic corridor green space management. Int. J. Environ. Res. Public Health 2015, 12, 12475–12488. [Google Scholar] [CrossRef]
  9. Allegretta, I.; Legrand, S.; Alfeld, M.; Gattullo, C.E.; Porfido, C.; Spagnuolo, M.; Janssens, K.; Terzano, R. SEM-EDX hyperspectral data analysis for the study of soil aggregates. Geoderma 2022, 406, 115540. [Google Scholar] [CrossRef]
  10. Manohara, B.; Belagali, S.L. Evaluation of energy-dispersive scanning electron microscopy and X-ray fluorescence techniques for analysis of compost quality. Anal. Methods 2017, 9, 253–258. [Google Scholar]
  11. Jiang, H.H.; Cai, L.M.; Hu, G.C.; Wen, H.H.; Luo, J.; Xu, H.Q.; Chen, L.G. An integrated exploration on health risk assessment quantification of potentially hazardous elements in soils from the perspective of sources. Ecotoxicol. Environ. Saf. 2021, 208, 111489. [Google Scholar] [CrossRef]
  12. Gan, L.; Wang, J.; Xie, M.; Yang, B. Ecological risk, and health risk analysis of soil potentially toxic elements from oil production plants in central China. Sci. Rep. 2022, 12, 17077. [Google Scholar] [CrossRef]
  13. Zondo, S. Maximum Residue Limits (MRLs) of Heavy Metals in Agricultural Soil, Irrigation Water and Crops. Research & Technology BULLETIN. 2021. Available online: https://www.kzndard.gov.za/images/Documents/researchandtechnologydevelopment/publications/Research_and_Technology_Bulletins/2021-22.04-Maximum-residue-limits-MRLs-of-heavy-metals-in-agricultural-soil-irrigation-water-and-crops.pdf (accessed on 22 February 2024).
  14. Nyika, J.M.; Onyari, E.K.; Dinka, M.O.; Mishra, S.B. Heavy metal pollution and mobility in soils within a landfill vicinity: A South African case study. Orient. J. Chem. 2019, 35, 1286. [Google Scholar] [CrossRef]
  15. Wanjala, M.P.; Odokuma, L.; Etela, I.; Ramkat, R. Assessment of soil metals status in parts of rivers state, Nigeria. J. Appl. Sci. Environ. Manag. 2019, 23, 545–550. [Google Scholar] [CrossRef]
  16. Shaibu, O.B.; Osisanya, O.W.; Amoyedo, A.A.; Akpeji, B.H. Assessing Environmental Impact and Socioeconomic Consequences of Oil and Gas Spillage on Soil in Warri, Southern Nigeria. Br. J. Earth Sci. Res. 2023, 11, 27–47. [Google Scholar] [CrossRef]
  17. Parvez, M.S.; Nawshin, S.; Sultana, S.; Hossain, M.S.; Rashid Khan, M.H.; Habib, M.A.; Nijhum, Z.T.; Khan, R. Evaluation of heavy metal contamination in soil samples around rampal, Bangladesh. ACS Omega 2023, 8, 15990–15999. [Google Scholar] [CrossRef]
  18. Kadhim, N.A.; Aburahma, N.N.A. Levels of Some Metal Contents in the Soil and Leafy Vegetables Collected from Al-Qanat Highway/Baghdad City. Iraqi J. Sci. 2023, 64, 620–629. [Google Scholar] [CrossRef]
  19. Polakowski, C.; Ryżak, M.; Sochan, A.; Beczek, M.; Mazur, R.; Bieganowski, A. Particle size distribution of various soil materials measured by laser diffraction the problem of reproducibility. Minerals 2021, 11, 465. [Google Scholar] [CrossRef]
  20. Ahmad, W.; Alharthy, R.D.; Zubair, M.; Ahmed, M.; Hameed, A.; Rafique, S. Toxic and heavy metals contamination assessment in soil and water to evaluate human health risk. Sci. Rep. 2021, 11, 17006. [Google Scholar] [CrossRef]
  21. Kafle, H.K.; Khadgi, J.; Ojha, R.B.; Santoso, M. Concentration, sources, and associated risks of trace elements in the surface soil of Kathmandu Valley, Nepal. Water Air Soil Pollut. 2022, 233, 46. [Google Scholar] [CrossRef]
  22. Popoola, L.T.; Yusuff, A.S. Optimization and characterization of crude oil contaminated soil bioremediation using bacteria isolates: Plant growth effect. South Afr. J. Chem. Eng. 2021, 37, 206–213. [Google Scholar] [CrossRef]
  23. Asafew, K.; Chandravanshi, B.S. Levels of major and trace metals in eggplant and soil. Bull. Chem. Soc. Ethiop. 2021, 35, 243–255. [Google Scholar] [CrossRef]
  24. Njoku, P.O.; Edokpayi, J.N.; Odiyo, J.O. Health and environmental risks of residents living close to a landfill: A case study of Thohoyandou Landfill, Limpopo Province, South Africa. Int. J. Environ. Res. Public Health 2019, 16, 2125. [Google Scholar] [CrossRef] [PubMed]
  25. Khan, Y.K.; Shah, M.H. Fractionation, source apportionment, and health risk assessment of selected metals in the soil of public parks of Lahore, Pakistan. Environ. Earth Sci. 2023, 82, 311. [Google Scholar] [CrossRef]
  26. Ullah, N.; Ur Rehman, M.; Ahmad, B.; Ali, I.; Younas, M.; Aslam, M.S.; Rahman, A.U.; Taheri, E.; Fatehizadeh, A.; Rezakazemi, M. Assessment of heavy metals accumulation in agricultural soil, vegetables and associated health risks. PLoS ONE 2022, 17, e0267719. [Google Scholar] [CrossRef] [PubMed]
  27. Rashid, A.; Schutte, B.J.; Ulery, A.; Deyholos, M.K.; Sanogo, S.; Lehnhoff, E.A.; Beck, L. Heavy Metal Contamination in Agricultural Soil: Environmental Pollutants Affecting Crop Health. Agronomy 2023, 13, 1521. [Google Scholar] [CrossRef]
  28. Schaller, J.; Puppe, D.; Kaczorek, D.; Ellerbrock, R.; Sommer, M. Silicon cycling in soils revisited. Plants 2021, 10, 295. [Google Scholar] [CrossRef]
  29. Austin, S. Geology and Human Health: Silicon, Silicates and Silicosis. Teach the Earth. 2023. Available online: https://serc.carleton.edu/NAGTWorkshops/health/case_studies/silicosis.html (accessed on 29 December 2023).
  30. Paye, W.S. Silicon Fertilization in Rice: Establishment of Critical Silicon Level and Its Impact on Availability of Nutrients in Soils of Louisiana; Louisiana State University and Agricultural & Mechanical College: Baton Rouge, LA, USA, 2016. [Google Scholar]
  31. Pachauri, T.; Singla, V.; Satsangi, A.; Lakhani, A.; Kumari, K.M. SEM-EDX characterization of individual coarse particles in Agra, India. Aerosol Air Qual. Res. 2013, 13, 523–536. [Google Scholar] [CrossRef]
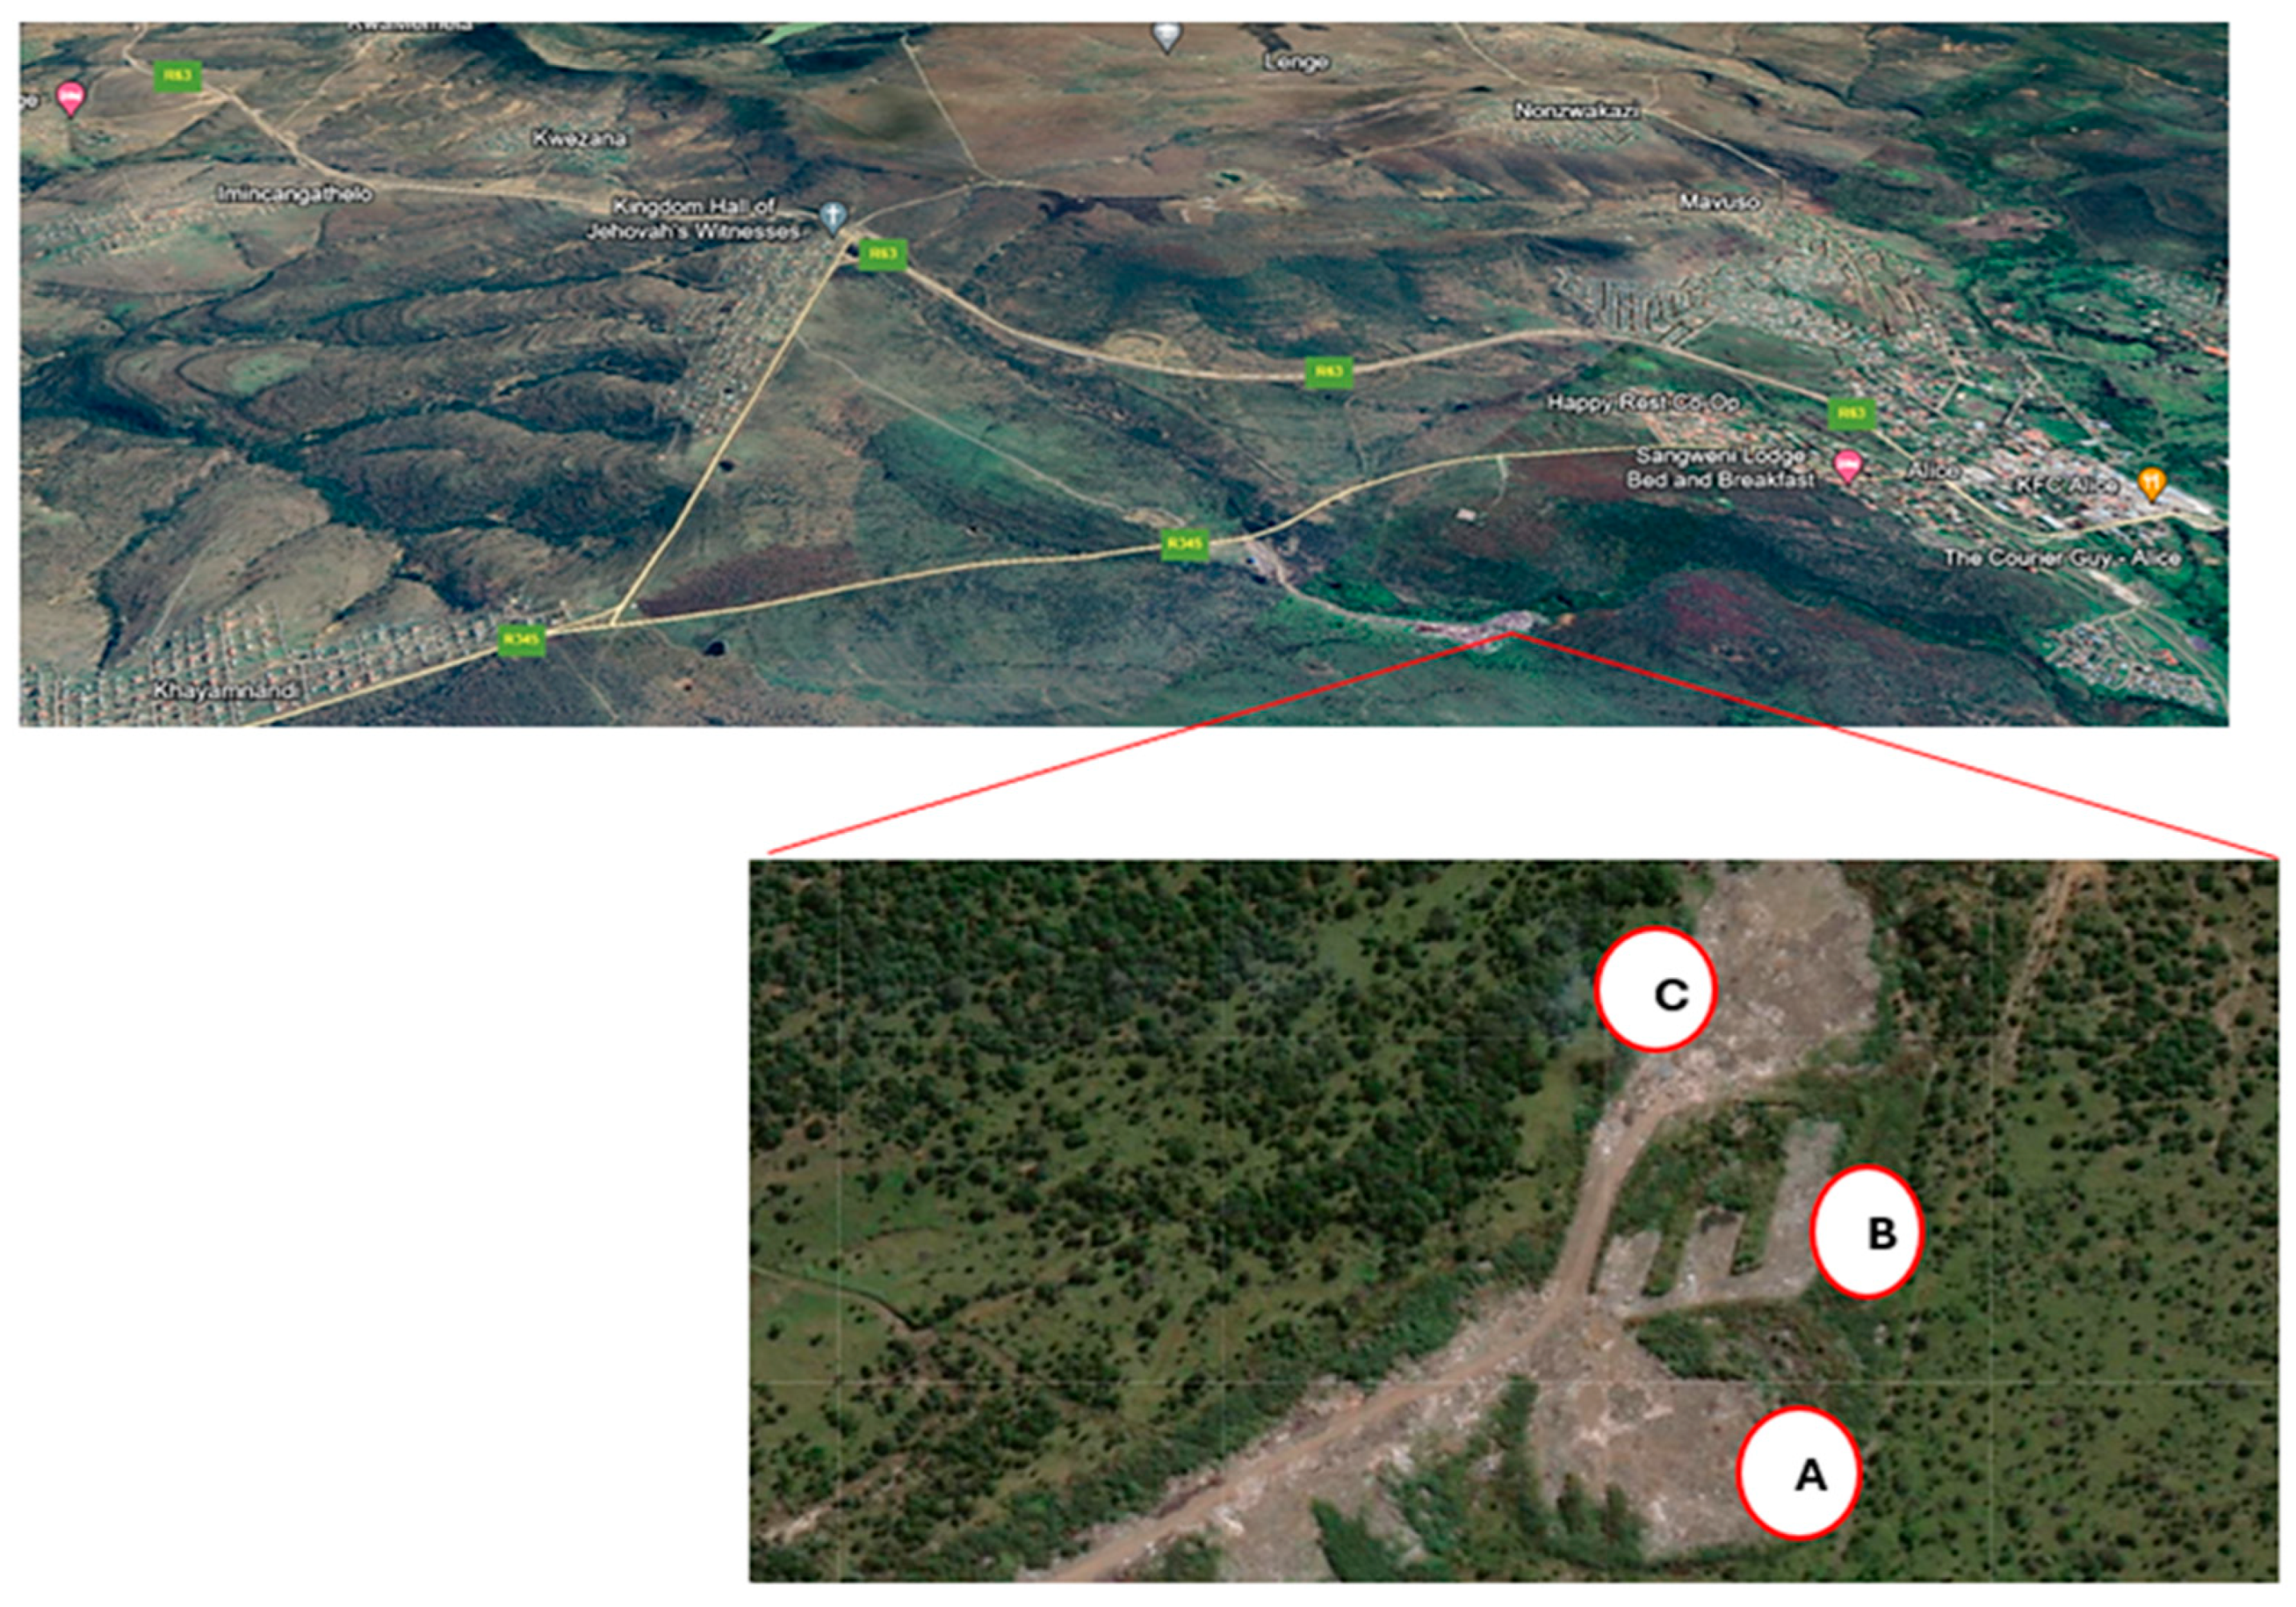
Figure 1. Presentation of a study area (landfill site, with three sampling sections A, B, & C) (www.googleearthpro.com (accessed on 18 January 2024)).
Pollutants 04 00019 g001
Figure 2. SEM images of soil samples collected from Site A, B, C, and D for the 1st and 2nd week.
Pollutants 04 00019 g002
Figure 3. SEM images of soil samples collected from Site A, B, C, and D for the 3rd and 4th week.
Pollutants 04 00019 g003
Figure 4. EDX spectrum for significant elements in soil samples collected from Site A, B, C, and D for the 1st, 2nd, 3rd and 4th week.
Pollutants 04 00019 g004
Table 1. Chemical composition of trace elements in soil samples’ weight percentages (wt%).
SitesNaMgAlSiKCaFeCOAuBaClP
1A0.88 ± 0.110.46 ± 0.104.83 ± 0.3131.54 ± 0.472.56 ± 0.365.56 ± 0.475.37 ± 0.6312.82 ± 1.7036.08 ± 0.80********
1B1.41 ± 0.200.37 ± 0.107.20 ± 0.3036.21 ± 0.432.09 ± 0.281.64 ± 0.166.10 ± 0.916.92 ± 0.8634.72 ± 0.592.49 ± 0.49**0.84 ± 0.11**
1C0.99 ± 0.090.42 ± 0.087.30 ± 0.2732.99 ± 0.393.49 ± 0.312.93 ± 0.354.85 ± 0.8510.64 ± 1.3034.57 ± 0.60**1.82 ± 0.44****
1D1.44 ± 0.200.54 ± 0.1110.23 ± 0.3130.71 ± 0.403.57 ± 0.291.20 ± 0.156.50 ± 0.907.12 ± 1.2934.34 ± 0.602.61 ± 1.644.73 ± 0.44****
2A0.76 ± 0.100.38 ± 0.096.41 ± 0.3136.47 ± 0.463.04 ± 0.171.56 ± 0.185.79 ± 1.069.70 ± 1.2335.62 ± 0.680.28 ± 0.08******
2B0.91 ± 0.160.31 ± 0.088.24 ± 0.2634.96 ± 0.372.94 ± 0.250.98 ± 0.136.28 ± 0.749.33 ± 1.1236.04 ± 0.53********
2C1.13 ± 0.100.32 ± 0.086.42 ± 0.2736.67 ± 0.412.35 ± 0.281.88 ± 0.164.63 ± 0.8710.09 ± 1.5536.50 ± 0.63********
2D0.87 ± 0.090.50 ± 0.088.33 ± 0.2731.28 ± 0.382.27 ± 0.261.42 ± 0.148.25 ± 0.8811.29 ± 1.3635.04 ± 0.590.77 ± 0.07******
3A0.66 ± 0.090.44 ± 0.083.78 ± 0.2323.99 ± 0.241.32 ± 0.255.69 ± 0.374.14 ± 0.4019.49 ± 1.4232.49 ± 0.687.43 ± 4.67****0.57 ± 0.10
3B0.73 ± 0.100.34 ± 0.097.35 ± 0.3030.71 ± 0.432.54 ± 0.300.92 ± 0.156.60 ± 0.6110.55 ± 1.4934.67 ± 0.675.61 ± 0.76******
3C0.79 ± 0.110.38 ± 0.106.73 ± 0.3330.35 ± 0.462.60 ± 0.341.93 ± 0.197.13 ± 1.0716.60 ± 1.8833.47 ± 0.77********
3D0.92 ± 0.100.49 ± 0.097.41 ± 0.2927.29 ± 0.391.68 ± 0.260.91 ± 0.147.79 ± 0.8814.27 ± 1.5832.92 ± 0.666.31 ± 5.76******
4A0.92 ± 0.110.37 ± 0.106.12 ± 0.3037.01 ± 0.453.58 ± 0.172.02 ± 0.188.15 ± 1.035.74 ± 0.9236.09 ± 0.62********
4B0.86 ± 0.10**5.54 ± 0.2632.93 ± 0.421.65 ± 0.291.34 ± 0.165.49 ± 0.5316.32 ± 1.6634.16 ± 0.67**1.72 ± 0.47****
4C1.23 ± 0.110.31 ± 0.095.94 ± 0.3133.04 ± 0.451.75 ± 0.311.40 ± 0.184.89 ± 0.5316.69 ± 1.8932.50 ± 0.740.26 ± 0.161.99 ± 0.52****
4D1.06 ± 0.100.75 ± 0.099.07 ± 0.3231.87 ± 0.434.87 ± 0.18**13.13 ± 1.075.73 ± 0.8033.51 ± 0.55********
WHO (ppm)100100100N/A10010050000N/AN/AN/AN/AN/A N/A
[13,14,15]
Pollution Index (ppm)0.890.660.731.090.942.140.69N/AN/AN/AN/AN/A N/A
Note: Trace element concentration results are presented as mean values (M) ± standard deviation (SD). ** Stands for detection below limit; N/A means not available. Conversion of 1.0 wt% is equal to 10,000 parts per million (ppm).
Table 2. Correlation analysis of trace elements in soil samples.
CONaMgAlSiKCaFeAuBa
C1
O−0.577 *1
Na−0.4570.0031
Mg−0.391−0.1620.1691
Al−0.643 *0.0740.4910.4681
Si−0.617 *0.713 **0.349−0.2950.1471
K−0.760 *0.2990.1990.5690.5970.3441
Ca0.4500.025−0.321−0.023−0.724 *−0.360−0.3351
Fe−0.494−0.1010.0430.625 **0.563 *−0.0050.644 **−0.546 *1
Au0.311−0.491−0.2020.152−0.132−0.721 *−0.4490.196−0.1311
Ba−0.039−0.2190.567 *−0.0510.378−0.0640.134−0.130−0.204−0.0721
Note: ** indicates a statistically significant difference at level p < 0.05; * means the value is statistically significant at level p < 0.01.
Disclaimer/Publisher’s Note: The statements, opinions and data contained in all publications are solely those of the individual author(s) and contributor(s) and not of MDPI and/or the editor(s). MDPI and/or the editor(s) disclaim responsibility for any injury to people or property resulting from any ideas, methods, instructions or products referred to in the content.