

Land Use and the Climatic Determinants of Population Exposure to PM2.5 in Central Bangladesh

 ,
, 
Abstract
:1. Introduction
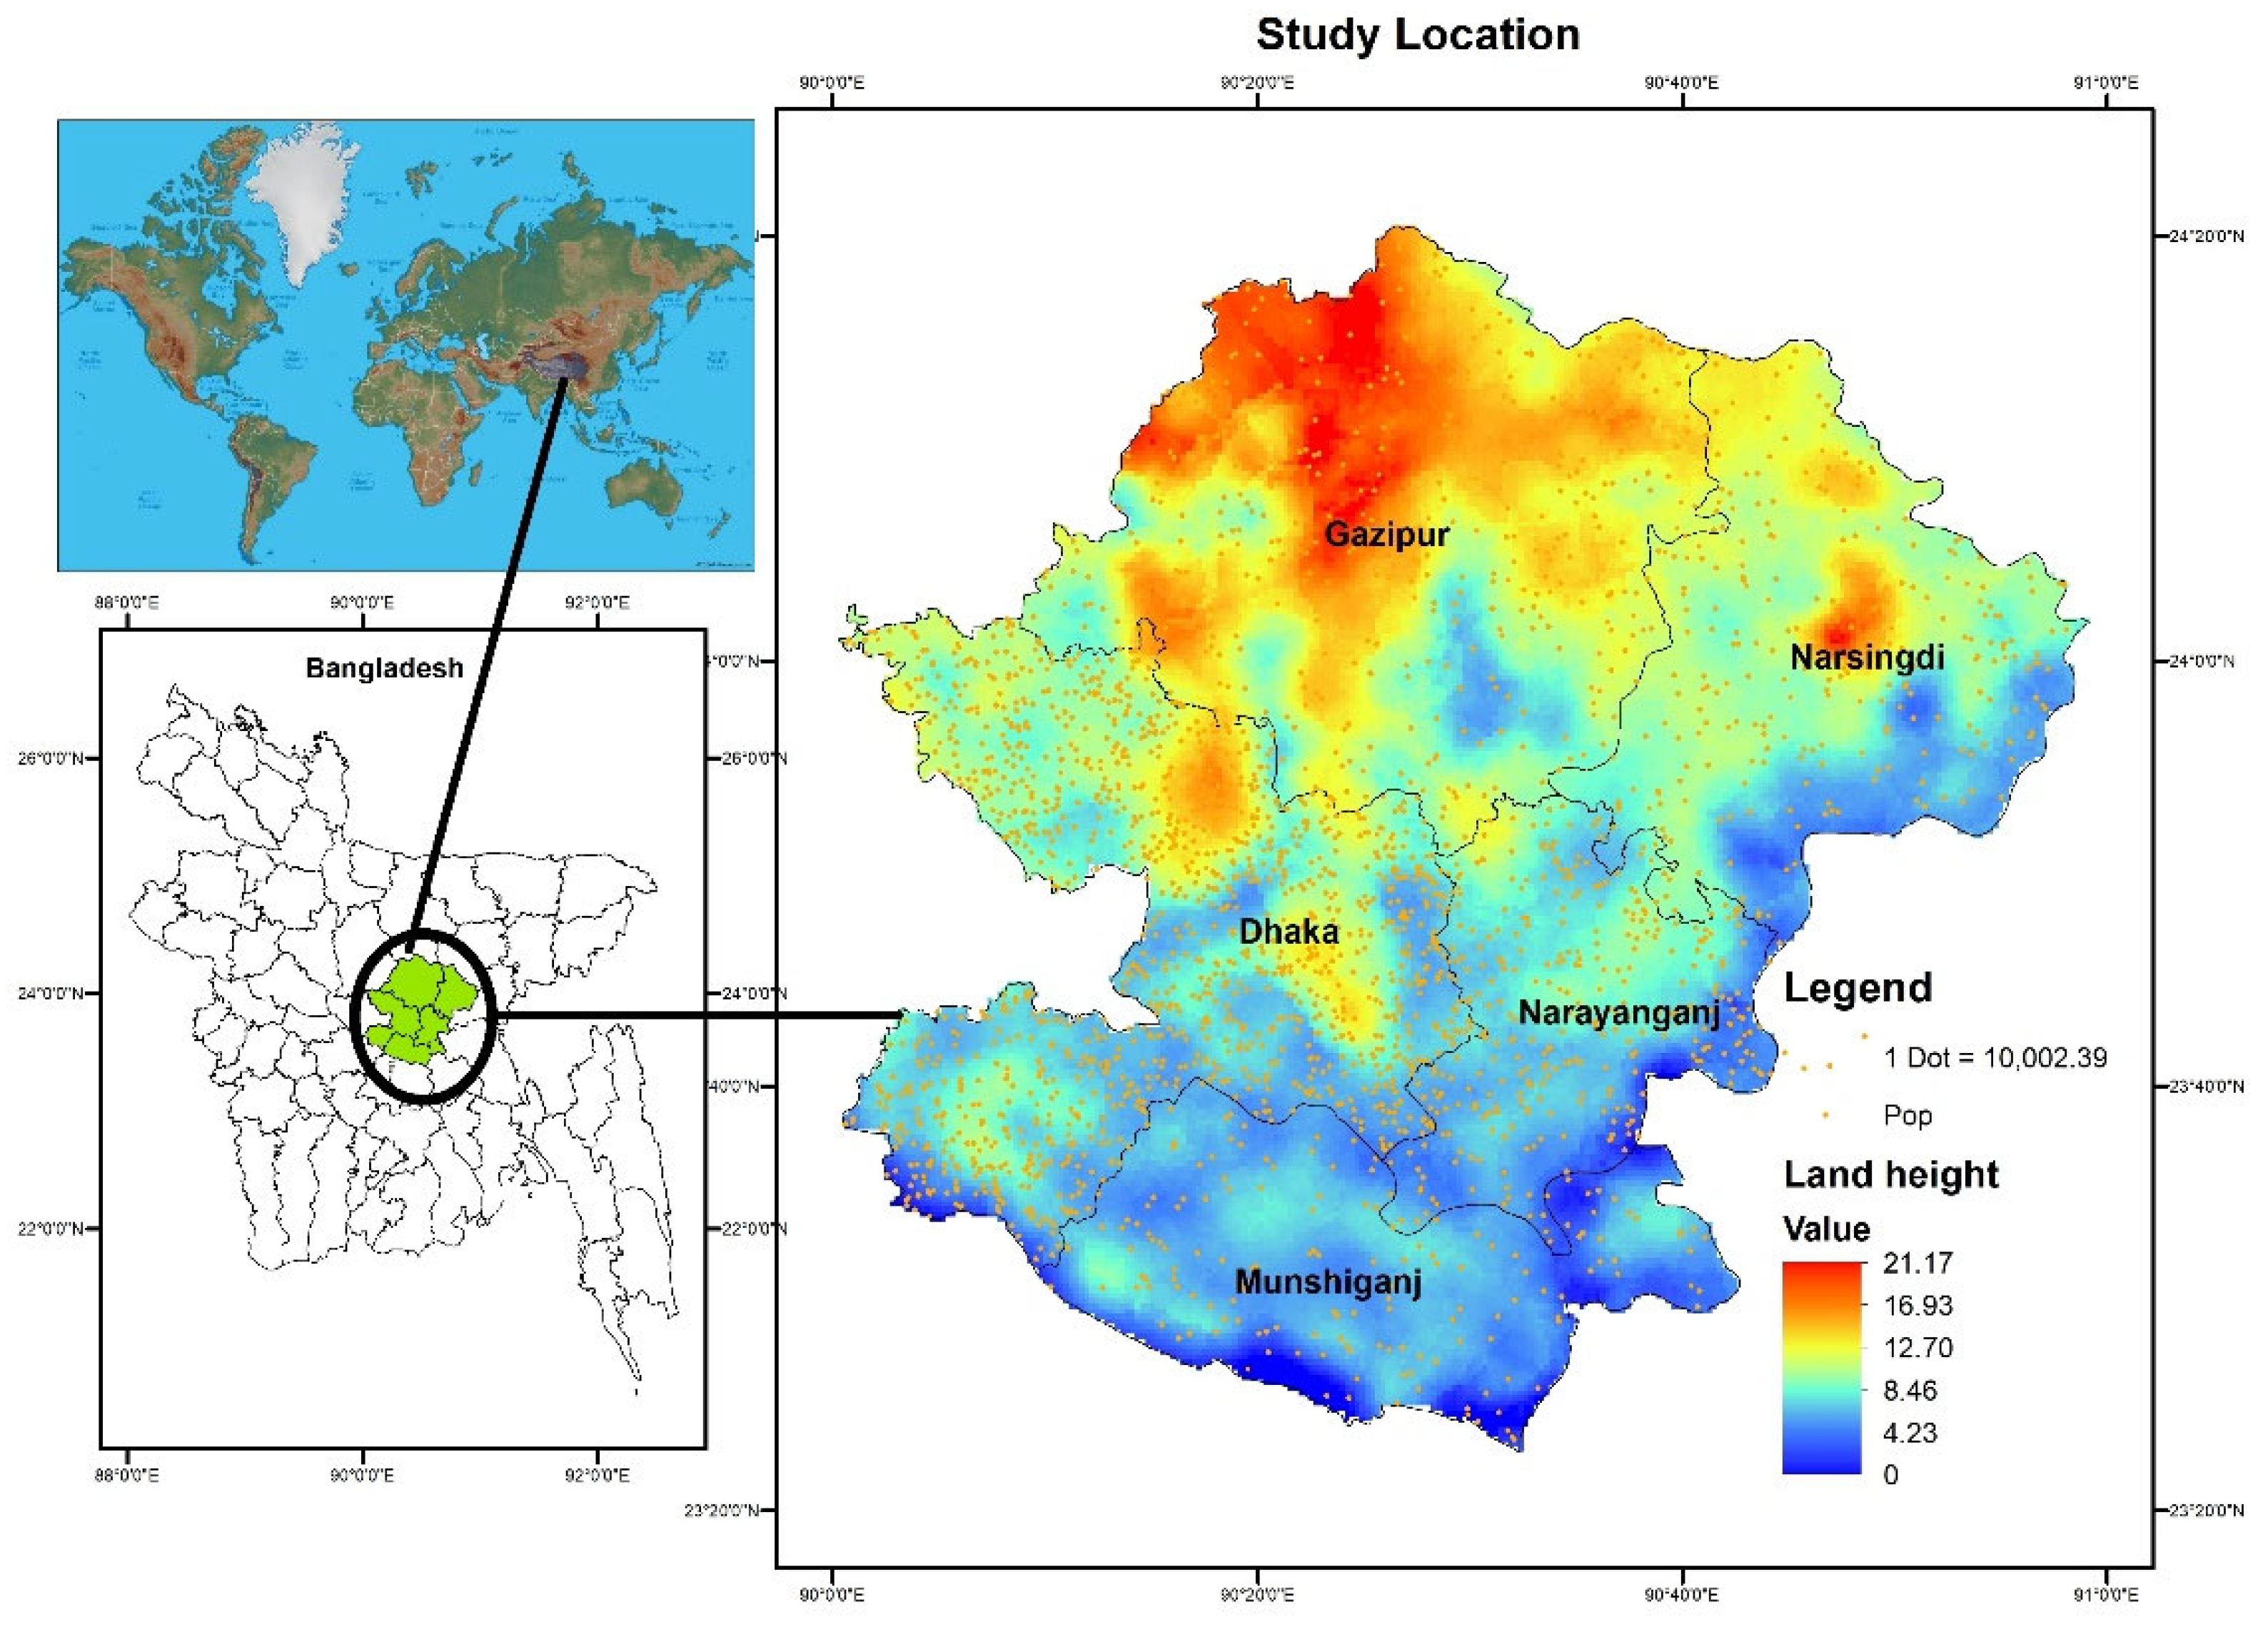
2. Study Location
3. Materials and Methods
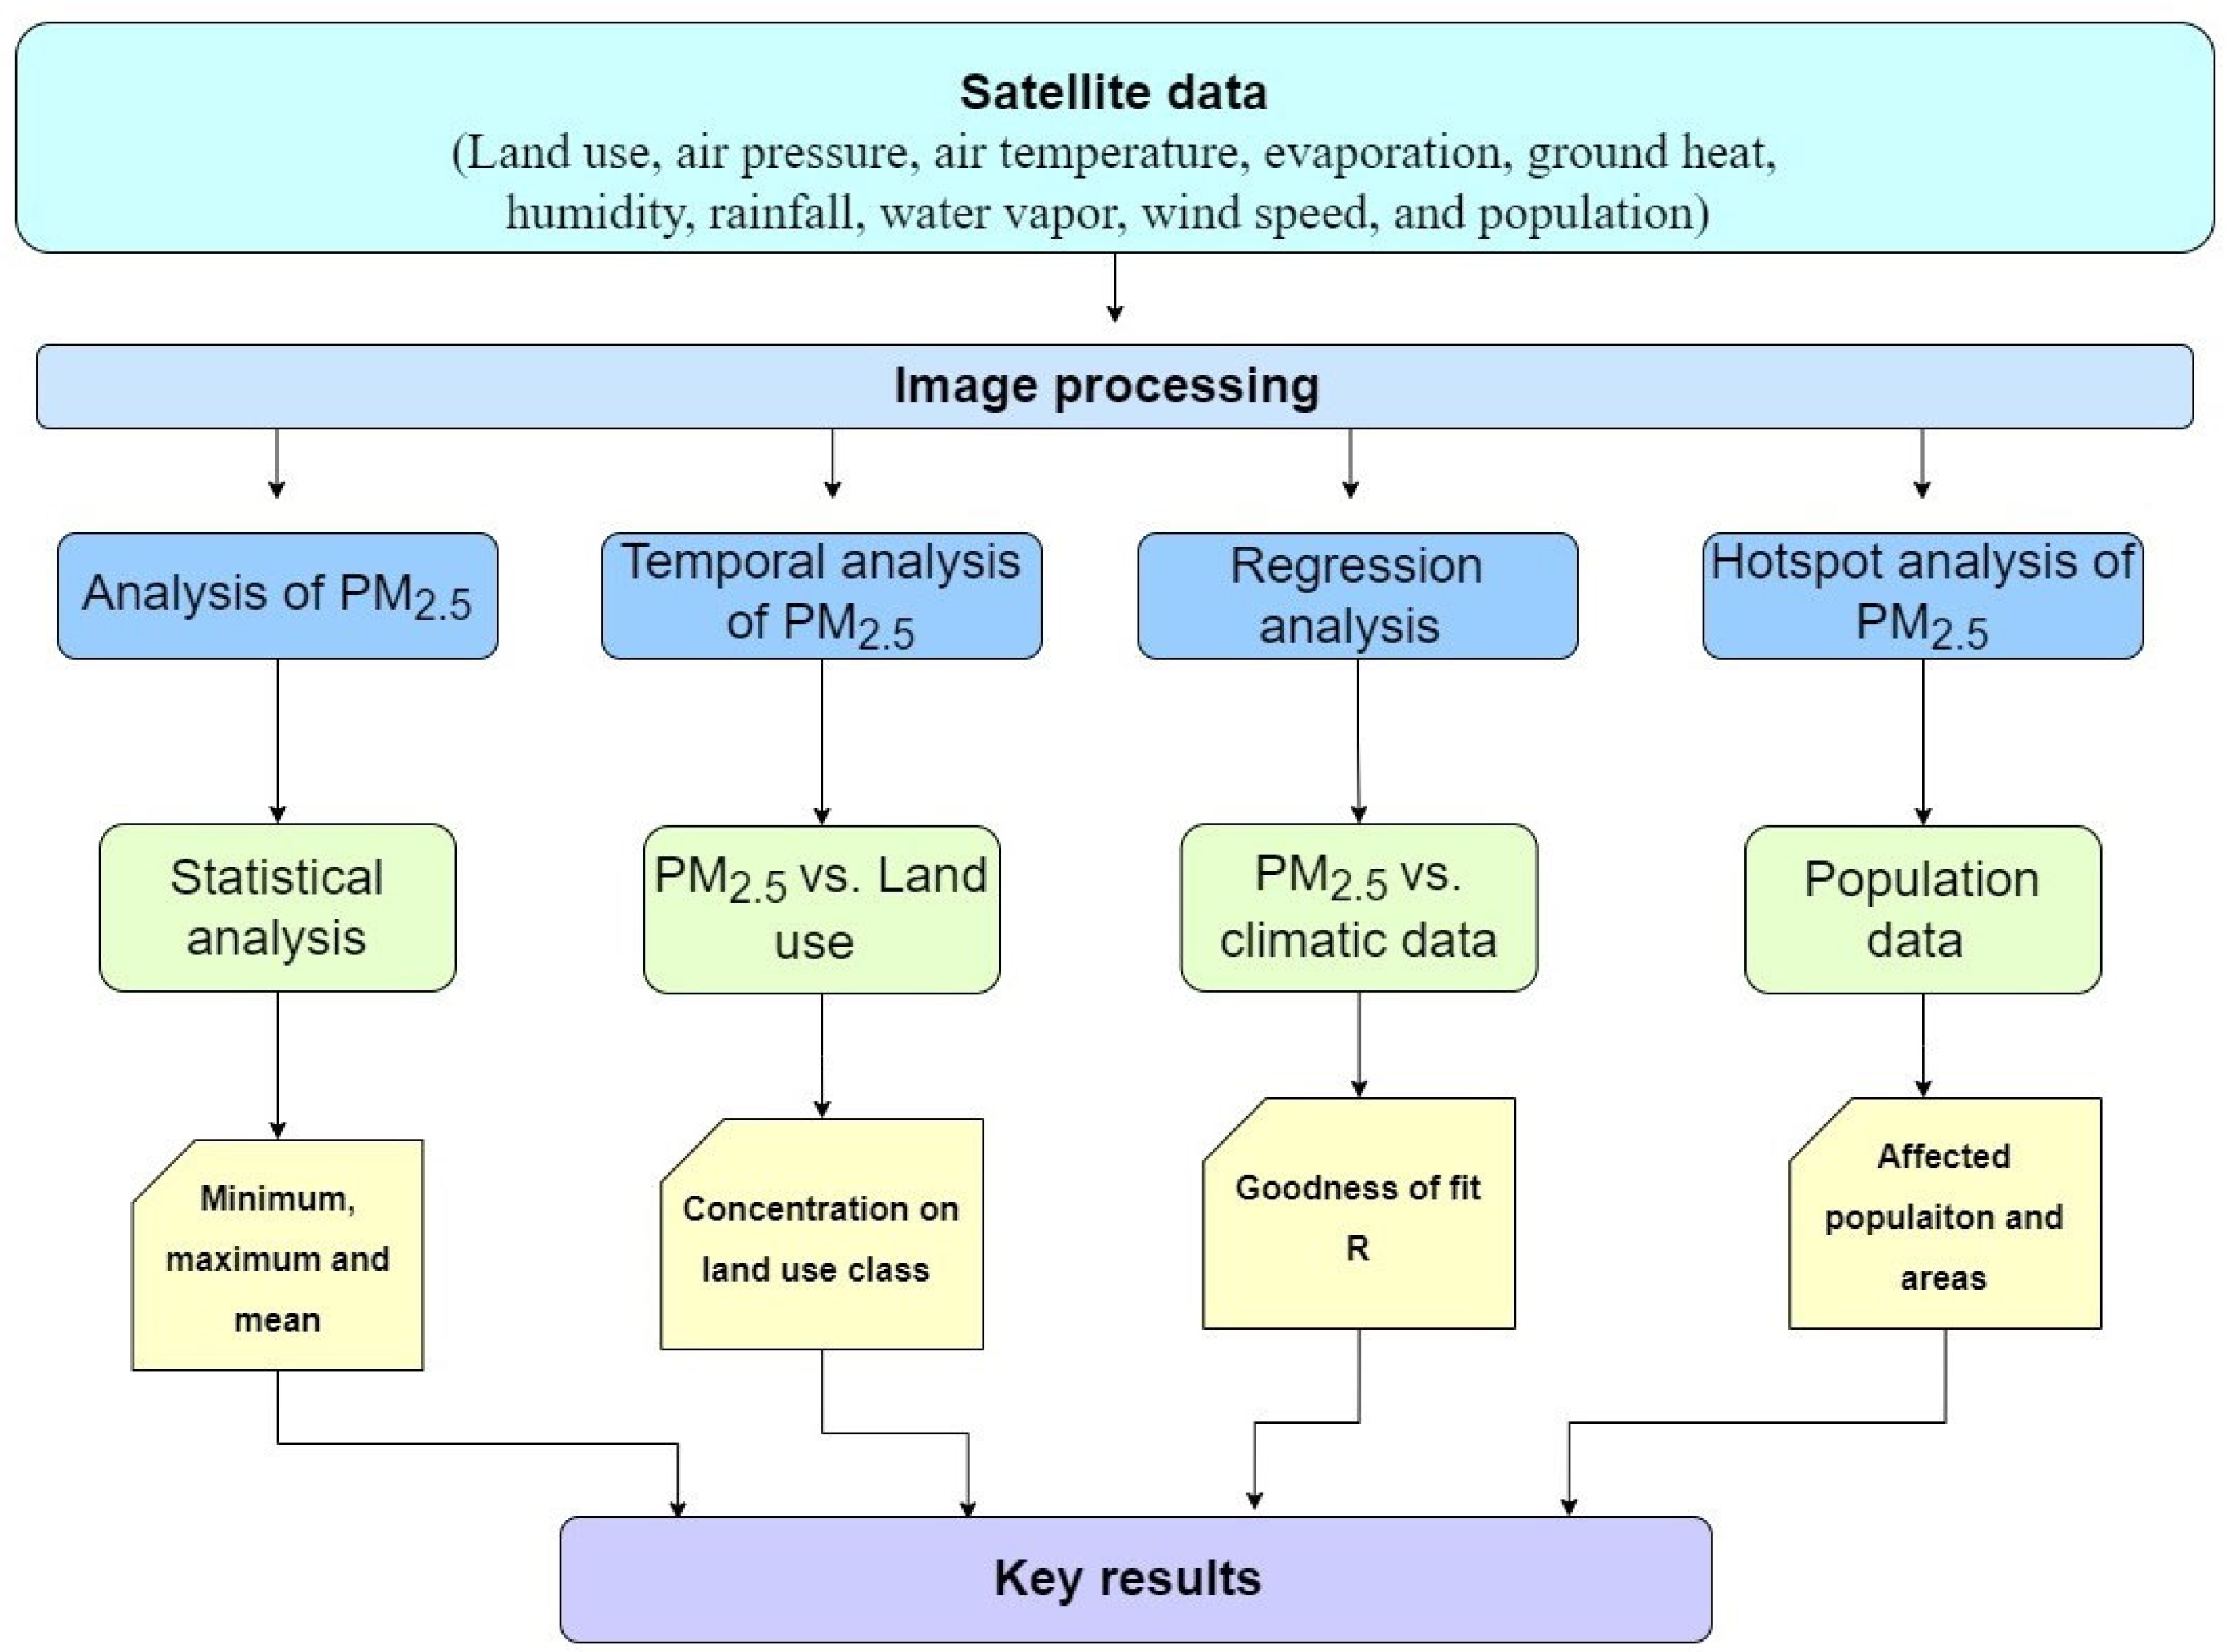
3.1. Image Processing and Data Analysis
3.2. PM2.5 Analysis
3.3. Risk Modeling Using Hotspot Area
3.4. Regression Analysis
3.5. Raster Overlay Analysis
4. Results
4.1. Descriptive Analysis of PM2.5
4.2. Relationship between PM2.5 and Land Use
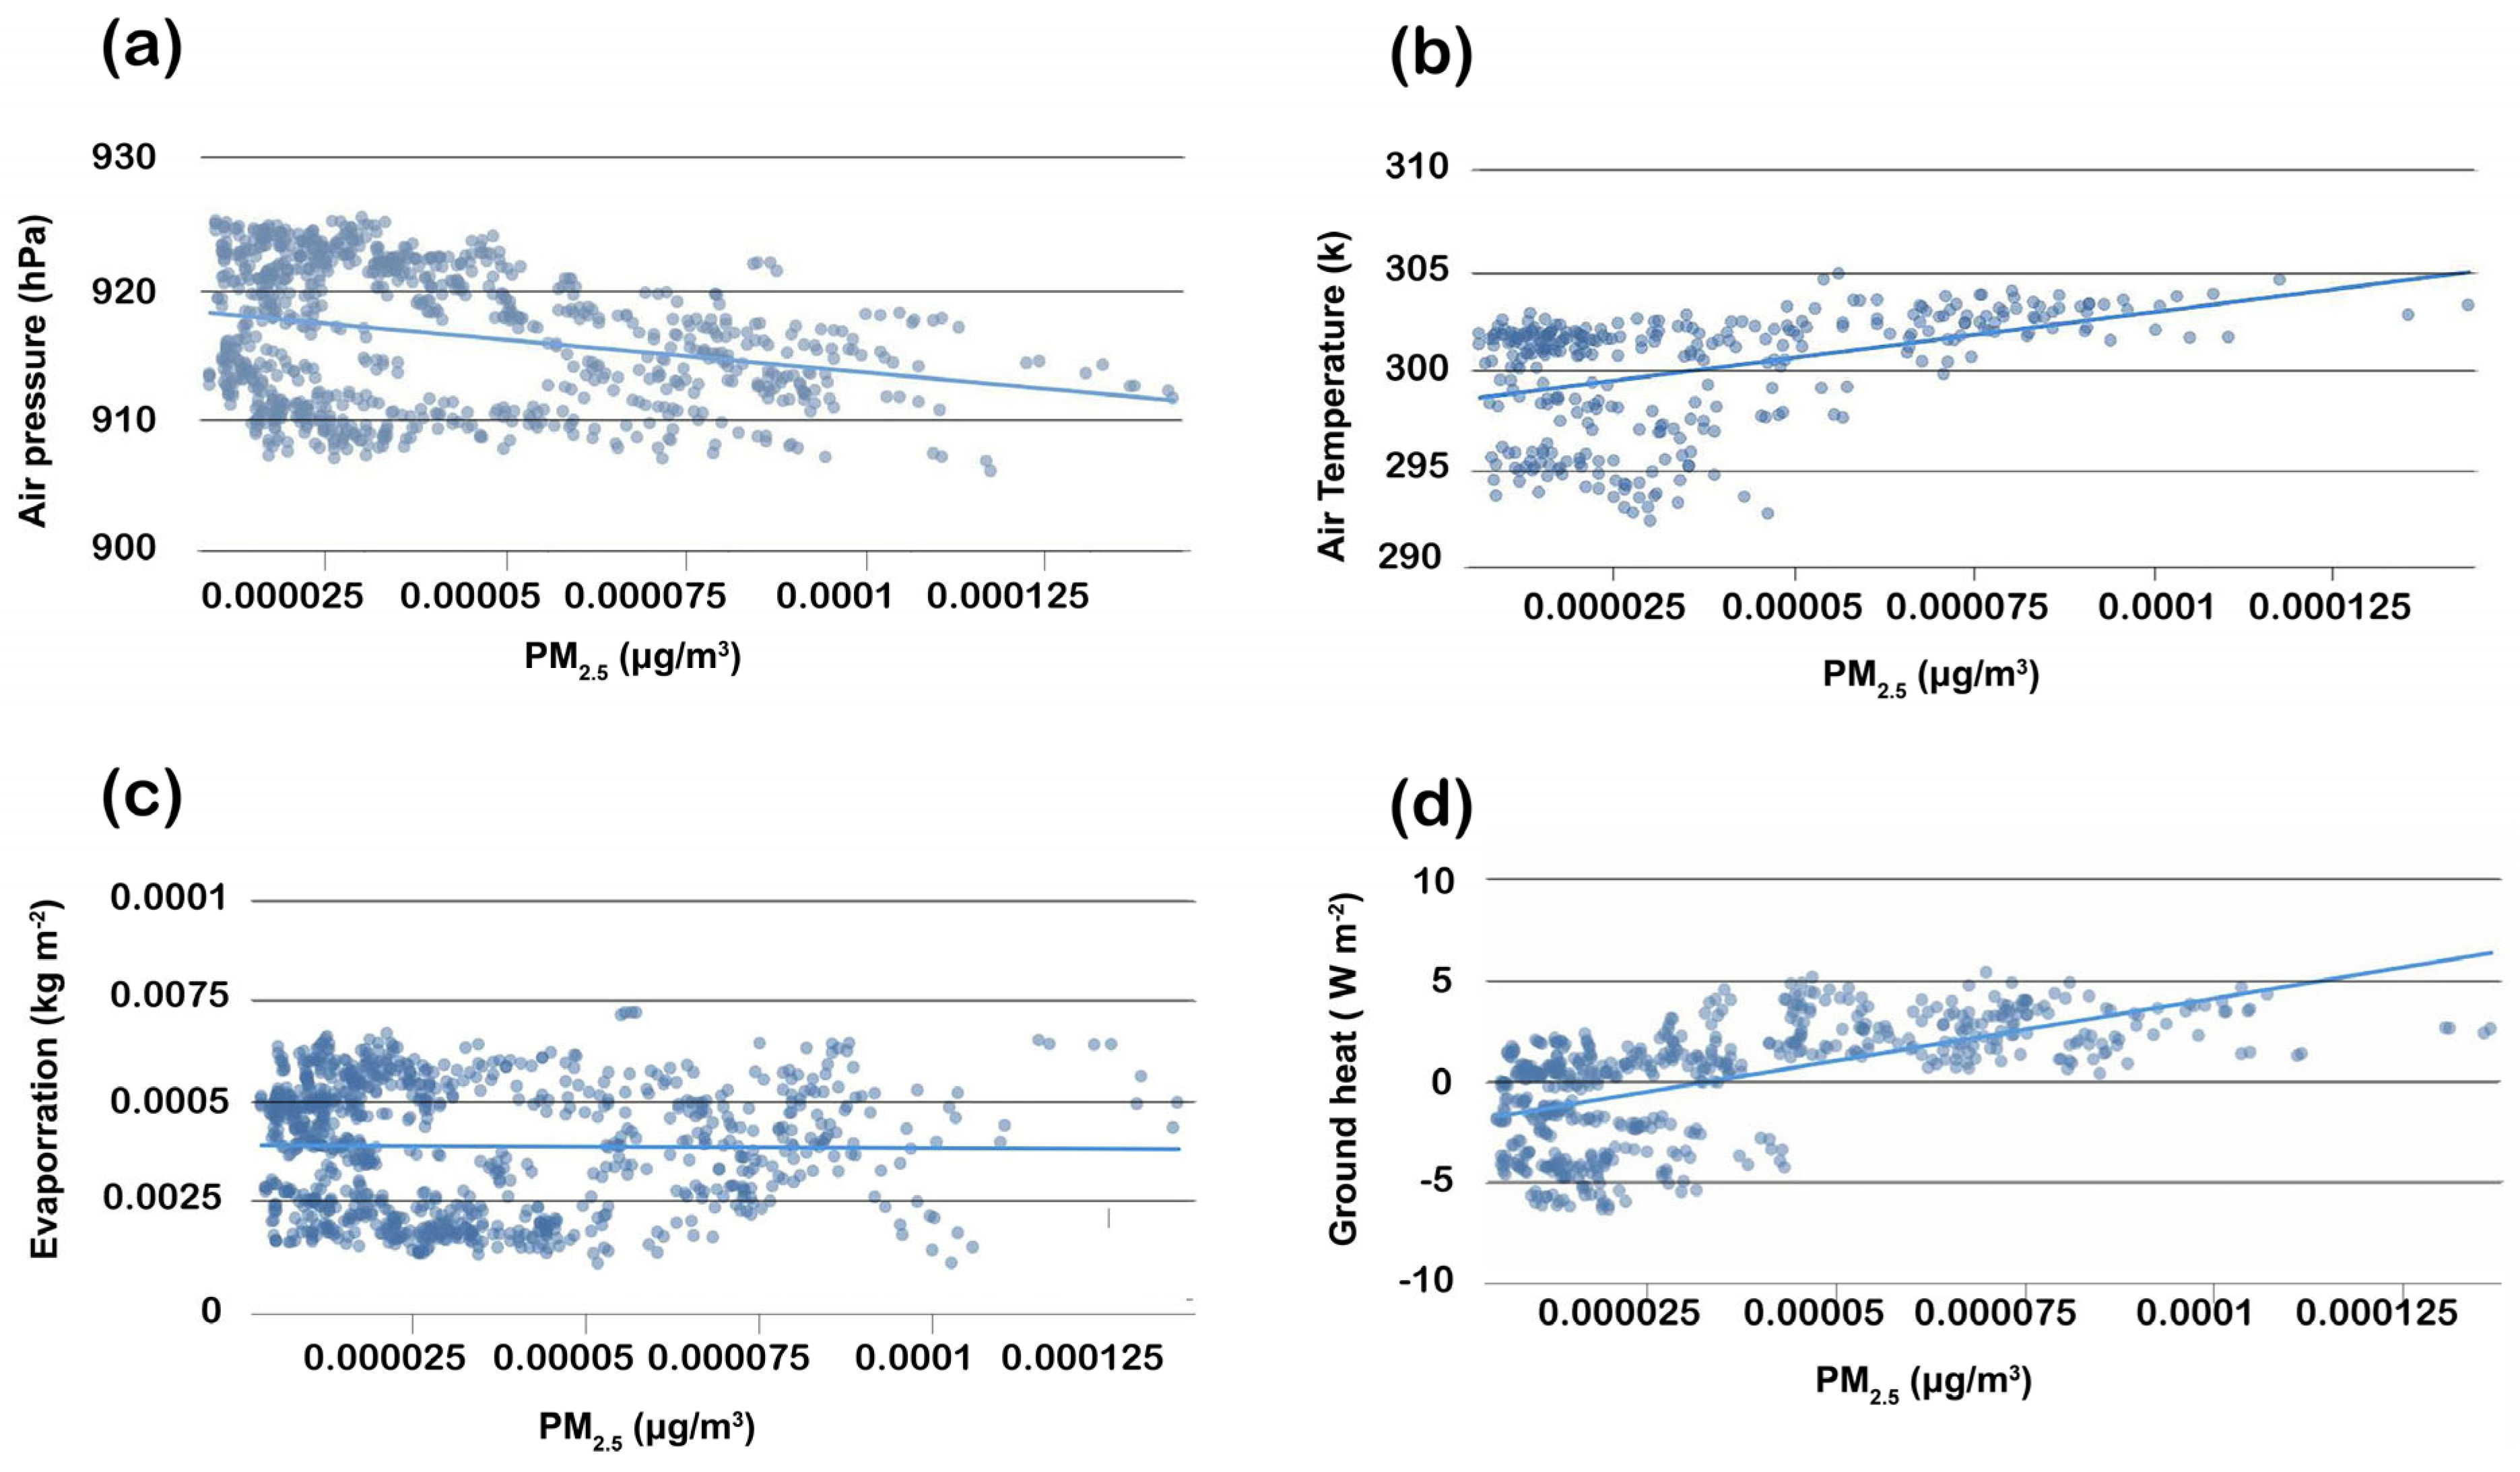
4.3. Relationship between PM2.5 and Climatic Variables
4.4. Hotspot Zoning
4.5. Affected Population Due to PM2.5
5. Discussion
6. Conclusions
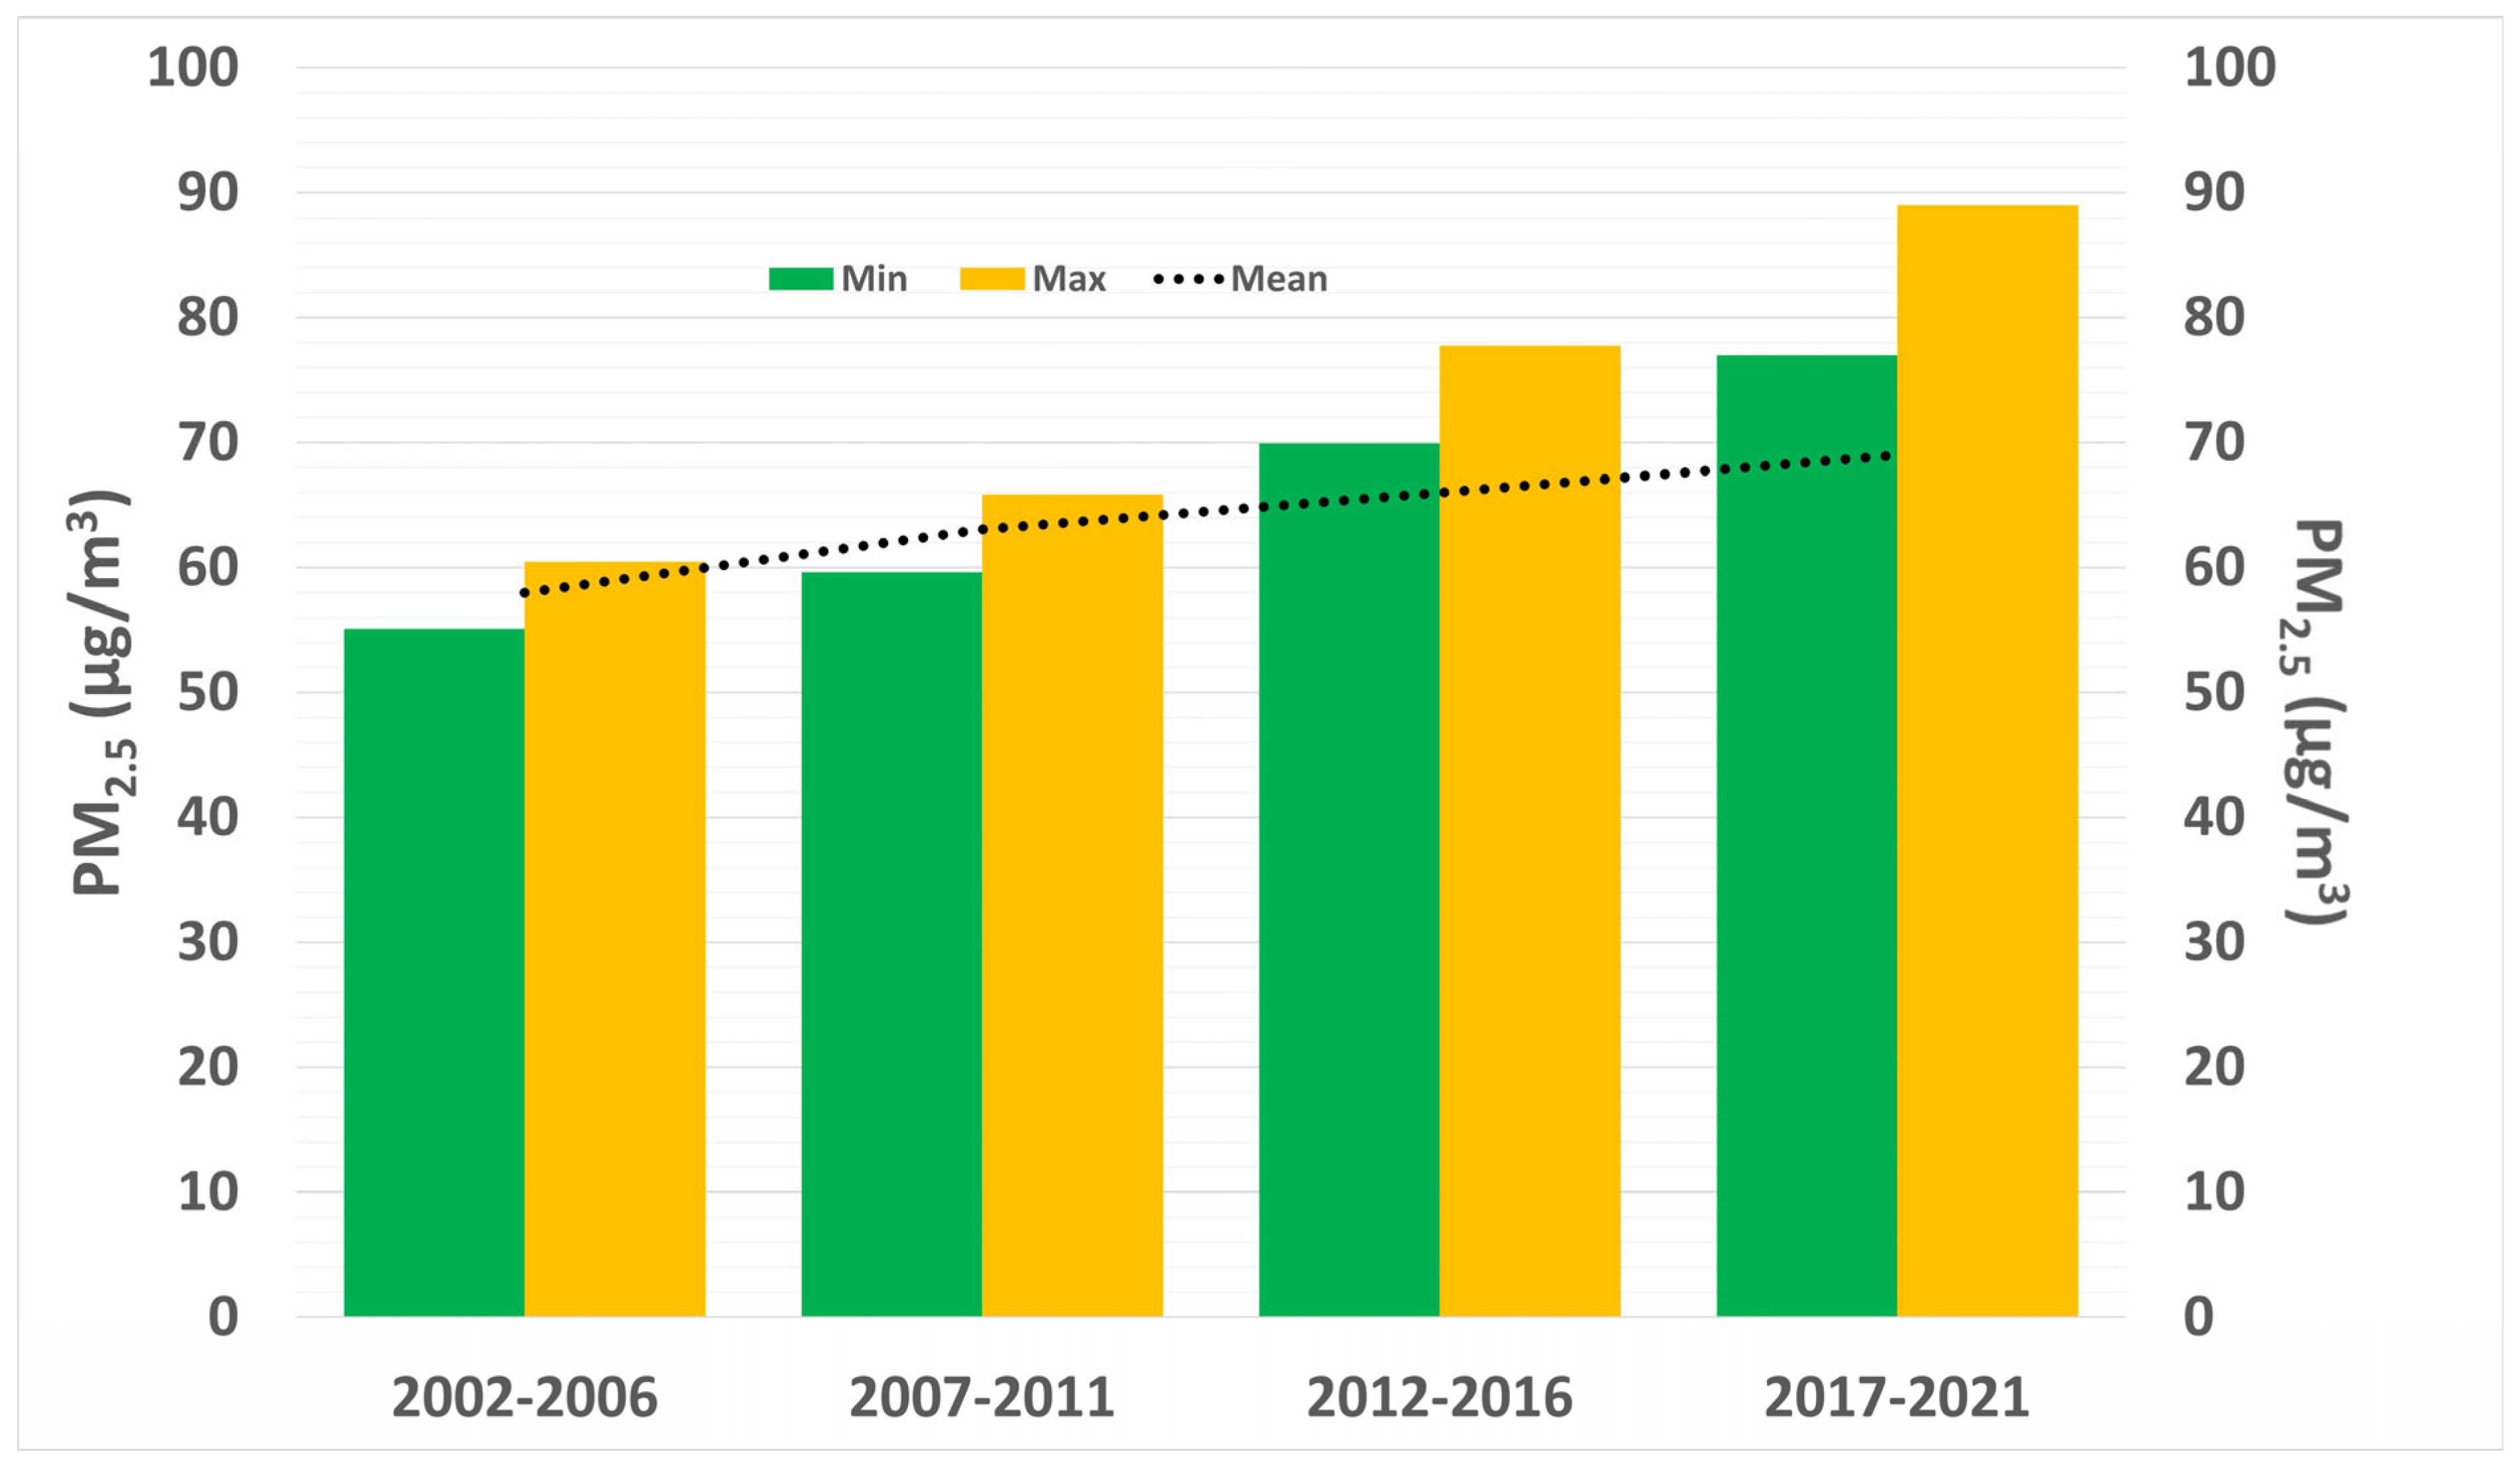
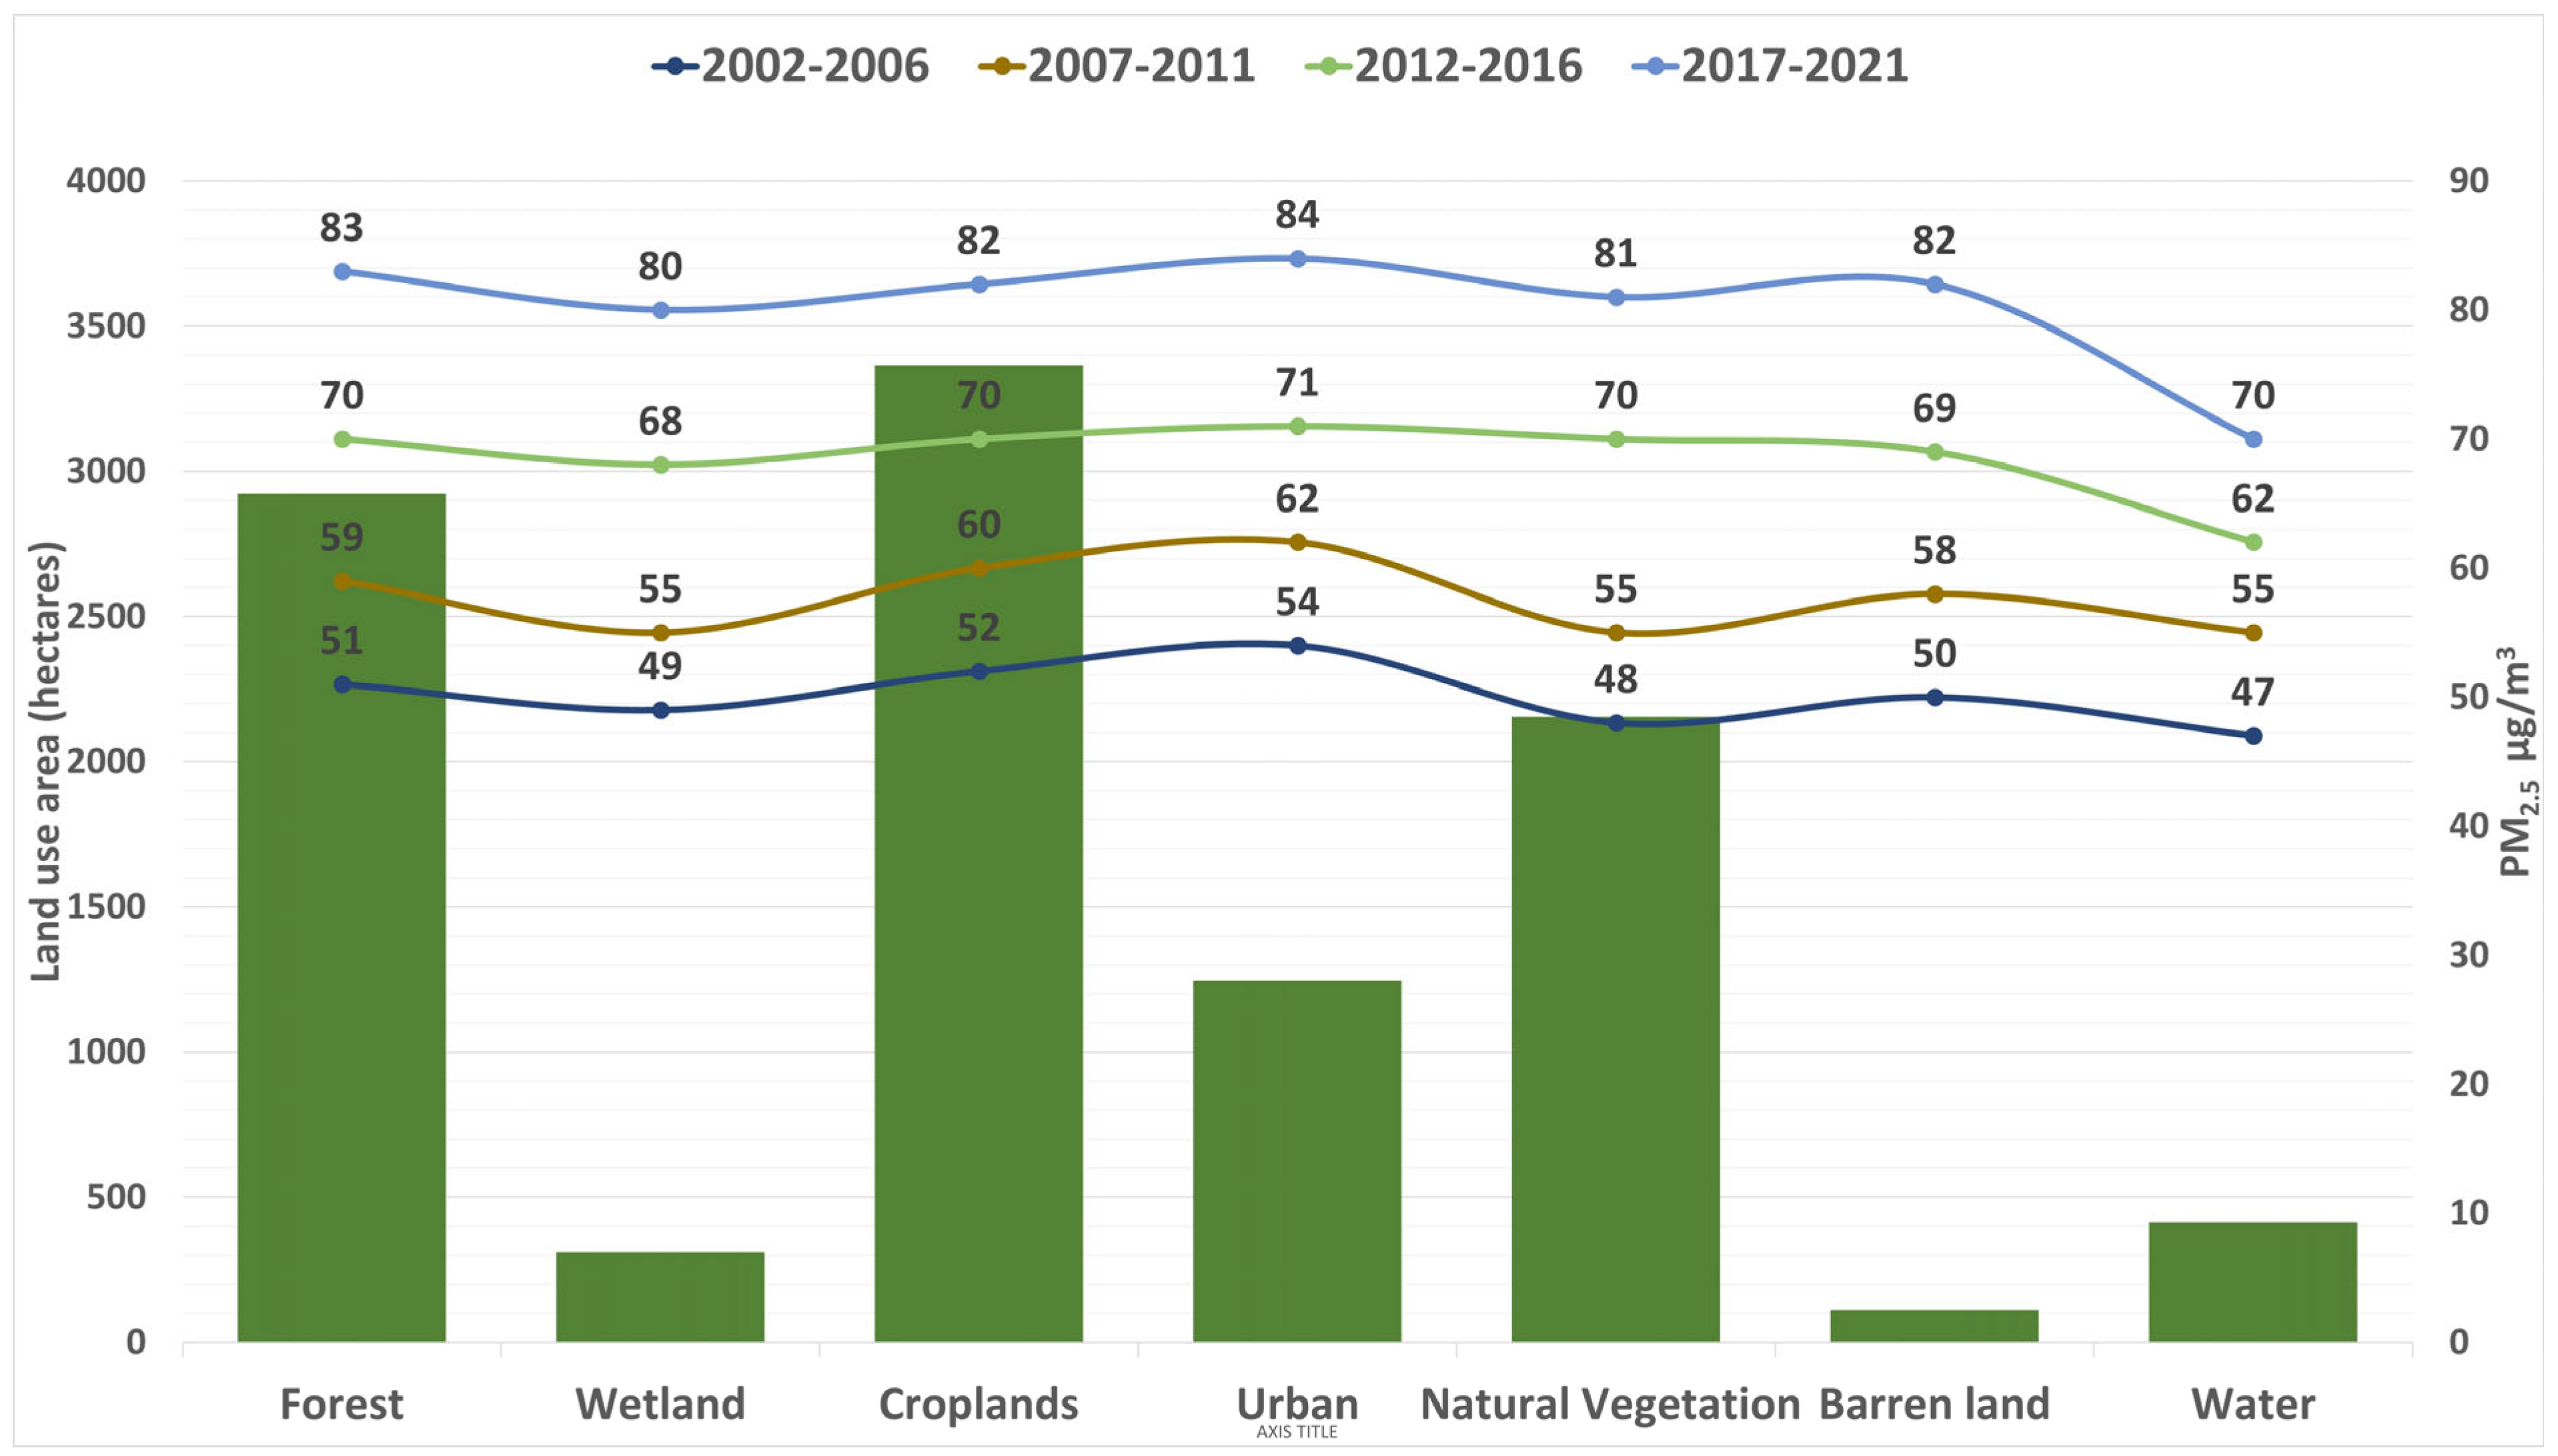
- About 41% of PM2.5 concentration (μg/m3) has increased between 2002 and 2021 in the study area.
- The highest concentration of PM2.5 was found between 2012 and 2021.
- The concentrations of PM2.5 were higher over barren lands, forests, croplands, and urban areas. About 64%, 62.7%, 57%, and 55% concentrations (μg/m3) have increased over barren lands, forests, cropland, and urban areas between the study period.
- The highest concentration level of PM2.5 (84 μg/m3) was found in urban land in 2021.
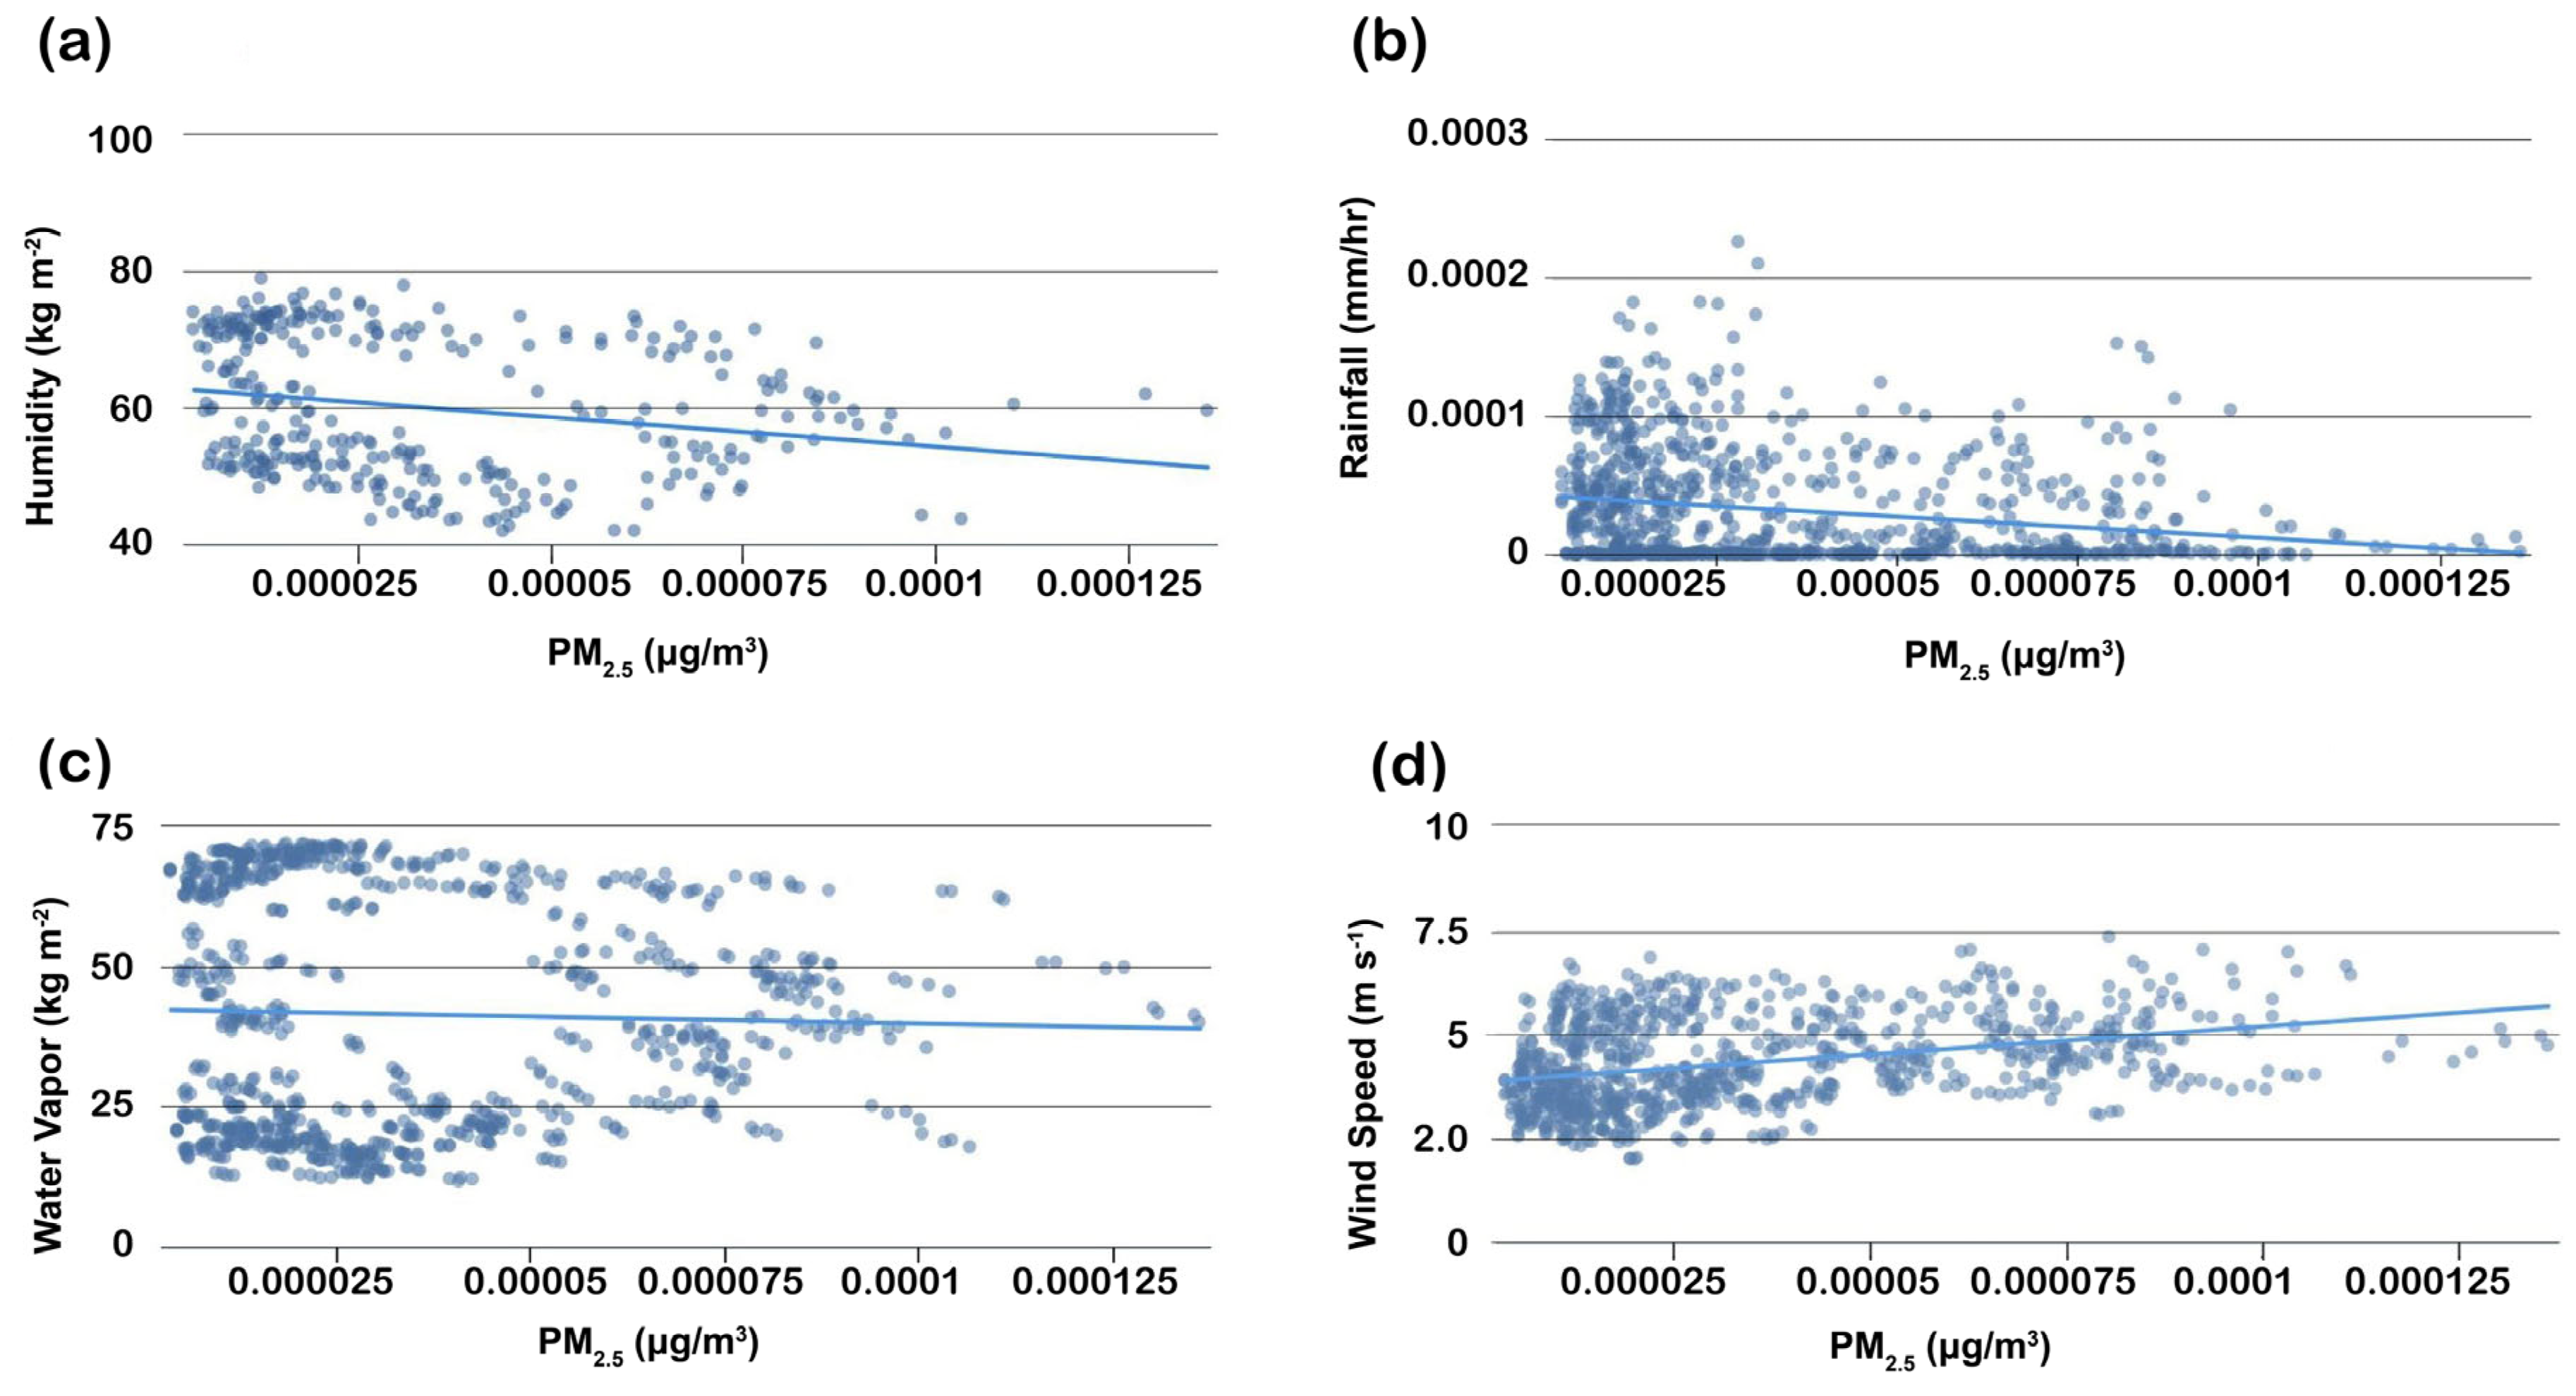
- The regression analysis showed that air pressure (hPa) (r2 = −0.26), evaporation (kg m−2) (r2 = −0.01), humidity (kg m−2) (r2 = −0.22), rainfall (mm/h) (r2 = −0.20), and water vapor (kg m−2) (r2 = −0.03) were negatively correlated with PM2.5.
- On the other hand, air temperature (k) (r2 = 0.24), ground heat (W m−2) (r2 = 0.60, Figure 5d), and wind speed (m s−1) (r2 = 0.34) were positively correlated with PM2.5.
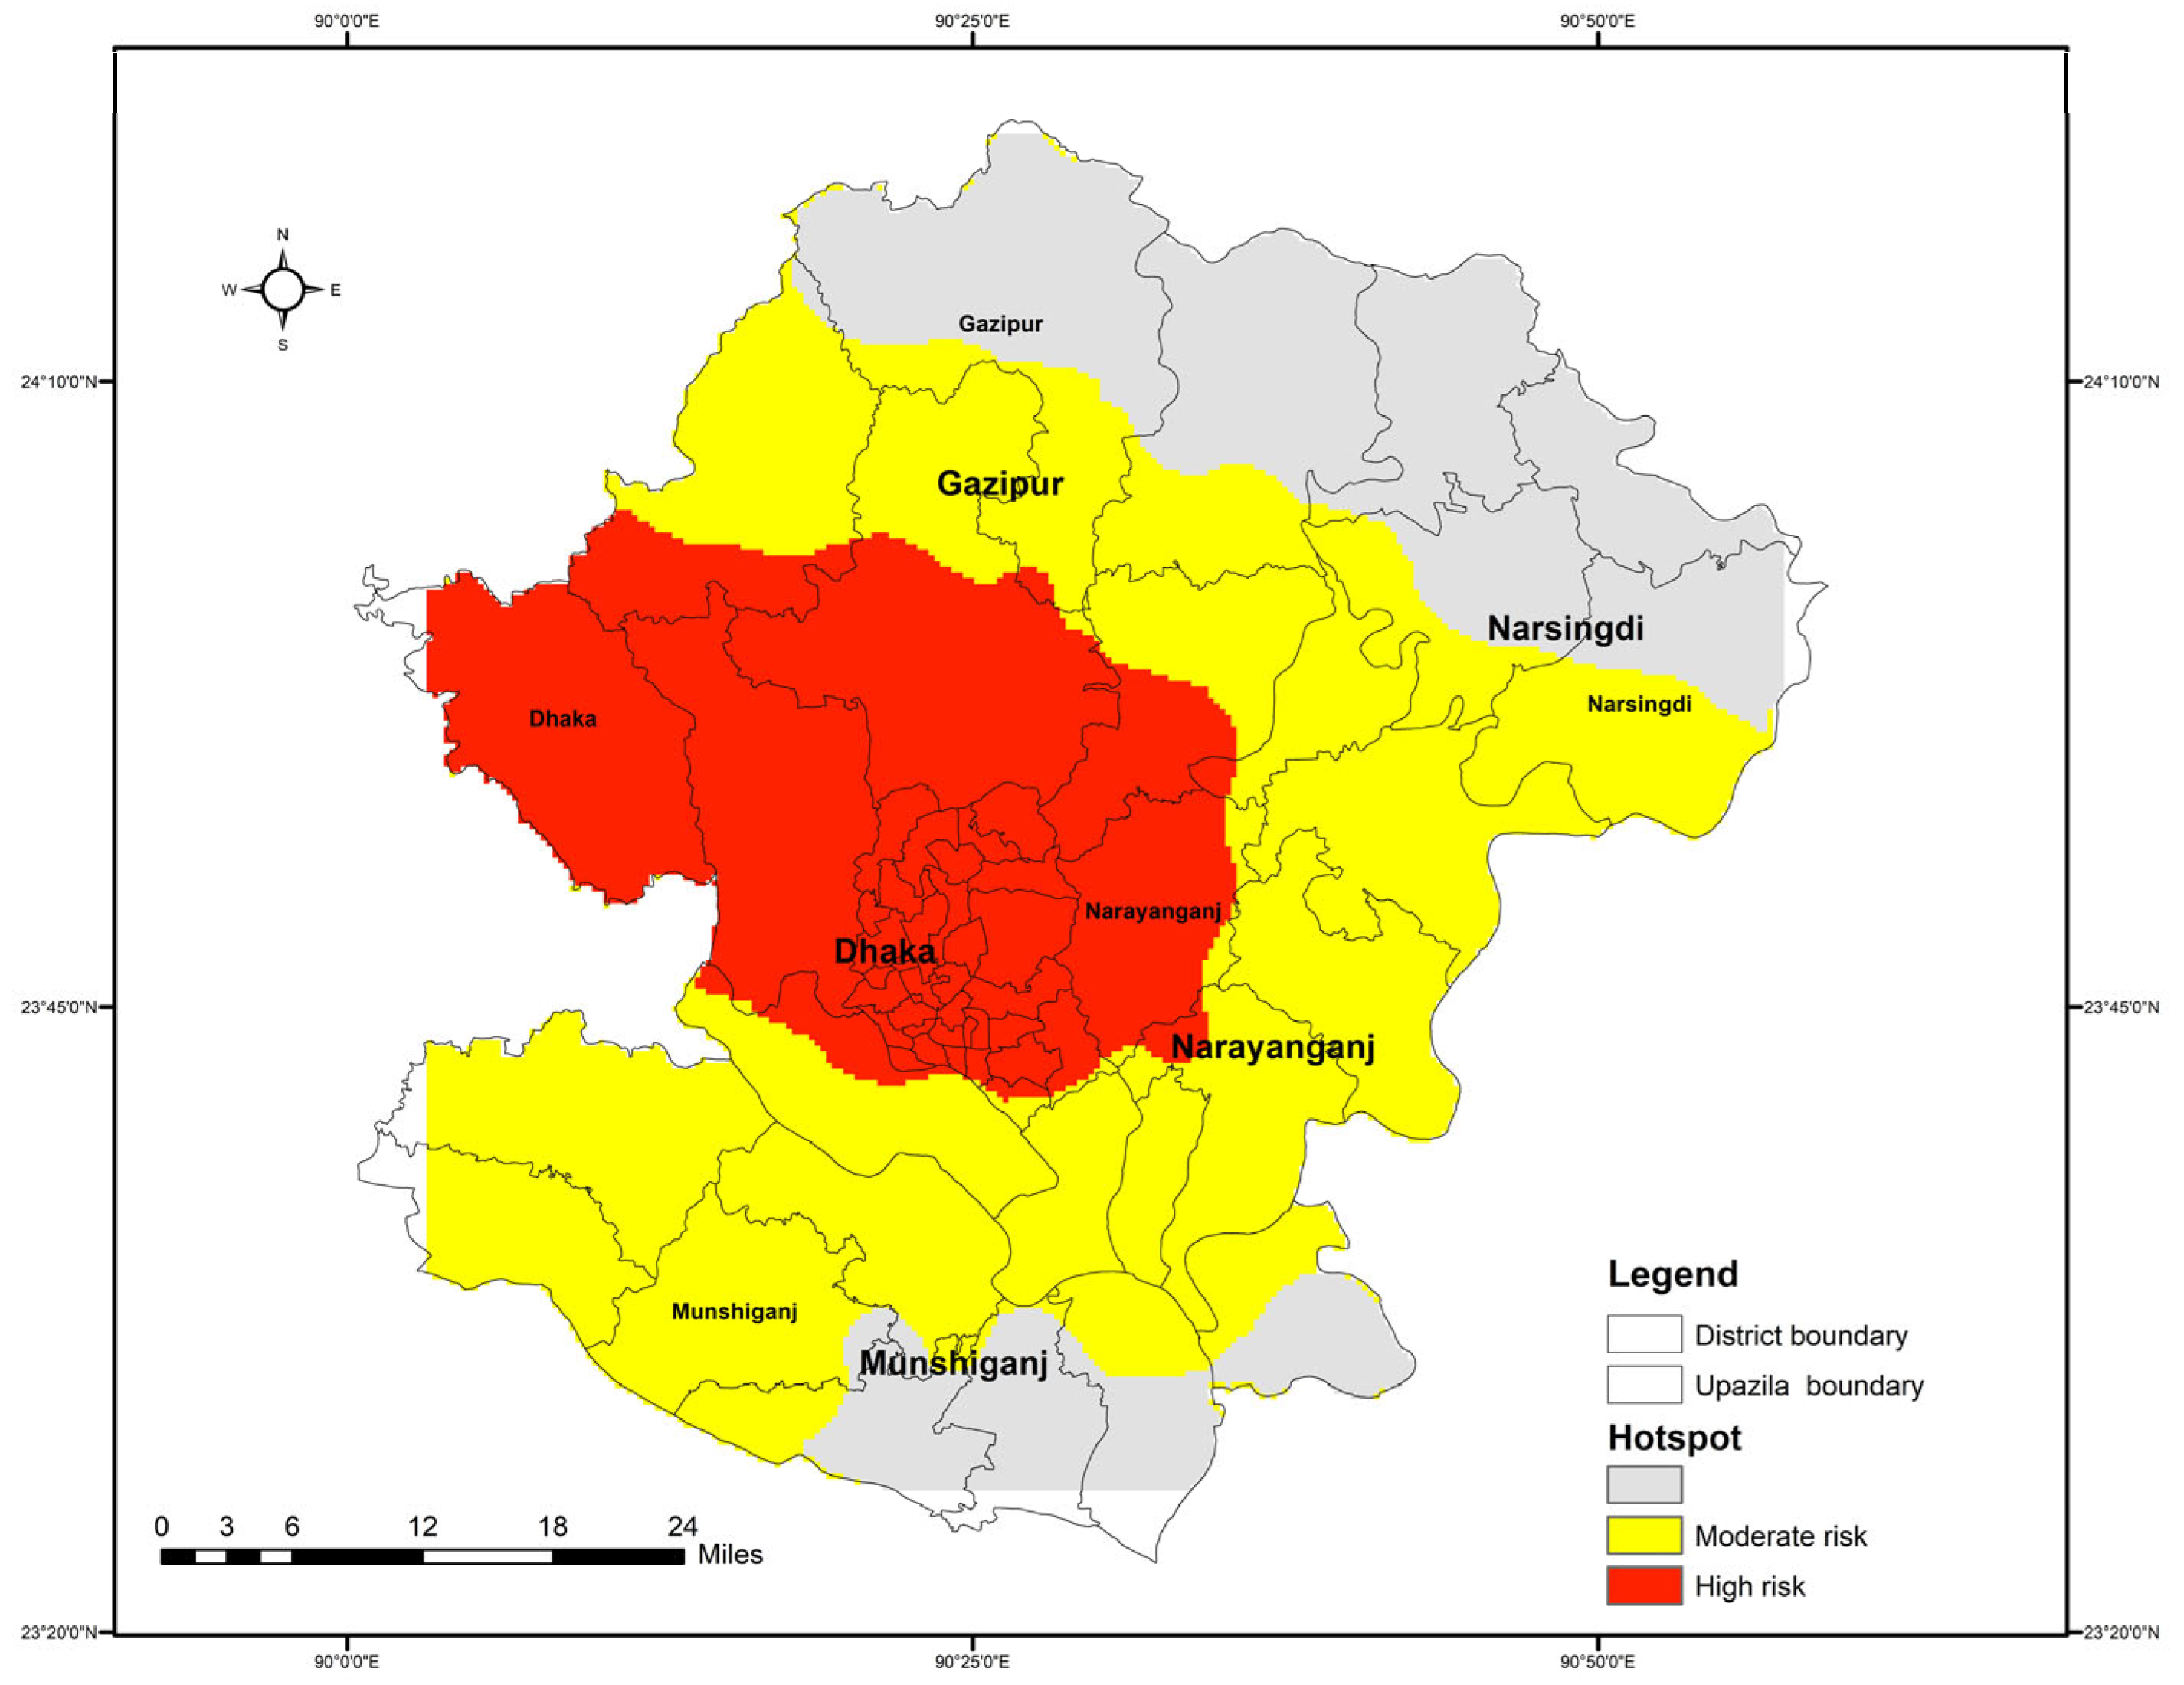
- More than 60 Upazilas with a total population of 11.3 million containing almost 2 million children and 0.5 million elderly people were found to live amongst the most polluted areas and were in the high-risk/hotspot zone.
Author Contributions
Funding
Data Availability Statement
Acknowledgments
Conflicts of Interest
References
- Landrigan, P.J.; Fuller, R.; Acosta, N.J.R.; Adeyi, O.; Arnold, R.; Basu, N.; Baldé, A.B.; Bertollini, R.; Bose-O’Reilly, S.; Boufford, J.I.; et al. The Lancet Commission on pollution and health. Lancet 2018, 391, 462–512. [Google Scholar] [CrossRef] [PubMed] [Green Version]
- WHO. WHO Ambient (Outdoor) Air Quality Database Summary Results, Update 2018; WHO: Geneva, Switzerland, 2018; Volume 10. [Google Scholar]
- Li, C.; Huang, Y.; Guo, H.; Wu, G.; Wang, Y.; Li, W.; Cui, L. The concentrations and removal effects of PM10 and PM2.5 on a Wetland in Beijing. Sustainability 2019, 11, 1312. [Google Scholar] [CrossRef] [Green Version]
- Bayat, R.; Ashrafi, K.; Shafiepour Motlagh, M.; Hassanvand, M.S.; Daroudi, R.; Fink, G.; Künzli, N. Health impact and related cost of ambient air pollution in Tehran. Environ. Res. 2019, 176, 108547. [Google Scholar] [CrossRef] [PubMed]
- Nasari, M.M.; Szyszkowicz, M.; Chen, H.; Crouse, D.; Turner, M.C.; Jerrett, M.; Pope, C.A.; Hubbell, B.; Fann, N.; Cohen, A.; et al. A class of non-linear exposure-response models suitable for health impact assessment applicable to large cohort studies of ambient air pollution. Air Qual. Atmos. Health 2016, 9, 961–972. [Google Scholar] [CrossRef] [Green Version]
- HEI. Systematic Review and Meta-Analysis of Selected Health Effects of Long-Term Exposure to Traffic-Related Air Pollution; Health Effects Institute: Boston, MA, USA, 2022; Available online: https://www.healtheffects.org/publication/systematic-review-and-meta-analysis-selected-health-effects-long-term-exposure-traffic (accessed on 12 March 2022).
- Begum, B.A.; Hopke, P.K. Ambient air quality in dhaka bangladesh over two decades: Impacts of policy on air quality. Aerosol Air Qual. Res. 2018, 18, 1910–1920. [Google Scholar] [CrossRef] [Green Version]
- Tusher, T.R.; Ashraf, Z.; Akter, S. Health effects of brick kiln operations: A study on largest brick kiln cluster in Bangladesh. South East Asia J. Public Health 2019, 8, 32–36. [Google Scholar] [CrossRef] [Green Version]
- Zaman, S.U.; Pavel, M.R.S.; Joy, K.S.; Jeba, F.; Islam, M.S.; Paul, S.; Bari, M.A.; Salam, A. Spatial and temporal variation of aerosol optical depths over six major cities in Bangladesh. Atmos. Res. 2021, 262, 105803. [Google Scholar] [CrossRef]
- Nawar, N.; Sorker, R.; Chowdhury, F.J.; Mostafizur Rahman, M. Present status and historical changes of urban green space in Dhaka city, Bangladesh: A remote sensing driven approach. Environ. Chall. 2022, 6, 100425. [Google Scholar] [CrossRef]
- Nayeem, R.A.A.; Hossain, M.S.; Majumder, A.K. PM2.5 concentration and meteorological characteristics in Dhaka, Bangladesh. Bangladesh J. Sci. Ind. Res. 2020, 55, 89–98. [Google Scholar] [CrossRef]
- Salam, A.; Hossain, T.; Siddique, M.N.A.; Shafiqul Alam, A.M. Characteristics of atmospheric trace gases, particulate matter, and heavy metal pollution in Dhaka, Bangladesh. Air Qual. Atmos. Health 2008, 1, 101–109. [Google Scholar] [CrossRef] [Green Version]
- Randall, S.; Sivertsen, B.; Ahammad, S.S.; Cruz, N.D.; Dam, V.T. Emissions Inventory for Dhaka and Chittagong of Pollutants PM10, PM2.5, NOx, SOx, and CO; Norwegian Institute for Air Research: Kjeller, Norway, 2015. Available online: https://doe.portal.gov.bd/sites/default/files/files/doe.portal.gov.bd/page/cdbe516f_1756_426f_af6b_3ae9f35a78a4/2020-06-10-16-30-6a8801bba5009c814b7d5cbeebebd3aa.pdf (accessed on 23 July 2015).
- Motalib, M.A.; Lasco, R.D. Assessing Air Quality in Dhaka City. Int. J. Sci. Res. 2015, 4, 1908–1912. [Google Scholar] [CrossRef]
- Rahman, M.S.; Kumar, P.; Ullah, M.; Jolly, Y.N.; Akhter, S.; Kabir, J.; Begum, B.A.; Salam, A. Elemental Analysis in Surface Soil and Dust of Roadside Academic Institutions in Dhaka City, Bangladesh and Their Impact on Human Health. Environ. Chem. Ecotoxicol. 2021, 3, 197–208. [Google Scholar] [CrossRef]
- Khwaja, M.A.; Umer, F.; Shaheen, N.; Sherazi, A.; Haq Shaheen, F. Air Pollution Reduction and Control in South Asia Sustainable Development Policy Institute (SDPI); SDPI: Islamabad, Pakistan, 2012; pp. 1–31. [Google Scholar]
- Krishna, B.; Balakrishnan, K.; Siddiqui, A.R.; Begum, B.A.; Bachani, D.; Brauer, M. Tackling the health burden of air pollution in South Asia. BMJ 2017, 359, j5209. [Google Scholar] [CrossRef] [PubMed] [Green Version]
- CANSA. Regional Collaboration of Health Professionals for Resolving South Asia’s Air Pollution & Climate Crisis. 2021. Available online: https://cansouthasia.net/wp-content/uploads/2021/09/RCoHP-South-Asia-Report_06-09-2021.pdf (accessed on 2 June 2021).
- Jabbar, S.A.; Qadar, L.T.; Ghafoor, S.; Rasheed, L.; Sarfraz, Z.; Sarfraz, A.; Sarfraz, M.; Felix, M.; Cherrez-Ojeda, I. Air Quality, Pollution and Sustainability Trends in South Asia: A Population-Based Study. Int. J. Environ. Res. Public Health 2022, 19, 7534. [Google Scholar] [CrossRef]
- Araminienė, V.; Sicard, P.; Anav, A.; Agathokleous, E.; Stakėnas, V.; De Marco, A.; Varnagirytė-Kabašinskienė, I.; Paoletti, E.; Girgždienė, R. Trends and inter-relationships of ground-level ozone metrics and forest health in Lithuania. Sci. Total Environ. 2019, 658, 1265–1277. [Google Scholar] [CrossRef]
- Sicard, P.; Agathokleous, E.; De Marco, A.; Paoletti, E.; Calatayud, V. Urban population exposure to air pollution in Europe over the last decades. Environ. Sci. Eur. 2021, 33, 1–12. [Google Scholar] [CrossRef] [PubMed]
- Breuer, J.L.; Samsun, R.C.; Peters, R.; Stolten, D. The impact of diesel vehicles on NOx and PM10 emissions from road transport in urban morphological zones: A case study in North Rhine-Westphalia, Germany. Sci. Total Environ. 2020, 727, 138583. [Google Scholar] [CrossRef]
- Baró, F.; Chaparro, L.; Gómez-Baggethun, E.; Langemeyer, J.; Nowak, D.J.; Terradas, J. Contribution of ecosystem services to air quality and climate change mitigation policies: The case of urban forests in Barcelona, Spain. Ambio 2014, 43, 466–479. [Google Scholar] [CrossRef] [Green Version]
- Barmpadimos, I.; Hueglin, C.; Keller, J.; Henne, S.; Prévôt, A.S.H. Influence of meteorology on PM10 trends and variability in Switzerland from 1991 to 2008. Atmos. Chem. Phys. 2011, 11, 1813–1835. [Google Scholar] [CrossRef] [Green Version]
- Bellouin, N.; Quaas, J.; Gryspeerdt, E.; Kinne, S.; Stier, P.; Watson-Parris, D.; Boucher, O.; Carslaw, K.S.; Christensen, M.; Daniau, A.L.; et al. Bounding Global Aerosol Radiative Forcing of Climate Change. Rev. Geophys. 2020, 58, e2019RG000660. [Google Scholar] [CrossRef] [Green Version]
- Im, U.; Geels, C.; Hanninen, R.; Kukkonen, J.; Rao, S.; Ruuhela, R.; Sofiev, M.; Schaller, N.; Hodnebrog, Ø.; Sillmann, J.; et al. Reviewing the links and feedbacks between climate change and air pollution in Europe. Front. Environ. Sci. 2022, 10, 1336. [Google Scholar] [CrossRef]
- Cholakian, A.; Colette, A.; Coll, I.; Ciarelli, G.; Beekmann, M. Future climatic drivers and their effect on PM10 components in Europe and the Mediterranean Sea. Atmos. Chem. Phys. 2019, 19, 4459–4484. [Google Scholar] [CrossRef] [Green Version]
- Alam, M.S.; Hyde, B.; Duffy, P.; McNabola, A. An assessment of PM2.5 reductions as a result of transport fleet and fuel policies addressing CO2 emissions and climate change. WIT Trans. Ecol. Environ. 2017, 211, 15–27. [Google Scholar] [CrossRef] [Green Version]
- Liang, C.S.; Duan, F.K.; He, K.B.; Ma, Y.L. Review on recent progress in observations, source identifications and countermeasures of PM2.5. Environ. Int. 2016, 86, 150–170. [Google Scholar] [CrossRef] [PubMed]
- Kim, Y.P.; Grinshpun, S.A.; Asbach, C.; Tsai, C.J. Overview of the special issue “selected papers from the 2014 international aerosol conference”. Aerosol Air Qual. Res. 2015, 15, 2185–2189. [Google Scholar] [CrossRef] [Green Version]
- Rana, M.M.; Mahmud, M.; Khan, M.H.; Sivertsen, B.; Sulaiman, N. Investigating Incursion of Transboundary Pollution into the Atmosphere of Dhaka, Bangladesh. Adv. Meteorol. 2016, 2016, 8318453. [Google Scholar] [CrossRef] [Green Version]
- Pavel, M.R.S.; Zaman, S.U.; Jeba, F.; Islam, M.S.; Salam, A. Long-Term (2003–2019) Air Quality, Climate Variables, and Human Health Consequences in Dhaka, Bangladesh. Front. Sustain. Cities 2021, 3, 681759. [Google Scholar] [CrossRef]
- WHO. Air Pollution; World Health Organization: Geneva, Switzerland, 2022; Available online: https://www.who.int/health-topics/air-pollution#tab=tab_1 (accessed on 22 July 2022).
- Van Donkelaar, A.; Martin, R.V.; Li, C.; Burnett, R.T. Regional Estimates of Chemical Composition of Fine Particulate Matter Using a Combined Geoscience-Statistical Method with Information from Satellites, Models, and Monitors. Environ. Sci. Technol. 2019, 53, 2595–2611. [Google Scholar] [CrossRef] [Green Version]
- Hasan, R.; ISLAM, M.D.A.; Marzia, S.; Hiya, H.J. Atmospheric Content of Particulate Matter PM2.5 in Gazipur and Mymensingh City Corporation Area of Bangladesh. Int. J. Res. Environ. Sci. 2020, 6, 21–29. [Google Scholar] [CrossRef]
- Kulsum, U.; Moniruzzaman, M. Quantifying the Relationship of Vegetation Cover and Air Pollution: A Spatiotemporal Analysis of PM2.5 and NDVI in Greater Dhaka, Bangladesh. Jagannath Univ. J. Sci. 2021, 7, 54–63. [Google Scholar]
- Lu, D.; Xu, J.; Yue, W.; Mao, W.; Yang, D.; Wang, J. Response of PM2.5 pollution to land use in China. J. Clean. Prod. 2020, 244, 118741. [Google Scholar] [CrossRef]
- Faisal, A.A.; Kafy, A.A.; Abdul Fattah, M.; Amir Jahir, D.M.; Al Rakib, A.; Rahaman, Z.A.; Ferdousi, J.; Huang, X. Assessment of temporal shifting of PM2.5, lockdown effect, and influences of seasonal meteorological factors over the fastest-growing megacity, Dhaka. Spat. Inf. Res. 2022, 30, 441–453. [Google Scholar] [CrossRef]
- Afrin, S.; Islam, M.M.; Ahmed, T. A meteorology based particulate matter prediction model for megacity dhaka. Aerosol Air Qual. Res. 2021, 21, 200371. [Google Scholar] [CrossRef]
- BBS. Population and Housing Census-2011; BBS: Dhaka, Bangladesh, 2015; Available online: http://203.112.218.65:8008/WebTestApplication/userfiles/Image/PopCenZilz2011/Zila_Dhaka.pdf (accessed on 5 March 2022).
- Islam, N.; Toha, T.R.; Islam, M.M.; Ahmed, T. The association between particulate matter concentration and meteorological parameters in Dhaka, Bangladesh. Meteorol. Atmos. Phys. 2022, 134, 64. [Google Scholar] [CrossRef]
- Hossain, M.Z.; Nikam, B.R.; Gupta, P.K.; Srivastav, S.K. Estimating groundwater resource and understanding recharge processes in the rapidly urbanizing Dhaka City, Bangladesh. Groundw. Sustain. Dev. 2021, 12, 100514. [Google Scholar] [CrossRef]
- Hassan, M.M.; Juhász, L.; Southworth, J. Mapping Time-Space Brickfield Development Dynamics in Peri-Urban Area of Dhaka, Bangladesh Mohammad. Int. J. Geo-Inf. 2019, 8, 447. [Google Scholar] [CrossRef] [Green Version]
- Islam, M. Chemical speciation of particulate matter pollution in urban Dhaka City. Bangladesh Environ. 2000, 2000, 51–58. [Google Scholar]
- WorldPop. Open Spatial Demographic Data and Research; WorldPop: Southampton, UK, 2023. [Google Scholar]
- Chew, B.N.; Campbell, J.R.; Hyer, E.J.; Salinas, S.V.; Reid, J.S.; Welton, E.J.; Holben, B.N.; Liew, S.C. Relationship between aerosol optical depth and particulate matter over Singapore: Effects of aerosol vertical distributions. Aerosol Air Qual. Res. 2016, 16, 2818–2830. [Google Scholar] [CrossRef]
- Van Donkelaar, A.; Martin, R.V.; Brauer, M.; Hsu, N.C.; Kahn, R.A.; Levy, R.C.; Lyapustin, A.; Sayer, A.M.; Winker, D.M. Global Estimates of Fine Particulate Matter using a Combined Geophysical-Statistical Method with Information from Satellites, Models, and Monitors. Environ. Sci. Technol. 2016, 50, 3762–3772. [Google Scholar] [CrossRef]
- Rafsan, R.A.; Ishmam, Z.S.; Ahammed, T. Predicting Hospital Admissions in Dhaka due to Chest Diseases Using Multiple Linear Regression and Feed Forward. In Proceedings of the 5th International Conference on Advances in Civil Engineering (ICACE 2020), Dhaka, Bangladesh, 4–6 March 2021; pp. 4–6. [Google Scholar]
- Kayes, I.; Shahriar, S.A.; Hasan, K.; Akhter, M.; Kabir, M.M.; Salam, M.A. The relationships between meteorological parameters and air pollutants in an urban environment. Glob. J. Environ. Sci. Manag. 2019, 5, 265–278. [Google Scholar] [CrossRef]
- Lin, C.A.; Chen, Y.C.; Liu, C.Y.; Chen, W.T.; Seinfeld, J.H.; Chou, C.C.K. Satellite-derived correlation of SO2, NO2, and aerosol optical depth with meteorological conditions over East Asia from 2005 to 2015. Remote Sens. 2019, 11, 1738. [Google Scholar] [CrossRef] [Green Version]
- Mukherjee, A.; Brown, S.G.; McCarthy, M.C.; Pavlovic, N.R.; Stanton, L.G.; Snyder, J.L.; D’Andrea, S.; Hafner, H.R. Measuring spatial and temporal PM2.5 variations in Sacramento, California, communities using a network of low-cost sensors. Sensors 2019, 19, 4701. [Google Scholar] [CrossRef] [PubMed] [Green Version]
- Iqbal, A.; Afroze, S.; Rahman, M.M. Vehicular PM emissions and urban public health sustainability: A probabilistic analysis for Dhaka City. Sustainability 2020, 12, 6284. [Google Scholar] [CrossRef]
- Songchitruksa, P.; Zeng, X. Getis-ord spatial statistics to identify hot spots by using incident management data. Transp. Res. Rec. 2010, 2165, 42–51. [Google Scholar] [CrossRef]
- Guo, W.; Wang, S.; Tiwari, G.; Johnson, J.A.; Tang, J. Temperature and moisture dependent dielectric properties of legume flours associated with dielectric heating. Am. Soc. Agric. Biol. Eng. 2009, 3, 1599–1608. [Google Scholar] [CrossRef]
- Fahrmeir, L.; Kneib, T.; Lang, S.; Marx, B. Regression; Springer: Berlin/Heidelberg, Germany, 2013; ISBN 9783642343322. [Google Scholar]
- Imran, M.; Baten, M.; Nahar, B.; Morshed, N. Carbon dioxide emission from brickfields around Bangladesh. Int. J. Agric. Res. Innov. Technol. 2015, 4, 70–75. [Google Scholar] [CrossRef] [Green Version]
- Zhang, Z. Energy efficiency and environmental pollution of brickmaking in China. Energy 1997, 22, 33–42. [Google Scholar] [CrossRef]
- Begum, B.A.; Hopke, P.K. Identification of sources from chemical characterization of fine particulate matter and assessment of ambient air quality in Dhaka, Bangladesh. Aerosol Air Qual. Res. 2019, 19, 118–128. [Google Scholar] [CrossRef] [Green Version]
- Begum, B.A.; Nasiruddin, M.; Randal, S.; Sivertsen, B.; Hopke, P.K. Identification and Apportionment of Sources from Air Particulate Matter at Urban Environments in Bangladesh. Br. J. Appl. Sci. Technol. 2014, 4, 3930–3955. [Google Scholar] [CrossRef] [Green Version]
- Gautam, S.; Yadav, A.; Tsai, C.J.; Kumar, P. A review on recent progress in observations, sources, classification and regulations of PM2.5 in Asian environments. Environ. Sci. Pollut. Res. 2016, 23, 21165–21175. [Google Scholar] [CrossRef]
- Tiwari, S.; Hopke, P.K.; Pipal, A.S.; Srivastava, A.K.; Bisht, D.S.; Tiwari, S.; Singh, A.K.; Soni, V.K.; Attri, S.D. Intra-urban variability of particulate matter (PM2.5 and PM10) and its relationship with optical properties of aerosols over Delhi, India. Atmos. Res. 2015, 166, 223–232. [Google Scholar] [CrossRef]
- Mkoma, S.L.; Chi, X.; Maenhaut, W. Characteristics of carbonaceous aerosols in ambient PM10 and PM2.5 particles in Dar es Salaam, Tanzania. Sci. Total Environ. 2010, 408, 1308–1314. [Google Scholar] [CrossRef] [PubMed]
- Arfaeinia, H.; Hashemi, S.E.; Alamolhoda, A.A.; Kermani, M. Evaluation of organic carbon, elemental carbon, and water soluble organic carbon concentration in PM2.5 in the ambient air of Sina Hospital district, Tehran, Iran. J. Adv. Env. Health Res. 2016, 4, 95–101. [Google Scholar]
- Kiesewetter, G.; Borken-Kleefeld, J.; Schöpp, W.; Heyes, C.; Thunis, P.; Bessagnet, B.; Terrenoire, E.; Fagerli, H.; Nyiri, A.; Amann, M. Modelling street level PM10 concentrations across Europe: Source apportionment and possible futures. Atmos. Chem. Phys. 2015, 15, 1539–1553. [Google Scholar] [CrossRef] [Green Version]
- Rajput, P.; Sarin, M.; Kundu, S.S. Atmospheric particulate matter (PM2.5), EC, OC, WSOC and PAHs from NE-Himalaya: Abundances and chemical characteristics. Atmos. Pollut. Res. 2013, 4, 214–221. [Google Scholar] [CrossRef] [Green Version]
- McDuffie, E.E.; Martin, R.V.; Spadaro, J.V.; Burnett, R.; Smith, S.J.; O’Rourke, P.; Hammer, M.S.; van Donkelaar, A.; Bindle, L.; Shah, V.; et al. Source sector and fuel contributions to ambient PM2.5 and attributable mortality across multiple spatial scales. Nat. Commun. 2021, 12, 3594. [Google Scholar] [CrossRef]
- Zhang, Q.; Jiang, X.; Tong, D.; Davis, S.J.; Zhao, H.; Geng, G.; Feng, T.; Zheng, B.; Lu, Z.; Streets, D.G.; et al. Transboundary health impacts of transported global air pollution and international trade. Nature 2017, 543, 705–709. [Google Scholar] [CrossRef] [Green Version]
- McDuffie, E.E.; Smith, S.J.; O’Rourke, P.; Tibrewal, K.; Venkataraman, C.; Marais, E.A.; Zheng, B.; Crippa, M.; Brauer, M.; Martin, R.V. A global anthropogenic emission inventory of atmospheric pollutants from sector- and fuel-specific sources (1970–2017): An application of the Community Emissions Data System (CEDS). Earth Syst. Sci. Data 2020, 12, 3413–3442. [Google Scholar] [CrossRef]
- Meng, J.; Martin, R.V.; Li, C.; Van Donkelaar, A.; Tzompa-Sosa, Z.A.; Yue, X.; Xu, J.W.; Weagle, C.L.; Burnett, R.T. Source Contributions to Ambient Fine Particulate Matter for Canada. Environ. Sci. Technol. 2019, 53, 10269–10278. [Google Scholar] [CrossRef]
- Gao, M.; Beig, G.; Song, S.; Zhang, H.; Hu, J.; Ying, Q.; Liang, F.; Liu, Y.; Wang, H.; Lu, X.; et al. The impact of power generation emissions on ambient PM2.5 pollution and human health in China and India. Environ. Int. 2018, 121, 250–259. [Google Scholar] [CrossRef]
- Yang, H.; Chen, W.; Liang, Z. Impact of land use on PM2.5 pollution in a representative city of middle China. Int. J. Environ. Res. Public Health 2017, 14, 462. [Google Scholar] [CrossRef]
- Tian, L.; Hou, W.; Chen, J.; Chen, C.; Pan, X. Spatiotemporal changes in PM2.5 and their relationships with land-use and people in Hangzhou. Int. J. Environ. Res. Public Health 2018, 15, 2192. [Google Scholar] [CrossRef] [Green Version]
- Shao, J.; Ge, J.; Feng, X.; Zhao, C. Study on the relationship between PM2.5 concentration and intensive land use in Hebei Province based on a spatial regression model. PLoS ONE 2020, 15, e0238547. [Google Scholar] [CrossRef]
- Yu, H.-L.; Wang, C.-H. Spatiotemporal Estimation of PM2.5 by Land Use Regression and Bayesian Maximum Entropy Method. Epidemiology 2011, 22, S175–S176. [Google Scholar] [CrossRef]
- Yang, W.; Jiang, X. Evaluating the influence of land use and land cover change on fine particulate matter. Sci. Rep. 2021, 11, 17612. [Google Scholar] [CrossRef] [PubMed]
- Dong, C.W.; Cao, Y.; Tan, Y.Z. Urban expansion and vegetation changes in Hangzhou Bay area using night-light data. Chin. J. Appl. Ecol. 2017, 28, 231–238. [Google Scholar] [CrossRef]
- Tai, A.P.K.; Mickley, L.J.; Jacob, D.J. Correlations between fine particulate matter (PM2.5) and meteorological variables in the United States: Implications for the sensitivity of PM2.5 to climate change. Atmos. Environ. 2010, 44, 3976–3984. [Google Scholar] [CrossRef]
- Huang, F.; Li, X.; Wang, C.; Xu, Q.; Wang, W.; Luo, Y.; Tao, L.; Gao, Q.; Guo, J.; Chen, S.; et al. PM2.5 spatiotemporal variations and the relationship with meteorological factors during 2013–2014 in Beijing, China. PLoS ONE 2015, 10, e0141642. [Google Scholar] [CrossRef] [PubMed]
- Wang, J.; Ogawa, S. Effects of meteorological conditions on PM2.5 concentrations in Nagasaki, Japan. Int. J. Environ. Res. Public Health 2015, 12, 9089–9101. [Google Scholar] [CrossRef]
- Lawal, O.; Asimiea, A. Spatial modelling of population at risk and PM2.5 exposure index: A case study of Nigeria. Ethiop. J. Environ. Stud. Manag. 2015, 8, 69–80. [Google Scholar] [CrossRef]
- Wang, Q.; Wang, J.; Zhou, J.; Ban, J.; Li, T. Estimation of PM2.5-associated disease burden in China in 2020 and 2030 using population and air quality scenarios: A modelling study. Lancet Planet. Health 2019, 3, e71–e80. [Google Scholar] [CrossRef] [PubMed] [Green Version]
- Bhalla, N.; O’Boyle, J.; Haun, D. Who is responsible for Delhi air pollution? Indian newspapers’ framing of causes and solutions. Int. J. Commun. 2019, 13, 41–64. [Google Scholar]


| PM2.5 (Annual) | 0–5 Age | 50–69 Age | Total Population |
|---|---|---|---|
| High-hotspot area (65 μg/m3) | 1,948,029 | 485,407 | 11,260,162 |
| Medium-hotspot area (50 μg/m3) | 1,231,066 | 370,124 | 5,720,467 |
| Low-hotspot area (45 μg/m3) | 523,128 | 181,445 | 2,343,643 |
Disclaimer/Publisher’s Note: The statements, opinions and data contained in all publications are solely those of the individual author(s) and contributor(s) and not of MDPI and/or the editor(s). MDPI and/or the editor(s) disclaim responsibility for any injury to people or property resulting from any ideas, methods, instructions or products referred to in the content. |
© 2023 by the authors. Licensee MDPI, Basel, Switzerland. This article is an open access article distributed under the terms and conditions of the Creative Commons Attribution (CC BY) license (https://creativecommons.org/licenses/by/4.0/).
Share and Cite
Hassan, M.S.; Gomes, R.F.L.; Bhuiyan, M.A.H.; Rahman, M.T. Land Use and the Climatic Determinants of Population Exposure to PM2.5 in Central Bangladesh. Pollutants 2023, 3, 381-395. https://doi.org/10.3390/pollutants3030026
Hassan MS, Gomes RFL, Bhuiyan MAH, Rahman MT. Land Use and the Climatic Determinants of Population Exposure to PM2.5 in Central Bangladesh. Pollutants. 2023; 3(3):381-395. https://doi.org/10.3390/pollutants3030026
Chicago/Turabian StyleHassan, Md. Shareful, Reeju F. L. Gomes, Mohammad A. H. Bhuiyan, and Muhammad Tauhidur Rahman. 2023. "Land Use and the Climatic Determinants of Population Exposure to PM2.5 in Central Bangladesh" Pollutants 3, no. 3: 381-395. https://doi.org/10.3390/pollutants3030026
APA StyleHassan, M. S., Gomes, R. F. L., Bhuiyan, M. A. H., & Rahman, M. T. (2023). Land Use and the Climatic Determinants of Population Exposure to PM2.5 in Central Bangladesh. Pollutants, 3(3), 381-395. https://doi.org/10.3390/pollutants3030026