
Determination of Physio-Chemical Parameters and Water Quality Index (Wqi) of Kundapura Taluk, Udupi District, Karnataka, India


Abstract
:1. Introduction
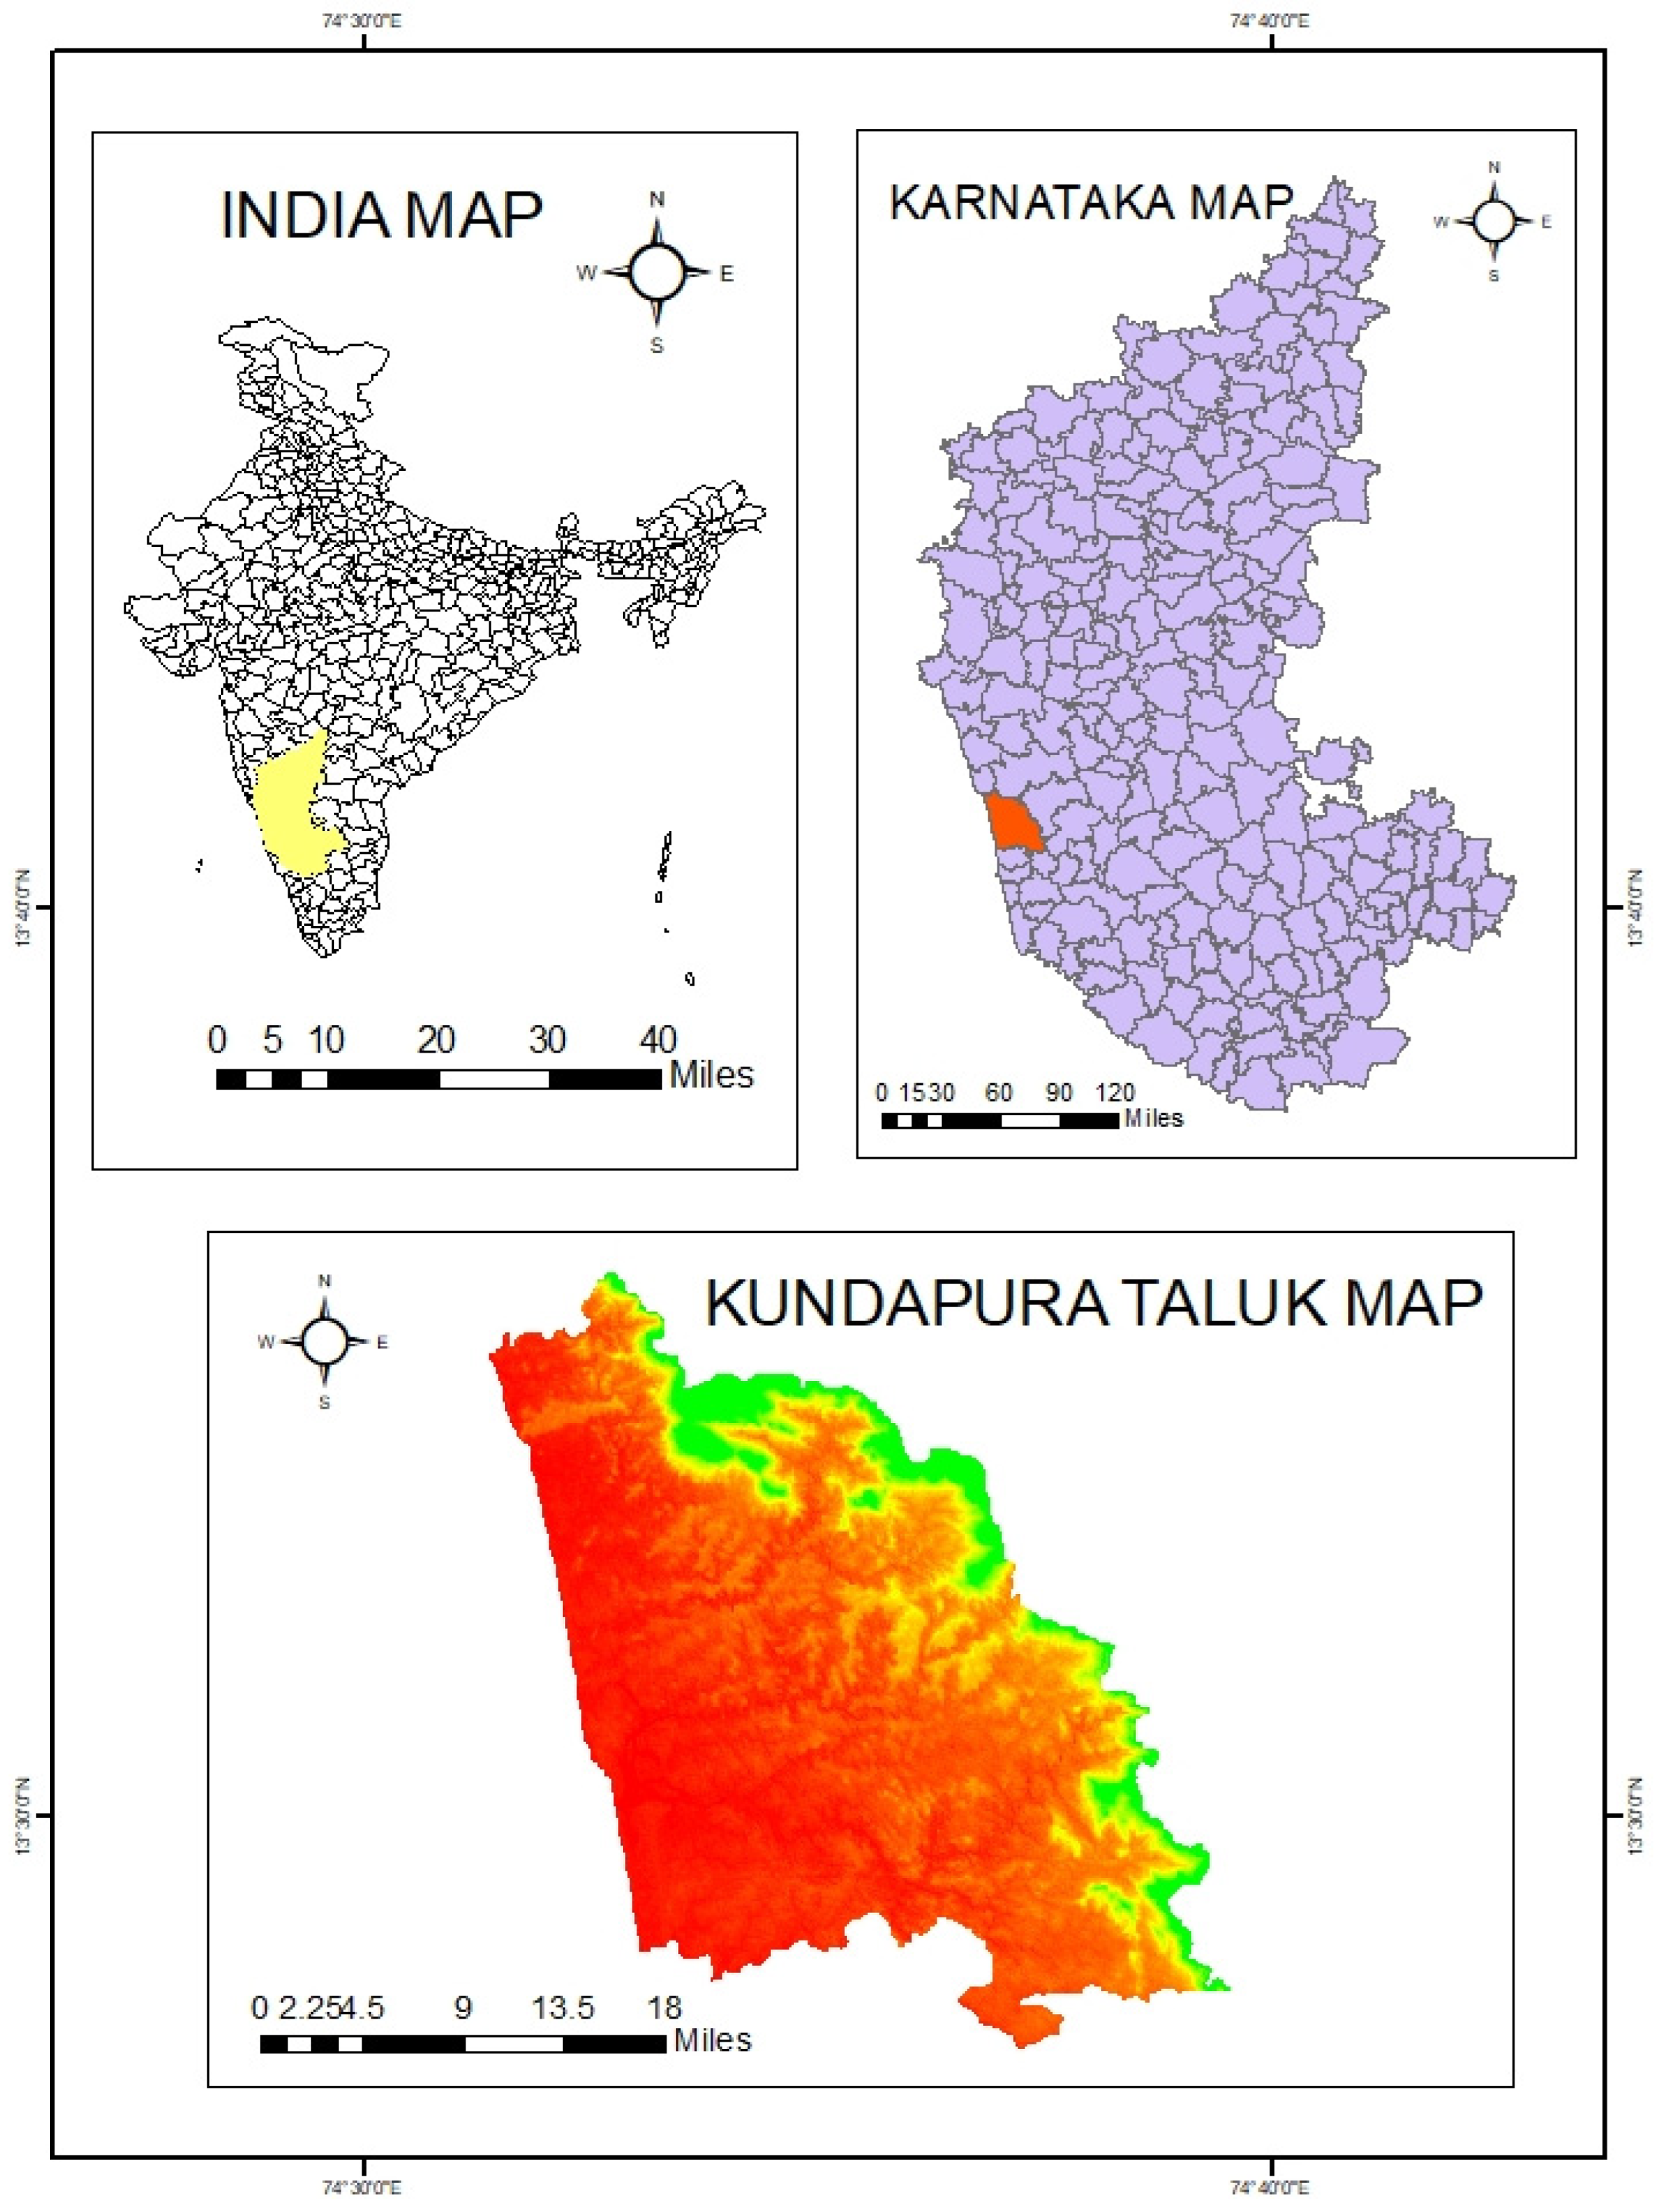
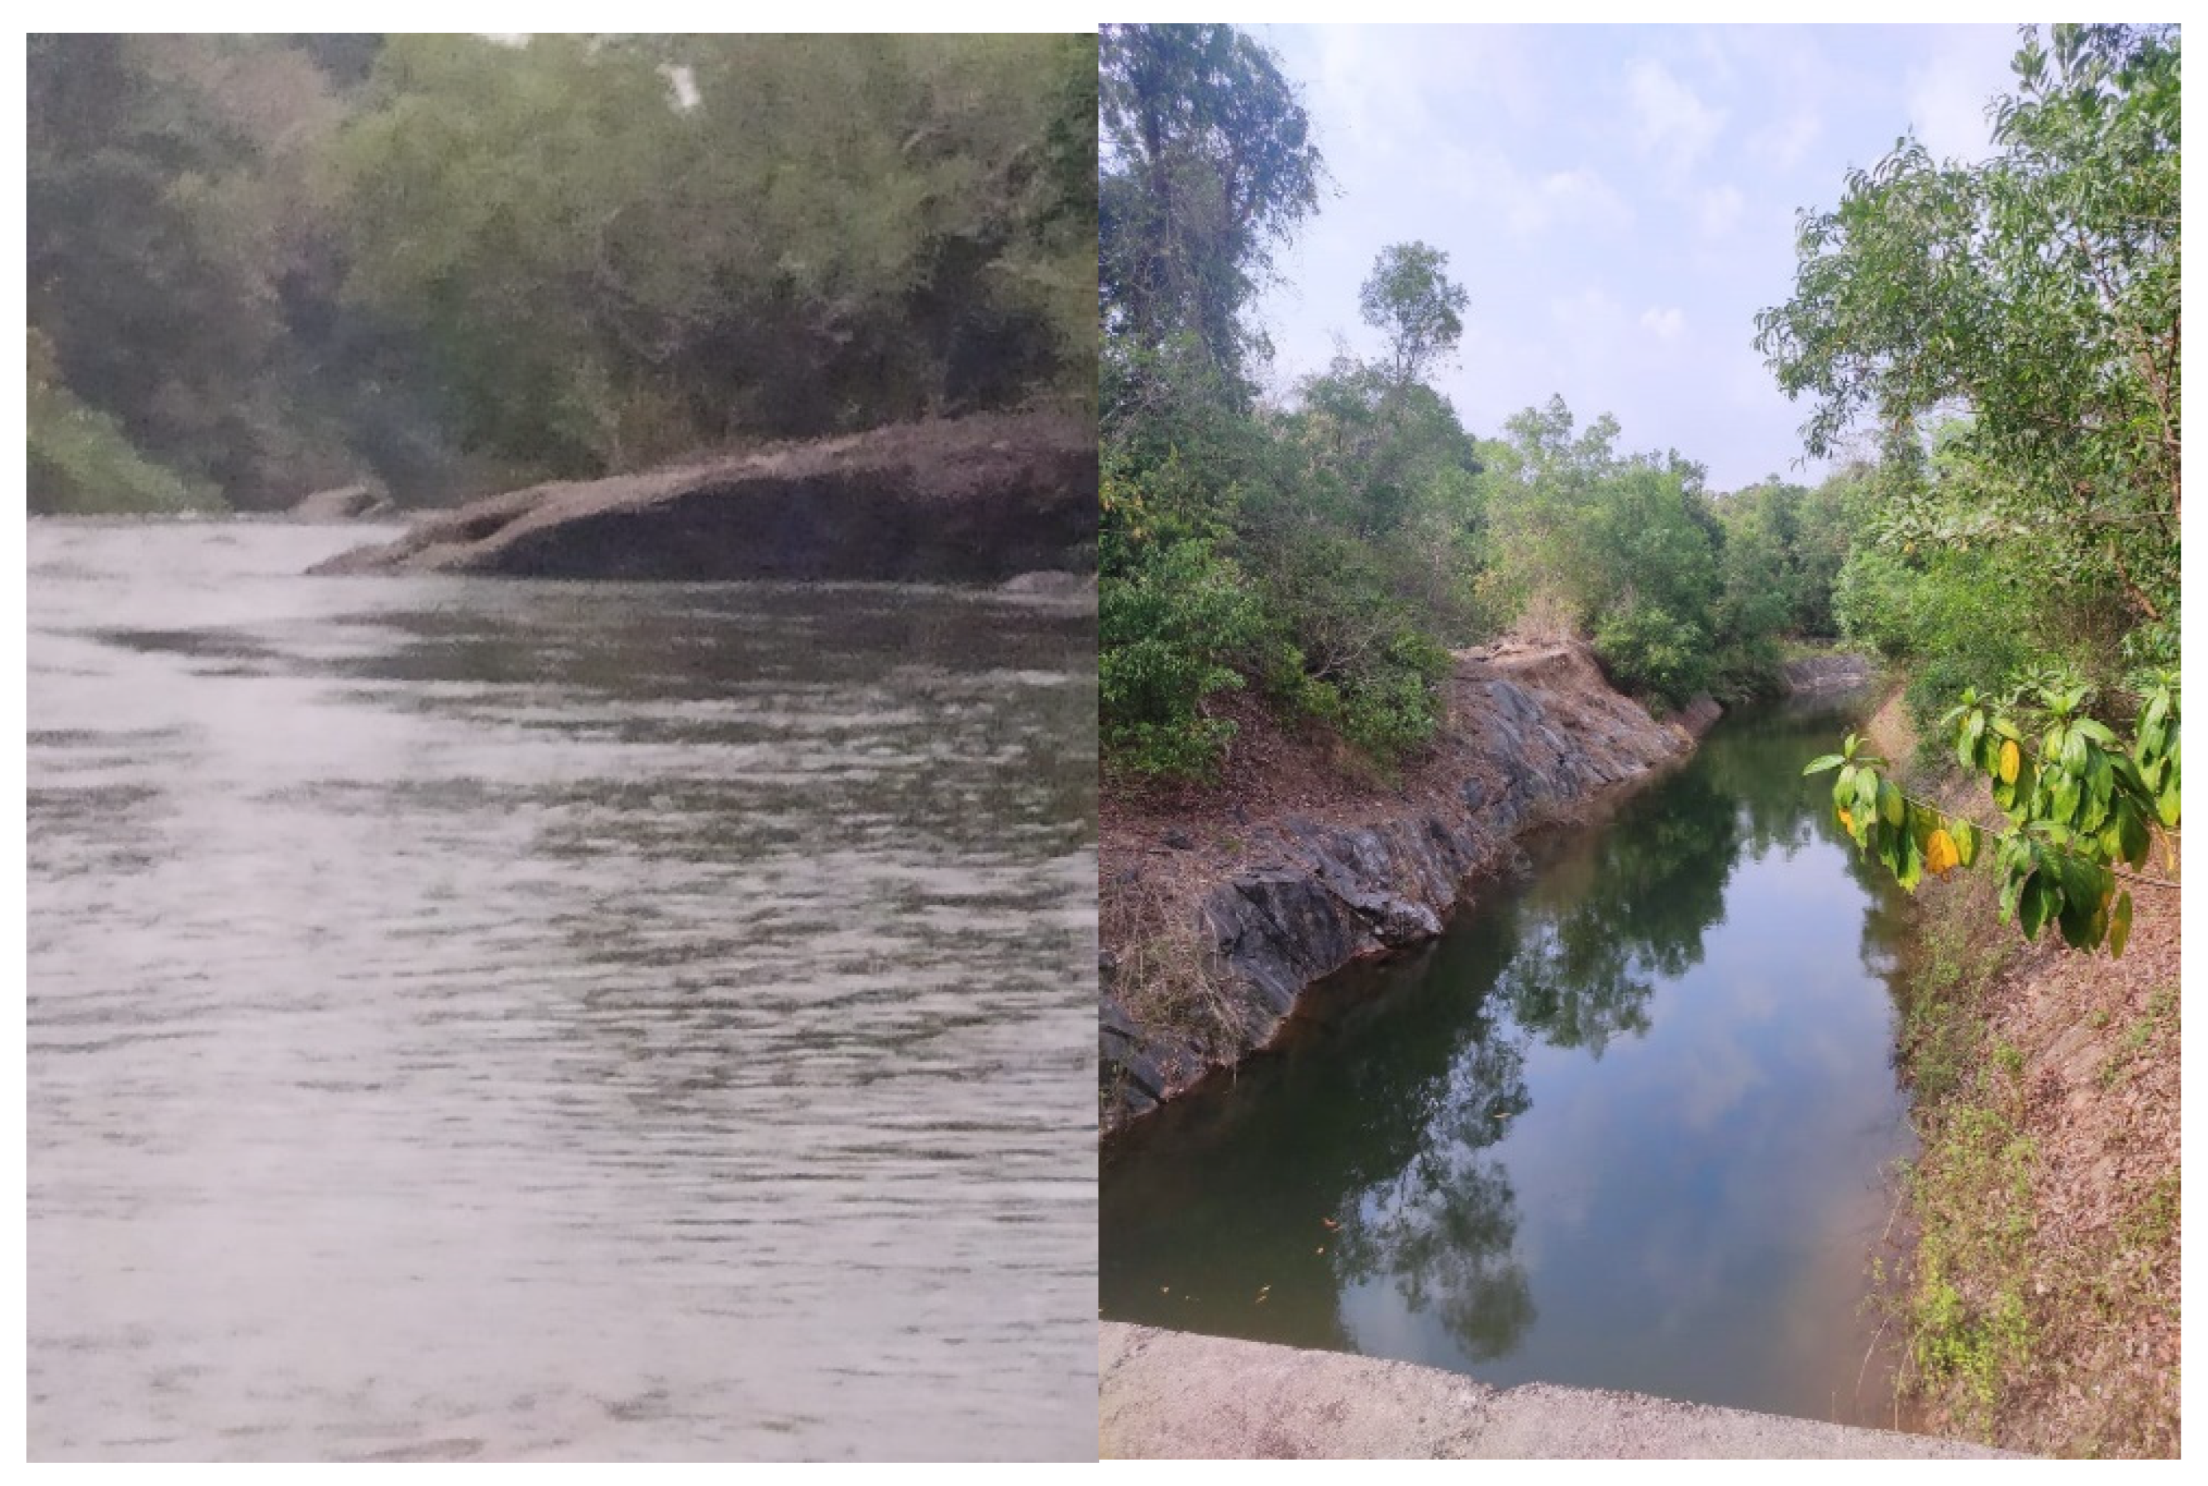
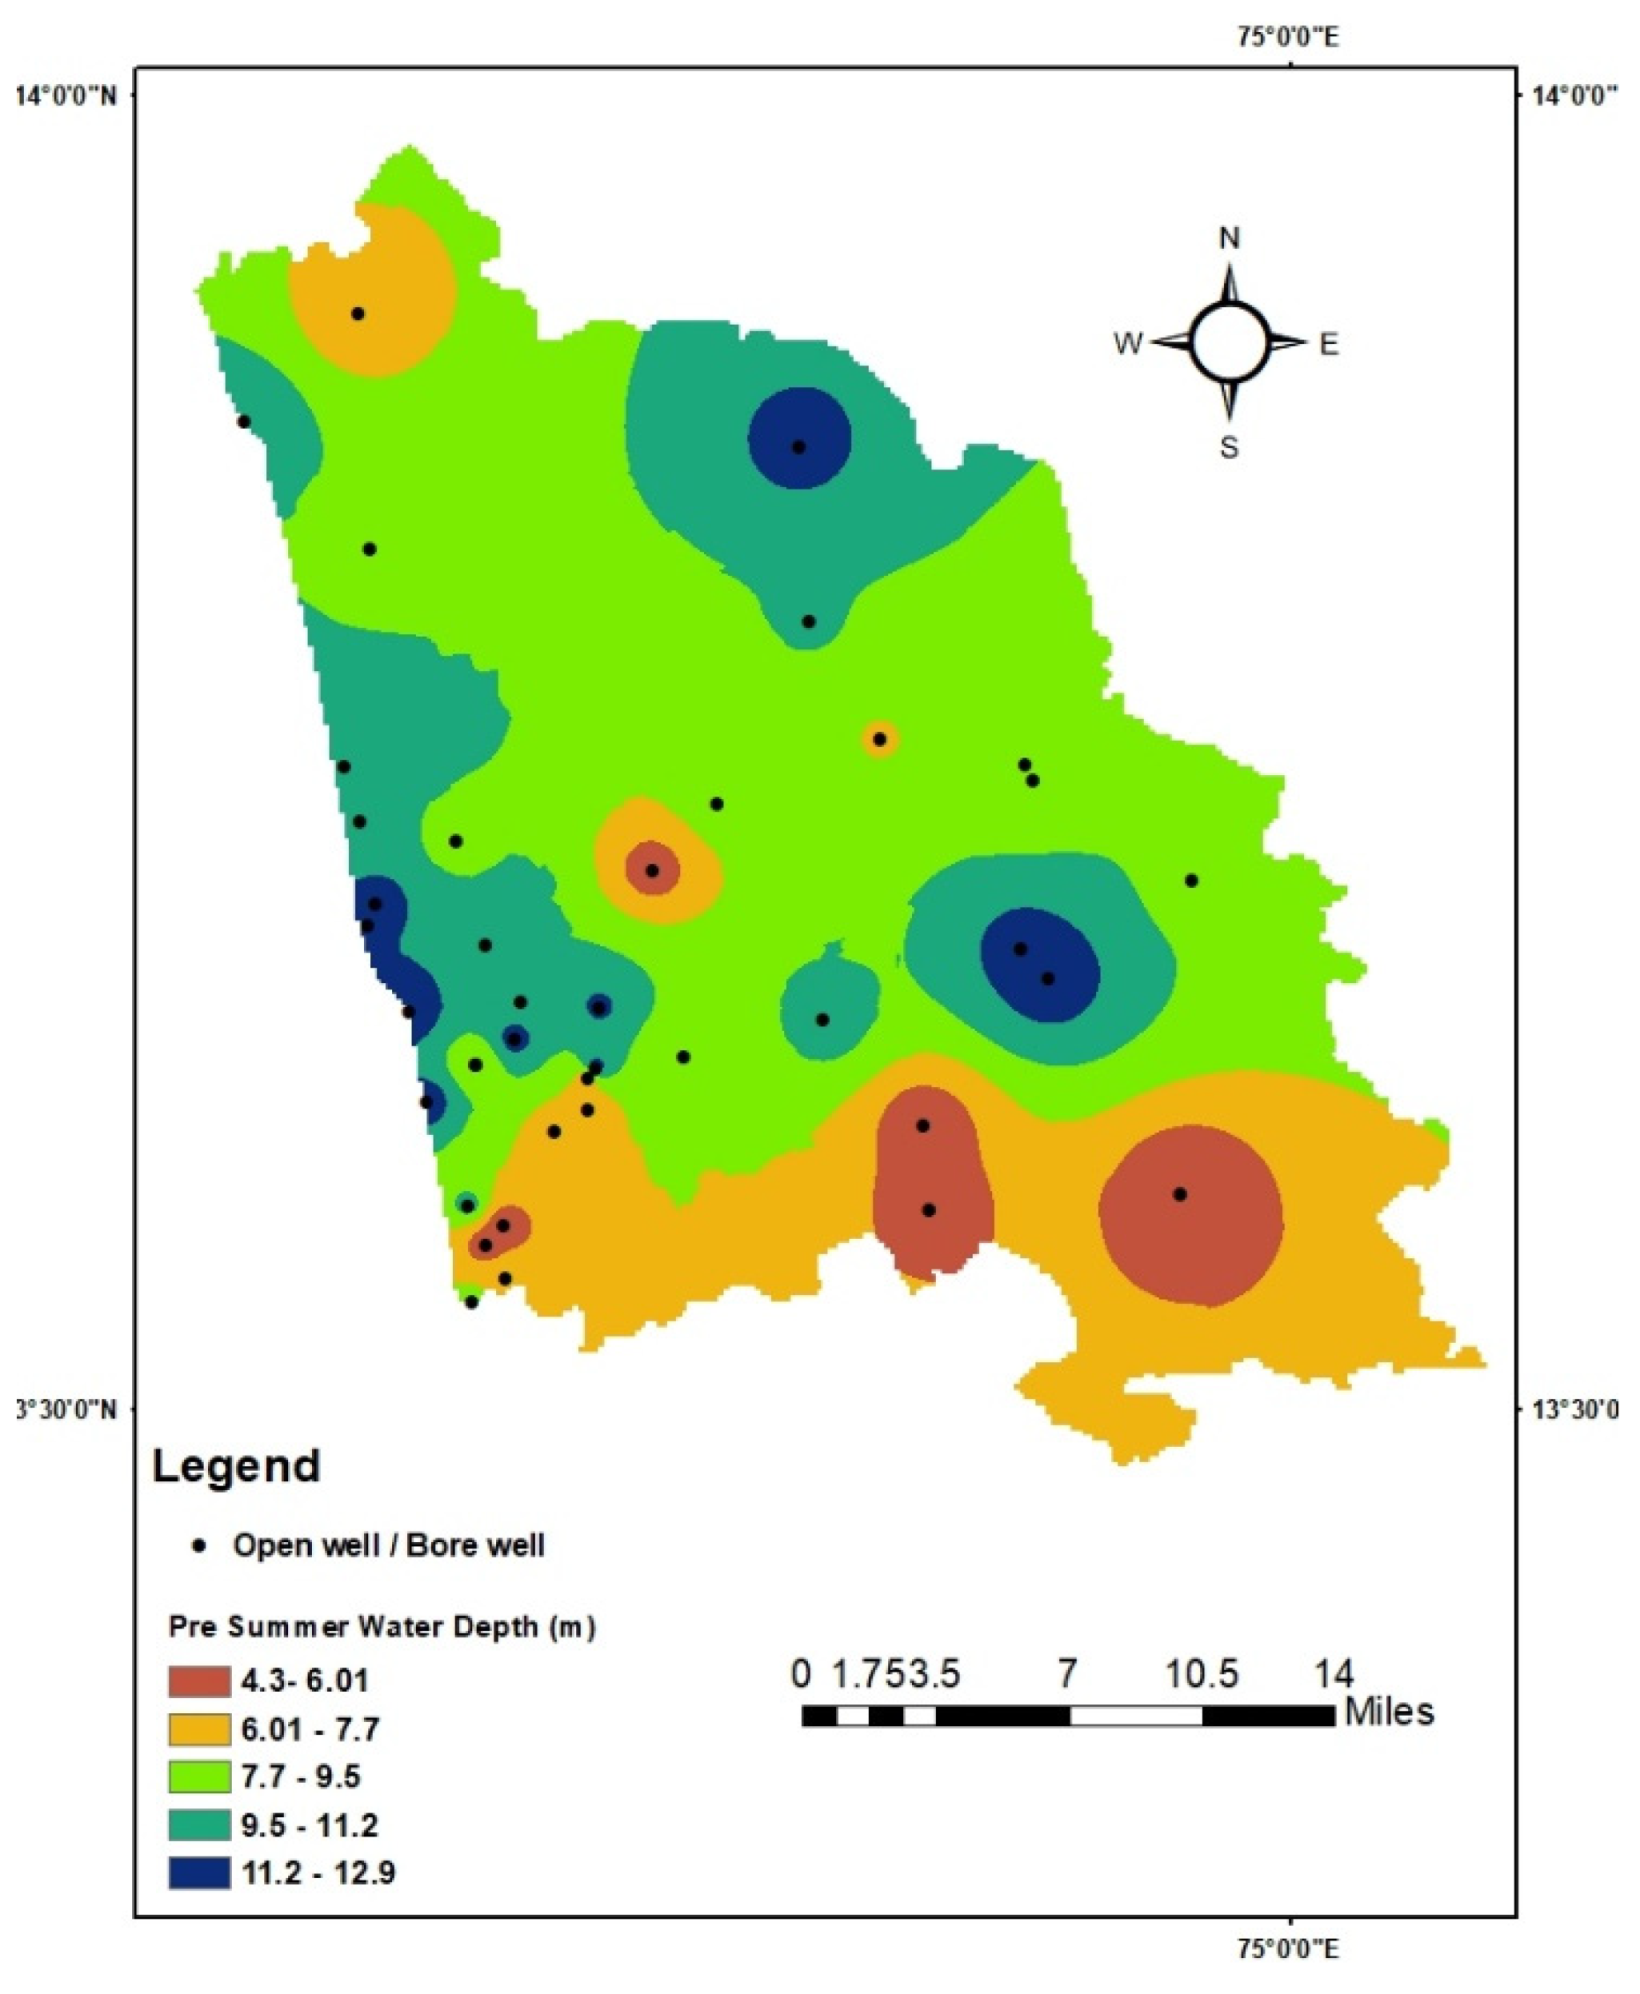
2. Study Area
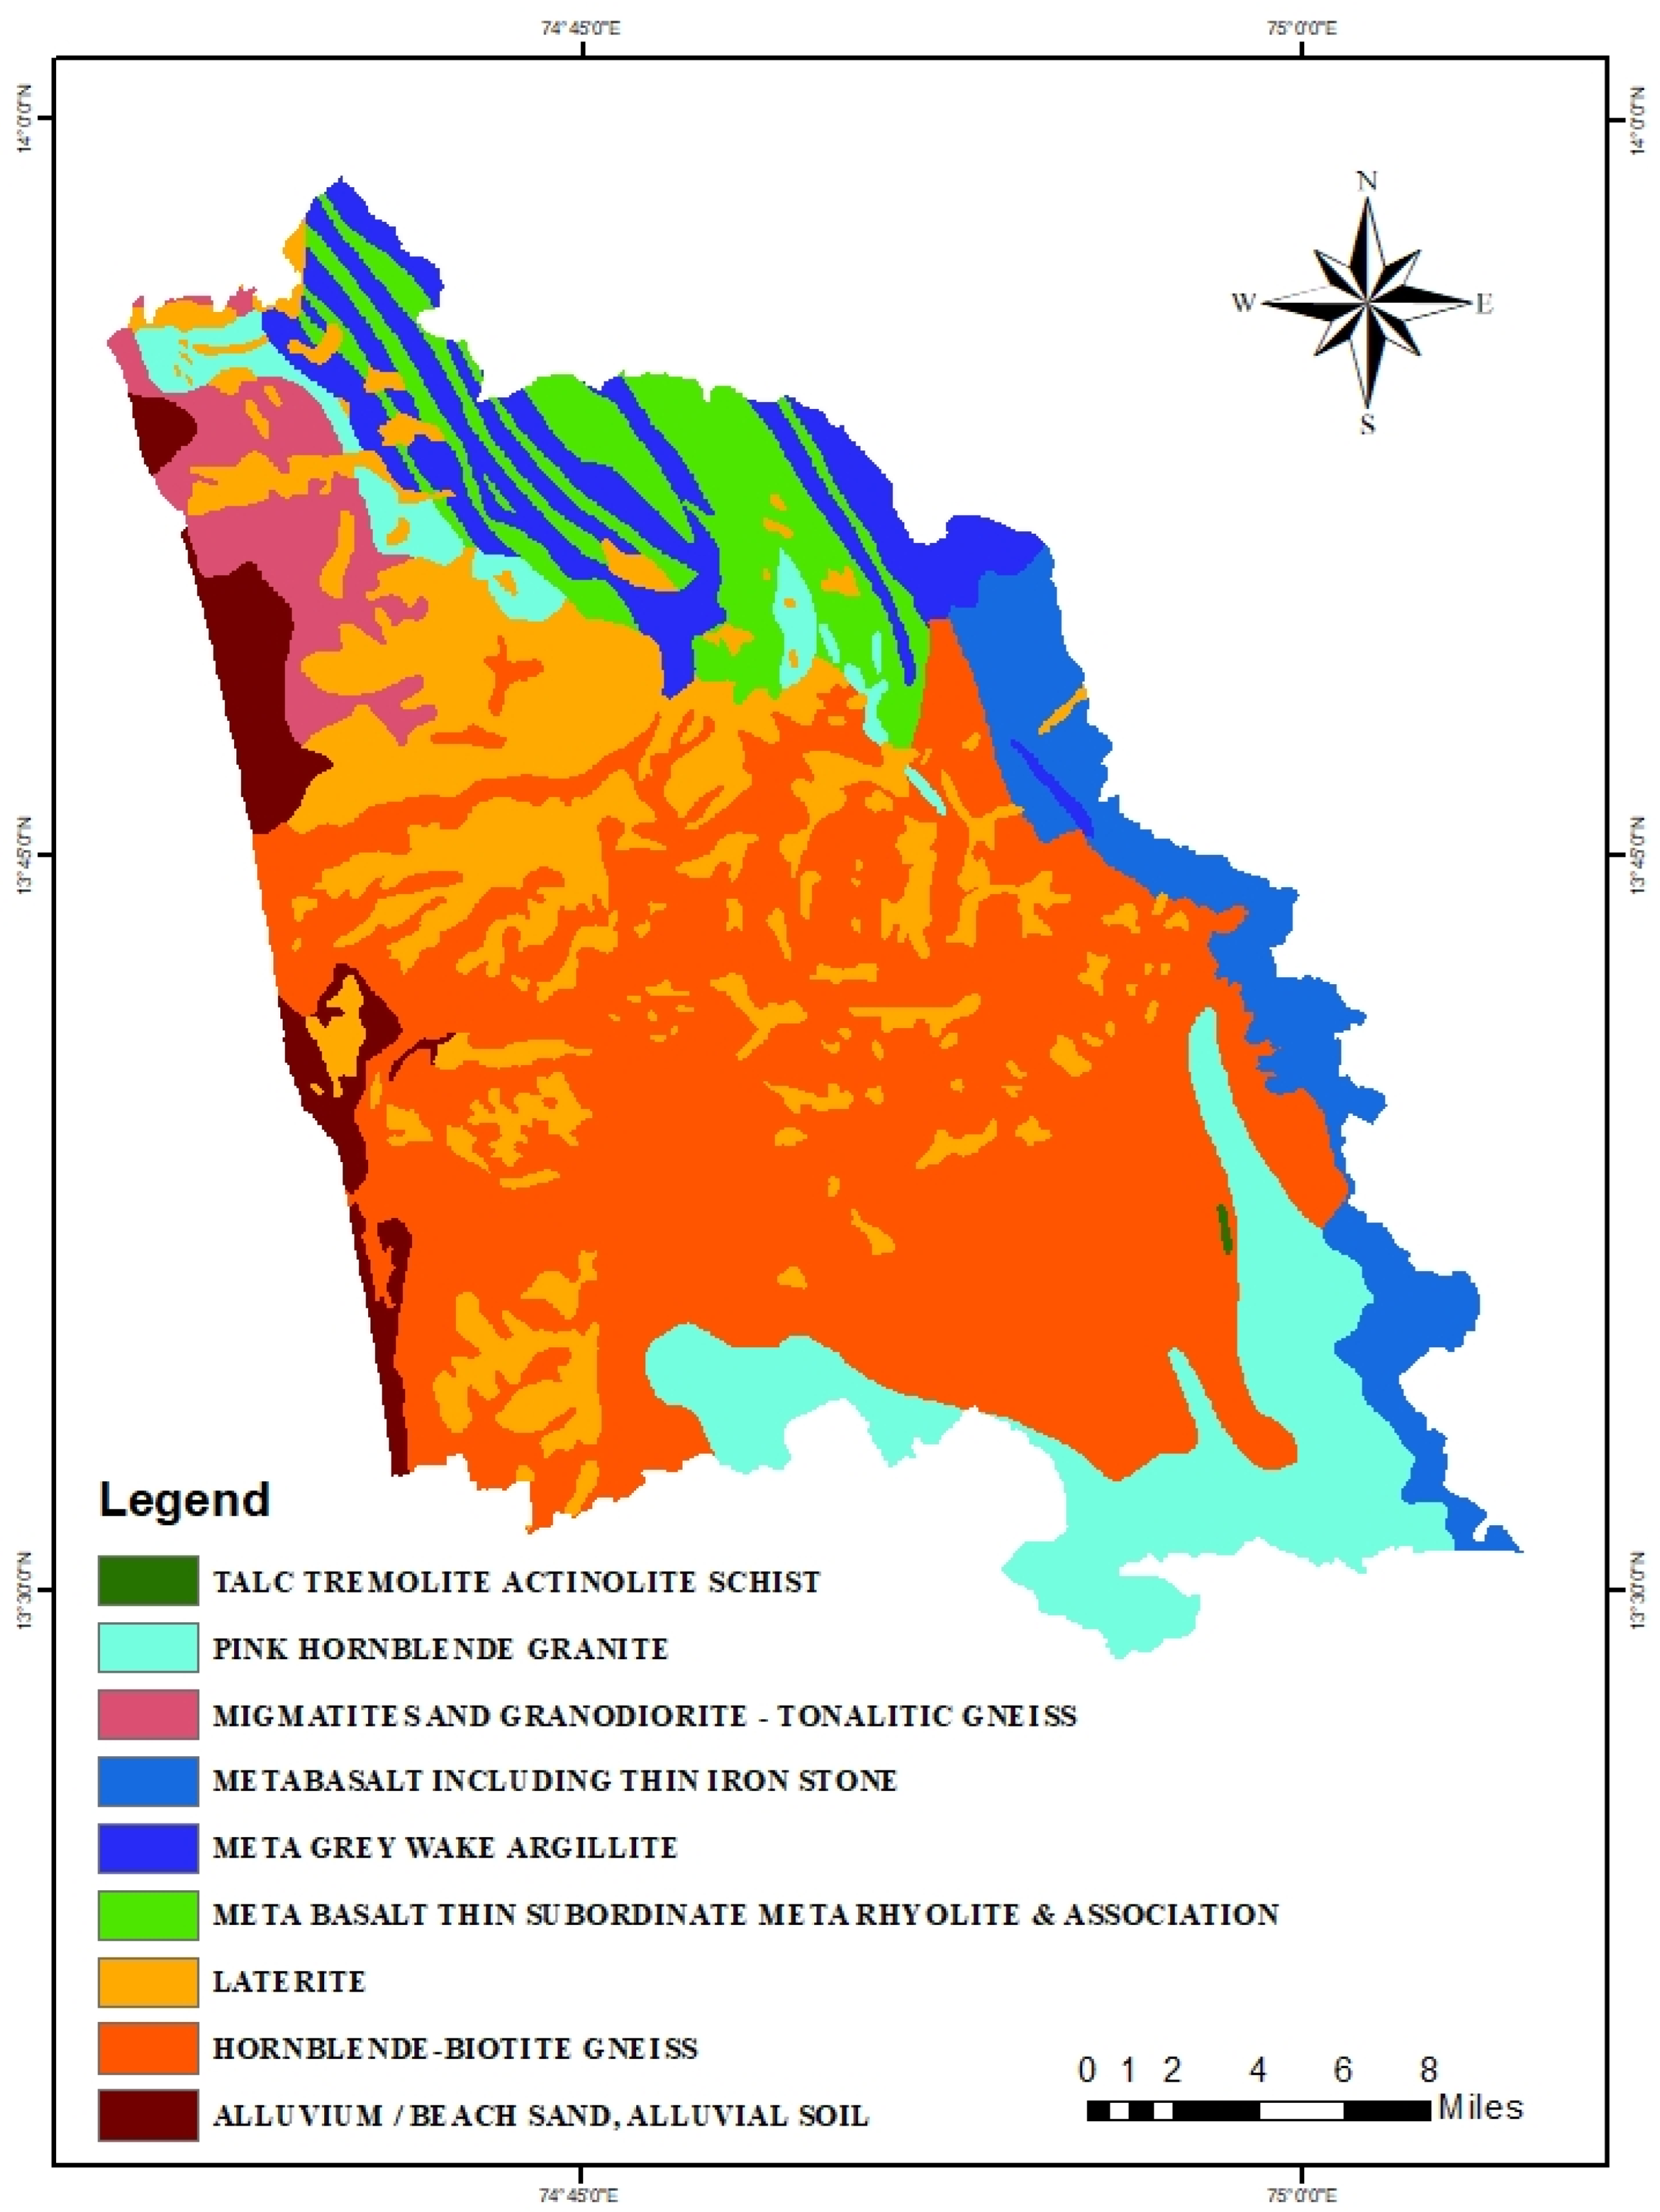
Geology
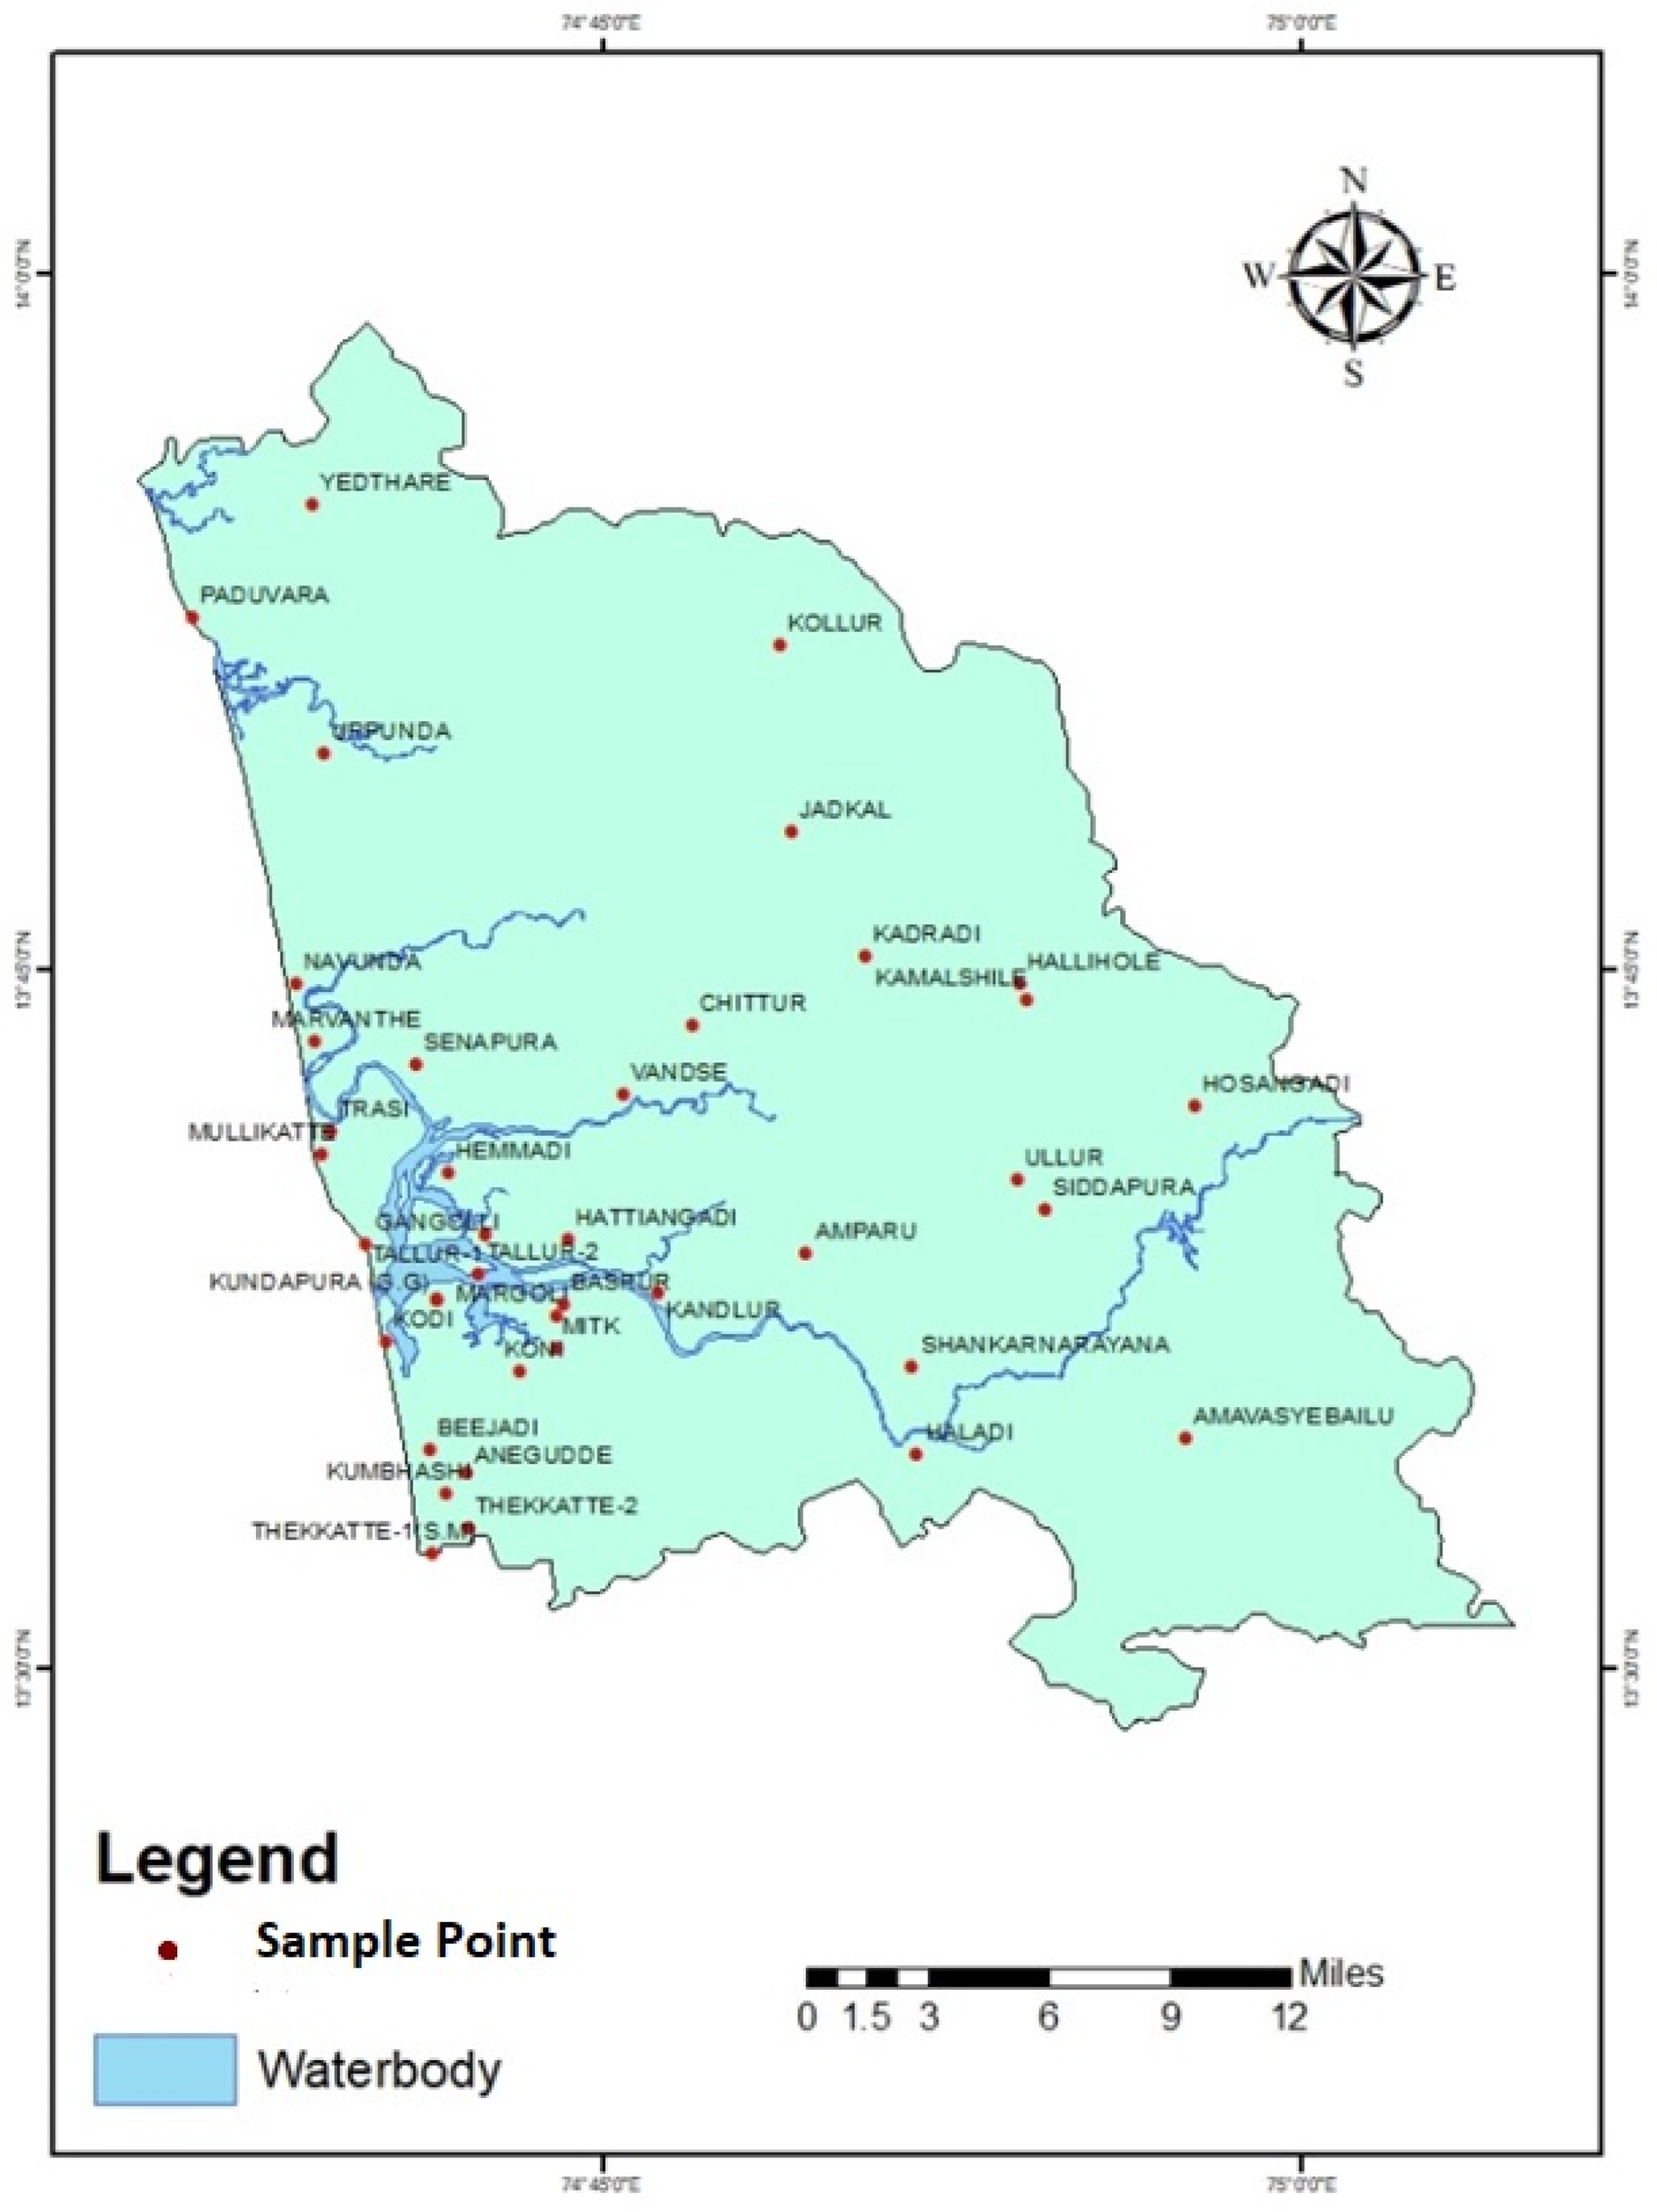
3. Sample Collection
4. Method & Methodology
5. WQI and Status
6. Result and Discussion
- ➢
- The regional research includes temporal details about inflows, outflows, and improvements storage system-wide, as well as in selected aquifer system sub-regions.
- ➢
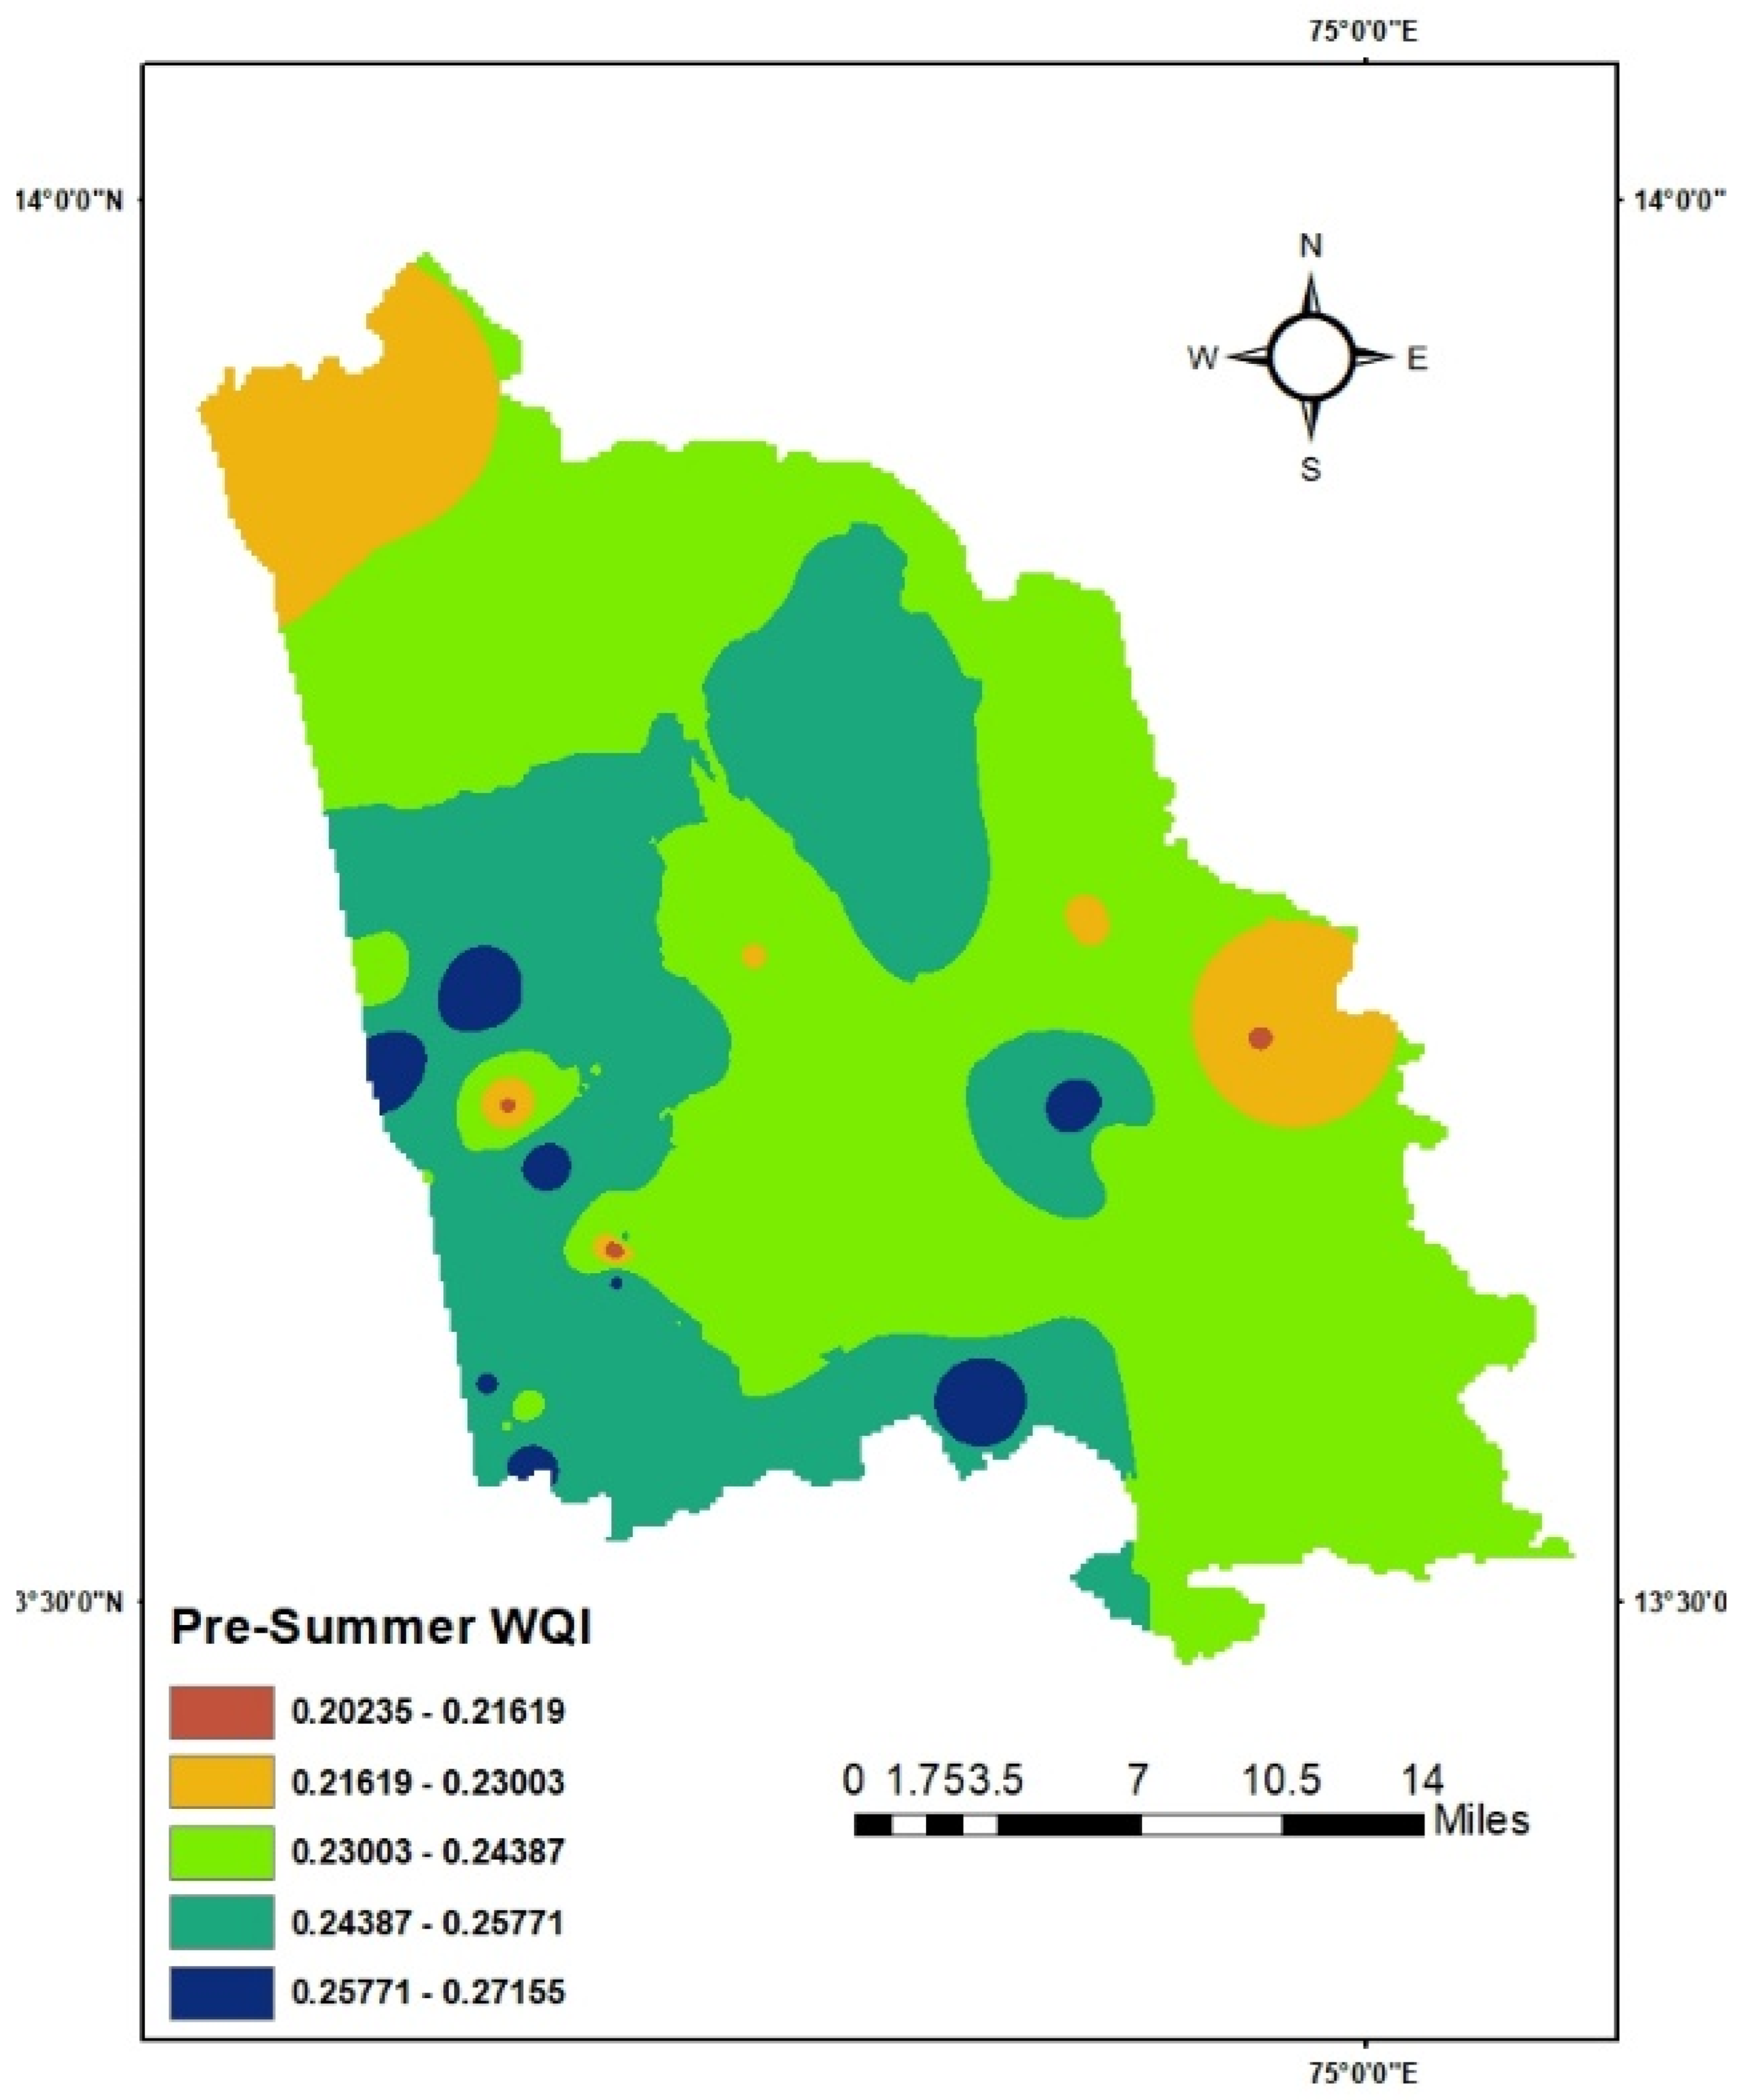
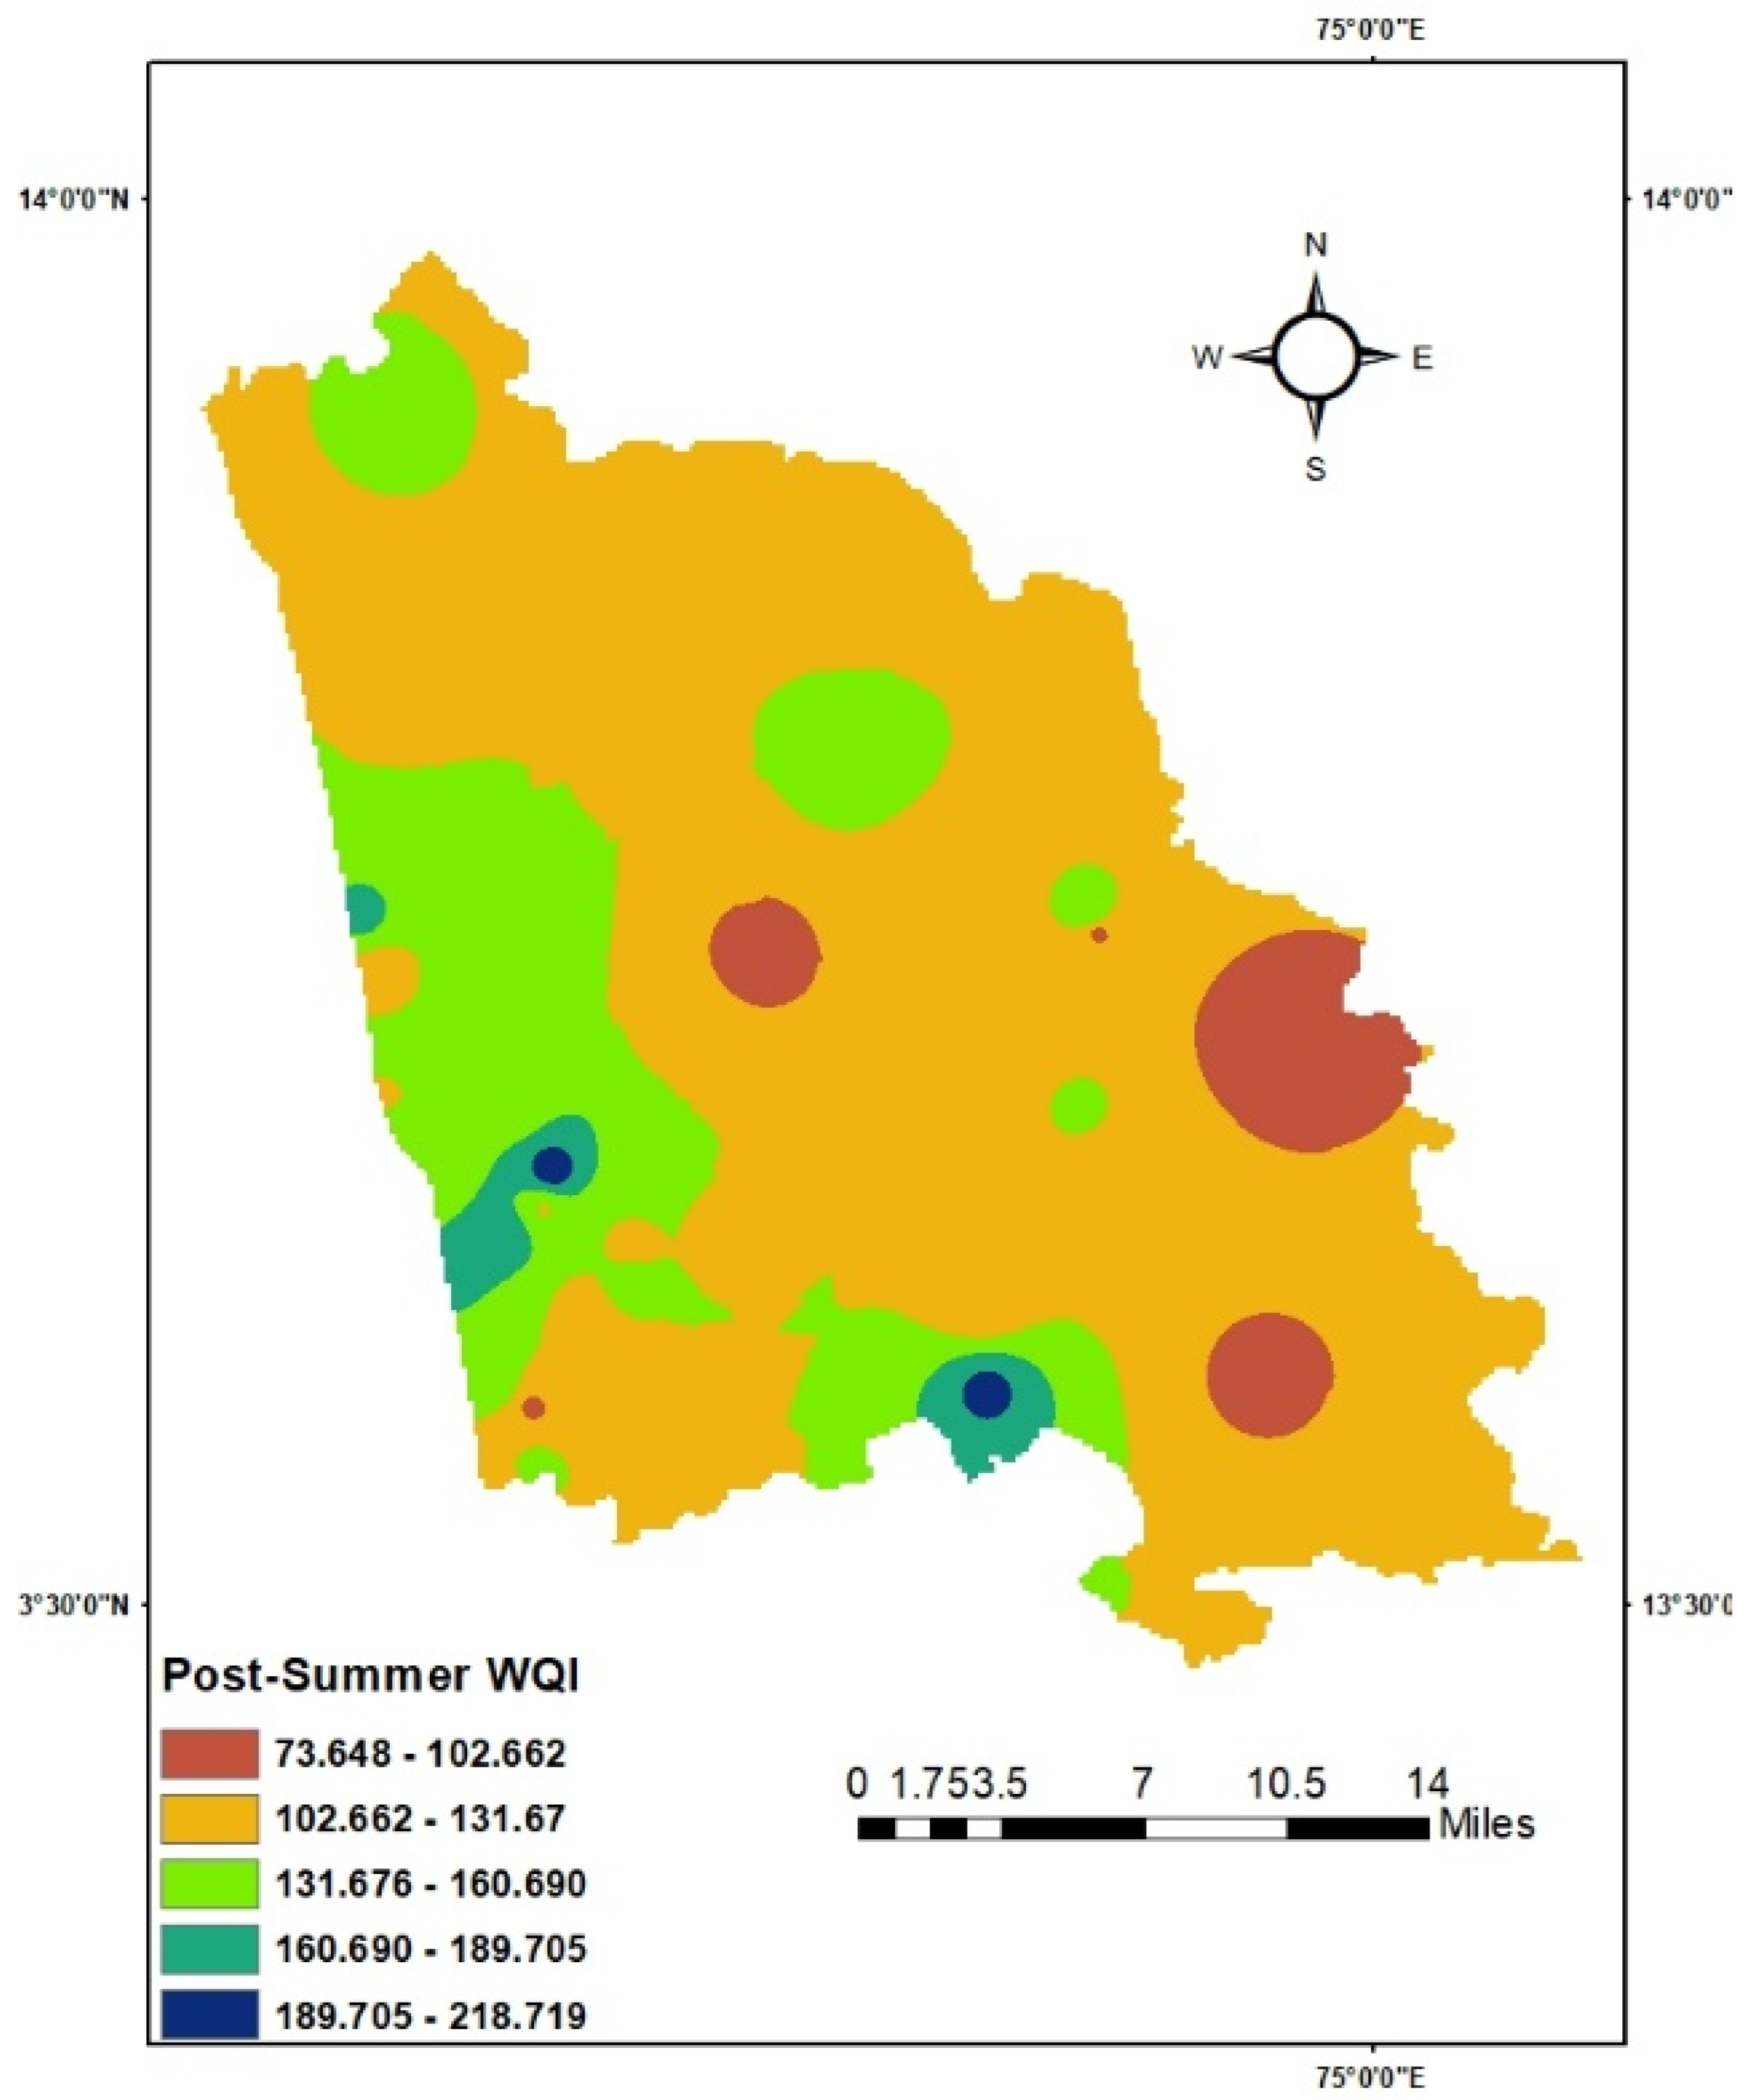
- According to water quality indices results from pre-summer, all location water samples are drinkable and all samples fell within the 0–25 range, which means the quality is outstanding, and can be used for drinking/potable, agriculture and industrial purposes. During the post-summer period, Hosangadi has a fair water status and can only be used for irrigation and industrial purposes. Locations Chittur, Anegudde, Kamalashile and Amavasyebailu indicate 84.43725, 92.67013, 94.69791 and 95.35414 values, respectively, suggesting that the following regions have a poor water status and water can only be used for irrigation. The remaining locations are classified as very poor to unfit for drinking, which means they cannot be used for irrigation or drinking. Before we could use these waters, they needed to be adequately handled.
- ➢
- The analysis of ground water samples from different criteria shows that ground water in the majority of the research area is chemically safe for drinking.
- ➢
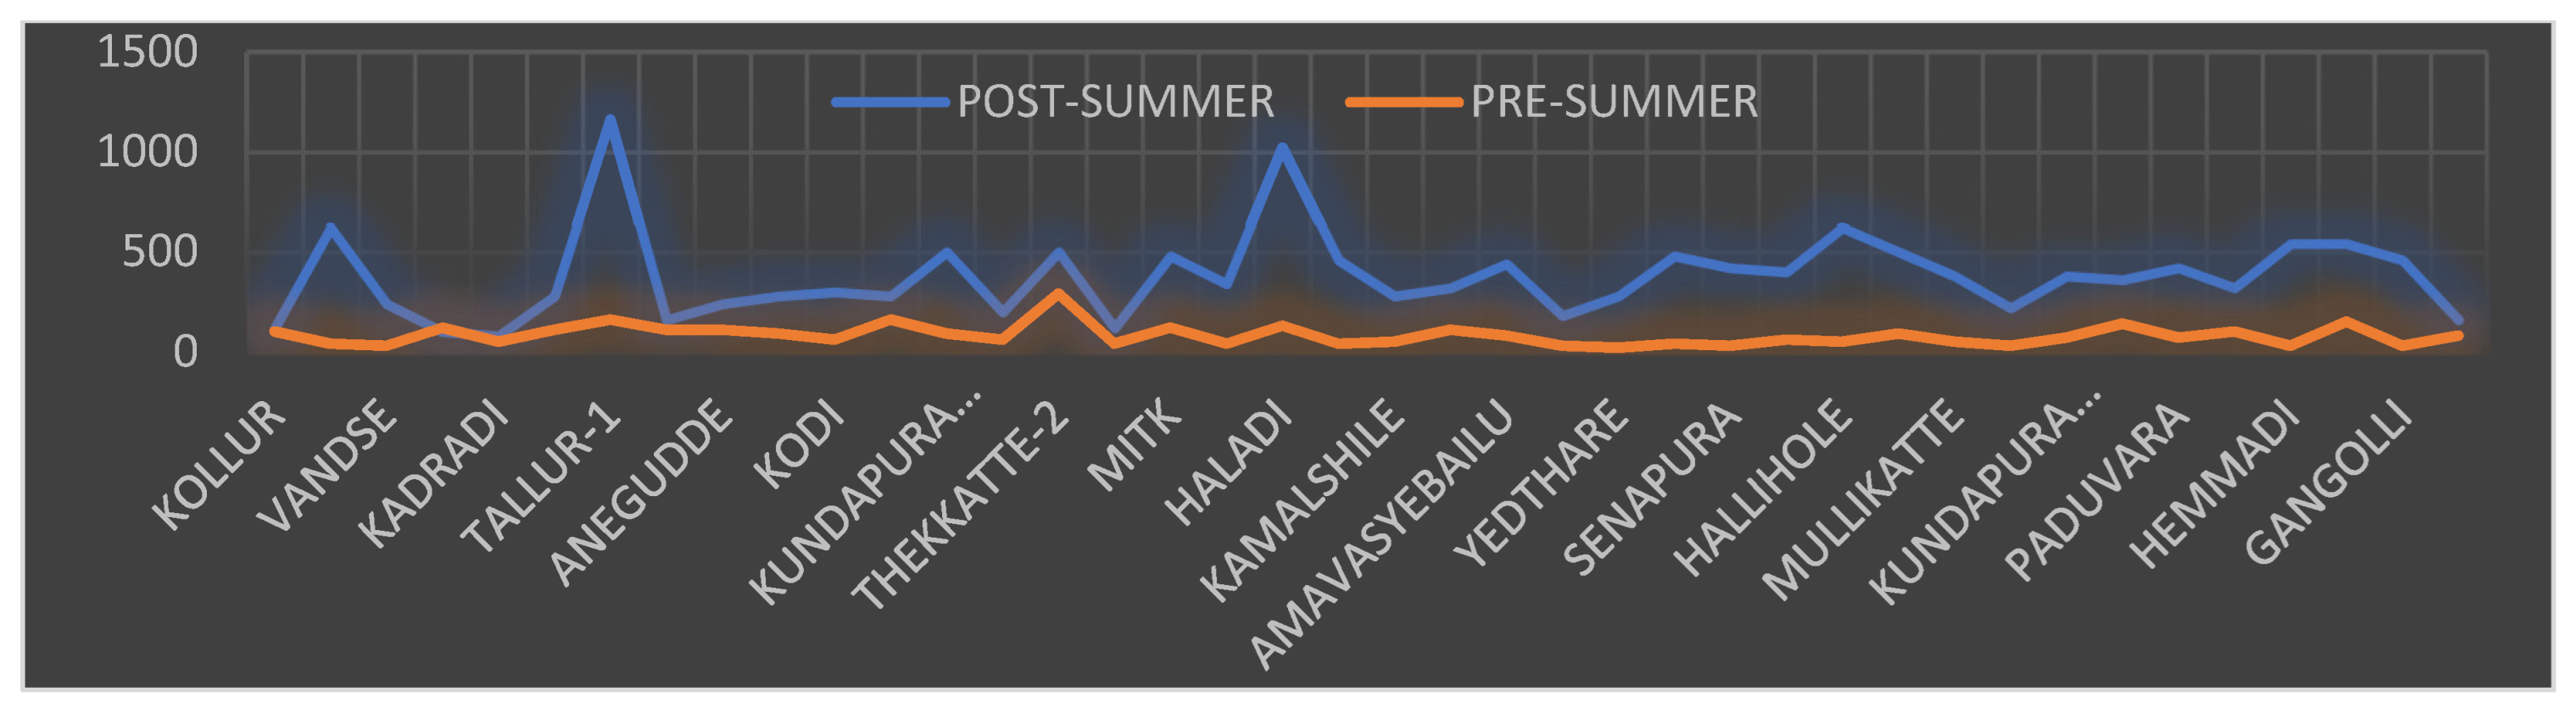
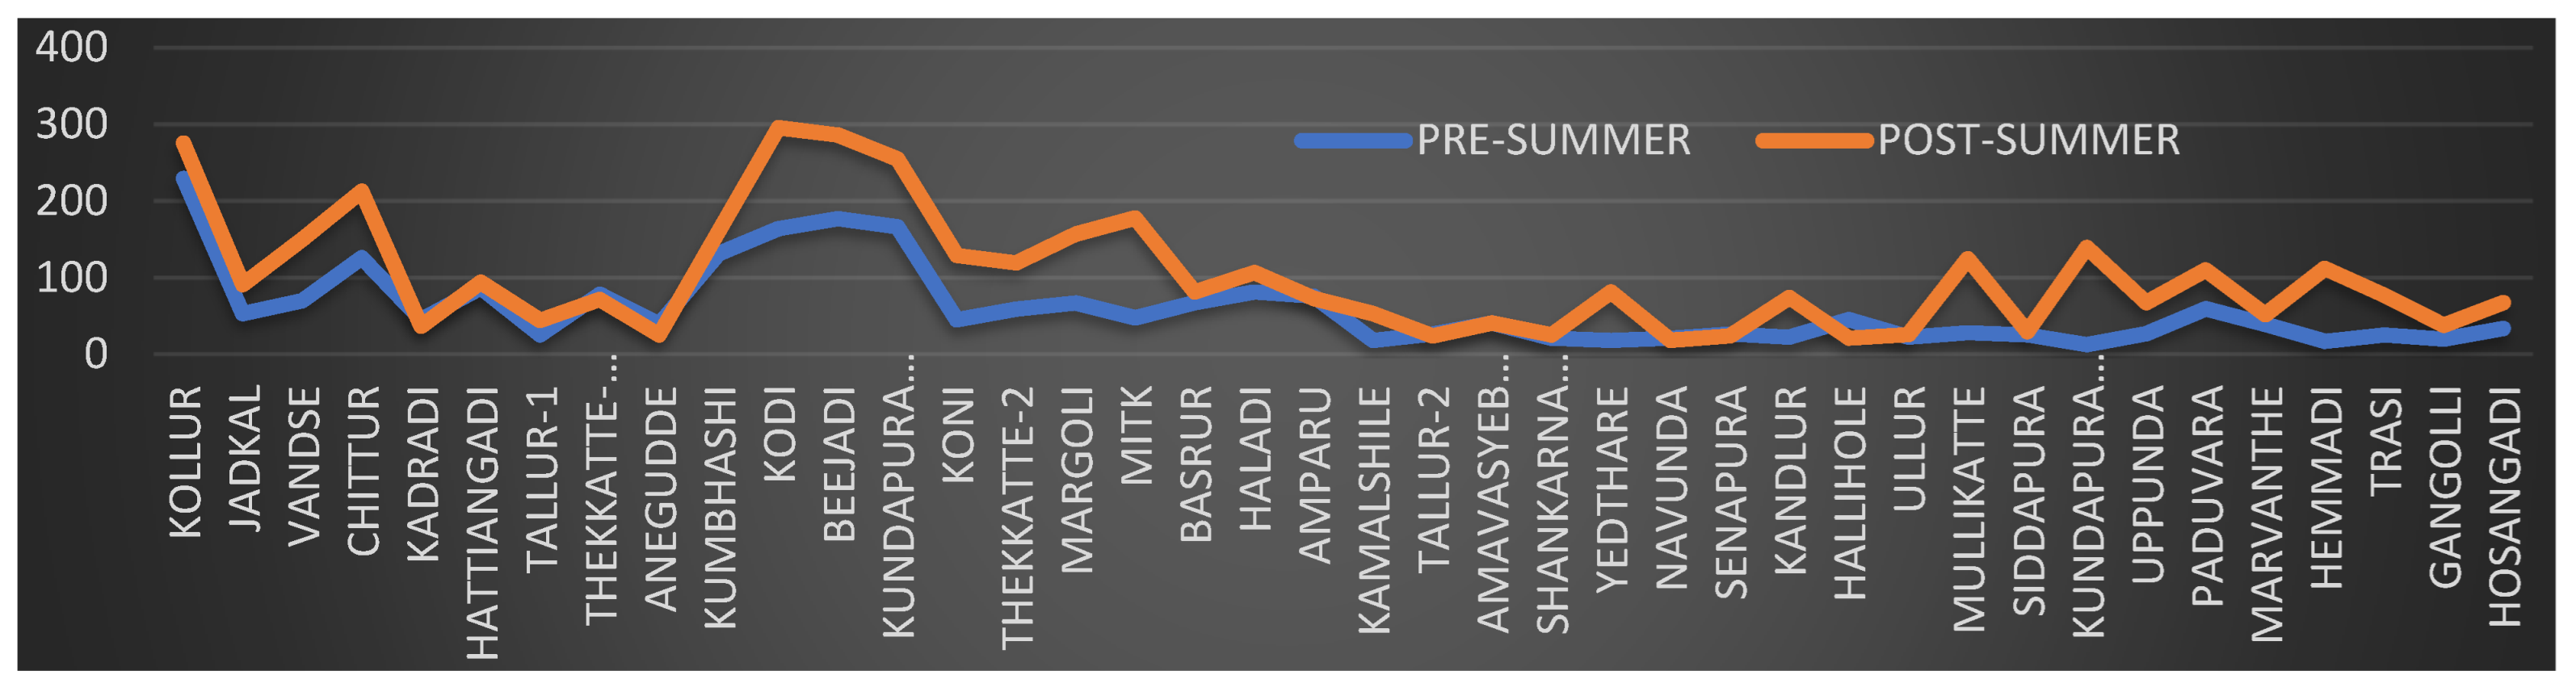
- Water samples contain low pH in some areas, such as Amavasyebailu and Ullur (these areas are geologically slopy and are covered with gneissic rocks), and high pH in MITK and Margoli (these areas near to the coast and water bodies), during the post-summer season.
- ➢
- Hardness was within the permissible limit in Kundapura region. Hence, water samples are considered as a soft water. Water with a high calcium content is unsuitable for washing or bathing and can cause gastro-intestinal diseases and stone formation.
- ➢
- TDS concentrations in Kundapura Taluk is within the potable range.
- ➢
- Alkalinity amounts were below reasonable limits in areas such as Maravante, Kundapura, Kodi, Beejadi and Hemmadi. These are the places near to the coast, where salinity intrusion is higher.
- ➢
- During the pre-summer season, the acid content of water is below the permitted level. High levels of acidity in drinking water cause dehydration and diarrhea, as well as secondary hyperthyroidism and bone degradation.
- ➢
- The dissolved oxygen concentration in all of the water samples is below the allowable range.
- ➢
- For water samples with a high COD content but low electrical conductivity and chloride content, there is a need to use methods such as reverse osmosis.
- ➢
- To purify the water, water purifying plants, such as lotus, yellow iris, dwarf cattail, water poppy, and Sagittarian montevidensis, can be planted in the vicinity of polluted water.
- ➢
- The results of this study will be used to predict the hydrologic reactions of the aquifer system to potential shifts in anthropogenic and natural pressures to the greatest degree possible.
- ➢
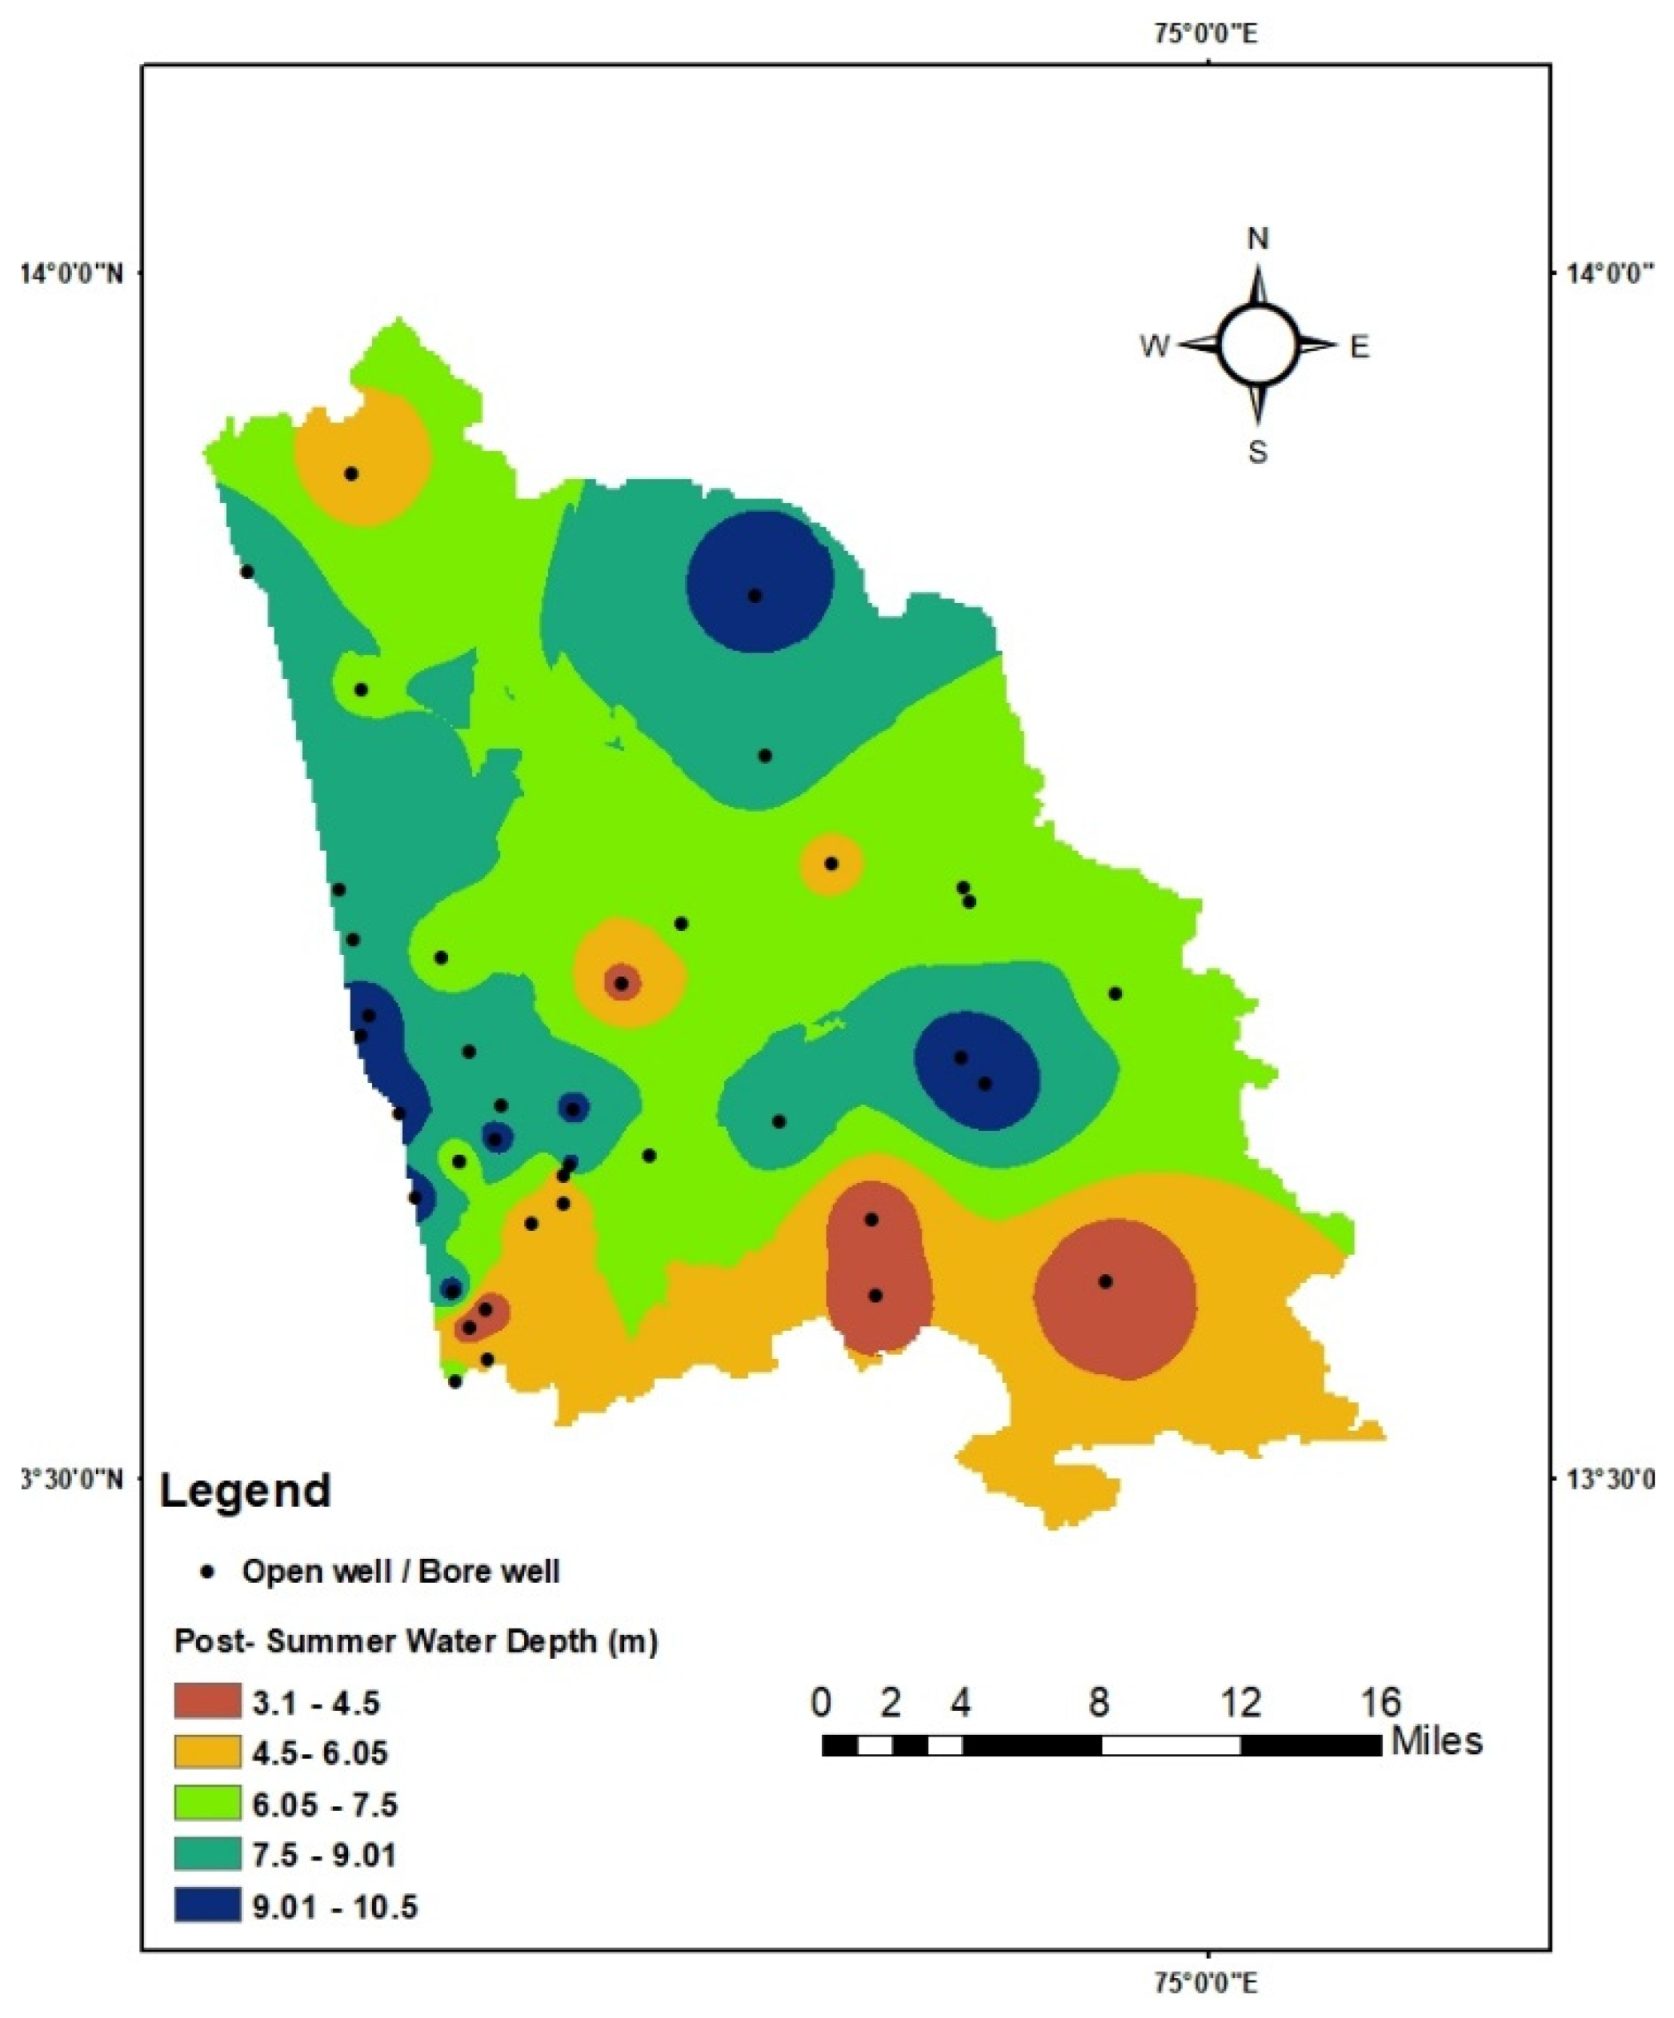
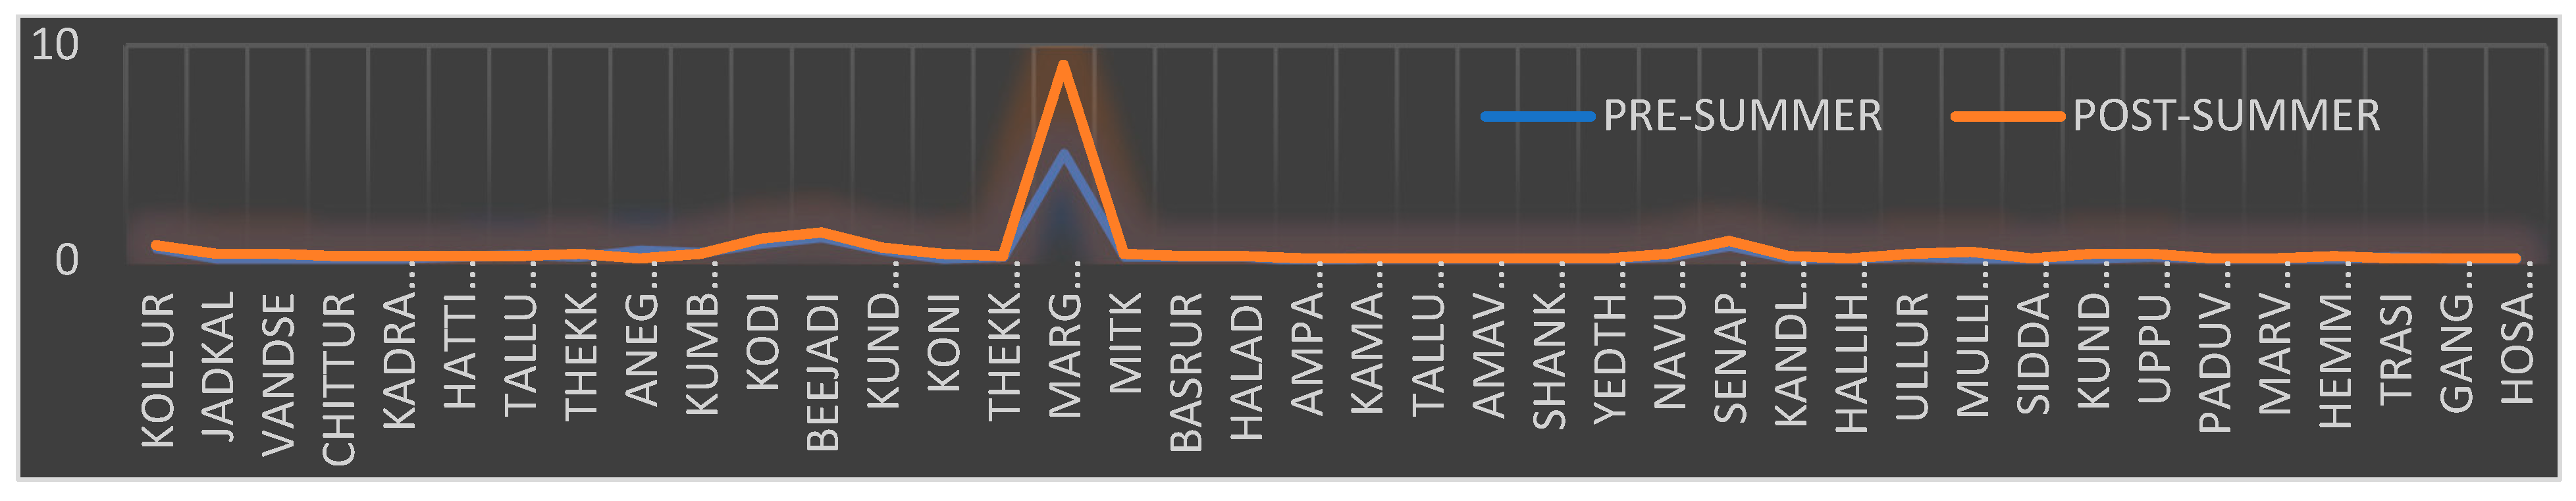
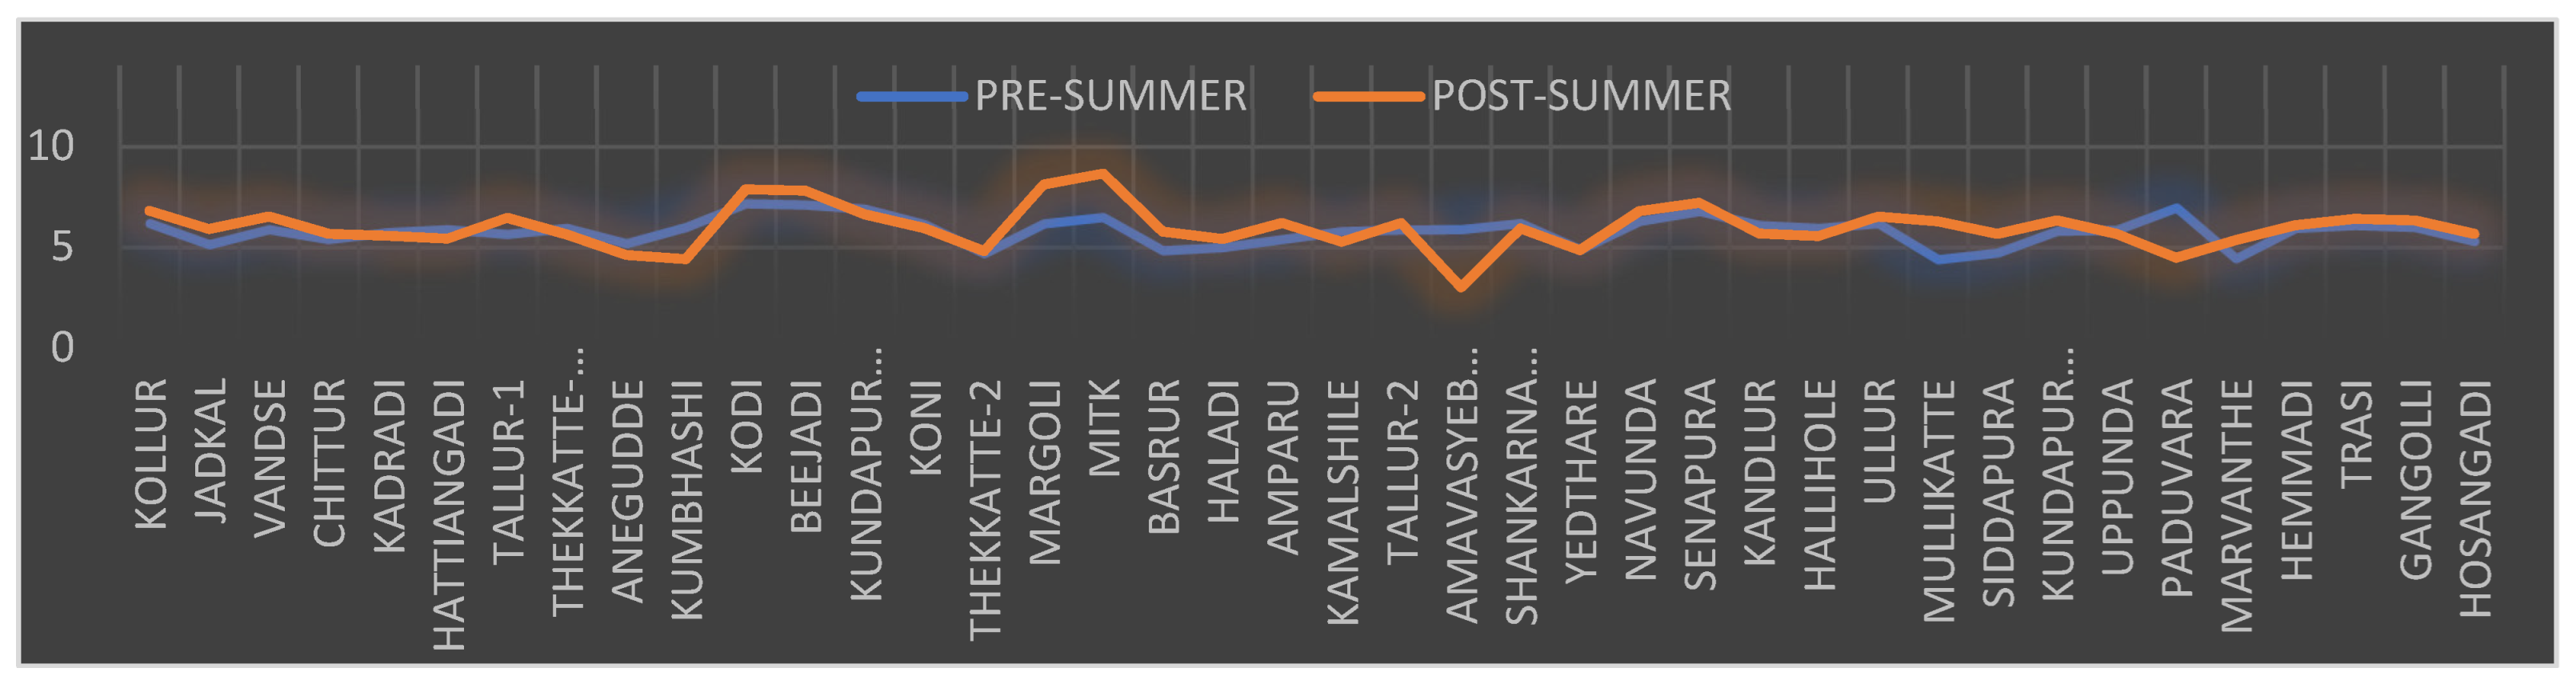
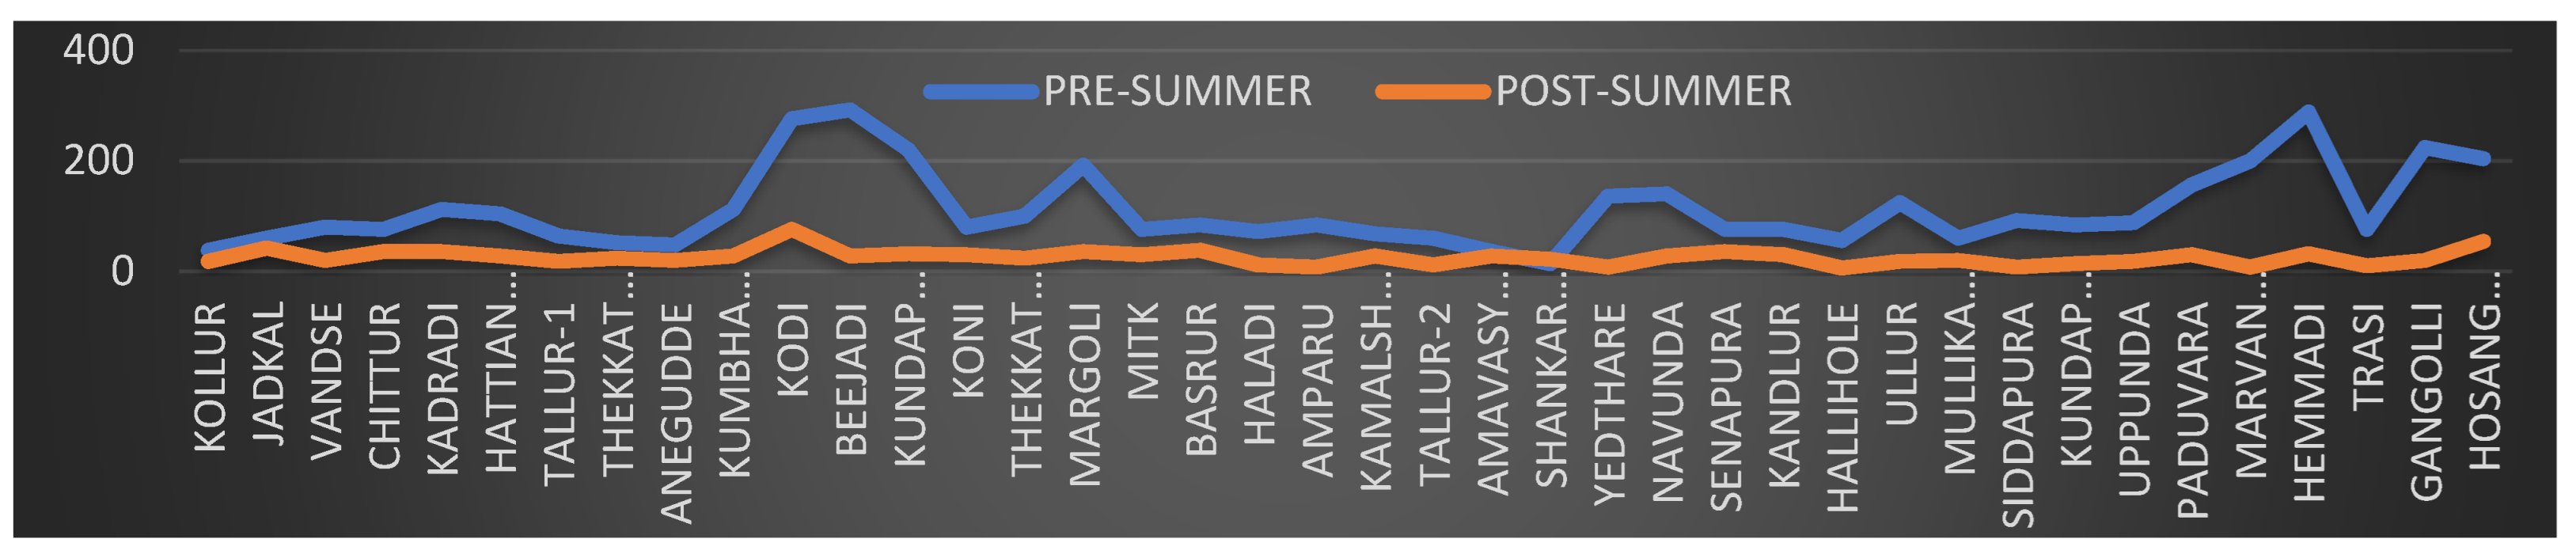
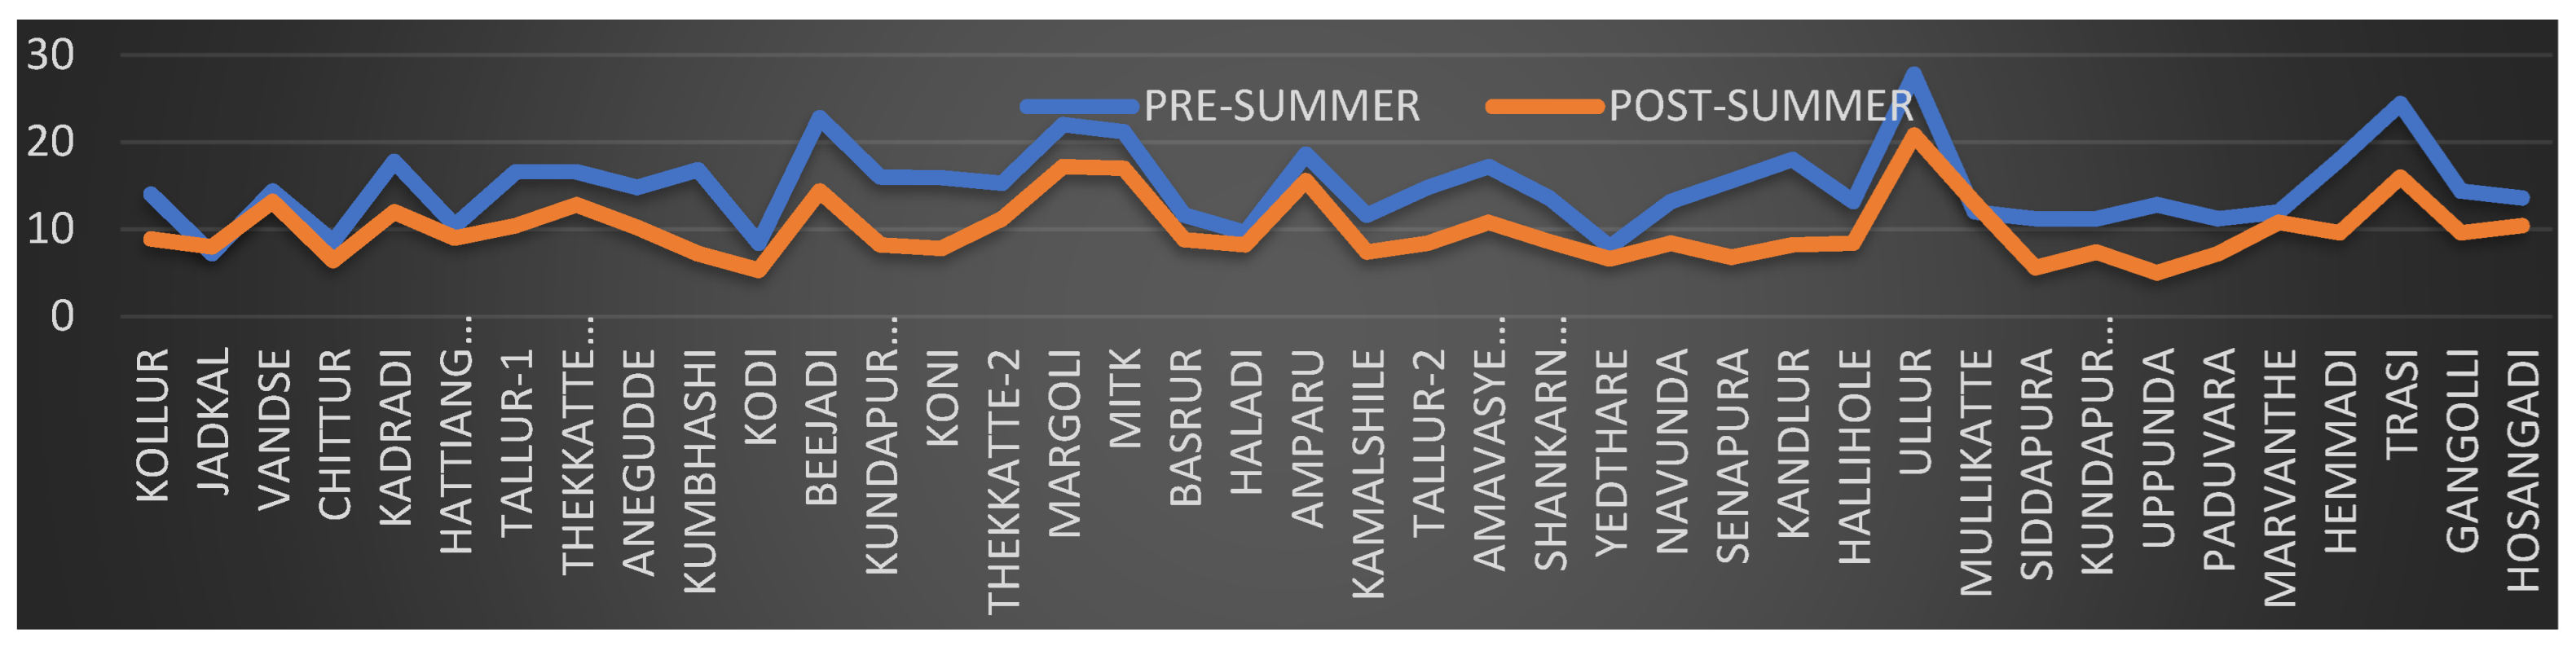
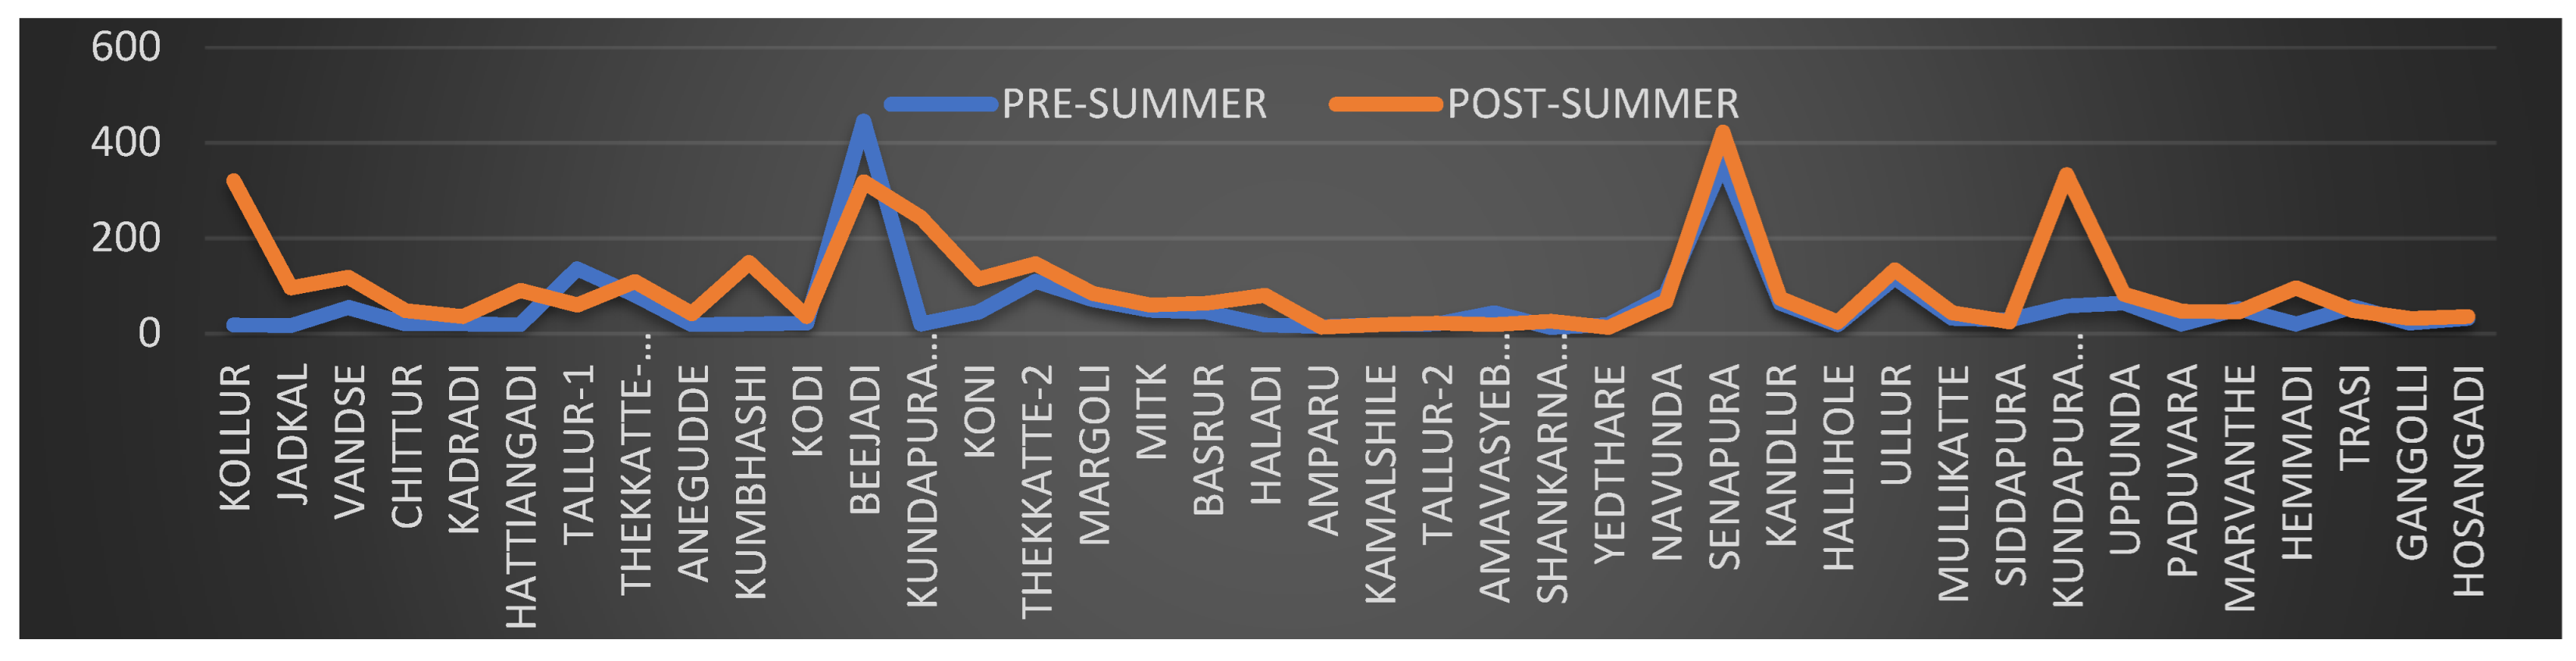
- Pre-summer and post-summer values vary for a number of physio-chemical parameters because of the cone of depression saltwater intrusion prevalent in Kundapura Taluk. The Kundapura coast experiences more saline intrusion in post-summer than in pre-summer, according to the present study. During the post-summer period, places such as Thrasi, Maravanthe, Gangolli and Kodi face more problems in drinking water. General control measures for saltwater intrusion are used to: keep outdoor watering to a minimum; to increase fresh ground water; to refill, for example, by using surface ponds to reduce surface runoff and to improve infiltration rates; to create wells that do not penetrate deeper than needed below sea level; to multiply well systems; to pump wells alternative; and to size pumps at lower pumping rates. Kundapura Taluk belongs to a coastal region, where high salinity is observed due to the severe tidal effects of saltwater intrusion. High saline comes near to coast of Kundapura Taluk. In such areas, saline soils have a detrimental impact on urban structures, primarily by causing land subsidence, corrosion and adversely affecting the quality of ground water.
7. Conclusions
Author Contributions
Funding
Institutional Review Board Statement
Informed Consent Statement
Data Availability Statement
Acknowledgments
Conflicts of Interest
References and Note
- Bilaspur, G.W.B.O.; District, C. Government of India Ministy of Water Resources Central Ground Water Board. 2011. Available online: http://cgwb.gov.in/District_Profile/Chhatisgarh/Bilaspur.pdf (accessed on 19 July 2022).
- Gupta, N.; Pankaj, P.; Jakir, H. Effect of physicochemical and biological parameters on the quality of river water of Narmada, Madhya Pradesh, India. Water Sci. 2017, 31, 11–23. [Google Scholar] [CrossRef]
- Hadian, M.S.D.; Azy, F.N.; Krismadiyanti, I.; Arfani, D.L.; Sofyan, E.T.; Prayogi, T.E. Groundwater quality assessment for suitable drinking and agricultural irrigation using physico-chemical water analysis in the Rancaekek-Jatinangor District, West Java, Indonesia. In Proceedings of the 6th International Conference on Environmental Science and Technology, Belgrade, Serbia, 21–25 October 2020. [Google Scholar]
- Available online: https://cdn.s3waas.gov.in/s36bc24fc1ab650b25b4114e93a98f1eba/uploads/2018/07/2018073059.pdf (accessed on 25 July 2018).
- Specification, I.S.D.W. Drinking water (FAD 25: Drinking Water). Bureauo of Indian Standards Manak Bhavan, 9 Bahadur shah zafar marg New Delhi 110002. 2012, IS10500, 2.
- Soni, P.; Sangita, C.; Dilip, D. Comparative Analysis of Physical Parameters of Various Water Ecosystems in Washim. Indian Stream Res. J. 2016, 6, 1–8. [Google Scholar]
- Qureshimatva, U.M.; Maurya, R.R.; Gamit, S.B.; Patel, R.D.; Solanki, H.A.J.J.E.A.T. Determination of physico-chemical parameters and water quality index (Wqi) of Chandlodia Lake, Ahmedabad, Gujarat, India. J. Envrion. Anal Toxic. 2015, 5, 2161-0525.1000288. [Google Scholar]
- Rahmanian, N.; Ali, S.H.B.; Homayoonfard, M.; Ali, N.J.; Rehan, M.; Sadef, Y.; Nizami, A.S. Analysis of physiochemical parameters to evaluate the drinking water quality in the State of Perak, Malaysia. J. Chem. 2015, 2015, 716125. [Google Scholar] [CrossRef] [Green Version]
- Ravikumar, P.; Somashekar, R.K. A geochemical assessment of coastal groundwater quality in the Varahi river basin, Udupi District, Karnataka State, India. Arab. J. Geosci. 2013, 6, 1855–1870. [Google Scholar]
- Rezaei, A.; Hassani, H.; Jabbari, N. Evaluation of groundwater quality and assessment of pollution indices for heavy metals in North of Isfahan Province, Iran. Sustain. Water Resour. Manag. 2019, 5, 491–512. [Google Scholar] [CrossRef]
- Saleem, M.; Hussain, A.; Mahmood, G.; Waseem, M. Hydrogeochemical assessment of groundwater in shallow aquifer of greater Noida region, Uttar Pradesh (UP), India. Appl. Water Sci. 2018, 8, 186. [Google Scholar] [CrossRef] [Green Version]
- Sarada, P. Assessment of Ground Water Quality of the First Industrial-Residential Confluence Area of Visakhapatnam. UGC Minor Research Project For Teachers Under XII Plan (2012–2017). Available online: https://stjosephsvizag.com/wp-content/uploads/2019/02/Sarada-PROJECT-REPORT.pdf (accessed on 19 July 2022).
- Singh, P.; Kumar, A.; Mishra, S.J.E. Development, & Sustainability. Performance evaluation of conservation plan for freshwater lakes in India through a scoring methodology. Environ. Dev. Sustain. 2021, 23, 3787–3810. [Google Scholar]
- Sinha, D.; Saxena, R. Statistical Assessment of Underground Drinking Water Contamination and Effect of Monsoon at Hasanpur, J.P. Nagar(Uttar Pradesh, India). J. Environ. Sci. Eng. 2006, 48, 157–164. [Google Scholar]
- Kumar, K.V.; Kumara, V. Species diversity of birds in mangroves of Kundapura, Udupi District, Karnataka, Southwest Coast of India. J. For. Res. 2014, 25, 661–666. [Google Scholar] [CrossRef]
- APH. A Standard Method for the Examination of Water and Wastewater, 21st ed.; American Public Health Association; American Water Works Association; Water Environment Federation: Washington, DC, USA, 2005. [Google Scholar]


| SI.NO | PLACES | LATITUDE | LONGITUDE | SOURCE | SOIL TYPE | WATER DEPTH (m) | |
|---|---|---|---|---|---|---|---|
| PRE-SUMMER | POST-SUMMER | ||||||
| 1 | KOLLUR | 13.8665 | 74.813 | open well | sandy clay | 11.75 | 10 |
| 2 | JADKAL | 13.799876 | 74.817013 | open well | sandy clay loam | 9.6 | 8.5 |
| 3 | VANDSE | 13.70524 | 74.75719 | open well | sandy clay loam | 5.01 | 4.1 |
| 4 | CHITTUR | 13.73014 | 74.7817 | open well | sandy clay loam | 8.5 | 6.2 |
| 5 | KADRADI | 13.75483 | 74.843887 | open well | sandy clay loam | 7.6 | 5.6 |
| 6 | HATTIANGADI | 13.65289 | 74.7369 | open well | sandy loam | 11.6 | 9.6 |
| 7 | TALLUR-1 | 13.65509 | 74.70763 | open well | sandy loam | 10.4 | 8.5 |
| 8 | THEKKATTE-1 (S.M) | 13.540604 | 74.688387 | open well | loamy sand | 8.5 | 7 |
| 9 | ANEGUDDE | 13.56994 | 74.70046 | open well | sandy loam | 4.6 | 3.2 |
| 10 | KUMBHASHI | 13.562632 | 74.693702 | open well | sandy loam | 4.9 | 3.4 |
| 11 | KODI | 13.616993 | 74.671623 | open well | Sand | 12.5 | 10.5 |
| 12 | BEEJADI | 13.577616 | 74.68716 | open well | loamy sand | 10.2 | 10.2 |
| 13 | KUNDAPURA (B.W) | 13.631596 | 74.68995 | Bore well | sandy clay loam | 6.52 | 5.1 |
| 14 | KONI | 13.60621 | 74.71979 | open well | sandy loam | 6.5 | 4.9 |
| 15 | THEKKATTE-2 | 13.54983 | 74.701332 | open well | sandy loam | 7.32 | 5.2 |
| 16 | MARGOLI | 13.626152 | 74.732728 | open well | sandy clay loam | 5.96 | 4.2 |
| 17 | MITK | 13.614228 | 74.732674 | open well | sandy clay loam | 5.8 | 4.6 |
| 18 | BASRUR | 13.62998 | 74.735341 | open well | sandy clay loam | 12.5 | 10.5 |
| 19 | HALADI | 13.576383 | 74.862319 | open well | sandy clay loam | 5.2 | 3.9 |
| 20 | AMPARU | 13.64811 | 74.82247 | open well | sandy clay loam | 10.42 | 8.9 |
| 21 | KAMALSHILE | 13.73911 | 74.90186 | open well | sandy clay loam | 8.5 | 6.9 |
| 22 | TALLUR-2 | 13.640716 | 74.704691 | open well | sandy clay loam | 12.1 | 10.2 |
| 23 | AMAVASYEBAILU | 13.5819 | 74.95825 | open well | sandy clay loam | 4.3 | 3.1 |
| 24 | SHANKARNARAYANA | 13.60791 | 74.86056 | open well | sandy clay loam | 4.65 | 3.2 |
| 25 | YEDTHARE | 13.917189 | 74.645556 | open well | loamy sand | 6.5 | 5.1 |
| 26 | NAVUNDA | 13.74479 | 74.63994 | open well | loamy sand | 10.5 | 8.5 |
| 27 | SENAPURA | 13.716274 | 74.682627 | open well | sandy loam | 8.5 | 6.2 |
| 28 | KANDLUR | 13.634377 | 74.769131 | open well | sandy clay loam | 8.06 | 7.1 |
| 29 | HALLIHOLE | 13.745338 | 74.899109 | open well | sandy clay loam | 8.6 | 6.6 |
| 30 | ULLUR | 13.675 | 74.89787 | open well | sandy clay loam | 12 | 10 |
| 31 | MULLIKATTE | 13.684047 | 74.648954 | open well | Sand | 11.2 | 9.5 |
| 32 | SIDDAPURA | 13.66431 | 74.90796 | open well | sandy clay loam | 12.5 | 10.5 |
| 33 | KUNDAPURA (G.G) | 13.631596 | 74.689995 | open well | sandy clay loam | 10 | 8.5 |
| 34 | UPPUNDA | 13.827688 | 74.649576 | open well | Sand | 9 | 7.5 |
| 35 | PADUVARA | 13.876185 | 74.602434 | open well | loamy sand | 10.5 | 8.5 |
| 36 | MARVANTHE | 13.723891 | 74.646048 | open well | Sand | 9.57 | 8.65 |
| 37 | HEMMADI | 13.676908 | 74.694092 | open well | sandy loam | 9.5 | 7.6 |
| 38 | TRASI | 13.692335 | 74.652399 | open well | Sand | 11.95 | 9.65 |
| 39 | GANGOLLI | 13.65149 | 74.664803 | open well | Sand | 12.9 | 10.4 |
| 40 | HOSANGADI | 13.701 | 74.9623 | open well | Clay | 9 | 7.3 |
| SI.NO | PARAMETERS | DRINKING WATER QUALITY STANDARD | ANALYTICAL METHODS |
|---|---|---|---|
| 1 | pH value | 6.5–8.5 | pH meter |
| 2 | TDS (total dissolved solids) | 500–2000 mg/L | TDS meter |
| 3 | Total alkalinity | 200–600 mg/L | Titration |
| 4 | Hardness | 200–600 mg/L | Titration |
| 5 | Chloride | 250–1000 mg/L | Titration |
| 6 | Acidity | <200 mg/L | Titration |
| 7 | Dissolved oxygen | 4–30 | Titration |
| 8 | COD (chemical oxygen demand) | <250 mg/L | Titration |
| 9 | Electrical conductivity | 97–1378 mmhos | Electrometric conductivity meter |
| SI.NO | PLACES | PH | EC | ACIDITY | ALKALINITY | DO | TOTAL HARDNESS | TDS | COD | CHLORIDE |
|---|---|---|---|---|---|---|---|---|---|---|
| 1 | KOLLUR | 6.2 | 0.6 | 100 | 38 | 14 | 229.6 | 18 | 947.2 | 16.49 |
| 2 | JADKAL | 5.15 | 0.1 | 40 | 60 | 7.2 | 53.2 | 17 | 972.8 | 16.51 |
| 3 | VANDSE | 5.89 | 0.1 | 30 | 80 | 14.4 | 70 | 55 | 886.4 | 18.49 |
| 4 | CHITTUR | 5.4 | 0.1 | 120 | 76 | 8.6 | 126 | 21 | 726.4 | 17.99 |
| 5 | KADRADI | 5.75 | 0.1 | 50 | 112 | 17.8 | 44.8 | 20 | 995.2 | 17.49 |
| 6 | HATTIANGADI | 5.9 | 0.2 | 110 | 104 | 10.4 | 86.8 | 19 | 950.4 | 22.49 |
| 7 | TALLUR-1 | 5.65 | 0.3 | 160 | 64 | 16.6 | 25.2 | 136 | 924.8 | 31.99 |
| 8 | THEKKATTE-1 (S.M) | 5.96 | 0.2 | 110 | 52 | 16.6 | 78.4 | 81 | 838.4 | 33.98 |
| 9 | ANEGUDDE | 5.2 | 0.5 | 110 | 48 | 14.8 | 39.2 | 19 | 689.6 | 21.49 |
| 10 | KUMBHASHI | 6 | 0.4 | 90 | 112 | 16.8 | 131.6 | 20 | 905.6 | 20.49 |
| 11 | KODI | 7.18 | 0.8 | 60 | 276 | 8.4 | 163.8 | 22 | 1318.4 | 23.49 |
| 12 | BEEJADI | 7.12 | 1.1 | 160 | 292 | 22.8 | 177 | 445 | 648 | 85.47 |
| 13 | KUNDAPURA (B.W) | 6.91 | 0.5 | 90 | 220 | 16 | 166.6 | 20 | 800 | 15.49 |
| 14 | KONI | 6.14 | 0.1 | 60 | 80 | 15.9 | 44.8 | 45 | 873.6 | 15.49 |
| 15 | THEKKATTE-2 | 4.7 | 0.2 | 290 | 100 | 15.3 | 58.8 | 110 | 854.4 | 43.48 |
| 16 | MARGOLI | 6.18 | 5 | 40 | 192 | 22 | 67 | 71 | 433.6 | 30.49 |
| 17 | MITK | 6.5 | 0.2 | 120 | 76 | 21.2 | 47.6 | 49 | 982.4 | 18.99 |
| 18 | BASRUR | 4.85 | 0.2 | 40 | 84 | 11.6 | 67.2 | 45 | 864 | 16.49 |
| 19 | HALADI | 5 | 0.2 | 130 | 72 | 9.6 | 81.2 | 18 | 1232 | 23.91 |
| 20 | AMPARU | 5.4 | 0 | 40 | 84 | 18.6 | 75.6 | 15 | 716.8 | 22.49 |
| 21 | KAMALSHILE | 5.8 | 0.1 | 50 | 68 | 11.6 | 18.2 | 19 | 681.6 | 13.49 |
| 22 | TALLUR-2 | 5.87 | 0.1 | 110 | 60 | 14.8 | 26.6 | 20 | 966.4 | 21.49 |
| 23 | AMAVASYEBAILU | 5.9 | 0.1 | 80 | 36 | 17.2 | 40.6 | 44 | 611.2 | 21.49 |
| 24 | SHANKARNARAYANA | 6.2 | 0.1 | 30 | 14 | 13.6 | 21 | 13 | 672 | 28.99 |
| 25 | YEDTHARE | 4.9 | 0.1 | 20 | 136 | 8 | 18.2 | 19 | 720 | 18.99 |
| 26 | NAVUNDA | 6.3 | 0.2 | 40 | 140 | 13.2 | 21 | 82 | 864 | 24.99 |
| 27 | SENAPURA | 6.8 | 0.7 | 30 | 76 | 15.6 | 26.6 | 357 | 601.6 | 78.97 |
| 28 | KANDLUR | 6.1 | 0.1 | 60 | 76 | 18 | 22.4 | 64 | 688 | 21.99 |
| 29 | HALLIHOLE | 5.95 | 0.1 | 50 | 56 | 13.2 | 44.8 | 19 | 675.2 | 16.99 |
| 30 | ULLUR | 6.2 | 0.2 | 90 | 124 | 27.8 | 22.4 | 117 | 880 | 28.99 |
| 31 | MULLIKATTE | 4.4 | 0.1 | 50 | 60 | 12 | 28 | 32 | 944 | 30.5 |
| 32 | SIDDAPURA | 4.74 | 0.1 | 30 | 92 | 11.2 | 25.2 | 29 | 780.8 | 25.49 |
| 33 | KUNDAPURA (G.G) | 5.82 | 0.1 | 70 | 84 | 11.2 | 12.6 | 58 | 1136 | 27.49 |
| 34 | UPPUNDA | 5.86 | 0.2 | 140 | 88 | 12.8 | 26.8 | 64 | 665 | 30.49 |
| 35 | PADUVARA | 6.97 | 0.1 | 70 | 156 | 11.2 | 59.4 | 20 | 697.6 | 27.49 |
| 36 | MARVANTHE | 4.45 | 0.1 | 100 | 200 | 12 | 39.2 | 52 | 745.6 | 30.49 |
| 37 | HEMMADI | 5.95 | 0.1 | 30 | 288 | 18 | 16.8 | 20 | 694.4 | 13.99 |
| 38 | TRASI | 6.1 | 0.2 | 150 | 76 | 24.4 | 25.2 | 56 | 950.4 | 27.99 |
| 39 | GANGOLLI | 6.01 | 0.1 | 30 | 224 | 14.4 | 19.6 | 22 | 1020.8 | 32.99 |
| 40 | HOSANGADI | 5.31 | 0.1 | 80 | 204 | 13.6 | 33.6 | 32 | 630.4 | 16.49 |
| SI.NO | PLACES | PH | EC | ACIDITY | ALKALINITY | DO | TOTAL HARDNESS | TDS | COD | CHLORIDE |
|---|---|---|---|---|---|---|---|---|---|---|
| 1 | KOLLUR | 6.8 | 0.7 | 120 | 18 | 8.9 | 275.8 | 320 | 1014.4 | 39.98 |
| 2 | JADKAL | 5.89 | 0.3 | 620 | 42 | 8 | 91 | 96 | 1059.2 | 11.99 |
| 3 | VANDSE | 6.52 | 0.3 | 240 | 20 | 13.2 | 149.8 | 118 | 896 | 8.99 |
| 4 | CHITTUR | 5.65 | 0.2 | 100 | 36 | 6.4 | 212.8 | 48 | 806.4 | 13.9 |
| 5 | KADRADI | 5.56 | 0.2 | 80 | 36 | 12 | 36.4 | 36 | 1190.4 | 9.99 |
| 6 | HATTIANGADI | 5.41 | 0.2 | 280 | 28 | 9 | 93.8 | 91 | 1503.2 | 10.99 |
| 7 | TALLUR-1 | 6.45 | 0.2 | 1160 | 18 | 10.4 | 44 | 60 | 1244.8 | 16.99 |
| 8 | THEKKATTE-1(S.M) | 5.62 | 0.3 | 160 | 24 | 12.8 | 71.4 | 109 | 1078.4 | 6.99 |
| 9 | ANEGUDDE | 4.6 | 0.1 | 240 | 20 | 10.2 | 25.2 | 42 | 864 | 5.99 |
| 10 | KUMBHASHI | 4.4 | 0.3 | 280 | 28 | 7.2 | 161 | 149 | 1068.8 | 17.99 |
| 11 | KODI | 7.86 | 1 | 300 | 76 | 5.3 | 295.6 | 36 | 1504 | 16.99 |
| 12 | BEEJADI | 7.8 | 1.3 | 280 | 28 | 14.4 | 286 | 318 | 1302.4 | 4.99 |
| 13 | KUNDAPURA (B.W) | 6.62 | 0.6 | 500 | 32 | 8.2 | 254.8 | 243 | 982.4 | 19.99 |
| 14 | KONI | 5.94 | 0.3 | 200 | 30 | 7.8 | 128.8 | 114 | 912 | 12.99 |
| 15 | THEKKATTE-2 | 4.8 | 0.2 | 500 | 24 | 11.2 | 119 | 146 | 1142.4 | 18.99 |
| 16 | MARGOLI | 8.1 | 9.1 | 120 | 36 | 17.2 | 156.8 | 84 | 1187.2 | 3.99 |
| 17 | MITK | 8.65 | 0.3 | 480 | 30 | 17 | 177.8 | 60 | 956 | 5.99 |
| 18 | BASRUR | 5.76 | 0.2 | 340 | 38 | 8.8 | 81.2 | 64 | 985.6 | 10.99 |
| 19 | HALADI | 5.4 | 0.2 | 1020 | 12 | 8.2 | 106.4 | 80 | 1212.8 | 15.99 |
| 20 | AMPARU | 6.2 | 0.1 | 460 | 8 | 15.6 | 72.8 | 14 | 982.4 | 7.99 |
| 21 | KAMALSHILE | 5.25 | 0.1 | 280 | 28 | 7.4 | 53.2 | 19 | 796.8 | 6.99 |
| 22 | TALLUR-2 | 6.2 | 0.1 | 320 | 12 | 8.4 | 23.8 | 22 | 1107.2 | 6.99 |
| 23 | AMAVASYEBAILU | 3 | 0.1 | 440 | 28 | 10.8 | 40.6 | 19 | 779.2 | 7.99 |
| 24 | SHANKARNARAYANA | 5.92 | 0.1 | 180 | 22 | 8.6 | 25.2 | 26 | 974.4 | 5.99 |
| 25 | YEDTHARE | 4.85 | 0.1 | 280 | 8 | 6.6 | 81.2 | 13 | 1332.8 | 8.99 |
| 26 | NAVUNDA | 6.78 | 0.3 | 480 | 28 | 8.4 | 18.2 | 67 | 1404.8 | 16.99 |
| 27 | SENAPURA | 7.2 | 0.9 | 420 | 36 | 6.8 | 23.8 | 422 | 1081.6 | 4.99 |
| 28 | KANDLUR | 5.67 | 0.2 | 400 | 30 | 8.2 | 74.2 | 74 | 896 | 11.99 |
| 29 | HALLIHOLE | 5.55 | 0.1 | 620 | 6 | 8.4 | 210 | 24 | 1152 | 7.99 |
| 30 | ULLUR | 6.52 | 0.3 | 500 | 18 | 20.8 | 25.5 | 134 | 1024 | 1.99 |
| 31 | MULLIKATTE | 6.28 | 0.4 | 380 | 20 | 13 | 124.6 | 44 | 953.6 | 30.99 |
| 32 | SIDDAPURA | 5.65 | 0.1 | 220 | 8 | 5.6 | 29.4 | 25 | 1024 | 8.99 |
| 33 | KUNDAPURA (G.G) | 6.32 | 0.3 | 380 | 14 | 7.4 | 139.6 | 333 | 1865 | 33.98 |
| 34 | UPPUNDA | 5.65 | 0.3 | 360 | 18 | 5 | 67.2 | 82 | 1014.4 | 17.99 |
| 35 | PADUVARA | 4.47 | 0.1 | 420 | 30 | 7.2 | 110 | 47 | 931.2 | 14.99 |
| 36 | MARVANTHE | 5.33 | 0.1 | 320 | 8 | 10.8 | 51.8 | 46 | 875.2 | 12.99 |
| 37 | HEMMADI | 6.08 | 0.2 | 540 | 32 | 9.6 | 112 | 96 | 924.8 | 7.99 |
| 38 | TRASI | 6.4 | 0.1 | 540 | 10 | 16 | 77 | 48 | 1142.4 | 17.99 |
| 39 | GANGOLLI | 6.32 | 0.1 | 460 | 20 | 9.6 | 37.8 | 32 | 1120.8 | 8.99 |
| 40 | HOSANGADI | 5.65 | 0.1 | 160 | 54 | 10.4 | 67.2 | 36 | 636.8 | 15.99 |
| Sl.No | WQI | Status | Possible Usages |
|---|---|---|---|
| 1 | 0–25 | Excellent | Drinking, Irrigation and Industrial |
| 2 | 25–50 | Good | Domestic, Irrigation and Industrial |
| 3 | 51–75 | Fair | Irrigation and Industrial |
| 4 | 76–100 | Poor | Irrigation |
| 5 | 101–150 | Very Poor | Restricted use for Irrigation |
| 6 | Above 150 | Unfit for Drinking | Proper treatment required before use |
| Sample ID | Pre-Summer | Post-Summer |
|---|---|---|
| WQI | WQI | |
| 1 | 0.244028006 | 118.0822 |
| 2 | 0.250289919 | 153.6957 |
| 3 | 0.248912476 | 109.2059 |
| 4 | 0.229324589 | 84.43725 |
| 5 | 0.254388771 | 109.1039 |
| 6 | 0.245428233 | 154.7662 |
| 7 | 0.271681197 | 219.0843 |
| 8 | 0.254846296 | 110.3156 |
| 9 | 0.23976091 | 92.67013 |
| 10 | 0.243258229 | 117.6524 |
| 11 | 0.244297824 | 172.2654 |
| 12 | 0.259989301 | 160.4354 |
| 13 | 0.224145702 | 147.1545 |
| 14 | 0.249816091 | 104.2725 |
| 15 | 0.266712479 | 144.6846 |
| 16 | 0.198521863 | 129.1174 |
| 17 | 0.260596689 | 145.7288 |
| 18 | 0.248460444 | 119.8622 |
| 19 | 0.266322613 | 199.7046 |
| 20 | 0.233330555 | 129.8898 |
| 21 | 0.229595065 | 94.69791 |
| 22 | 0.25685119 | 127.661 |
| 23 | 0.23530844 | 95.35414 |
| 24 | 0.231558485 | 102.8062 |
| 25 | 0.221382828 | 135.5881 |
| 26 | 0.246154944 | 171.0533 |
| 27 | 0.268981405 | 153.2841 |
| 28 | 0.241948091 | 117.9586 |
| 29 | 0.229310839 | 158.1555 |
| 30 | 0.266840805 | 140.9945 |
| 31 | 0.260911626 | 123.0504 |
| 32 | 0.239208785 | 109.3685 |
| 33 | 0.264788591 | 206.3175 |
| 34 | 0.238563103 | 124.1805 |
| 35 | 0.220473474 | 116.0478 |
| 36 | 0.232881804 | 105.1779 |
| 37 | 0.214158486 | 136.411 |
| 38 | 0.265952495 | 152.3485 |
| 39 | 0.24356991 | 142.7952 |
| 40 | 0.21563819 | 73.59726 |
Publisher’s Note: MDPI stays neutral with regard to jurisdictional claims in published maps and institutional affiliations. |
© 2022 by the authors. Licensee MDPI, Basel, Switzerland. This article is an open access article distributed under the terms and conditions of the Creative Commons Attribution (CC BY) license (https://creativecommons.org/licenses/by/4.0/).
Share and Cite
Poojashree, B.P.; Peladdy, B.; Kaveri, H.; Akkivalli, P.; Swathi, L.A. Determination of Physio-Chemical Parameters and Water Quality Index (Wqi) of Kundapura Taluk, Udupi District, Karnataka, India. Pollutants 2022, 2, 388-406. https://doi.org/10.3390/pollutants2030026
Poojashree BP, Peladdy B, Kaveri H, Akkivalli P, Swathi LA. Determination of Physio-Chemical Parameters and Water Quality Index (Wqi) of Kundapura Taluk, Udupi District, Karnataka, India. Pollutants. 2022; 2(3):388-406. https://doi.org/10.3390/pollutants2030026
Chicago/Turabian StylePoojashree, B. P., B. Peladdy, H. Kaveri, P. Akkivalli, and L. A. Swathi. 2022. "Determination of Physio-Chemical Parameters and Water Quality Index (Wqi) of Kundapura Taluk, Udupi District, Karnataka, India" Pollutants 2, no. 3: 388-406. https://doi.org/10.3390/pollutants2030026
APA StylePoojashree, B. P., Peladdy, B., Kaveri, H., Akkivalli, P., & Swathi, L. A. (2022). Determination of Physio-Chemical Parameters and Water Quality Index (Wqi) of Kundapura Taluk, Udupi District, Karnataka, India. Pollutants, 2(3), 388-406. https://doi.org/10.3390/pollutants2030026