
Trends of CO and NO2 Pollutants in Iran during COVID-19 Pandemic Using Timeseries Sentinel-5 Images in Google Earth Engine
 ,
,  ,
,  ,
,  , ,
, ,  and
and 
Abstract
:1. Introduction
2. Materials and Methods
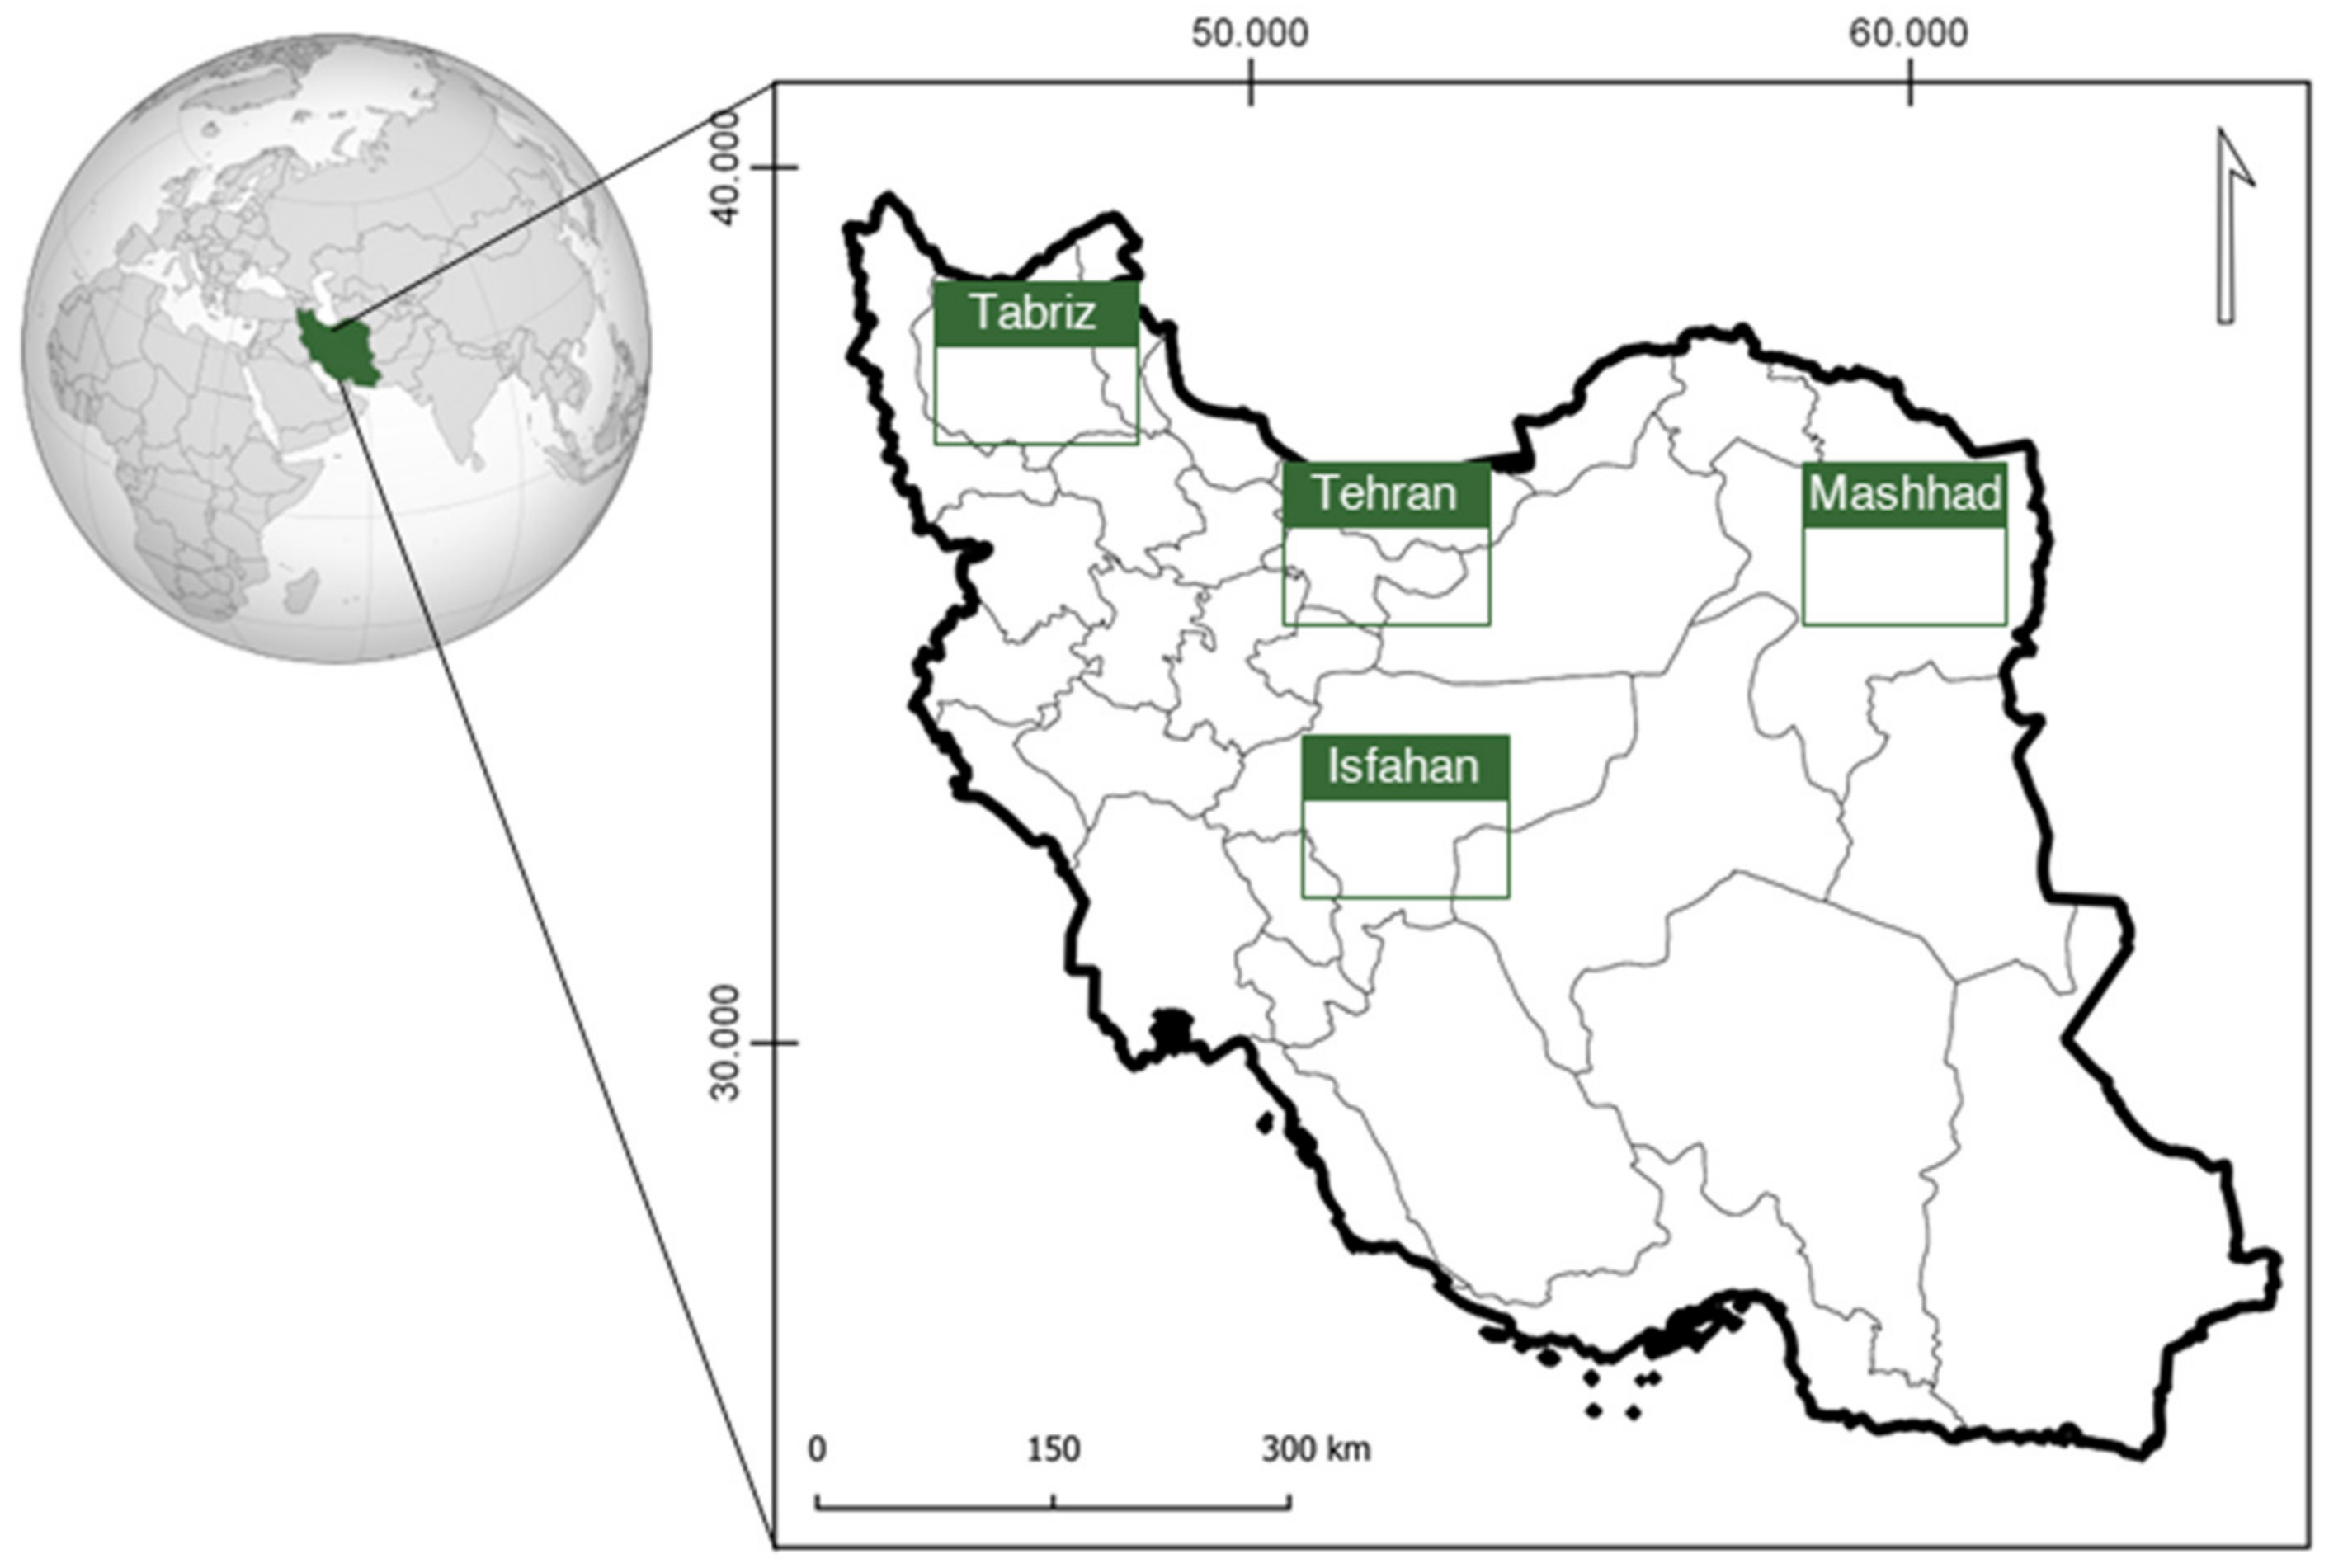
2.1. Study Area
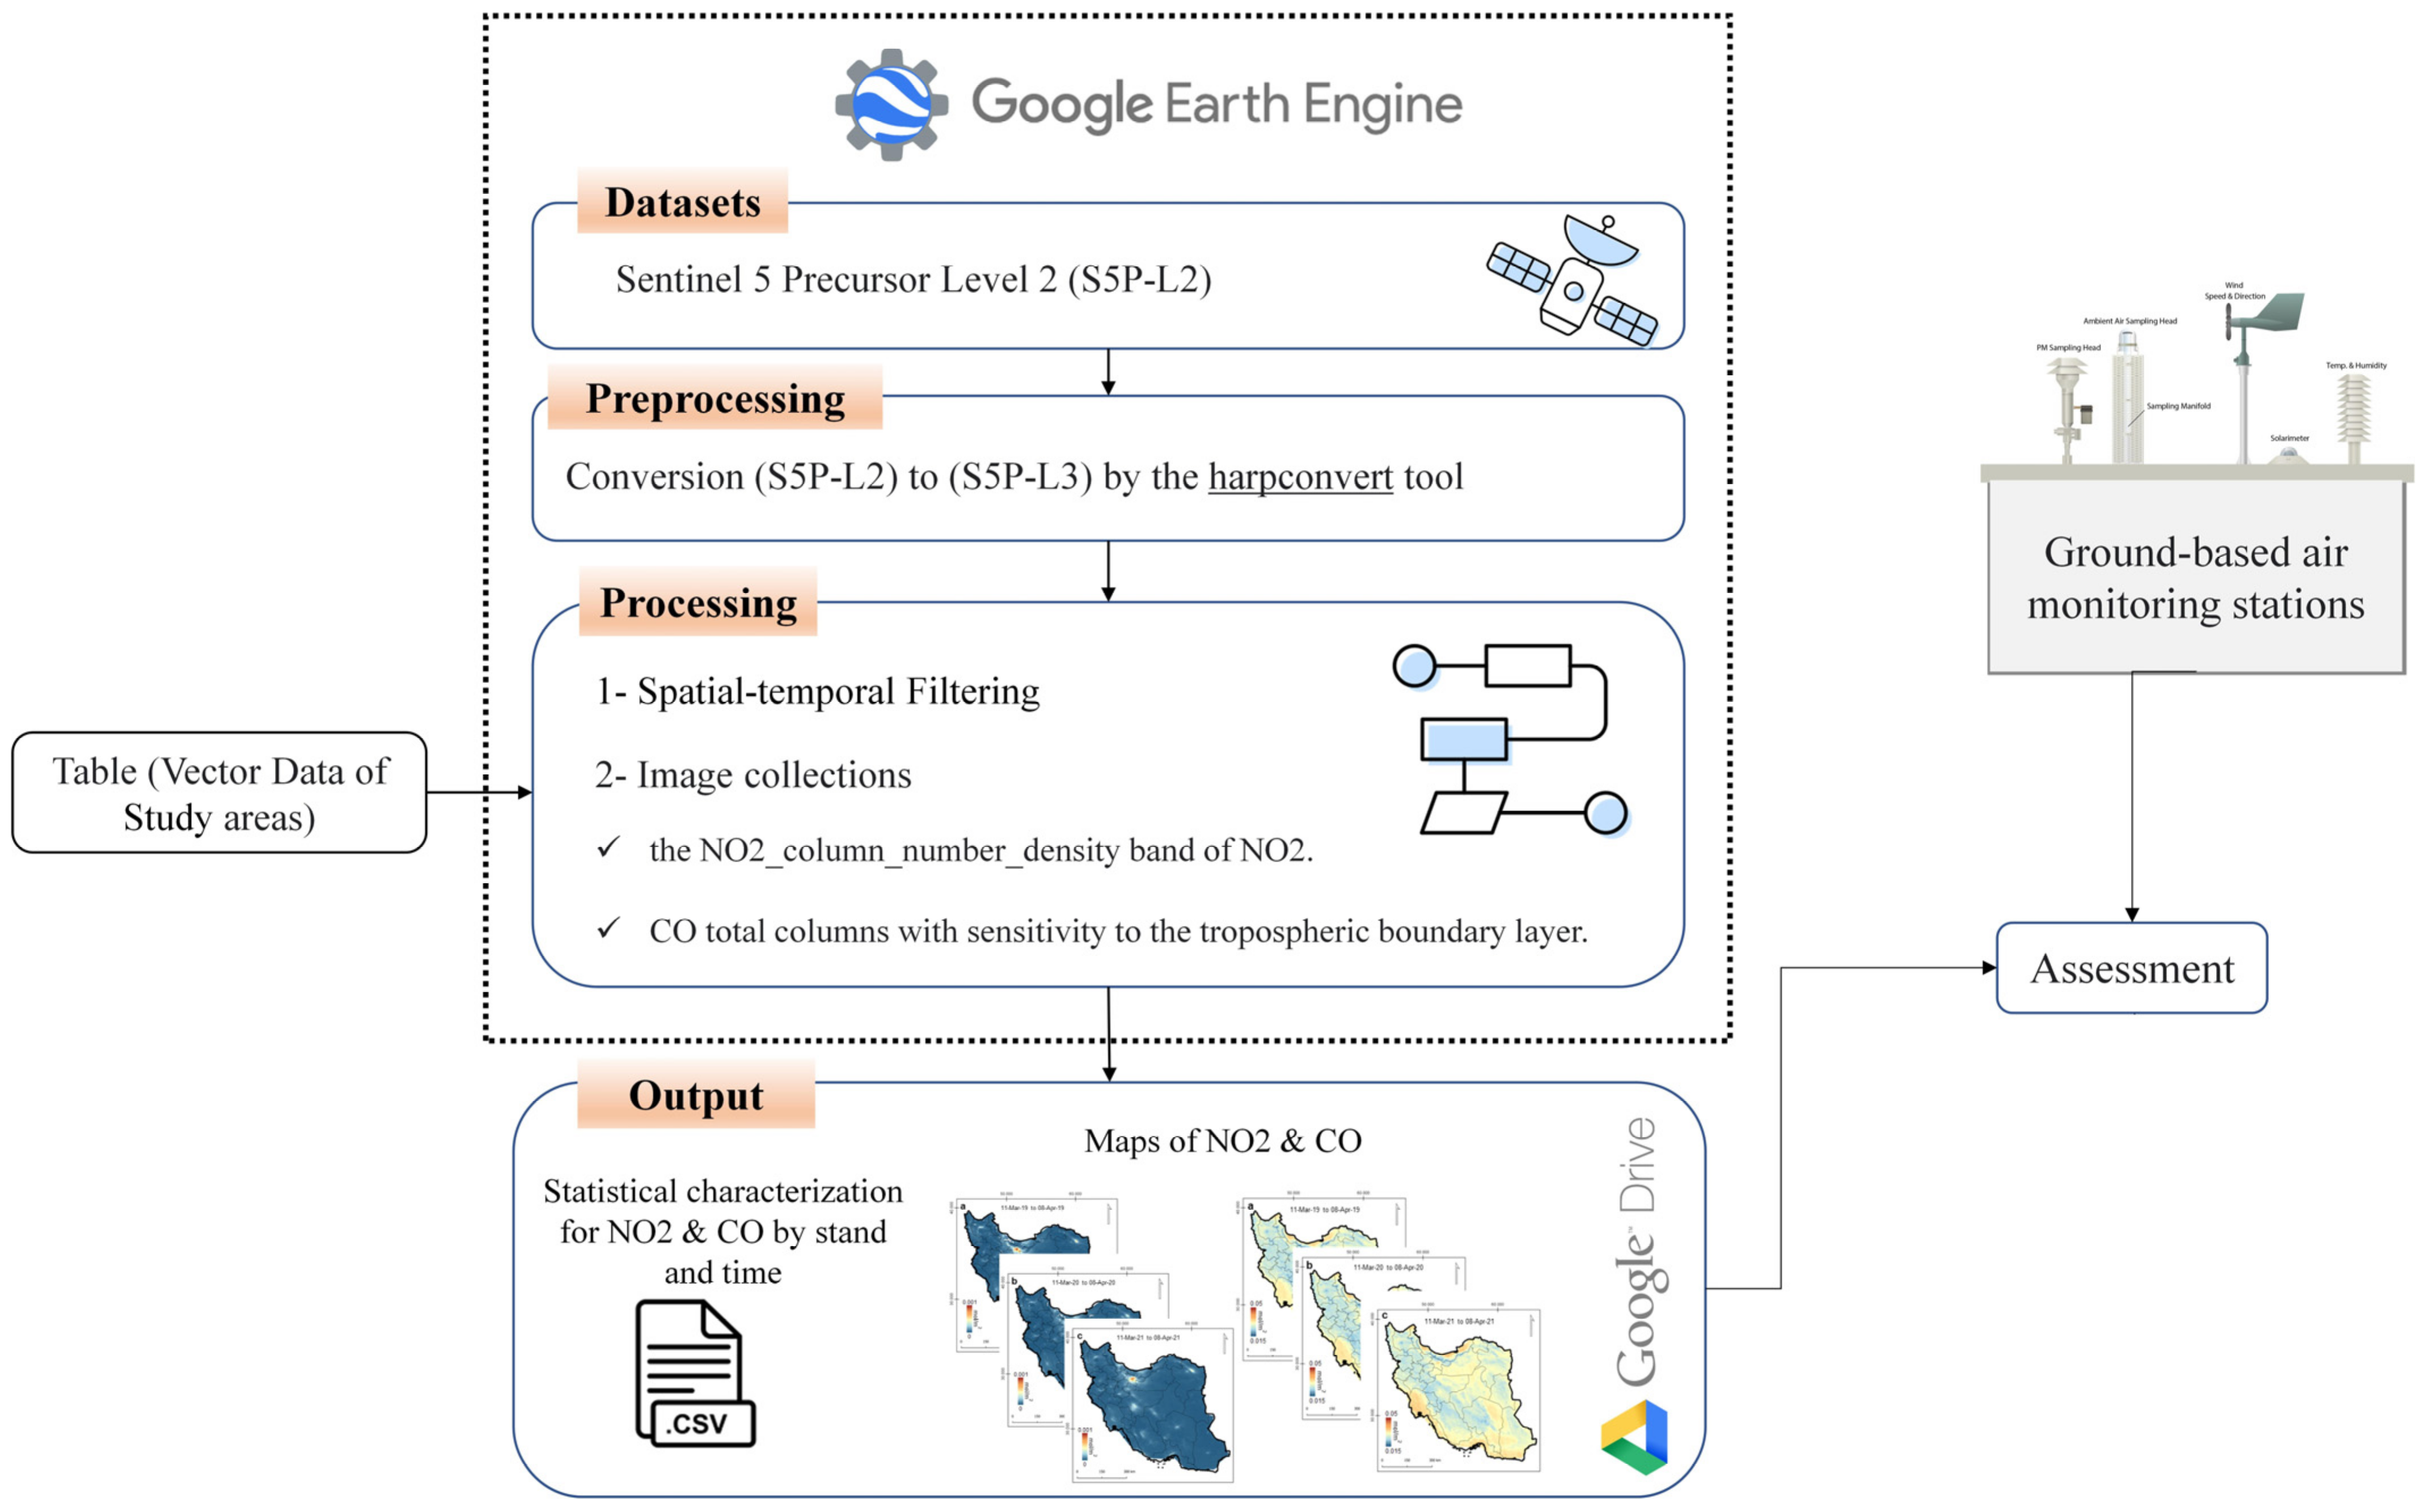
2.2. Datasets
2.3. Data Processing Methodology
3. Results and Discussion
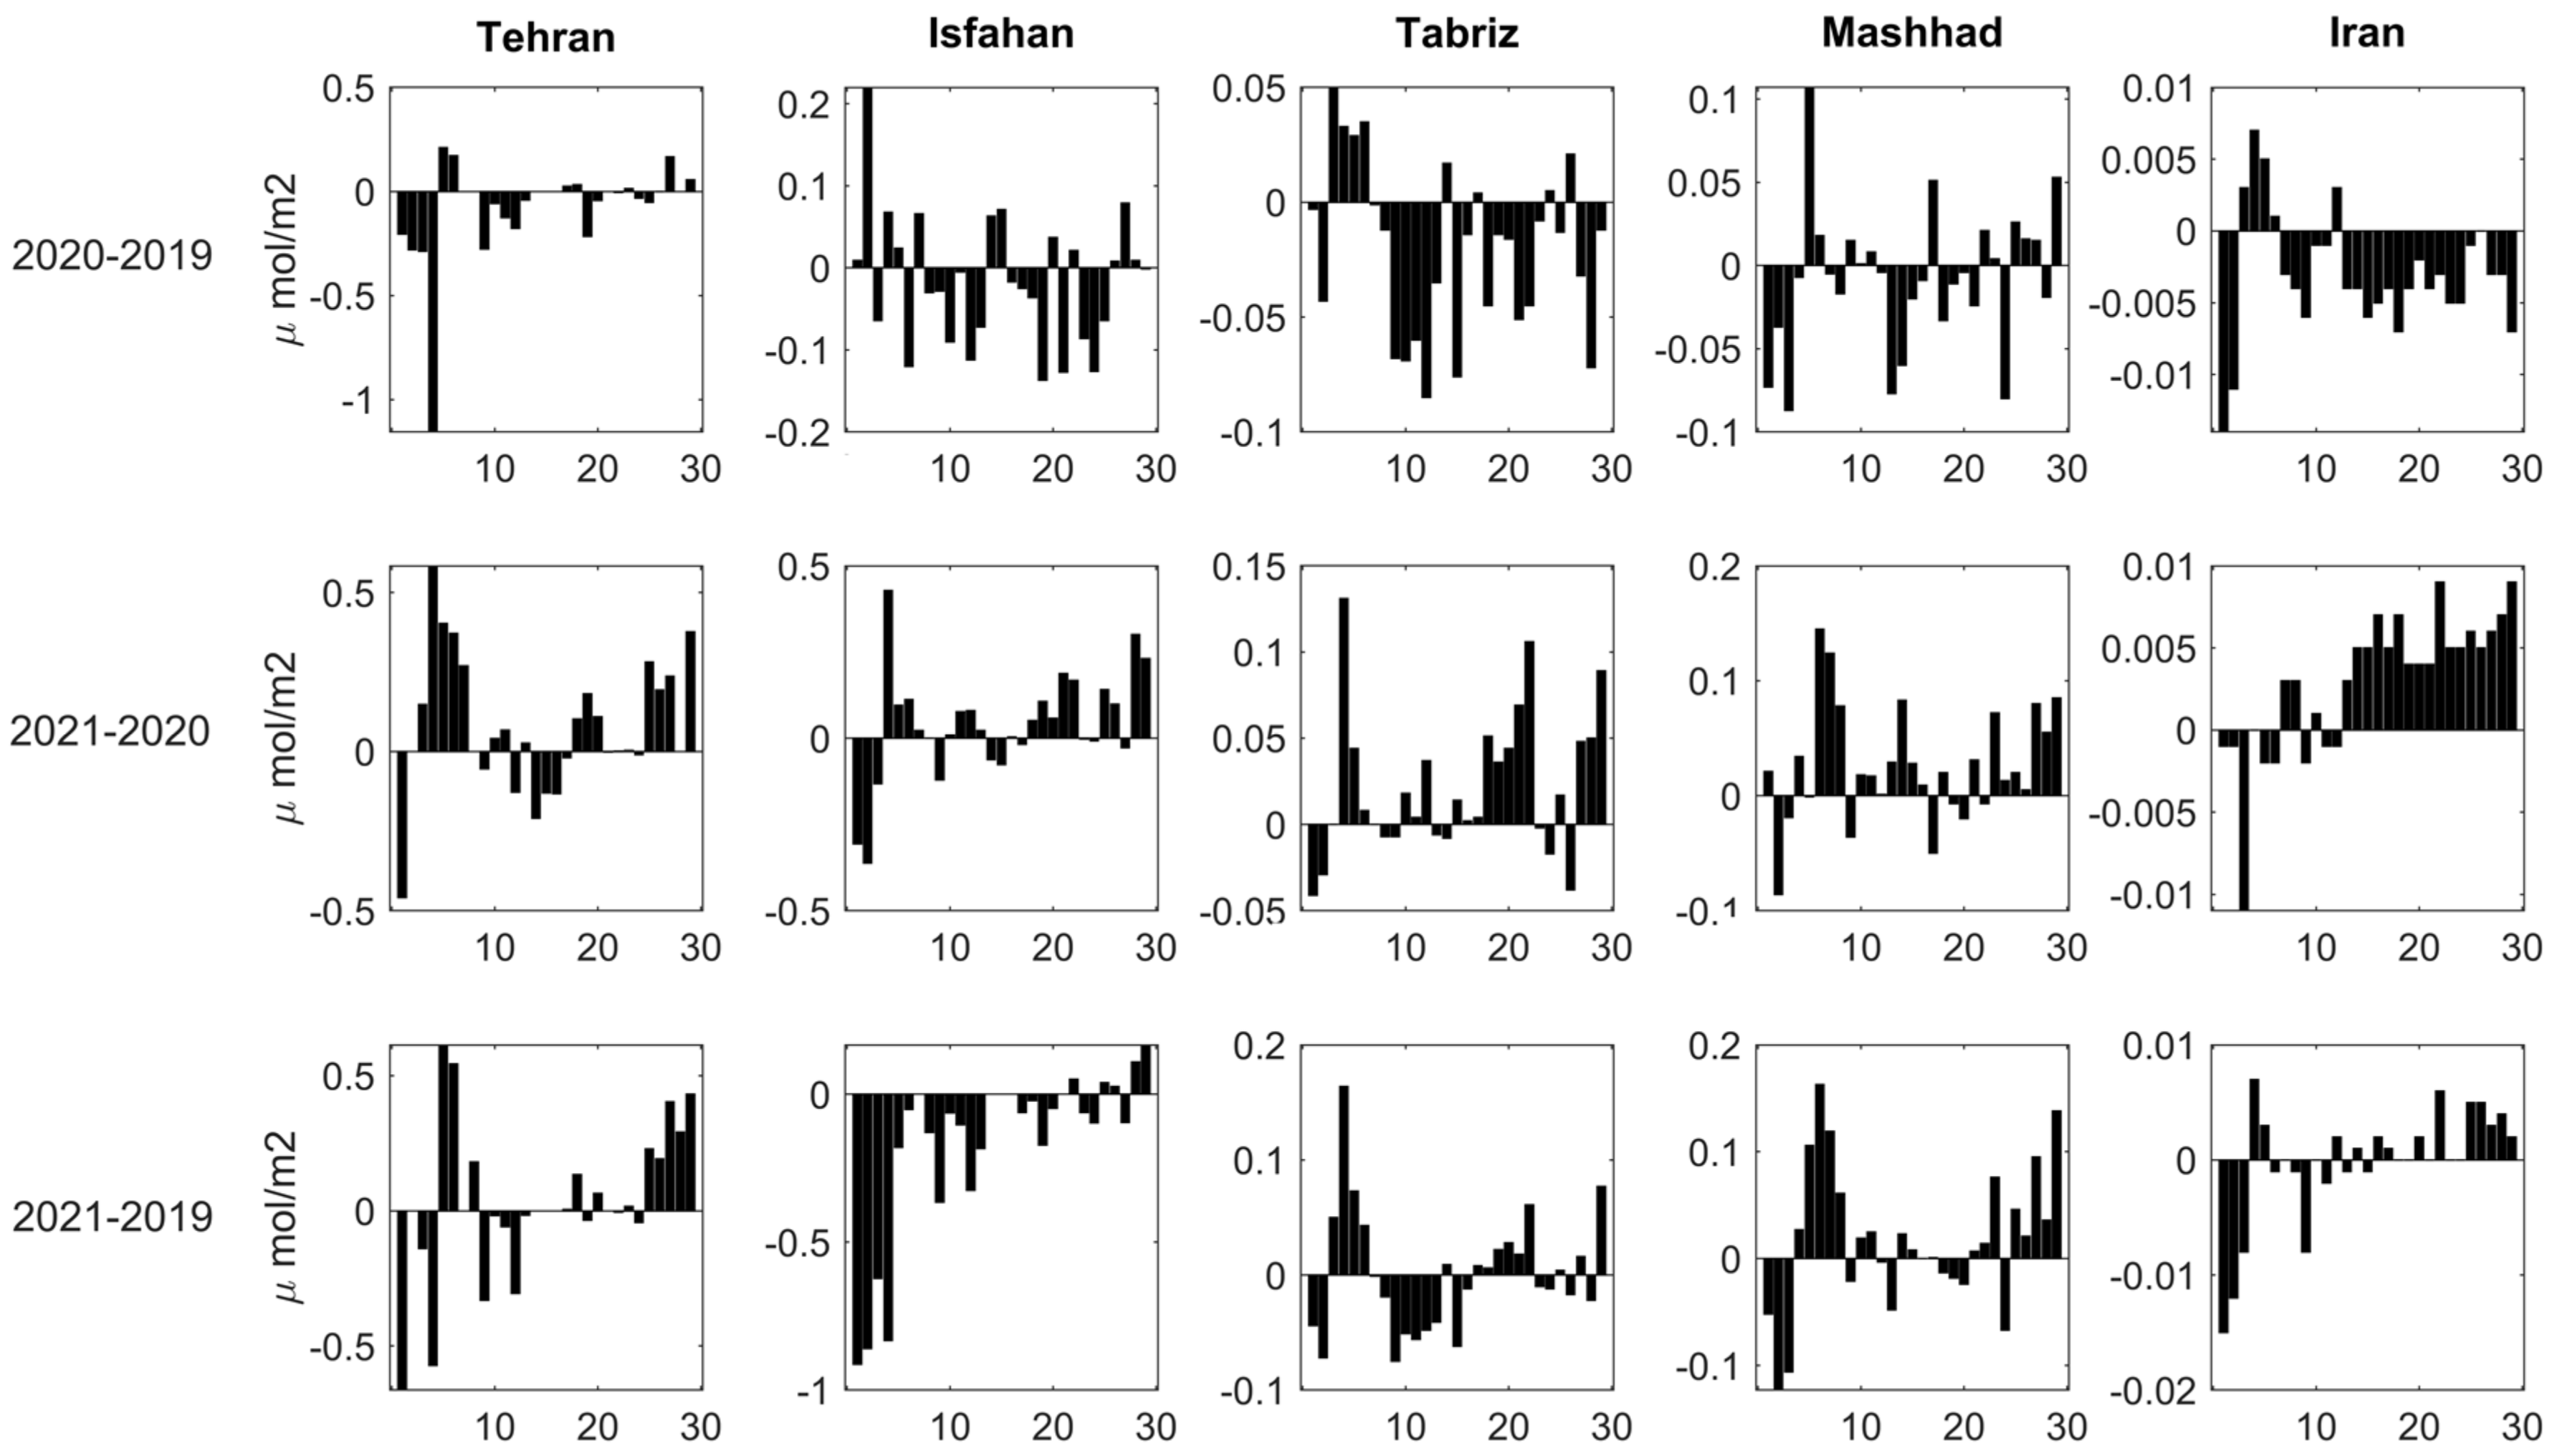
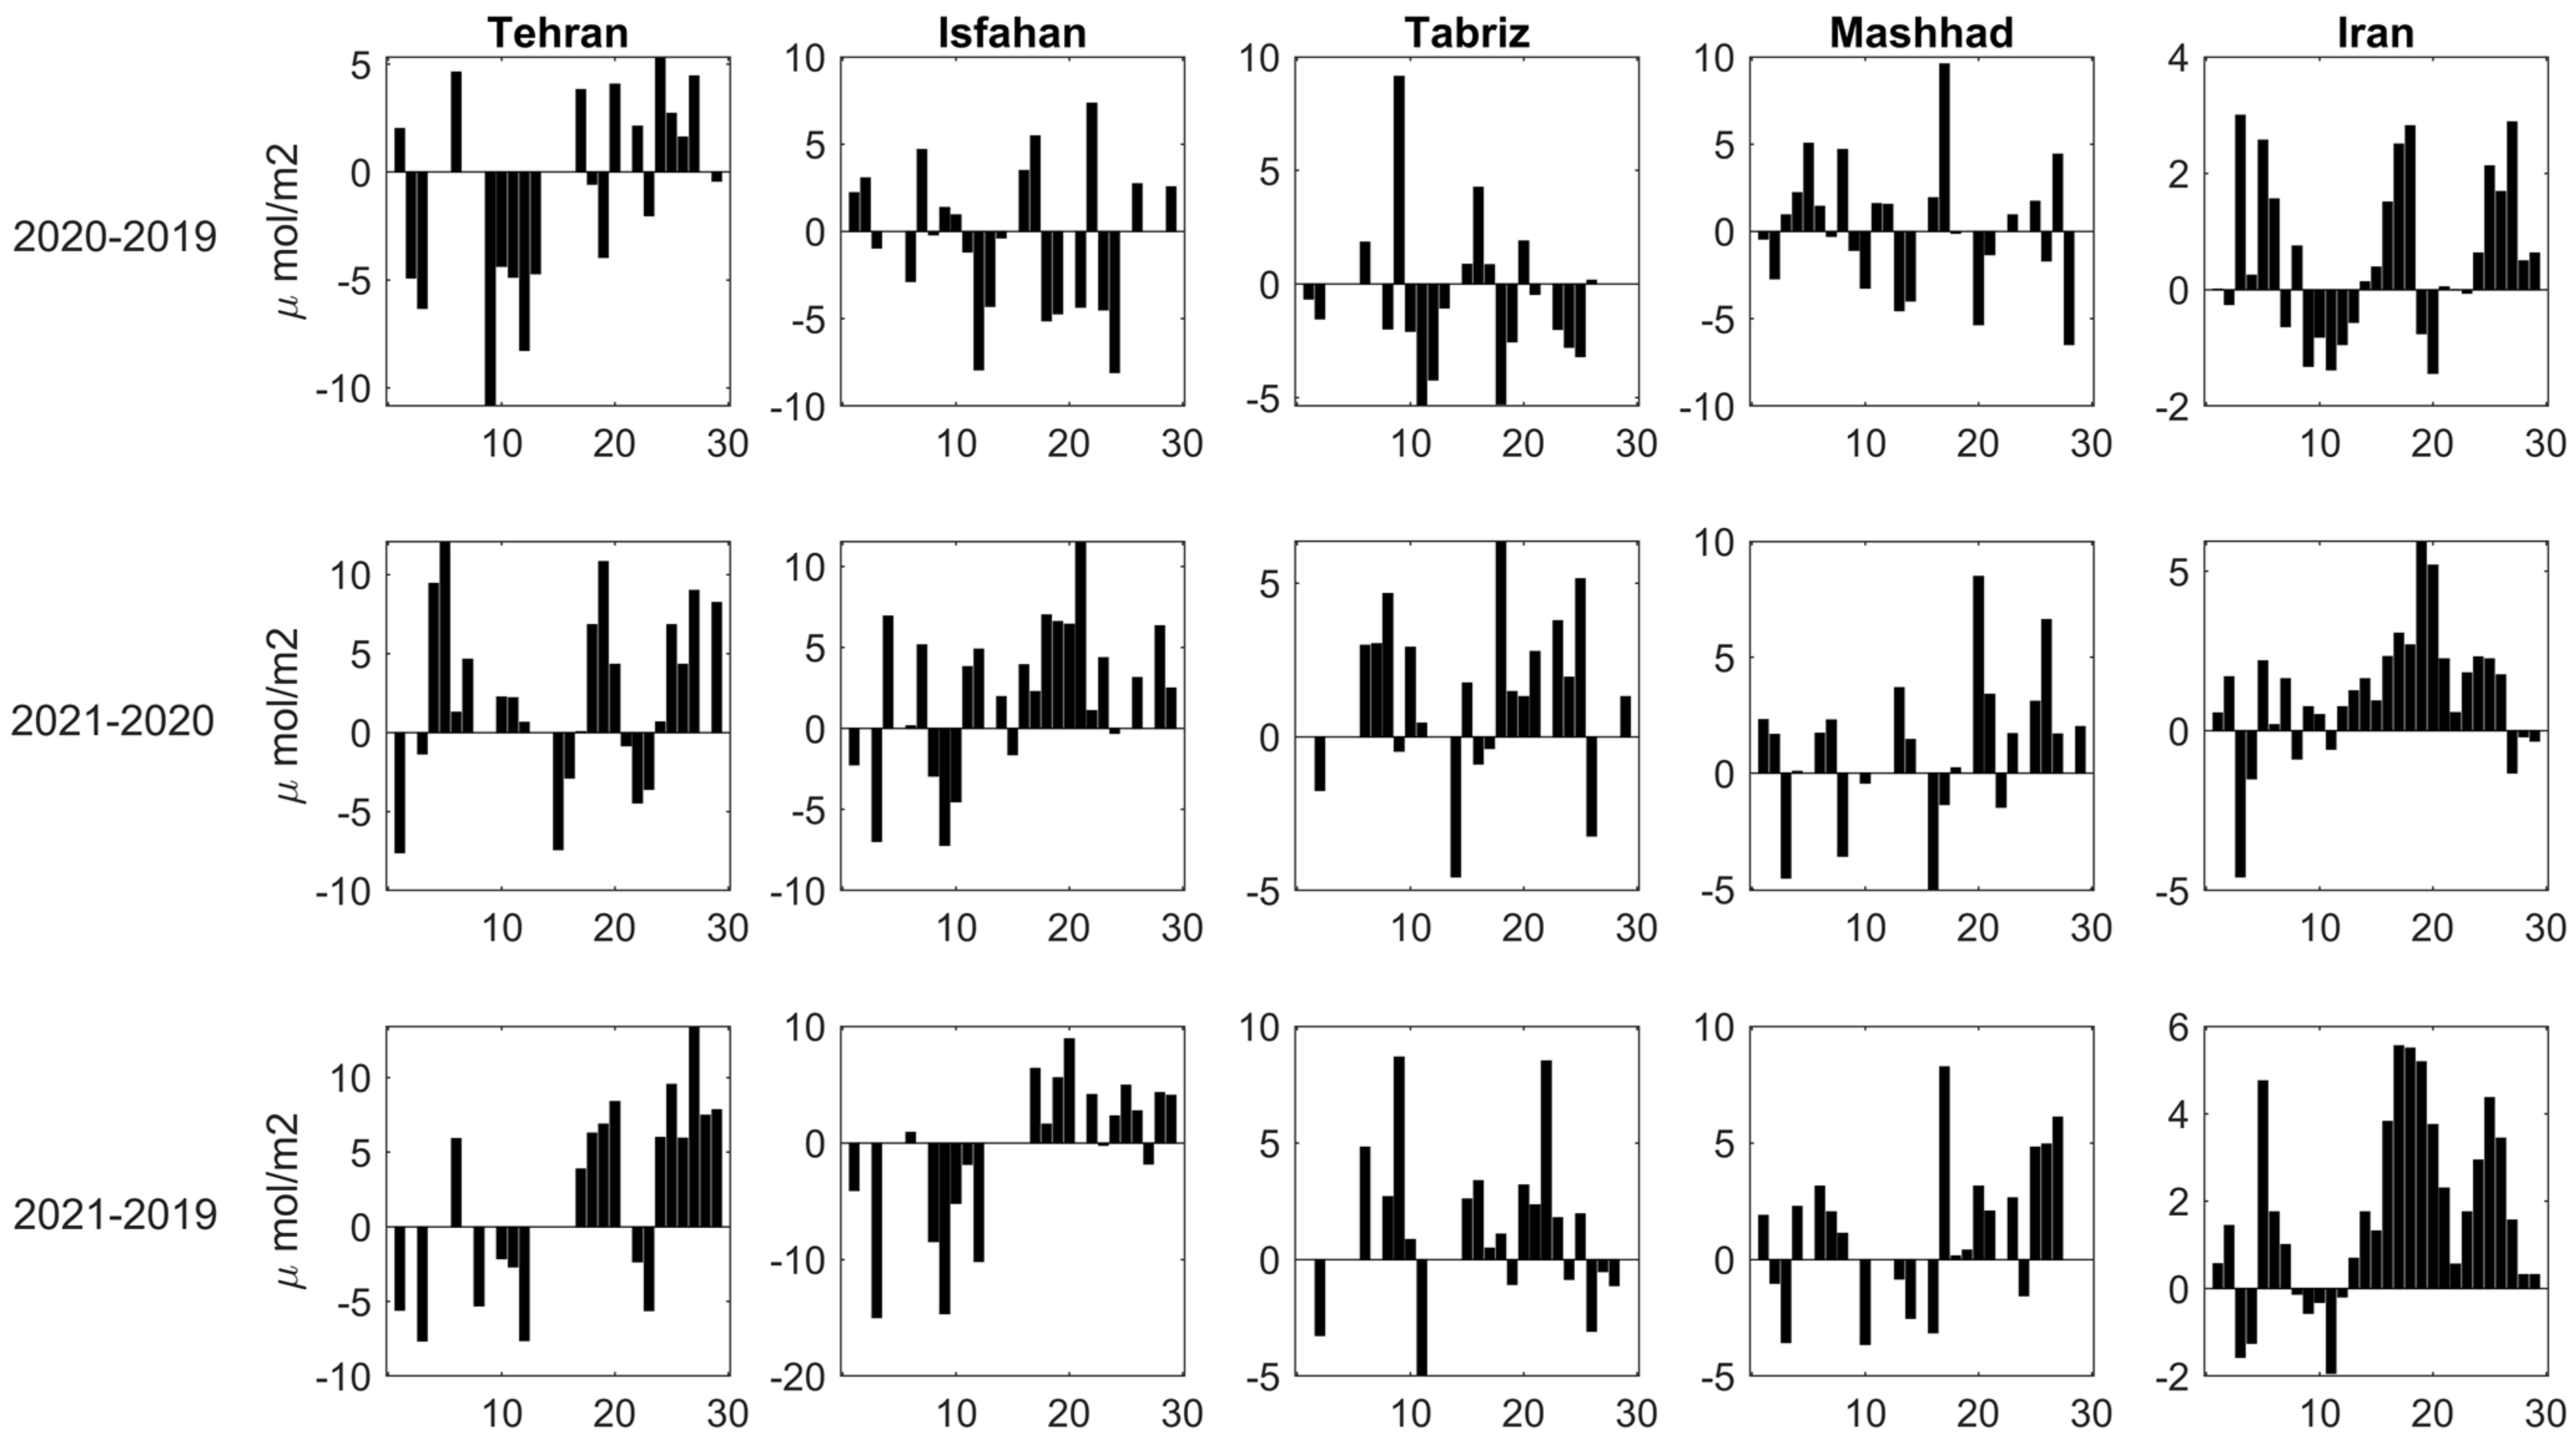
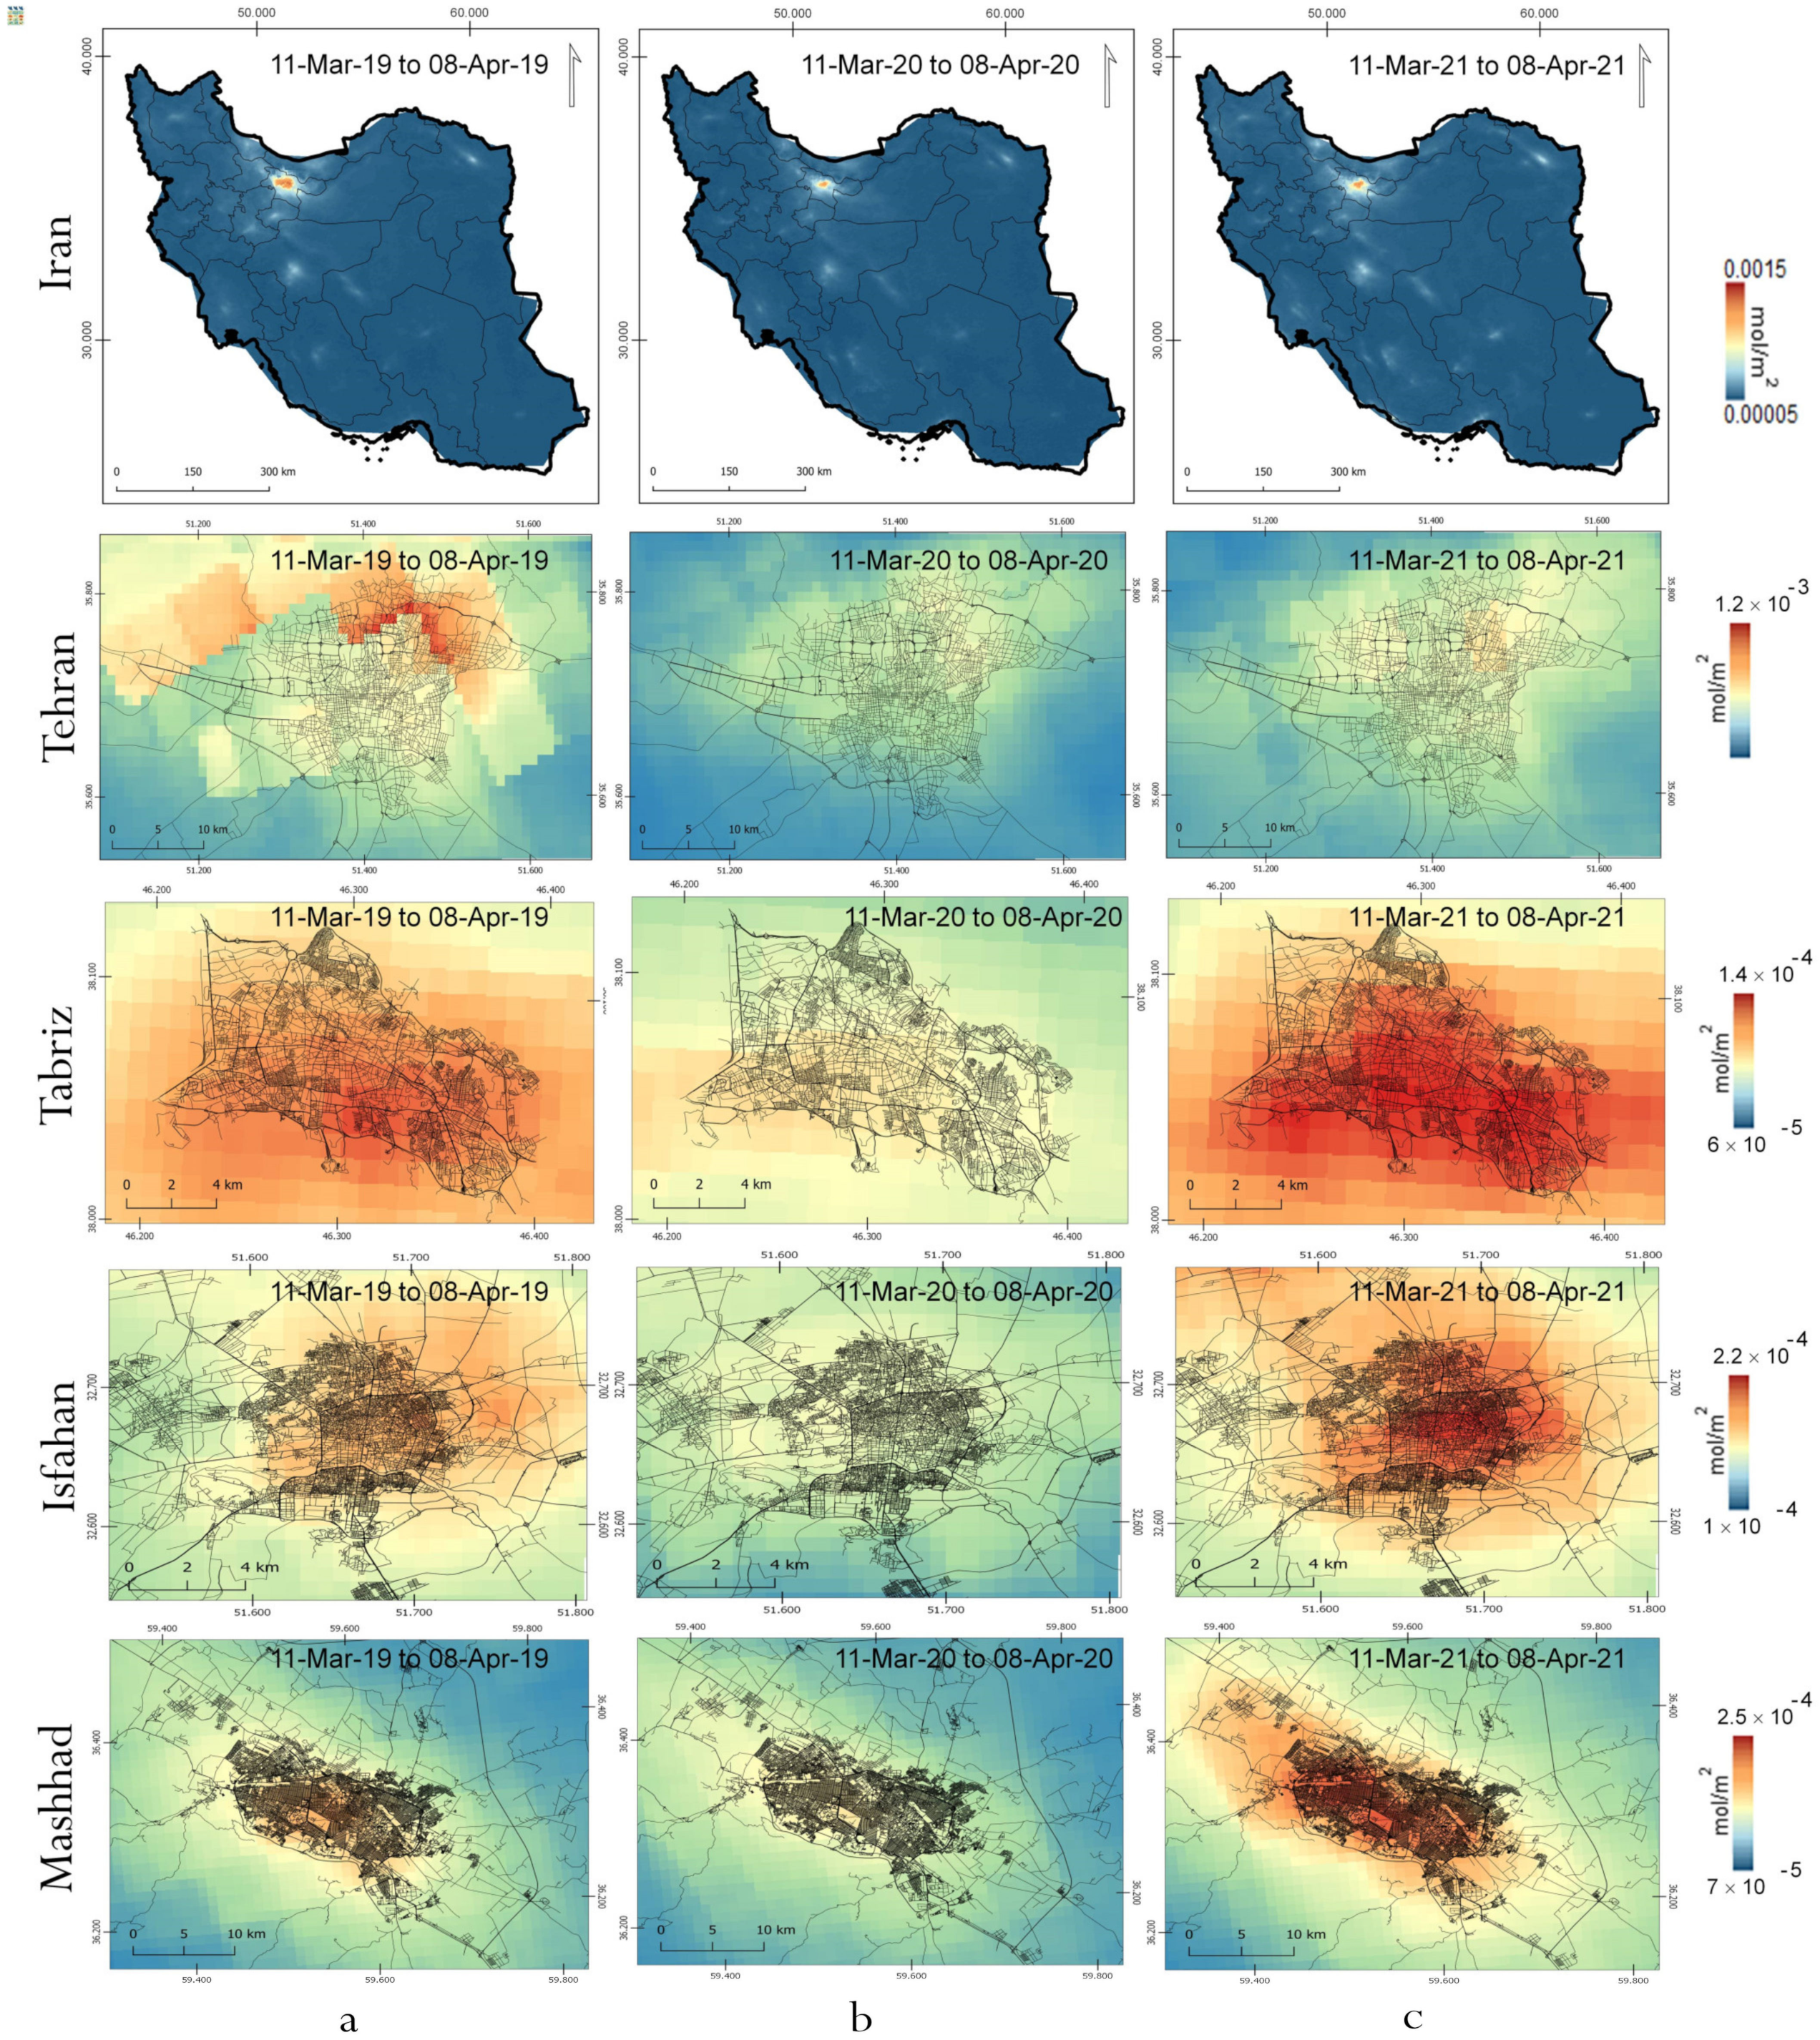
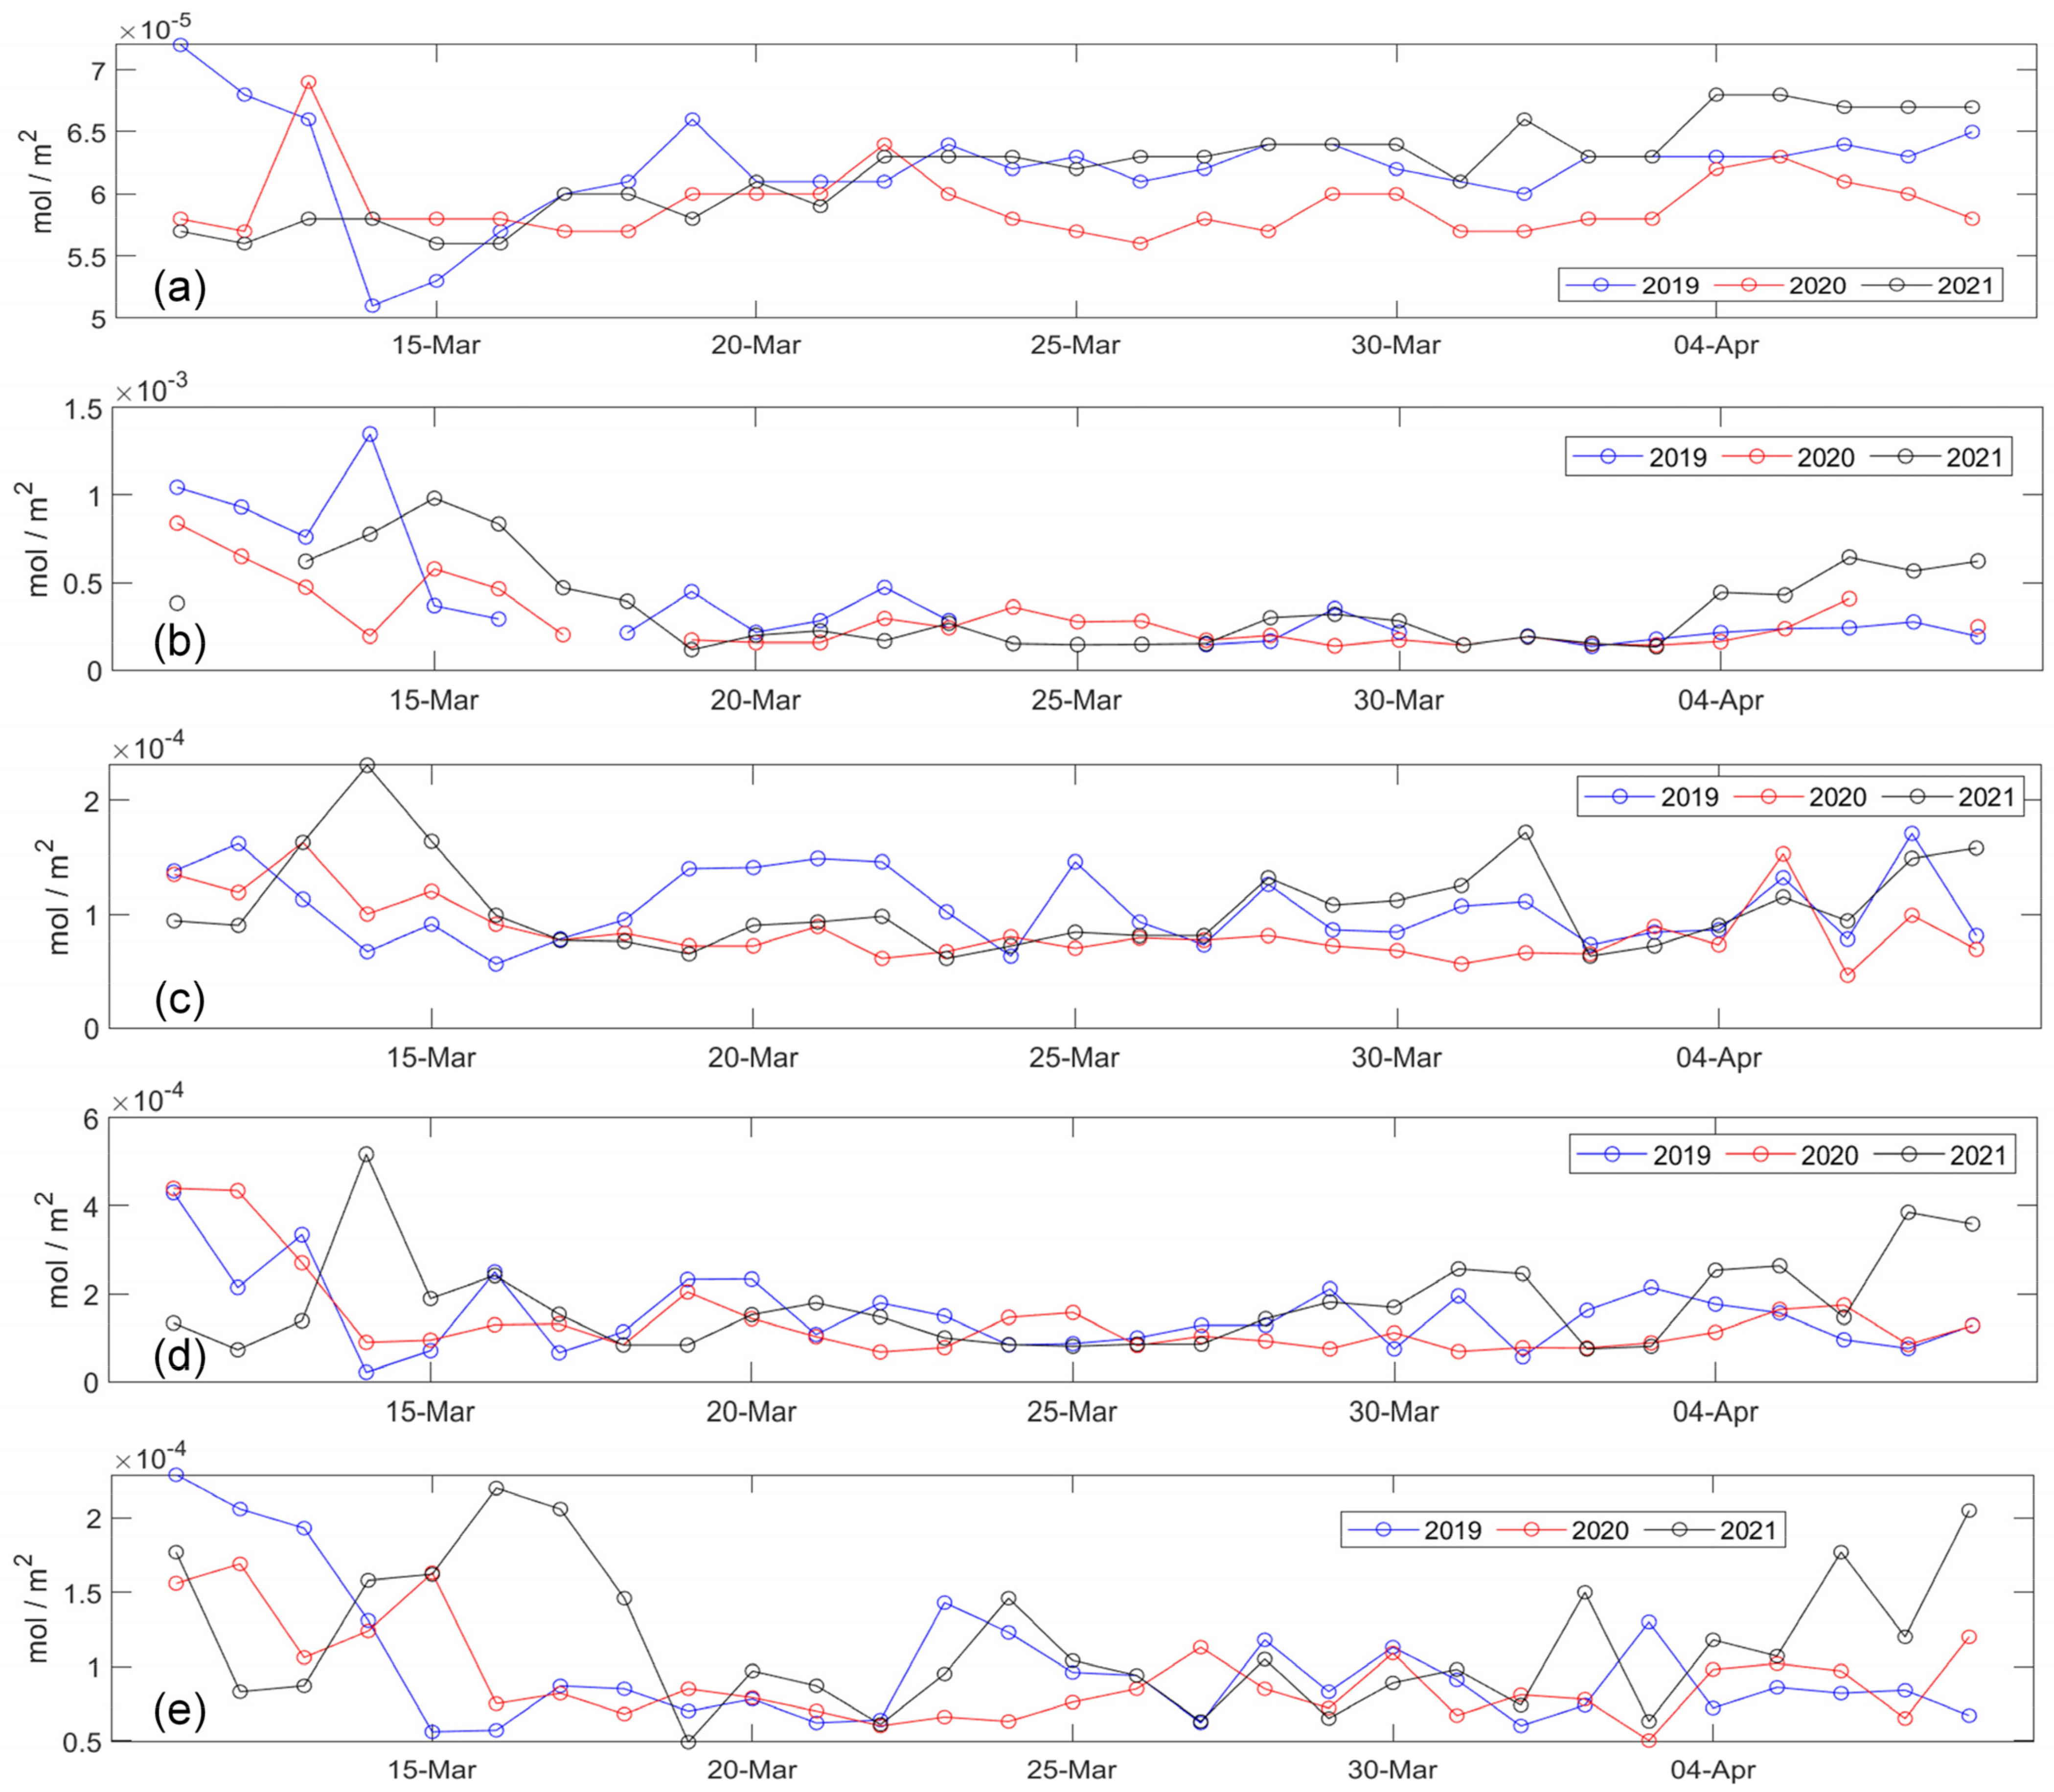
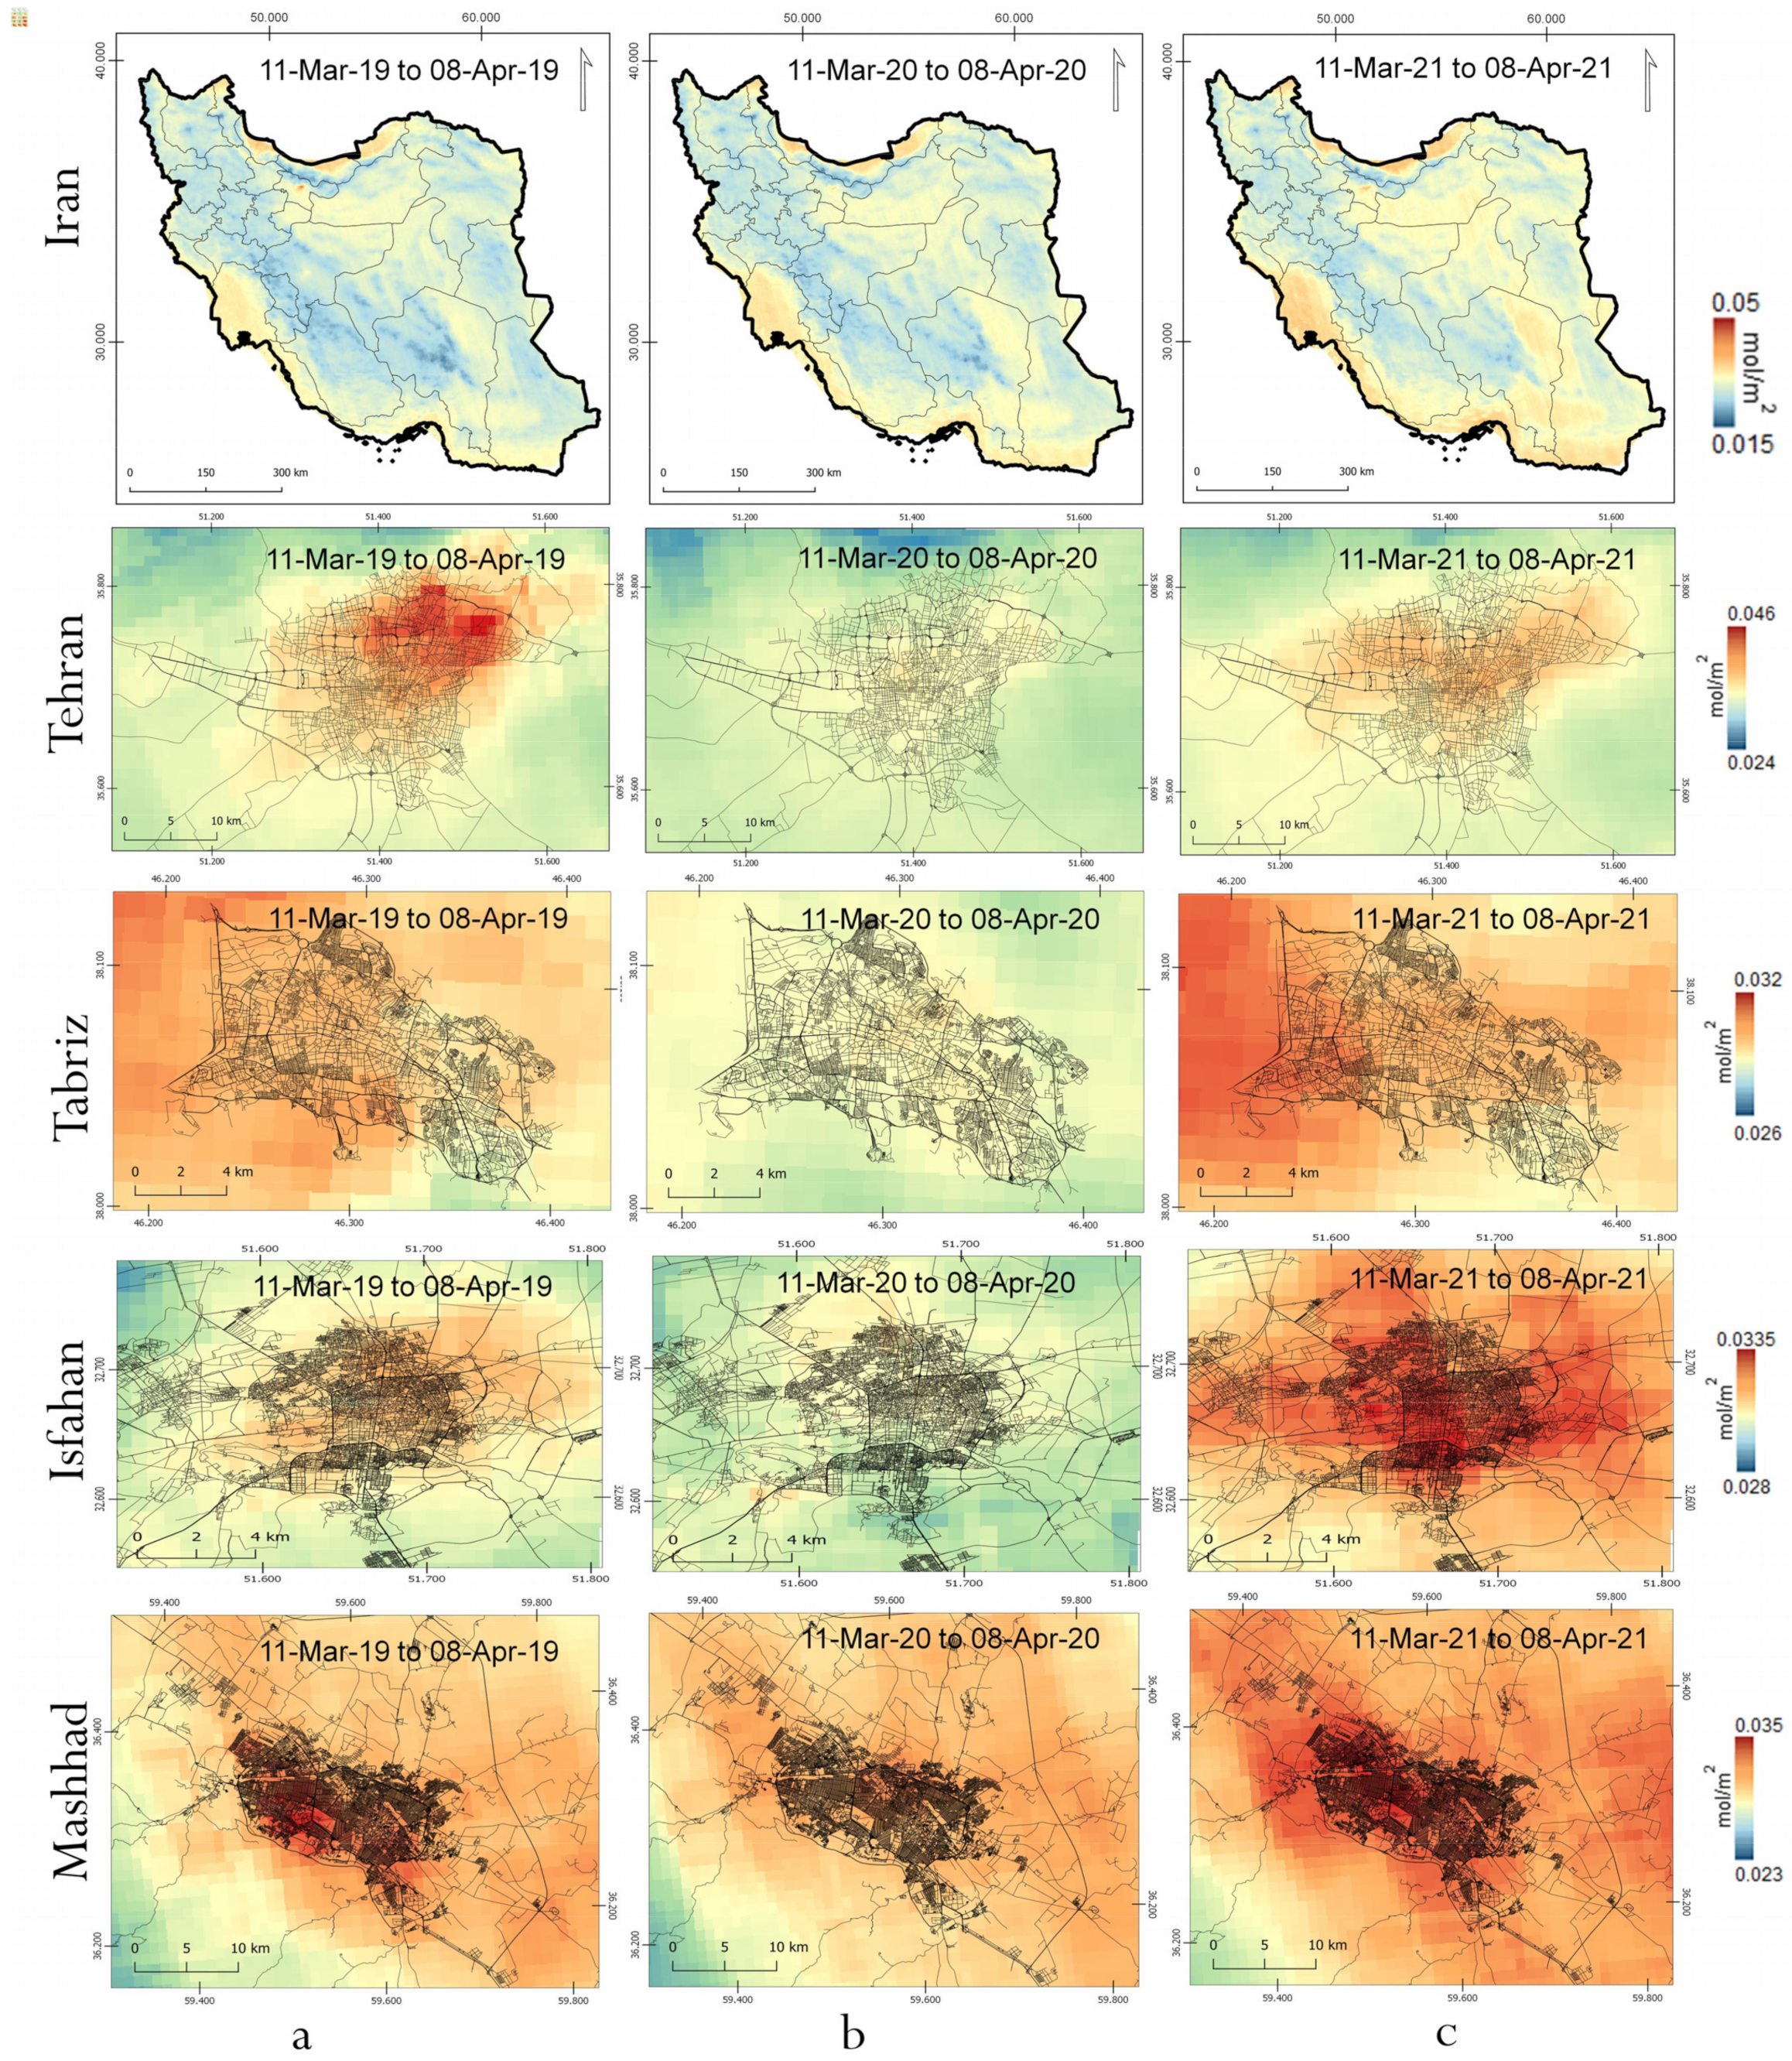
3.1. Spatiotemporal Distribution of the NO2 and CO
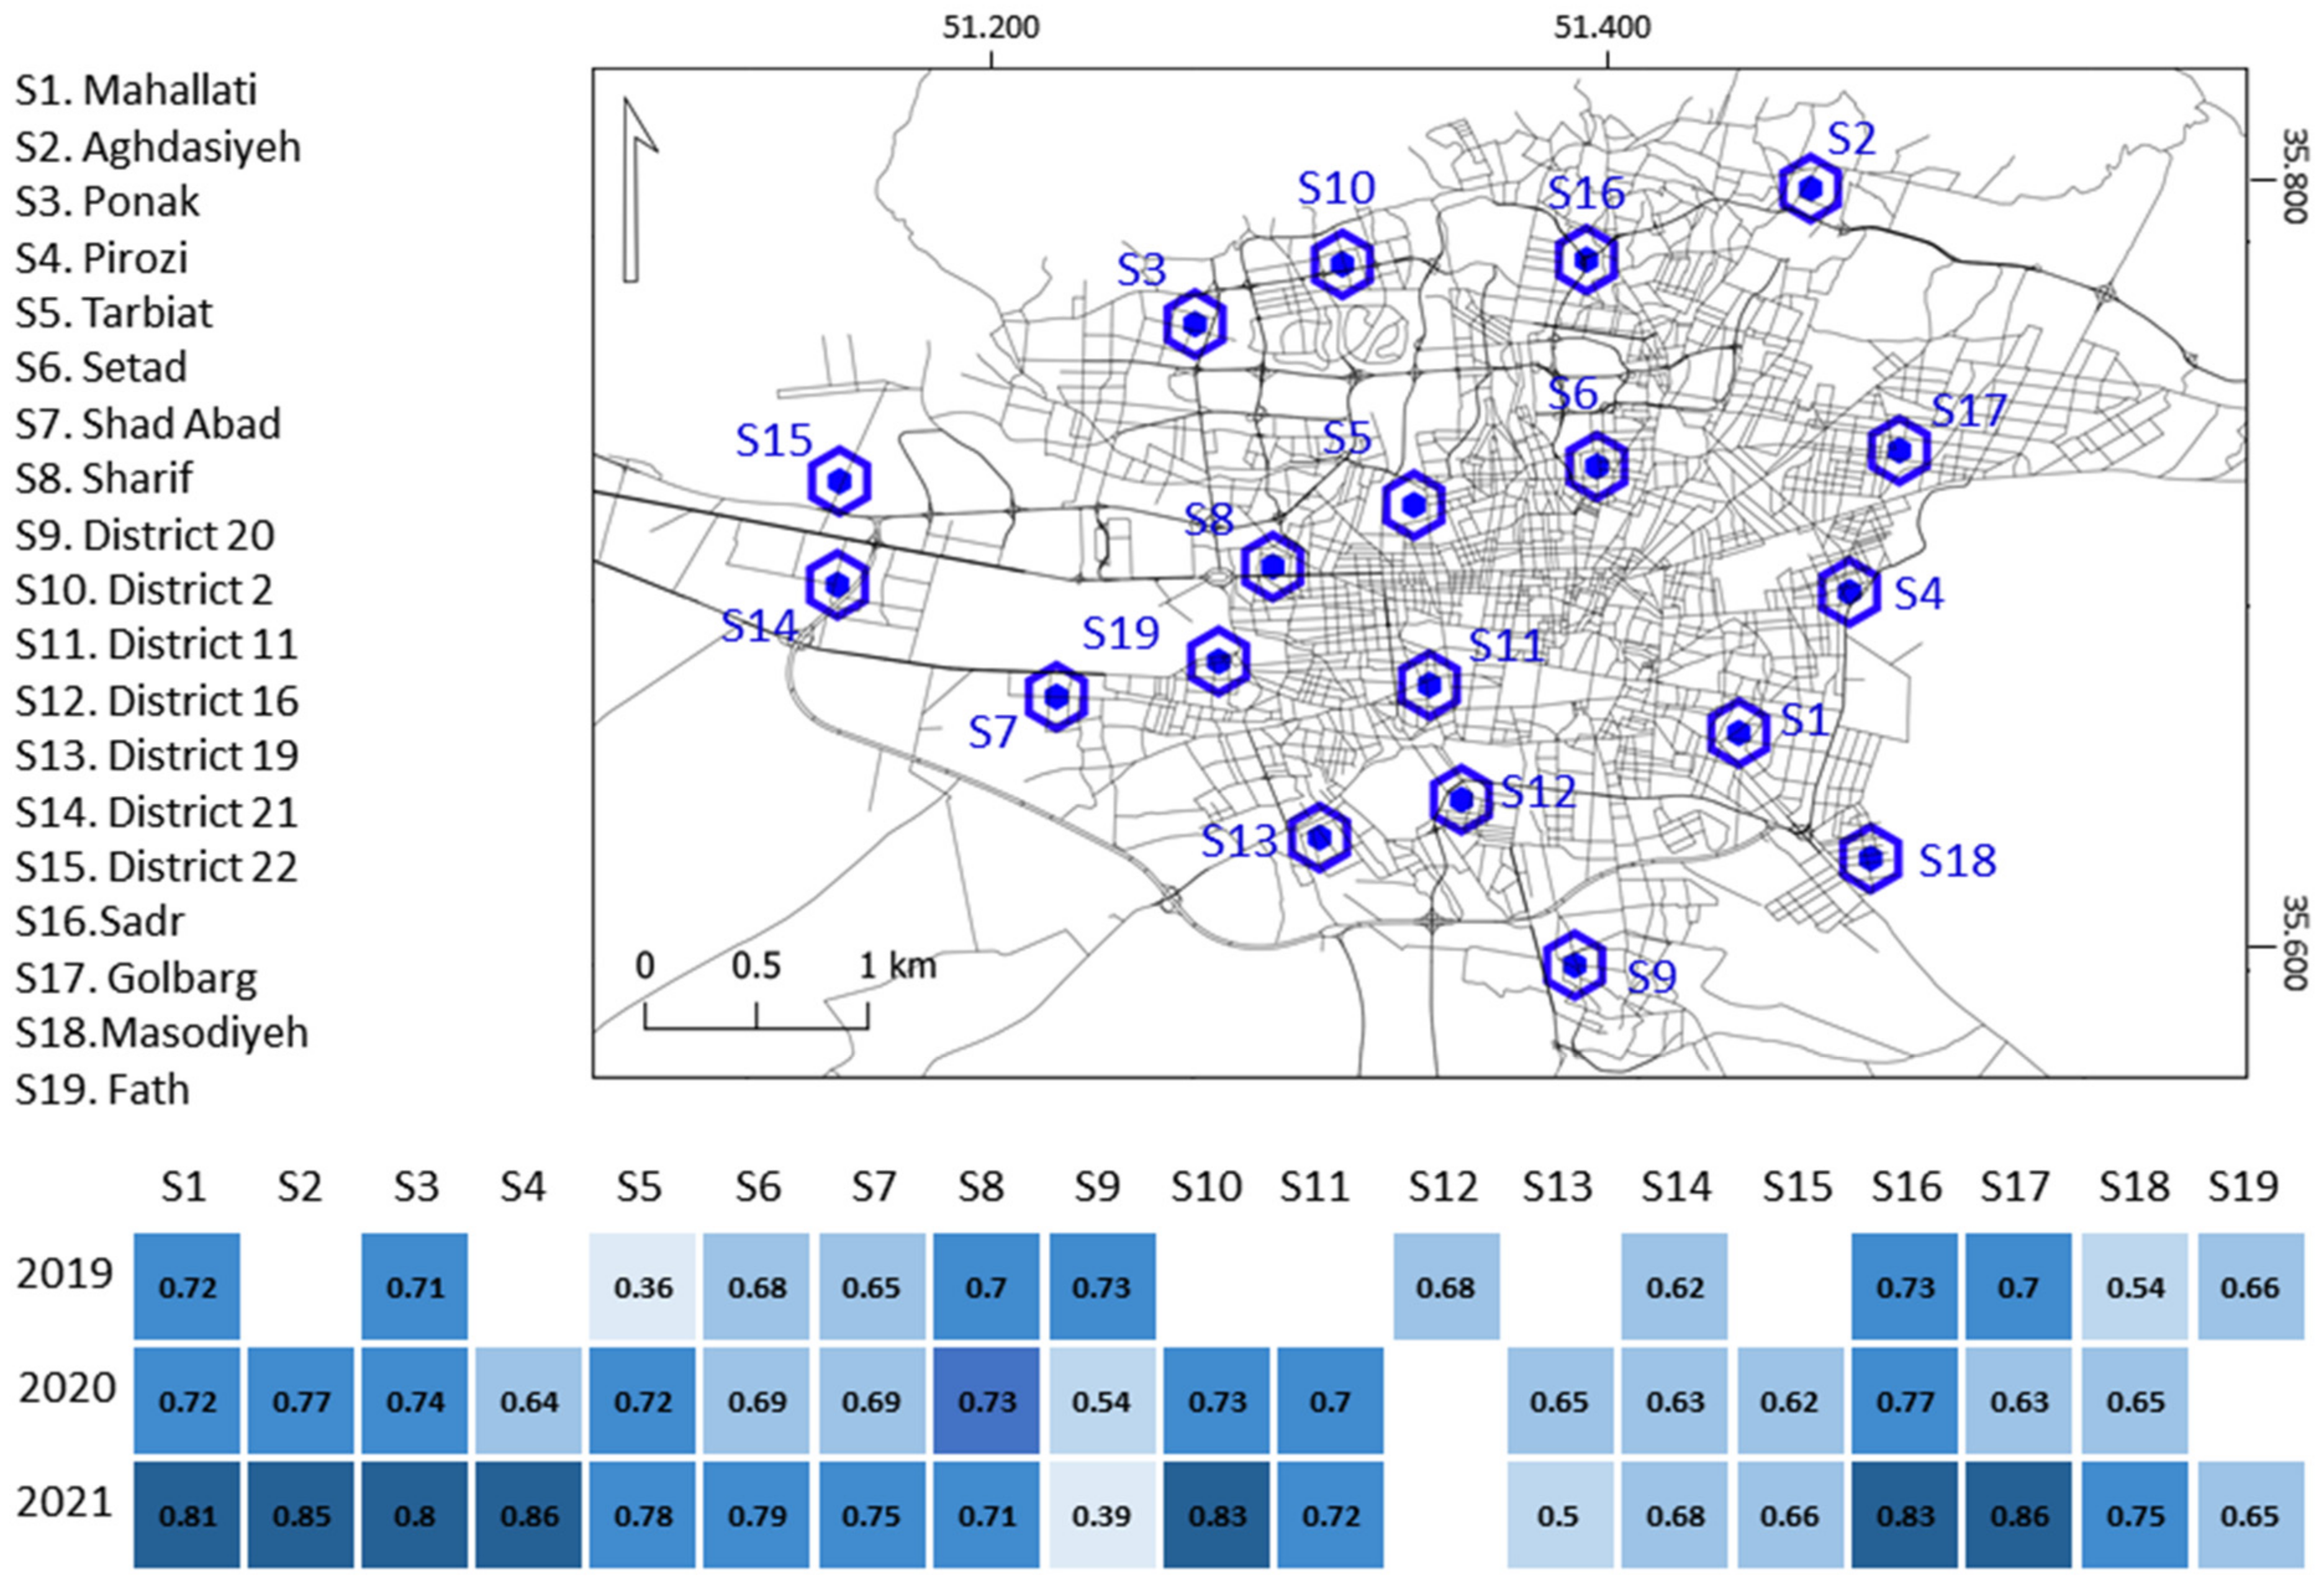
3.2. Sentinel-5P NO2 vs. Ground-Based Measurements
4. Conclusions
Author Contributions
Funding
Institutional Review Board Statement
Informed Consent Statement
Data Availability Statement
Acknowledgments
Conflicts of Interest
References
- Gautam, S. COVID-19: Air pollution remains low as people stay at home. Air Qual. Atmos. Health 2020, 13, 853–857. [Google Scholar] [CrossRef] [PubMed]
- Berman, J.D.; Ebisu, K. Changes in US air pollution during the COVID-19 pandemic. Sci. Total Environ. 2020, 739, 139864. [Google Scholar] [CrossRef] [PubMed]
- Contini, D.; Costabile, F. Does Air Pollution Influence COVID-19 Outbreaks? Atmosphere 2020, 11, 377. [Google Scholar] [CrossRef] [Green Version]
- Razavi-Termeh, S.V.; Sadeghi-Niaraki, A.; Choi, S.-M. Coronavirus disease vulnerability map using a geographic information system (GIS) from 16 April to 16 May 2020. Phys. Chem. Earth Parts A/B/C 2021, 103043. [Google Scholar] [CrossRef]
- Muhammad, S.; Long, X.; Salman, M. COVID-19 pandemic and environmental pollution: A blessing in disguise? Sci. Total Environ. 2020, 728, 138820. [Google Scholar] [CrossRef]
- Faustini, A.; Rapp, R.; Forastiere, F. Nitrogen dioxide and mortality: Review and meta-analysis of long-term studies. Eur. Respir. J. 2014, 44, 744–753. [Google Scholar] [CrossRef] [Green Version]
- He, M.Z.; Kinney, P.L.; Li, T.; Chen, C.; Sun, Q.; Ban, J.; Wang, J.; Liu, S.; Goldsmith, J.; Kioumourtzoglou, M.-A. Short-and intermediate-term exposure to NO2 and mortality: A multi-county analysis in China. Environ. Pollut. 2020, 261, 114165. [Google Scholar] [CrossRef]
- Burnett, R.; Chen, H.; Szyszkowicz, M.; Fann, N.; Hubbell, B.; Pope, C.A.; Apte, J.S.; Brauer, M.; Cohen, A.; Weichenthal, S. Global estimates of mortality associated with long-term exposure to outdoor fine particulate matter. Proc. Natl. Acad. Sci. USA 2018, 115, 9592–9597. [Google Scholar] [CrossRef] [Green Version]
- Zhu, Y.; Xie, J.; Huang, F.; Cao, L. Association between short-term exposure to air pollution and COVID-19 infection: Evidence from China. Sci. Total Environ. 2020, 727, 138704. [Google Scholar] [CrossRef]
- Zhang, X.; Tang, M.; Guo, F.; Wei, F.; Yu, Z.; Gao, K.; Jin, M.; Wang, J.; Chen, K. Associations between air pollution and COVID-19 epidemic during quarantine period in China. Environ. Pollut. 2021, 268, 115897. [Google Scholar] [CrossRef]
- Conticini, E.; Frediani, B.; Caro, D. Can atmospheric pollution be considered a co-factor in extremely high level of SARS-CoV-2 lethality in Northern Italy? Environ. Pollut. 2020, 261, 114465. [Google Scholar] [CrossRef] [PubMed]
- Travaglio, M.; Yu, Y.; Popovic, R.; Selley, L.; Leal, N.S.; Martins, L.M. Links between air pollution and COVID-19 in England. Environ. Pollut. 2021, 268, 115859. [Google Scholar] [CrossRef] [PubMed]
- Broomandi, P.; Karaca, F.; Nikfal, A.; Jahanbakhshi, A.; Tamjidi, M.; Kim, J.R. Impact of COVID-19 event on the air quality in Iran. Aerosol. Air Qual. Res. 2020, 20, 1793–1804. [Google Scholar] [CrossRef]
- Rad, A.K.; Shariati, M.; Zarei, M. The impact of COVID-19 on air pollution in Iran in the first and second waves with emphasis on the city of Tehran. J. Air Pollut. Health 2020, 5, 181–192. [Google Scholar]
- Wu, X.; Nethery, R.C.; Sabath, M.B.; Braun, D.; Dominici, F. Air pollution and COVID-19 mortality in the United States: Strengths and limitations of an ecological regression analysis. Sci. Adv. 2020, 6, eabd4049. [Google Scholar] [CrossRef] [PubMed]
- Naeger, A.R.; Murphy, K. Impact of COVID-19 Containment Measures on Air Pollution in California. Aerosol. Air Qual. Res. 2020, 20, 2025–2034. [Google Scholar] [CrossRef]
- Wyche, K.P.; Nichols, M.; Parfitt, H.; Beckett, P.; Gregg, D.J.; Smallbone, K.L.; Monks, P.S. Changes in ambient air quality and atmospheric composition and reactivity in the South East of the UK as a result of the COVID-19 lockdown. Sci. Total Environ. 2021, 755, 142526. [Google Scholar] [CrossRef]
- Fattorini, D.; Regoli, F. Role of the chronic air pollution levels in the COVID-19 outbreak risk in Italy. Environ. Pollut. 2020, 264, 114732. [Google Scholar] [CrossRef]
- Filippini, T.; Rothman, K.J.; Cocchio, S.; Narne, E.; Mantoan, D.; Saia, M.; Goffi, A.; Ferrari, F.; Maffeis, G.; Orsini, N. Associations between mortality from COVID-19 in two Italian regions and outdoor air pollution as assessed through tropospheric nitrogen dioxide. Sci. Total Environ. 2021, 760, 143355. [Google Scholar] [CrossRef]
- Querol, X.; Massagué, J.; Alastuey, A.; Moreno, T.; Gangoiti, G.; Mantilla, E.; Duéguez, J.J.; Escudero, M.; Monfort, E.; García-Pando, C.P. Lessons from the COVID-19 air pollution decrease in Spain: Now what? Sci. Total Environ. 2021, 779, 146380. [Google Scholar] [CrossRef]
- Briz-Redón, Á.; Belenguer-Sapiña, C.; Serrano-Aroca, Á. Changes in air pollution during COVID-19 lockdown in Spain: A multi-city study. J. Environ. Sci. 2021, 101, 16–26. [Google Scholar] [CrossRef] [PubMed]
- Cárcel-Carrasco, J.; Pascual-Guillamón, M.; Langa-Sanchis, J. Analysis of the effect of COVID-19 on air pollution: Perspective of the Spanish case. Environ. Sci. Pollut. Res. 2021, 28, 36880–36893. [Google Scholar] [CrossRef] [PubMed]
- Tobías, A.; Carnerero, C.; Reche, C.; Massagué, J.; Via, M.; Minguillón, M.C.; Alastuey, A.; Querol, X. Changes in air quality during the lockdown in Barcelona (Spain) one month into the SARS-CoV-2 epidemic. Sci. Total Environ. 2020, 726, 138540. [Google Scholar] [CrossRef]
- Shehzad, K.; Sarfraz, M.; Shah, S.G.M. The impact of COVID-19 as a necessary evil on air pollution in India during the lockdown. Environ. Pollut. 2020, 266, 115080. [Google Scholar] [CrossRef] [PubMed]
- Naqvi, H.R.; Datta, M.; Mutreja, G.; Siddiqui, M.A.; Naqvi, D.F.; Naqvi, A.R. Improved air quality and associated mortalities in India under COVID-19 lockdown. Environ. Pollut. 2021, 268, 115691. [Google Scholar] [CrossRef]
- Vadrevu, K.P.; Eaturu, A.; Biswas, S.; Lasko, K.; Sahu, S.; Garg, J.K.; Justice, C. Spatial and temporal variations of air pollution over 41 cities of India during the COVID-19 lockdown period. Sci. Rep. 2020, 10, 16574. [Google Scholar] [CrossRef]
- Karuppasamy, M.B.; Seshachalam, S.; Natesan, U.; Ayyamperumal, R.; Karuppannan, S.; Gopalakrishnan, G.; Nazir, N. Air pollution improvement and mortality rate during COVID-19 pandemic in India: Global intersectional study. Air Qual. Atmos. Health 2020, 13, 1375–1384. [Google Scholar] [CrossRef] [PubMed]
- Ju, M.J.; Oh, J.; Choi, Y.-H. Changes in air pollution levels after COVID-19 outbreak in Korea. Sci. Total Environ. 2021, 750, 141521. [Google Scholar] [CrossRef]
- Chen, K.; Wang, M.; Huang, C.; Kinney, P.L.; Anastas, P.T. Air pollution reduction and mortality benefit during the COVID-19 outbreak in China. Lancet Planet. Health 2020, 4, e210–e212. [Google Scholar] [CrossRef]
- Fan, C.; Li, Y.; Guang, J.; Li, Z.; Elnashar, A.; Allam, M.; de Leeuw, G. The impact of the control measures during the COVID-19 outbreak on air pollution in China. Remote Sens. 2020, 12, 1613. [Google Scholar] [CrossRef]
- Cole, M.A.; Ozgen, C.; Strobl, E. Air pollution exposure and Covid-19 in Dutch municipalities. Environ. Resour. Econ. 2020, 76, 581–610. [Google Scholar] [CrossRef] [PubMed]
- Adams, M.D. Air pollution in Ontario, Canada during the COVID-19 State of Emergency. Sci. Total Environ. 2020, 742, 140516. [Google Scholar] [CrossRef] [PubMed]
- Magazzino, C.; Mele, M.; Schneider, N. The relationship between air pollution and COVID-19-related deaths: An application to three French cities. Appl. Energy 2020, 279, 115835. [Google Scholar] [CrossRef] [PubMed]
- Debone, D.; da Costa, M.V.; Miraglia, S.G.E.K. 90 Days of COVID-19 Social Distancing and Its Impacts on Air Quality and Health in Sao Paulo, Brazil. Sustainability 2020, 12, 7440. [Google Scholar] [CrossRef]
- Nakada, L.Y.K.; Urban, R.C. COVID-19 pandemic: Impacts on the air quality during the partial lockdown in São Paulo state, Brazil. Sci. Total Environ. 2020, 730, 139087. [Google Scholar] [CrossRef] [PubMed]
- Gupta, A.; Bherwani, H.; Gautam, S.; Anjum, S.; Musugu, K.; Kumar, N.; Anshul, A.; Kumar, R. Air pollution aggravating COVID-19 lethality? Exploration in Asian cities using statistical models. Environ. Dev. Sustain. 2021, 23, 6408–6417. [Google Scholar] [CrossRef]
- Ghahremanloo, M.; Lops, Y.; Choi, Y.; Mousavinezhad, S. Impact of the COVID-19 outbreak on air pollution levels in East Asia. Sci. Total Environ. 2021, 754, 142226. [Google Scholar] [CrossRef] [PubMed]
- Ogen, Y. Assessing nitrogen dioxide (NO2) levels as a contributing factor to coronavirus (COVID-19) fatality. Sci. Total Environ. 2020, 726, 138605. [Google Scholar] [CrossRef] [PubMed]
- Skirienė, A.F.; Stasiškienė, Ž. COVID-19 and Air Pollution: Measuring Pandemic Impact to Air Quality in Five European Countries. Atmosphere 2021, 12, 290. [Google Scholar] [CrossRef]
- Pozzer, A.; Dominici, F.; Haines, A.; Witt, C.; Münzel, T.; Lelieveld, J. Regional and global contributions of air pollution to risk of death from COVID-19. Cardiovasc. Res. 2020, 116, 2247–2253. [Google Scholar] [CrossRef]
- Zambrano-Monserrate, M.A.; Ruano, M.A.; Sanchez-Alcalde, L. Indirect effects of COVID-19 on the environment. Sci. Total Environ. 2020, 728, 138813. [Google Scholar] [CrossRef] [PubMed]
- Albayati, N.; Waisi, B.; Al-Furaiji, M.; Kadhom, M.; Alalwan, H. Effect of COVID-19 on air quality and pollution in different countries. J. Transp. Health 2021, 21, 101061. [Google Scholar] [CrossRef] [PubMed]
- Singh, R.K.; Drews, M.; De la Sen, M.; Srivastava, P.K.; Trisasongko, B.H.; Kumar, M.; Pandey, M.K.; Anand, A.; Singh, S.S.; Pandey, A.K.; et al. Highlighting the compound risk of COVID-19 and environmental pollutants using geospatial technology. Sci. Rep. 2021, 11, 8363. [Google Scholar] [CrossRef] [PubMed]
- Mele, M.; Magazzino, C. Pollution, economic growth, and COVID-19 deaths in India: A machine learning evidence. Environ. Sci. Pollut. Res. 2021, 28, 2669–2677. [Google Scholar] [CrossRef] [PubMed]
- Mollalo, A.; Vahedi, B.; Rivera, K.M. GIS-based spatial modeling of COVID-19 incidence rate in the continental United States. Sci. Total Environ. 2020, 728, 138884. [Google Scholar] [CrossRef]
- Marinello, S.; Butturi, M.A.; Gamberini, R. How changes in human activities during the lockdown impacted air quality parameters: A review. Environ. Prog. Sustain. Energy 2021, 40, e13672. [Google Scholar] [CrossRef]
- Borhani, F.; Shafiepour Motlagh, M.; Stohl, A.; Rashidi, Y.; Ehsani, A.H. Changes in short-lived climate pollutants during the COVID-19 pandemic in Tehran, Iran. Environ. Monit. Assess. 2021, 193, 331. [Google Scholar] [CrossRef]
- Aghashariatmadari, Z. The effects of COVID-19 pandemic on the air pollutants concentration during the lockdown in Tehran, Iran. Urban Clim. 2021, 38, 100882. [Google Scholar] [CrossRef]
- Tehrani, N.A.; Mollalo, A.; Farhanj, F.; Pahlevanzadeh, N.; Janalipour, M. Time-Series Analysis of COVID-19 in Iran: A Remote Sensing Perspective. In COVID-19 Pandemic, Geospatial Information, and Community Resilience; CRC Press: Boca Raton, FL, USA, 2021; pp. 277–290. ISBN 1003181597. [Google Scholar]
- Ialongo, I.; Virta, H.; Eskes, H.; Hovila, J.; Douros, J. Comparison of TROPOMI/Sentinel-5 Precursor NO 2 observations with ground-based measurements in Helsinki. Atmos. Meas. Tech. 2020, 13, 205–218. [Google Scholar] [CrossRef] [Green Version]
- Vîrghileanu, M.; Săvulescu, I.; Mihai, B.-A.; Nistor, C.; Dobre, R. Nitrogen Dioxide (NO2) Pollution Monitoring with Sentinel-5P Satellite Imagery over Europe during the Coronavirus Pandemic Outbreak. Remote Sens. 2020, 12, 3575. [Google Scholar] [CrossRef]
- Sari, N.M.; Kuncoro, M.N.S. Monitoring of CO, NO2 and SO2 Levels During the COVID-19 Pandemic in Iran Using Remote Sensing Imagery. Geogr. Environ. Sustain. 2021, 14, 183–191. [Google Scholar] [CrossRef]
- Loyola, D.G.; Gimeno García, S.; Lutz, R.; Argyrouli, A.; Romahn, F.; Spurr, R.J.D.; Pedergnana, M.; Doicu, A.; Molina García, V.; Schüssler, O. The operational cloud retrieval algorithms from TROPOMI on board Sentinel-5 Precursor. Atmos. Meas. Tech. 2018, 11, 409–427. [Google Scholar] [CrossRef] [Green Version]
- Gorelick, N.; Hancher, M.; Dixon, M.; Ilyushchenko, S.; Thau, D.; Moore, R. Google Earth Engine: Planetary-scale geospatial analysis for everyone. Remote Sens. Environ. 2017, 202, 18–27. [Google Scholar] [CrossRef]
- Kumar, L.; Mutanga, O. Google Earth Engine Applications Since Inception: Usage, Trends, and Potential. Remote Sens. 2018, 10, 1509. [Google Scholar] [CrossRef] [Green Version]
- Amani, M.; Kakooei, M.; Moghimi, A.; Ghorbanian, A.; Ranjgar, B.; Mahdavi, S.; Davidson, A.; Fisette, T.; Rollin, P.; Brisco, B.; et al. Application of Google Earth Engine Cloud Computing Platform, Sentinel Imagery, and Neural Networks for Crop Mapping in Canada. Remote Sens. 2020, 12, 3561. [Google Scholar] [CrossRef]
- Mehravar, S.; Amani, M.; Moghimi, A.; Javan, F.D.; Samadzadegan, F.; Ghorbanian, A.; Stein, A.; Mohammadzadeh, A.; Mirmazloumi, S.M. Temperature-Vegetation-soil Moisture-Precipitation Drought Index (TVMPDI); 21-year drought monitoring in Iran using satellite imagery within Google Earth Engine. Adv. Space Res. 2021, 68, 4573–4593. [Google Scholar] [CrossRef]
- Hui, F.; Xu, B.; Huang, H.; Yu, Q.; Gong, P. Modelling spatial-temporal change of Poyang Lake using multitemporal Landsat imagery. Int. J. Remote Sens. 2008, 29, 5767–5784. [Google Scholar] [CrossRef]
- Amani, M.; Ghorbanian, A.; Ahmadi, S.A.; Kakooei, M.; Moghimi, A.; Mirmazloumi, S.M.; Alizadeh Moghaddam, S.H.; Mahdavi, S.; Ghahremanloo, M.; Parsian, S.; et al. Google Earth Engine Cloud Computing Platform for Remote Sensing Big Data Applications: A Comprehensive Review. IEEE J. Sel. Top. Appl. Earth Obs. Remote Sens. 2020, 13, 5326–5350. [Google Scholar] [CrossRef]
- Butz, A.; Galli, A.; Hasekamp, O.; Landgraf, J.; Tol, P.; Aben, I. TROPOMI aboard Sentinel-5 Precursor: Prospective performance of CH4 retrievals for aerosol and cirrus loaded atmospheres. Remote Sens. Environ. 2012, 120, 267–276. [Google Scholar] [CrossRef]


| Source | Study Area | Period | Atmospheric Gases Studied | Data | Variations in Concentrations |
|---|---|---|---|---|---|
| [2] | US | 2017–2020 | NO2, PM2.5 | Air quality station | A 25.5% reduction with an absolute decrease of 4.8 ppb PM2.5. |
| [16] | US | 2019–2020 | NO2 | Sentinel-5 (TROPOMI) | The concentration of NO2 reduced by 20–40% in California during the COVID-19 lockdown. |
| [12] | England | 2018–2019 | PM2.5, NO2, NO, and O3 | Air quality station | An increase of 1 m3 in the long-term average of PM2.5 was associated with a 12% increase in COVID-19 cases. |
| [18] | Italy | 2010–2020 | NO2, O3, PM10/PM2.5 | Air quality station | Long-term air-quality data correlate with COVID-19 in the Italian provinces. |
| [22] | Spain | 2019–2020 | NO2, PM10 | Sentinel-5 (TROPOMI) | After the lockdown, the PM10 was reduced by 88.89%, 87.5%, 70%, 86.8%, and 87.8%, respectively, in Valencia, Madrid, Barcelona, Sevilla, and Bilbao. The same tendency was shown for NO2. |
| [24] | India | 2020 | NO2 | Sentinel-5 (TROPOMI) | The NO2 value decreased by 40–50% in Mumbai and Delhi compared to the pervious year. |
| [28] | Korea | 2020 | NO2, CO, PM10/PM2.5 | Air quality station | In March 2020, the mean levels of PM2.5, PM10, NO2, and CO were decreased by 16.98 μg/m3, 21.61 μg/m3, 4.16 ppb, and 0.09 ppm compared to the same period of the previous year. |
| [9] | China | 2020 | NO2, SO2, CO, O3, PM2.5/PM10 | Online platform and meteorological data | After lockdown, the PM2.5, PM10, NO2, and O3 increased by 10 μg/m3. |
| [30] | China | 2017–2020 | NO2, SO2, CO, O3, PM2.5/PM10, AOD | Sentinel-5 (TROPOMI), MODIS | After the Spring Festival, the NO2 and SO2 concentrations decreased, and then began to increase after a few days, except in 2020 when they remained low. CO, PM2.5, and PM10 concentrations also decreased during the Spring Festival, but not as much as SO2 concentrations. |
| [32] | Canada | 2015–2020 | NO2, O3, PM2.5 | Air quality station | There is some evidence that ozone concentrations are decreasing. The concentrations of nitrogen dioxide and nitrogen oxides appear to be declining. |
| [34] | Brazil | 2019–2020 | NO2, PM2.5/PM10 | Sentinel-5 (TROPOMI) | The PM2.5, PM10, and NO2 levels were reduced by 45%, 46%, and 58%, respectively, compared to the control period in 2019. |
| TROPOMI Products | Processing Levels | Unit | Pixel Size | Source |
|---|---|---|---|---|
| nitrogendioxide_tropospheric_column_count | Level 2 | 0.01 arc degrees | Sentinel-5 variables https://developers.google.com/earth-engine/datasets/tags/tropomi (accessed on 10 January 2022) | |
| carbonmonoxide_total_column_count | Level 2 | 0.01 arc degrees |
Publisher’s Note: MDPI stays neutral with regard to jurisdictional claims in published maps and institutional affiliations. |
© 2022 by the authors. Licensee MDPI, Basel, Switzerland. This article is an open access article distributed under the terms and conditions of the Creative Commons Attribution (CC BY) license (https://creativecommons.org/licenses/by/4.0/).
Share and Cite
Shami, S.; Ranjgar, B.; Bian, J.; Khoshlahjeh Azar, M.; Moghimi, A.; Amani, M.; Naboureh, A. Trends of CO and NO2 Pollutants in Iran during COVID-19 Pandemic Using Timeseries Sentinel-5 Images in Google Earth Engine. Pollutants 2022, 2, 156-171. https://doi.org/10.3390/pollutants2020012
Shami S, Ranjgar B, Bian J, Khoshlahjeh Azar M, Moghimi A, Amani M, Naboureh A. Trends of CO and NO2 Pollutants in Iran during COVID-19 Pandemic Using Timeseries Sentinel-5 Images in Google Earth Engine. Pollutants. 2022; 2(2):156-171. https://doi.org/10.3390/pollutants2020012
Chicago/Turabian StyleShami, Siavash, Babak Ranjgar, Jinhu Bian, Mahdi Khoshlahjeh Azar, Armin Moghimi, Meisam Amani, and Amin Naboureh. 2022. "Trends of CO and NO2 Pollutants in Iran during COVID-19 Pandemic Using Timeseries Sentinel-5 Images in Google Earth Engine" Pollutants 2, no. 2: 156-171. https://doi.org/10.3390/pollutants2020012
APA StyleShami, S., Ranjgar, B., Bian, J., Khoshlahjeh Azar, M., Moghimi, A., Amani, M., & Naboureh, A. (2022). Trends of CO and NO2 Pollutants in Iran during COVID-19 Pandemic Using Timeseries Sentinel-5 Images in Google Earth Engine. Pollutants, 2(2), 156-171. https://doi.org/10.3390/pollutants2020012