Proceeding Paper

A Semi-Automated Framework for Standardized Vertebral Measurement with Enhanced Reproducibility in Lumbar Spine MRI Analysis †

by
Muhammad Hasan Masrur
*,
Rana Talha Khalid
,
Khair Ul Wara
,
Abdul Alber
,
Faizan Ahmad
,
Zainab Bibi
and
Jawad Hussain
Department of Biomedical Engineering, Riphah International University, Lahore 54000, Pakistan
*
Author to whom correspondence should be addressed.
Presented at the 3rd International Conference on Modern Technologies in Mechanical & Materials Engineering (MTME2025), Topi, Pakistan, 16–17 April 2025.
Mater. Proc. 2025, 23(1), 5; https://doi.org/10.3390/materproc2025023005
Published: 30 July 2025

Abstract

A semi-automated framework for vertebral measurement has been developed to overcome clinical limitations of subjectivity and poor reproducibility in spinal assessment. The framework integrates watershed segmentation with level-set functions and deterministic cylindrical modeling to convert pixel-based measurements to physical dimensions, achieving 2% reproducibility error. Interactive region-of-interest selection enables the effective handling of multi-vertebrae cases while preserving clinical expertise input. Validation using a lumbar spine MRI dataset on 515 patients confirms measurements fall within established anatomical parameters for L3–L5 vertebrae. This methodology provides a transparent, reproducible approach for standardized vertebral assessment that balances automation with clinical reasoning, offering immediate implementation potential without the computational demands and regulatory challenges associated with complex AI systems.

1. Introduction

Measuring vertebral body dimensions accurately is critical to the diagnosis and treatment of spinal disorders. However, traditional measurement methods are subjective, have high inter-observer variability, and have low reproducibility. This variability greatly affects diagnostic accuracy and treatment efficacy, and ultimately, both of these are detrimental to clinical workflow [1,2]. Artificial intelligence is being considered as one solution to this variability; however, there are significant barriers to implementation in the clinical environments, including regulatory hurdles, black-box decision making, computational needs for expensive hardware, and applicability of tools that require substantial validation before clinical implementation [3,4]. In addition, AI may still struggle with anatomy and pathology variability due to the population’s anatomical variation, and it requires large, diverse datasets for learning, which may not always be available in some clinical settings. Therefore, these challenges call for an immediate level bridge approach that considers a level of automation and clinical reasoning to achieve accuracy and practical implementation [5].
This study tackles the abovementioned concerns through a meticulously designed framework implemented on MATLAB R2024b. The framework provides an image conversion along with advanced image processing methods that include grayscale normalization, CLAHE contrast enhancement, adaptive thresholding, and watershed segmentation that uses level-set functions to detect the edges of the structures. Furthermore, it also uses a cylindrical mathematical model to convert all pixel-based measurements into meaningful physical measurements using the pixel spacing metadata to derive vertebral height, width, and area. This offers a balanced approach between automated processing and clinical knowledge, which helps to navigate anatomy variations, creating a standardized and reproducible method. The framework uses a semi-automated process that incorporates automated processing and allows the user to engage with the process using targeted, interactive identification of the region-of-interest (ROI), especially in images containing multiple vertebrae.
The novelty of this work comes from a practical semi-automated approach that balances the precision of a manual approach with the efficiency of a computational one. It solves multi-vertebrae cases via interactive ROI selection while activating an automated algorithm to tackle more challenging boundary detection problems. The validation shows this method has proven performance, with a 2% reproducibility error of results. Following DICOM standards means this framework has the potential to seamlessly integrate with existing clinical systems to facilitate the clinical improvement of diagnostic accuracy without the barriers to implementing complex AI systems.

2. Methodology

2.1. Dataset

The Lumbar Spine MRI Dataset consists of 48,345 anonymized MRI slices from 515 symptomatic patients. The images were of 12-bit precision, 320 × 320 in resolution, and taken in sagittal and axial views of the bottom 3 vertebral and intervertebral disks [6]. This dataset was valuable for testing this framework as it had sufficient anatomical coverage at consistent acquisition parameters, allowing us to use pixel–physical dimension conversion, which is needed for our approach. The dataset included multi-vertebrae, which allowed for direct testing of our ROI selection process through multi-vertebrae cases. The high image quality of 12-bit precision images also allows for better contrast detection than a standard 8-bit stacked image can provide [7,8].

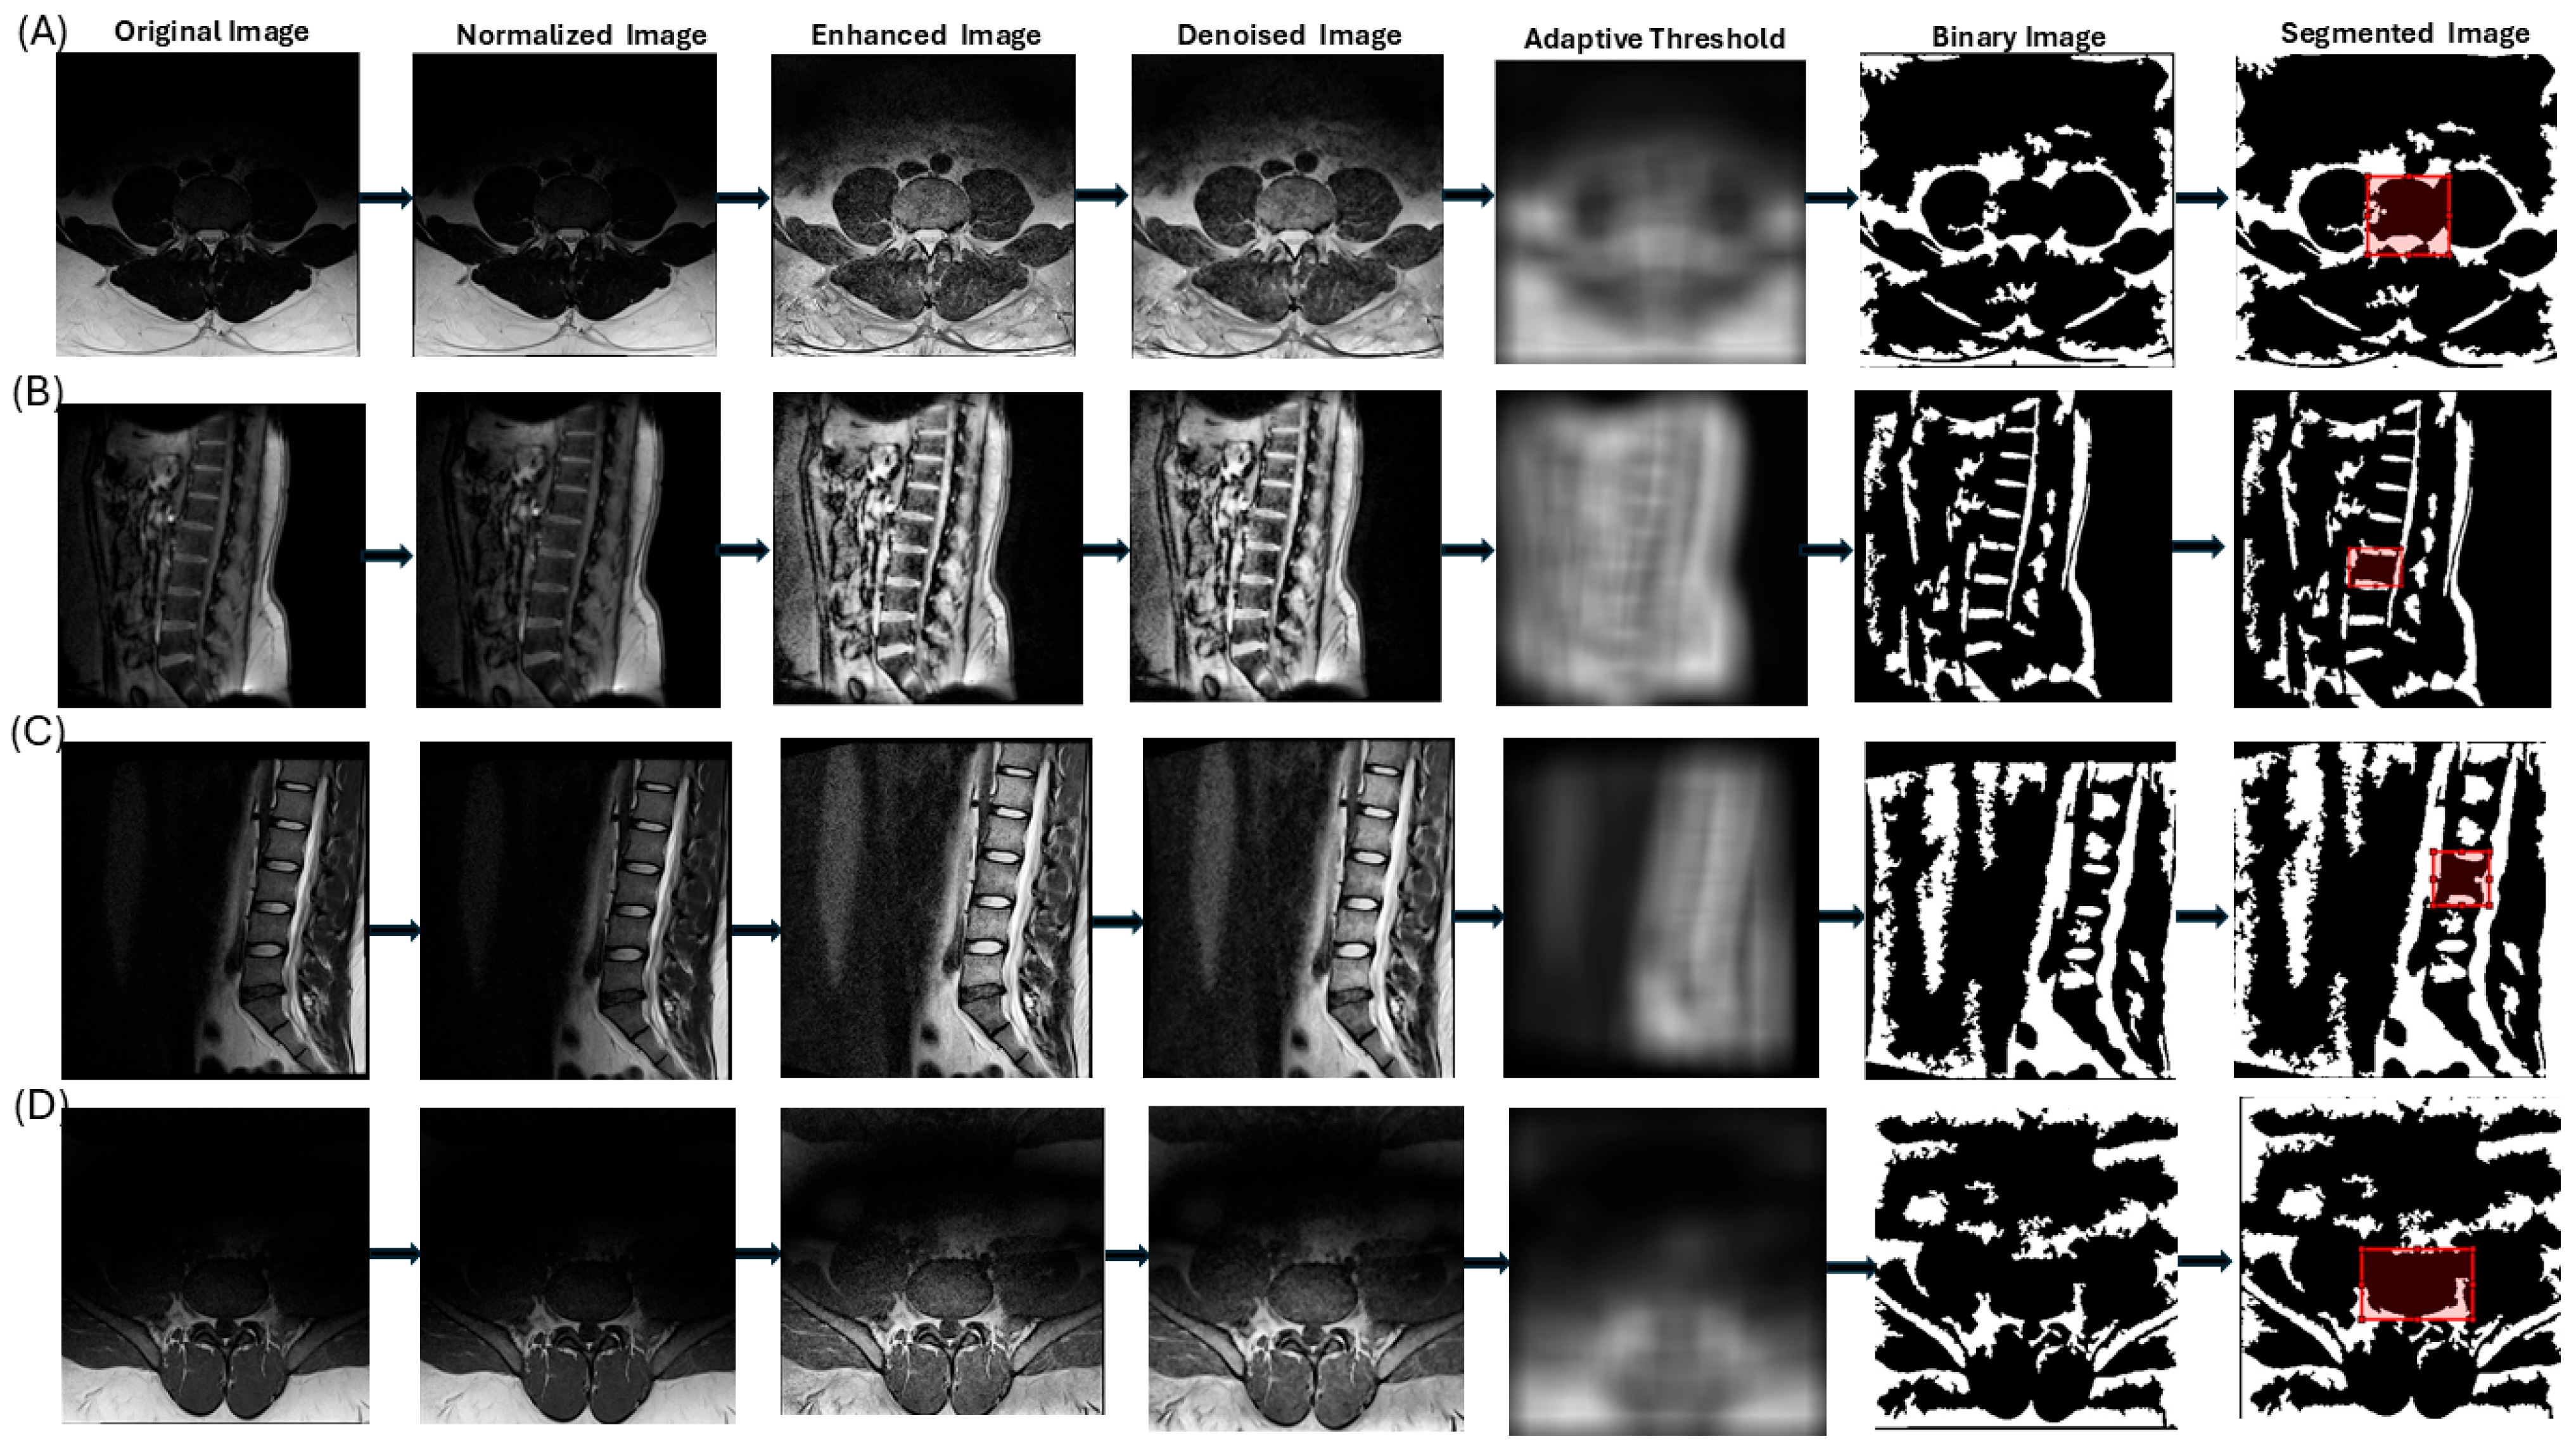
2.2. File Handling and Preprocessing

The preprocessing pipeline begins with the conversion of IMA files to DICOM. This is followed by a series of preprocessing techniques to address imaging challenges like noise, variability in contrast, and delineating structural boundaries in the images.
This also allows meta-data such as pixel spacing and slice thickness to be extracted, both of which are needed for changing pixels to physical units such as millimeters. Afterward, the image is changed to grayscale to concentrate on differences in intensity and not differences in color channels, which are unnecessary for vertebral analysis. Grayscale images are normalized to have an original intensity range of 0 to 1. Normalizing the intensity range allows differences in intensity scales across images to be accounted for, giving a standard for the next processing steps. This step is rationalized because the intensity values should not be confounded by scaling differences across images since equal image enhancement and segmentation are applied for multiple images.
Segmentation begins with a method of adaptive thresholding that determines a local threshold value for each pixel based on the intensity of its neighboring pixels. The returned binary image then undergoes another round of processing using watershed thresholding in order to accomplish accurate and precise boundary separation of all vertical structures. First, applying a distance transform to the binary image allows for measurement of the distance to the nearest background pixel for each foreground pixel, producing a distance map in which pixel intensity represents the height level at the center of each vertebral body. The distance map is subsequently inverted, and the watershed algorithm can then be implemented to flood the image from local minima (which are peaks in the inverted distance map). It produces an outer boundary on the flood where the two flooded regions meet each other. Watershed thresholding is ideal for imaging of the lumbar spine as it eliminates the over-segmentation characteristics associated with the vertebral body, as vertebral bodies often have thin or irregular boundaries, and properly separates adjacent structures. Morphological operations follow to refine the segmented regions: small noise artifacts are removed, gaps in boundaries are closed, small objects below a size threshold are eliminated, and holes within vertebral structures are filled to create solid regions for measurement. These steps preserve the integrity of vertebral bodies and remove artifacts that could skew measurements.
The preprocessed image is then presented for user interaction for the selection of an ROI, which is a user-defined rectangular area that includes one of the vertebral bodies of interest. A mask based on this ROI is created and applied (via a logical AND operation) to the segmented image to separate the segmented vertebral structure in that specific area. This step is intended to confine the analyses to a single relevant vertebral body as informed by human intelligence, especially in cases where multiple vertebrae are present in the image. Manual intervention is critical to identifying the vertebrae of interest. Furthermore, the ROI drawn in the form of a rectangle is a rough estimation for the framework as it applies watershed thresholding with adaptive thresholding and morphological operations for reliable segmentation to trace the more complex vertebral boundaries. The confining pipeline of standardization of data, image contrast enhancement, noise reduction, and segmentation, and the interaction for ROI selection provide an analogous binary mask of the vertebral body and surrounding tissues for properly quantifying vertebral parameters. The pseudo code for the implementation of this pipeline is given in the following Table 1.
Figure 1 illustrates the step-by-step processing of images from various patients with differing anatomical features. Images A and D are captured in the coronal plane and depict only a single vertebra. In contrast, images B and C are displayed in the sagittal plane, showcasing multiple vertebrae. This difference can create challenges for automated ROI detection systems, which may struggle to identify the accurate ROI in such cases. Therefore, there is a need for a manual and interactive ROI selection system, which is utilized by the proposed system.

2.3. Mathematical Modeling

In order to transform the preprocessed region of interest (ROI) from DICOM images of the lumbar spine into physically measurable data, a solid mathematical model is necessary. This model converts pixel-based values into physical units that allow for accurate assessment of vertebral body and intervertebral disk metrics such as height, width, area, and volume. This is in contrast to AI-based systems, which can have variability based on training data and may require a significant amount of computing power to be effective. In the proposed methodology, we rely on manual ROI selection in conjunction with advanced image processing and deterministic mathematical modeling. Relying on a deterministic mathematical model helps with reproducibility, as previously stated, eliminates the deep reliance on the size of data requiring training, and adds transparency about measurement. By using spatial calibration methods alongside metadata, like pixel spacing and slice thickness, a high coefficient of variation in measuring vertebral metrics is observed.
The process of mathematical modeling is initiated by defining the link between pixel dimensions and physical units, using metadata obtained from the DICOM files, for example, pixel spacing in the x (px) and y (py) dimensions (in mm/pixel) and slice thickness (tz, in mm). The physical measurement of the segmented vertebra or disk region is computed as follows, within the ROI:
Physical   Height = h p i x e l p y
Physical   Width = w p i x e l · p x
Physical Depth = dpixel · tz
Here, hpixel, wpixel, and dpixel represent the height, width, and depth in pixels of the segmented region, respectively. In Equation (1), the pixel height of the vertebral body or disk is converted into millimeters, scaling with the y-direction pixel spacing to ensure vertical representation is consistent with the anatomical orientation of the lumbar spine. In the same way, Equation (2) converts pixel width into a measure of physical width using x-direction pixel spacing to ensure accurate representation of the horizontal extent of the structure. Equation (3) considers depth along the z-axis and scales by slice thickness. This step is crucial in volumetric weighting analysis across multiple slices. This direct mapping from pixels to millimeters leverages the DICOM metadata to guarantee that the measurements will be anatomically valid and consistent in comparisons across imaging systems, which represents a significant advancement over earlier approaches.
The watershed segmentation algorithm, used prior to the modeling step, separates the ROI into independent regions that correspond to vertebral bodies and intervertebral disks. To improve the boundaries of these regions further, a level-set function ϕ(x,y) is utilized in which the zero-level set is the boundary between the object and the background:
ϕ ( x ,   y ) = p o s i t i i v e       i n s i d e   t h e   o b j e c t   ( v e r t e b r a   o r   d i s c ) n e g a t i v e         o u t s i d e   t h e   o b j e c t   ( b a c k g r o u n d )
The level-set technique, as represented in Equation (4), is a mathematical method for modeling the delineation seed for the segmented boundaries, allowing the precise detection of edges for vertebrae. This is an improvement over previous systems that relied on thresholding to model the segmented edges of vertebrae and often could not accurately model irregular boundaries or overlapping structures outlined in lumbar spine imaging. The level-set model enables the evolution of the level-set function to ensure that the regions are correctly delineated to represent true anatomical boundaries in situations of low contrast and complex geometries.
For area and volume quantification, the vertebral body or disk is approximated as a cylindrical shape, divided along the z-axis into N sections of equal height Δh, where the total height H is given as follows:
H = N·Δh
The volume of each cylindrical section is computed based on its radius ri, which varies depending on the segmentation at each slice:
V i = π r i 2 Δ h
The total volume Vtotal is the sum of all sectional volumes:
V t o t a l = i = 1 N π r i 2 Δ h
The cross-sectional area at each slice level, denoted Ai, is approximated from the segmented boundary, and the total area Atotal is calculated as follows:
A t o t a l = i = 1 N A i p x p y
The volume of each cylindrical section is modeled in Equation (6) to account for varying radius across slices. This is necessary to accurately represent the irregular shape of the vertebral body and disks. The summed volumes of the sections yield the total volume, as modeled in Equation (7). Equation (8) calculates the total area by multiplying the pixel-based area by the pixel spacing so that the area measurement reflects the area of the structure. Compared to prior systems, which typically simplified to area or eliminated volume, this model allows for a more accurate representation of the geometry of the structure in three dimensions.
The final values are presented along with unique image IDs for traceability and validated against values in the literature to ensure accuracy, which is considered a reasonable basis for clinical assessment purposes. The expected output includes the original DICOM images, segmented images, and related metadata, along with quantitative measures. This is important for the advancement of clinical research on spine health. The use of level-set functions and approximations to cylindrical values as set forth in Equations (4)–(8) represents paradigms that hold reasonable levels of accuracy in quantifying measurements and can withstand changing quality of images. In addition, this approach can also be applied to either sagittal or coronal planes, using metadata pixel spacing and slice thickness to ensure consistent spatial calibration to each type of imaging prior to considering each quantified value, thereby measuring important vertebral parameters regardless of the plane of acquisition.

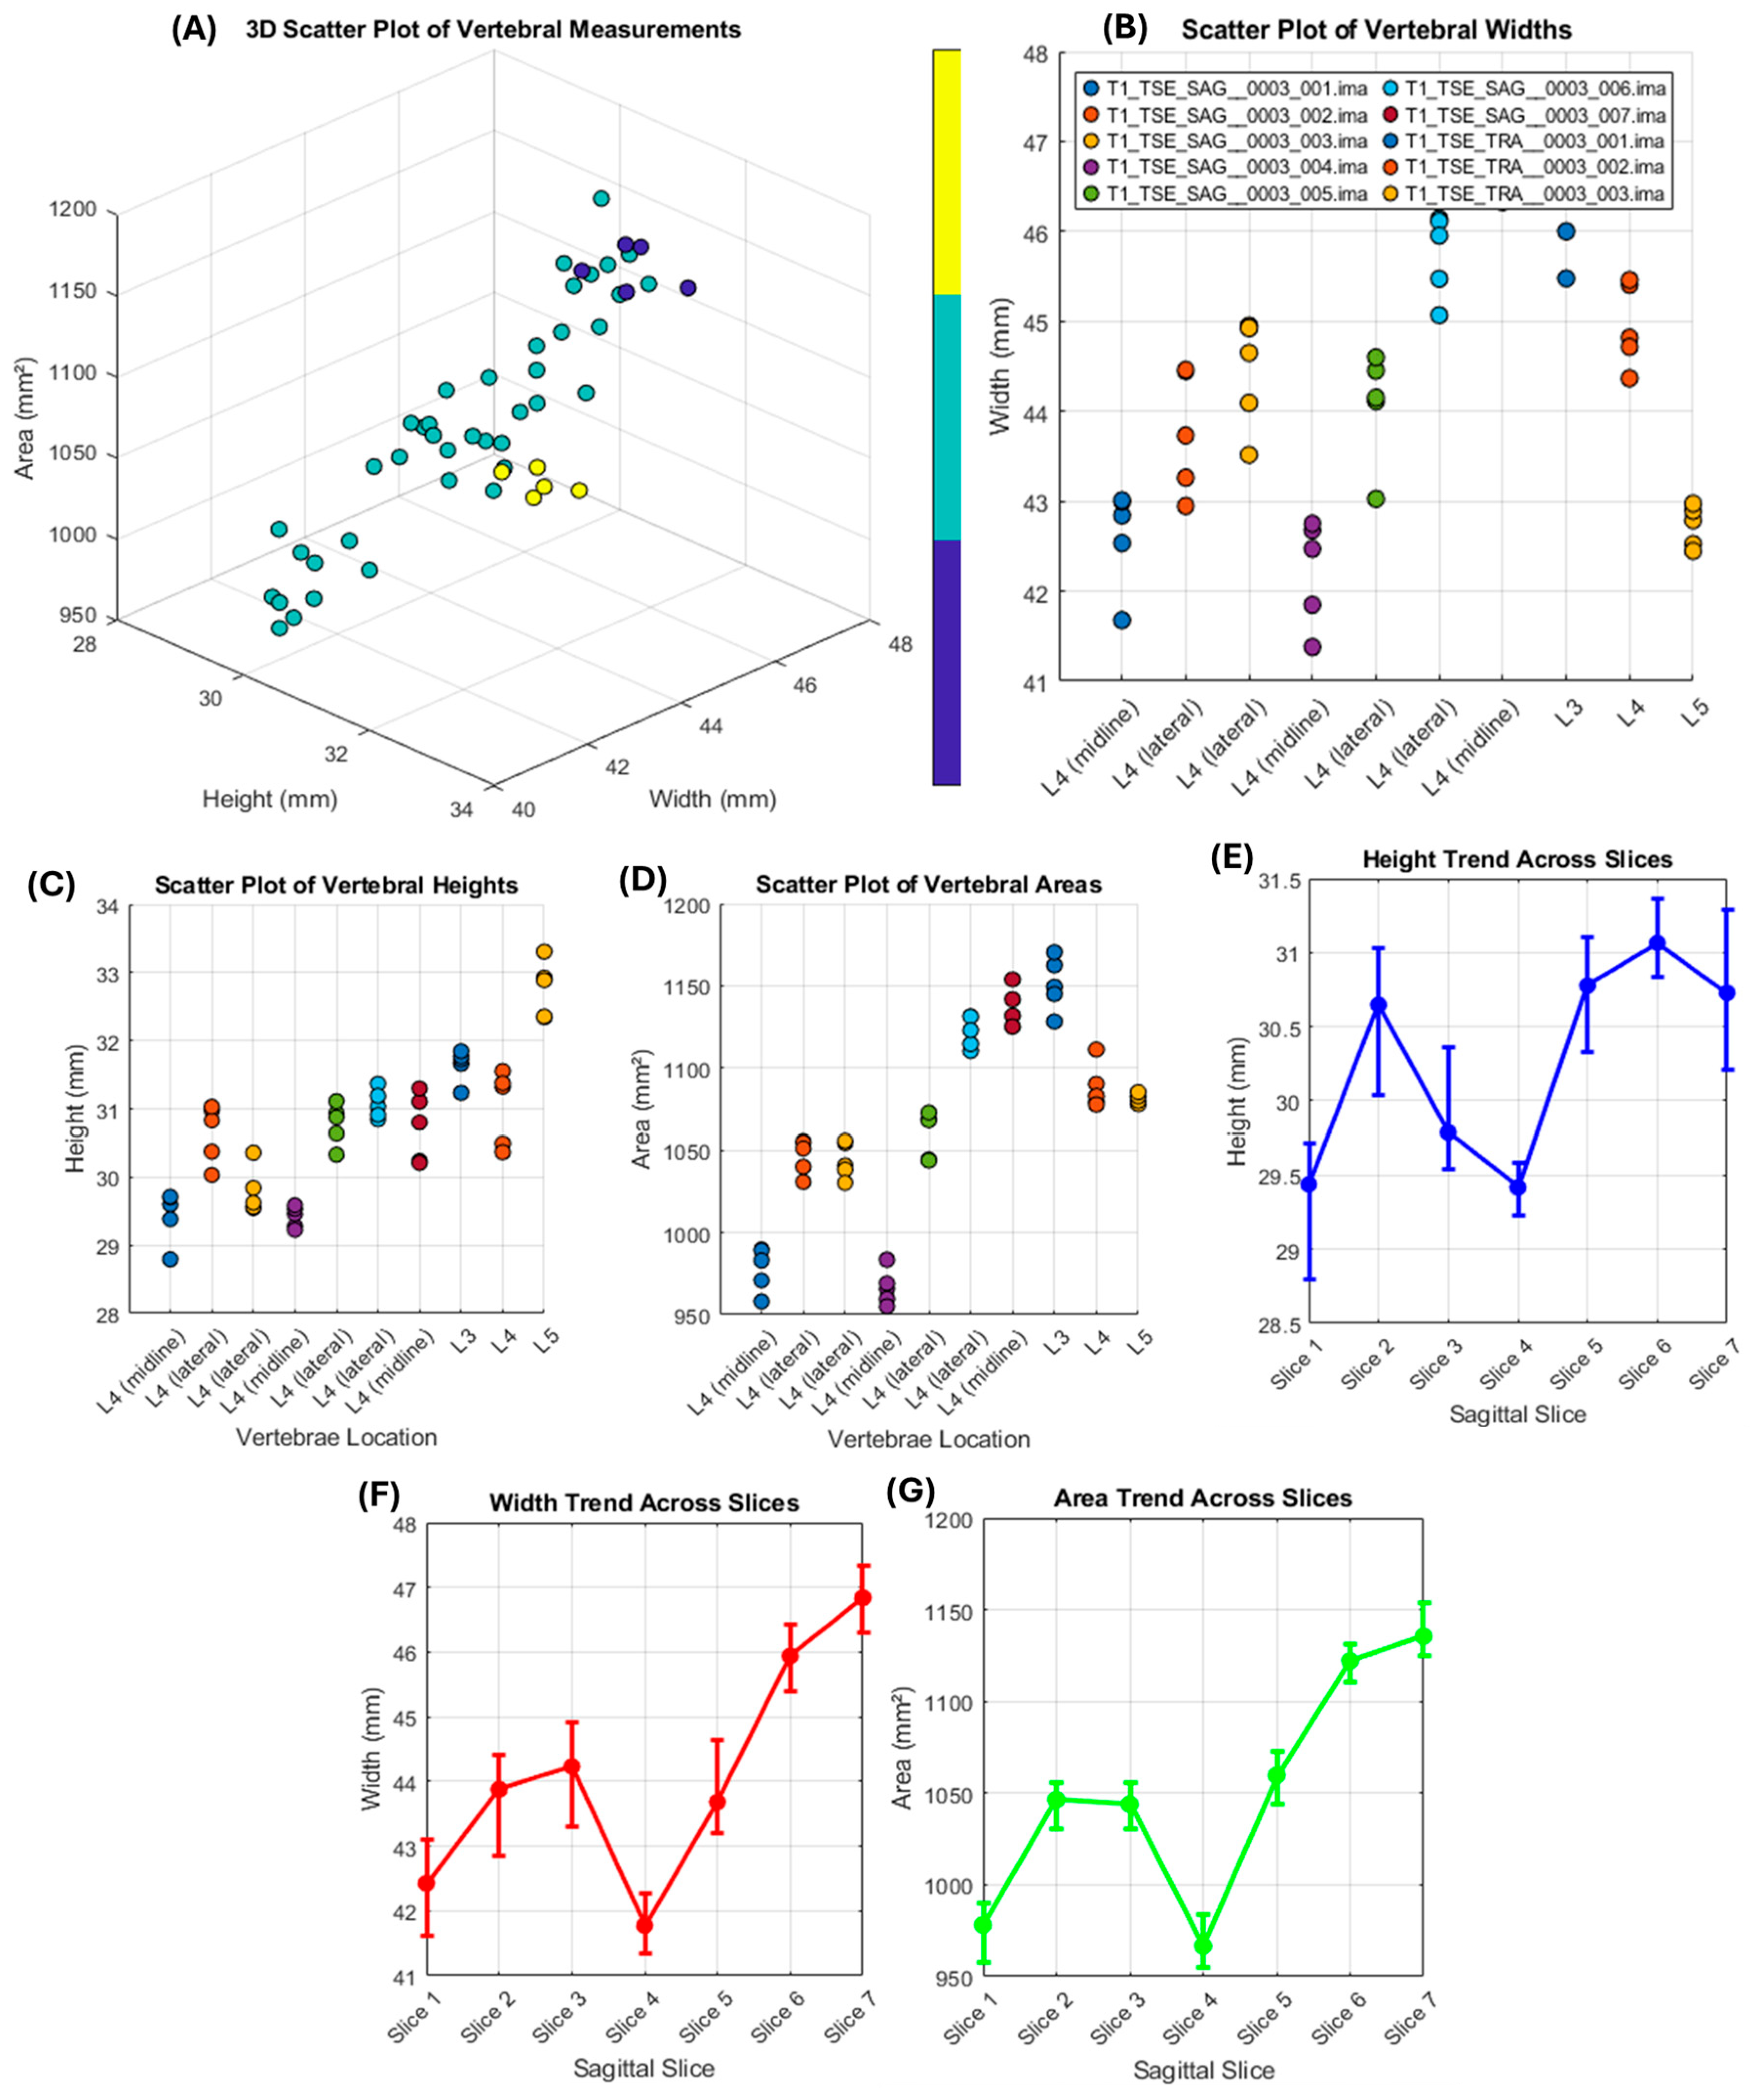
3. Results and Discussion

The quantitative analysis of vertebral measurements from the Lumbar Spine MRI dataset serves as a solid basis for characterizing the anatomical features of the L3, L4, and L5 vertebrae presented in Table 2. The dataset contains both sagittal (T1_TSE_SAG) and transverse (T1_TSE_TRA) imaging planes, as well as providing a full range of dimensions over multiple slices. For L4, the sagittal slices (files 001 to 007) show a uniform pattern, with midline slices (e.g., file 004) measuring slightly smaller in overall dimensions (height: 29.29 mm, width: 41.98 mm) compared to lateral slices (e.g., file 006, height: 31.22 mm, width: 45.67 mm), which is congruent with the anatomical tapering of the vertebral body. With regard to the transverse plane, L3 (file 001) demonstrated a significantly larger cross-sectional area (1147.62 mm2) than L4 (1093.24 mm2) and L5 (1096.62 mm2), which is likely due to the wider left–right (46.34 mm) measurement capturing in that plane. These numbers seem reasonable by anatomical norms of the lumbar erector spinae (L3 and L5 generally demonstrate the larger representational dimensions) considering the structural role of L3 to typically endure weight and L5 to articulate to the sacral region.
The reliability of the framework was further assessed through the reproducibility analysis presented in Figure 2, which takes the form of multi-analysis in different models to graphically evaluate consistency in bone area measurements. Panel (A) presents a 3D scatter plot of the multivariate relationship among height, width, and area. Points are color-coded by vertebra for L3, L4, and L5. L4 points portrayed in cyan are clustered together along 29–31 mm in height, 42–47 mm in width, and 950–1140 mm2 in area, which seems to equal tight measurement consistency across sagittal slices. L3 points (1147.62 mm2) are portrayed in purple and L5 points (1096.62 mm2) are portrayed in yellow, showing higher areas due to the larger transverse dimensions of the vertebra. Panels (B), (C), and (D) present a scatter plot of each measurement for width, height, and area, respectively, in which the three files were varied by ±2% error, to examine the uncertainty of the measurements. Notably, the L4 midline slice file 007 showed a higher, slightly overrepresented width (47.21 mm) and area (1140.47 mm2) since it was significantly higher than both L3 and L5. The proximity of the points within the 2% error margin across all vertebrae demonstrates reproducibility within the framework, as the differences were well within anatomical tolerances, giving confidence in the measurement process.
Panels (E), (F), and (G) in Figure 2 further explain the trends across sagittal slices (files 001 to 007), providing information on anatomical variability and measurement reliability. The height trend (Panel E) demonstrates small increases from 29.23 mm (Slice 1) to 31.22 mm (Slice 6) observed in the lateral position, with error bars again supporting reliability within the 1–2% margin. The width trend (Panel F) shows a much larger variation from 42.31 mm (Slice 1) to 47.21 mm (Slice 7), representing larger anterior–posterior dimension at (Slice 7). The area trend (Panel G) increased from 971.37 mm2 (Slice 1) to 1140.47 mm2 (Slice 7), with a drop below Slice 4 (965.77 mm2) representing the narrower midline slice. All trends presented are indicative of the expected anatomical profile of L4, being larger in the lateral slices on account of the anatomical shape of the vertebrae. The above trends in reliability within the margins of error of 1–2% give credence to the reliability of the overall framework, as demonstrated by the nearly identical error bars across trends.
Despite the potential to calculate vertebral dimensions, the primary limitation of this study is the absence of cross-referencing between framework outputs and actual measured values of length, width, and area due to insufficient metadata in the available datasets and studies. To address this limitation, measurement reproducibility was verified and calculated vertebral dimensions were confirmed to fall within established reference ranges for corresponding vertebrae, lending credibility to the proposed framework. This demands for future research to focus on rigorous clinical validation through comparison with reference values from diverse patient populations in authentic clinical scenarios, which could further substantiate these findings. Furthermore, low-quality images with poor contrast can negatively impact both the accuracy and reproducibility of the results. Additionally, while this protocol has been tested on MRI images, further evaluation using alternative imaging modalities is necessary to establish its broader applicability.

4. Conclusions

This study presents a new semi-automated system that measures vertebrae, designed for use at both ends of a clinical assessment and as a fully automated assessment of the vertebra. The 2% reproducibility error associated with using this tool is impressive and useable for clinical measurement. By utilizing deterministic mathematical modeling and interactive region of interest (ROI) selection, the contributors were able to engage and tackle difficulties associated with detecting a vertebra boundary, while avoiding adopting a costly AI computational approach. The cylindrical model-based transformation of pixel recording into physical measurements provided a correct anatomical assessment of vertebral parameters. The outlined framework presents an important step in standardizing and reporting vertebral measurements while providing the potential for immediate clinical use, although regulatory and technical difficulties involved with adopting a fully AI approach in spine imaging remain.

Author Contributions

Conceptualization, M.H.M., R.T.K., and K.U.W.; methodology, M.H.M. and F.A.; software, M.H.M. and R.T.K.; validation, K.U.W. and A.A.; formal analysis, M.H.M. and Z.B.; investigation, R.T.K. and J.H.; resources, Z.B. and J.H.; data curation, M.H.M.; writing—original draft preparation, M.H.M. and R.T.K.; writing—review and editing, M.H.M., R.T.K., K.U.W., and J.H.; visualization, M.H.M.; supervision, Z.B. and J.H.; project administration, Z.B. and J.H.; funding acquisition, Not applicable. All authors have read and agreed to the published version of the manuscript.

Funding

This research received no external funding.

Institutional Review Board Statement

Not applicable.

Informed Consent Statement

Not applicable.

Data Availability Statement

Data supporting the reported results can be requested from the corresponding author.

Conflicts of Interest

Authors declare no conflict of Interest.

References

  1. Cappetti, N.; Angelo, L.D.; Fontana, C.; Marzola, A. A computer-based method for the automatic identification of the dimensional features of human cervical vertebrae. Comput. Methods Programs Biomed. Update 2025, 7, 100175. [Google Scholar] [CrossRef]
  2. Yang, Y.; Wang, Y.; Liu, T.; Wang, M.; Sun, M.; Song, S.; Fan, W.; Huang, G. Anatomical prior-based vertebral landmark detection for spinal disorder diagnosis. Artif. Intell. Med. 2025, 159, 103011. [Google Scholar] [CrossRef] [PubMed]
  3. Yin, J.; Ngiam, K.; Teo, H. Role of Artificial Intelligence Applications in Real-Life Clinical Practice: Systematic Review. J. Med. Internet Res. 2020, 23, e25759. [Google Scholar] [CrossRef] [PubMed]
  4. Giordano, C.; Brennan, M.; Mohamed, B.; Rashidi, P.; Modave, F.; Tighe, P. Accessing Artificial Intelligence for Clinical Decision-Making. Front. Digit. Health 2021, 3, 645232. [Google Scholar] [CrossRef] [PubMed]
  5. Castiglioni, I.; Rundo, L.; Codari, M.; Di Leo, G.; Salvatore, C.; Interlenghi, M.; Gallivanone, F.; Cozzi, A.; D’Amico, N.; Sardanelli, F. AI applications to medical images: From machine learning to deep learning. Phys. Medica Int. J. Devoted Appl. Phys. Med. Biol. 2021, 83, 9–24. [Google Scholar] [CrossRef] [PubMed]
  6. Roberts, M.; Hinton, G.; Wells, A.; Van Der Veken, J.; Bajger, M.; Lee, G.; Liu, Y.; Chong, C.; Poonnoose, S.; Agzarian, M.; et al. Imaging evaluation of a proposed 3D generative model for MRI to CT translation in the lumbar spine. Spine J. Off. J. N. Am. Spine Soc. 2023, 23, 1602–1612. [Google Scholar] [CrossRef] [PubMed]
  7. Graaf, J.; Hooff, M.; Buckens, C.; Rutten, M.; Susante, J.; Kroeze, R.; Kleuver, M.; Ginneken, B.; Lessmann, N. Lumbar spine segmentation in MR images: A dataset and a public benchmark. Sci. Data 2023, 11, 264. [Google Scholar] [CrossRef] [PubMed]
  8. Masood, R.; Hassan, T.; Raja, H.; Hassan, B.; Dias, J.; Werghi, N. A Composite Dataset of Lumbar Spine Images with Mid-Sagittal View Annotations and Clinically Significant Spinal Measurements. In Proceedings of the 2022 2nd International Conference on Digital Futures and Transformative Technologies (ICoDT2), Rawalpindi, Pakistan, 24–26 May 2022; pp. 1–5. [Google Scholar] [CrossRef]
Figure 1. This figure includes four rows with different anatomical perspectives: rows (A,D) present axial views, while rows (B,C) show sagittal views. Each row shows the processing sequence, from the initial scan to the final segmented image, with the region of interest marked in a red rectangle.
Materproc 23 00005 g001
Figure 2. Comprehensive analysis of vertebral measurements from Lumbar Spine MRI Dataset for reproducibility assessment. (A) A 3D scatter plot of area, width, and height values tested on repeated measurements to check result reproducibility across L3, L4, and L5 vertebrae. (B) A scatter plot of vertebral widths with ±2% error variations to assess measurement consistency across slices. (C) A scatter plot of vertebral heights with ±2% error variations for reproducibility evaluation. (D) A scatter plot of vertebral areas with ±2% error variations to confirm measurement reliability. (E) The height trend across sagittal slices, with error bars for trend reproducibility. (F) The width trend across sagittal slices, with error bars to evaluate consistency. (G) The area trend across sagittal slices, with error bars for reproducibility assessment.
Materproc 23 00005 g002
Table 1. Pseudo code for preprocessing pipeline for quantifying vertebral parameters from lumbar spine IMA Files.
StepDescriptionPurposeMATLAB Command
1Convert IMA file to DICOM formatStandardize data and extract metadata (e.g., pixel spacing, slice thickness)dicomread, dicominfo, dicomwrite
2Convert image to grayscaleFocus on intensity variations, eliminating color channelsrgb2gray
3Normalize image intensities to range (0, 1)Ensure consistency across images for uniform processingmat2gray
4Enhance contrast by locally redistributing intensities in small regionsImprove visibility of vertebral boundaries with adaptive contrast adjustmentadapthisteq
5Reduce noise by replacing each pixel with the median of its 3 × 3 neighborhoodRemove small-scale noise while preserving vertebral edgesmedfilt2
6Segment image using adaptive thresholding based on local intensityCreate a binary image, assuming vertebral structures are brighter than the backgroundadaptthresh
7Correct polarity if foreground is darker than backgroundEnsure vertebral structures are correctly identified as foregroundimbinarize
8Apply watershed thresholding to refine segmentationDelineate boundaries between vertebral structures using a topographic flooding approachbwdist, watershed
9Apply morphological operations to refine segmentationRemove noise, close gaps, eliminate small objects, and fill holes for structural integrityimopen, imclose, bwareaopen, imfill
10Allow user to draw a rectangular ROI on the segmented imageEnable user-guided selection of the vertebral body of interestdrawrectangle
11Create a mask from the ROI and combine it with the segmented imageIsolate the vertebral structure within the user-defined ROILogical AND operation
Table 2. Vertebral measurements obtained from the proposed framework.
File NameVertebrae LocationHeight (mm)Width (mm)Area (mm2)
T1_TSE_SAG__0003_001.imaL4 (midline)29.2342.31971.37
T1_TSE_SAG__0003_002.imaL4 (lateral)30.4743.651044.62
T1_TSE_SAG__0003_003.imaL4 (lateral)30.1144.121043.37
T1_TSE_SAG__0003_004.imaL4 (midline)29.2941.98965.77
T1_TSE_SAG__0003_005.imaL4 (lateral)30.6343.841054.77
T1_TSE_SAG__0003_006.imaL4 (lateral)31.2245.671119.92
T1_TSE_SAG__0003_007.imaL4 (midline)30.7647.211140.47
T1_TSE_TRA__0003_001.imaL331.5346.341147.62
T1_TSE_TRA__0003_002.imaL430.9844.931093.24
T1_TSE_TRA__0003_003.imaL532.8242.541096.62
Disclaimer/Publisher’s Note: The statements, opinions and data contained in all publications are solely those of the individual author(s) and contributor(s) and not of MDPI and/or the editor(s). MDPI and/or the editor(s) disclaim responsibility for any injury to people or property resulting from any ideas, methods, instructions or products referred to in the content.

