Proceeding Paper

Chiral Recognition of Carnitine Enantiomers Using Graphene Oxide-Modified Cadmium Telluride Quantum Dots †

1
College of Humanities and Arts, Chongqing Vocational and Technical University of Mechatronics, Bishan, Chongqing 402760, China
2
College of Health Sciences, Chongqing Youth Vocational & Technical College, Chongqing 400712, China
3
University of Chinese Academy of Sciences, Beijing 101408, China
4
School of Chemistry and Chemical Engineering, Southwest University, Beibei, Chongqing 400715, China
*
Authors to whom correspondence should be addressed.
Presented at the 2024 Cross Strait Conference on Social Sciences and Intelligence Management, Shanghai, China, 13–15 December 2024.
Eng. Proc. 2025, 98(1), 34; https://doi.org/10.3390/engproc2025098034
Published: 8 July 2025

Abstract

Carnitine (CA) is a chiral amino acid and mostly comes from meat and dairy products. CA cannot be found in fruits, vegetables, or other plants, so vegetarians are deficient in CA. CA exists in the form of D-carnitine (D-CA) and L-carnitine (L-CA); only L-carnitine has biological activity. L-CA promotes the oxidation of fatty acids and then causes the effect of weight loss. In this study, the fluorescence probe was established by using graphene oxide-modified cadmium telluride (CdTe) QDs (GO-CdTe QDs) for the chiral recognition of carnitine enantiomers. GO-CdTe QDs present fluorescence. D-CA enhances the fluorescence spectral signal of the GO-CdTe QDs system, while L-CA weakens its spectral signal. Based on this phenomenon, we determined D-carnitine and L-carnitine.

1. Introduction

Chirality comes from the Greek word cheir, which translates as “hand”. It refers to the properties of a pair of compounds that are chemically symmetric but cannot overlap no matter how they are placed [1]. This pair of compounds is called an enantiomer. Substances with this property are also enantiomers, named L-handed and D-handed, and generally occur in pairs.
Chiral recognition of biomolecules has attracted tremendous attention in research. Most chiral biomolecules exist in the form of a racemic mixture. However, because of the recognition and toxicological activities, only a single enantiomer is non-poisonous and medicable for humans. For example, L-carnitine (L-CA) is used to treat chronic renal failure, cardiomyopathy, and coronary heart disease [2,3] and provides energy for the body through transformation. D-carnitine (D-CA) has no therapeutic effect on the human body but is toxic and poses a serious threat to health [4]. Chiral enantiomers play an important role in human health, and the analysis of chiral enantiomers is also crucial.
The structure of graphene oxide (GO) is the same as that of graphene but GO has better properties such as a wide absorption spectrum, better quenching performance, lower background interference, higher signal-to-noise ratio, better surface activity, and higher conductivity and wettability [5,6]. In the analysis of chiral substances, GO is often used to identify chiral enantiomers. In this experiment, we used GO-modified cadmium telluride (CdTe) quantum dots (QDs) (GO-CdTe QDs) for chiral identification and quantitative determination of carnitine enantiomers.
Carnitine (CA) is a highly efficient amino acid, mainly found in mammalian tissues. CA improves energy metabolism in cells [7]. CA is essential to most living organisms and is supplied by meat and dairy products. It is also synthesized from methionine and lysine. It has two functions in the human body: One is as a carrier to load fatty acids into the mitochondrial matrix and produce energy through β-oxygenation metabolism [8]. Another function is to maintain free coenzyme A (CoA) in the cell pool by transferring acyl groups from acyl-CoA to CA [9]. CA enantiomers contain D- and L-configurations and play different roles in medicine. L-CA has been used as a drug since the 1960s to treat primary and secondary CA deficiency, as well as various other conditions such as degrease, anorexia, and indigestion. D-CA is regarded as a toxic impurity. Therefore, the chiral recognition of CA enantiomers is indispensable. Carrilo-Carrio et al. used cysteine-coated CdSe (ZnS) QDs to quantitatively determine CA [10]. This is the first report that CA enantiomers are specifically and selectively recognized.
In this experiment, GO, as one of the ligands, was successfully modified to the surface of CdTe QDs. Based on the fluorescence probe established by using GO-CdTe QDs, a simple and convenient method for chiral recognition of CA enantiomers was developed. GO-CdTe QDs have fluorescence, after adding D-CA and L-CA. D-CA enhances the fluorescence spectral signal of the GO-CdTe QDs system, while L-CA weakens its spectral signal. Based on this phenomenon, D-CA and L-CA were determined. Eventually, this fluorescence analytical method was applied to sample analysis with satisfactory results.

2. Experiment

2.1. Materials

Two semi-aqueous cadmium chloride (2.5 CdCl 2·H2O), tellurium powder (Te), sodium borohydride (NaBH4), sodium hydroxide (NaOH), and CA enantiomers were purchased from Shanghai Aladdin Reagent Co., LTD. Other chemical reagents, including GO (GO), N-acetyl-L-cysteine (NALC), and all chemicals used in this work were of analytical grade, so they were used without purification. Ultra-pure water was obtained from a Millipore water purification system (≥18 MΩ, Milli-Q Millipore) used for all experiments. In the recovery experiment, the sample L-CA tea polyphenol tablets (approval number: National Food Health word G20130769) were purchased from Guangdong Yichao Biotechnology Co., LTD, Guangdong, China. The specifications of the sample included 0.8 g/piece and content: 100 g/16 g CA sample.

2.2. Apparatus

The fluorescence spectrum of the system was recorded by FS-5, a fluorescence spectrometer produced by Edinburgh Instrument Company, UK. The emission spectrum in the 450–800 nm band was selected, with an Xe lamp as the excitation light source. Absorption spectra were recorded with a Shimadzu UV-2500 ultraviolet spectrophotometer (Tokyo, Japan). PHS-3C pH meter (Shanghai Sanxin Equipment Co., LTD., Shanghai, China) was used to determine the pH value of solutions. Transmission electron microscopy (TEM) images were recorded with a JEOL JEM 1011 microscope at 100 kV. XRD patterns were obtained by Bruker AXS D8-ADVANCE X-ray diffractometer with a scanning range of 2θ ranging from 10 to 80°.

2.3. Synthesis of GO-CdTe QDs

GO-CdTe QDs used in the experiment were synthesized by modifying the method described in the reference [11]. Te powder (0.0957 g, 0.75 mmol) and excess NaBH4 (0.0681 g, 1.8 mmol) were dissolved in ultra-pure water and allowed to stand for a certain time to ensure that sufficient sodium telluride (NaHTe) was produced in the solution. GO (0.015 g) was accurately weighed and dissolved in 5 mL H2O. CdCl2·2.5H2O (0.3426 g, 1.5 mmol) and NALC (0.3426 g, 1.5 mmol) were dissolved in 100 mL deionized water, stirred, and added into GO solution. The NaOH solution (1 mol·L−1) was added drop by drop into the mixture. The pH of the mixture was adjusted to 9.5 by purging N2 for about 30 min under the condition of magnetic agitation. Under the protection of nitrogen, the mixed solution was heated to 98 °C, and NaHTe was injected into the mixed solution of CdCl2·2.5H2O and NALC with a syringe to finally form an orange-green liquid, which is the CdTe solution needed for the experiment.

2.4. GO-CdTe QDs for Chiral Recognition of CA

A reserve solution with a concentration of 10−4 M CA enantiomers was prepared separately, and then in a standard 5.0 mL bottle, 0.5 mL TRIS-HCl buffer with pH 8.5, 0.4 mL GO-CdTe QDs (NALC-CdTe QDs) and CA enantiomers (D-CA and L-CA) with different concentrations were added. Finally, the mixed solution was diluted to the scale line with ultra-pure water, and the fluorescence spectrum of the system was scanned after shaking and standing for 25 min. The maximum excitation wavelength of fluorescence was 350 nm, because this was the excitation required to obtain the strongest fluorescence emission intensity.

3. Results and Discussion

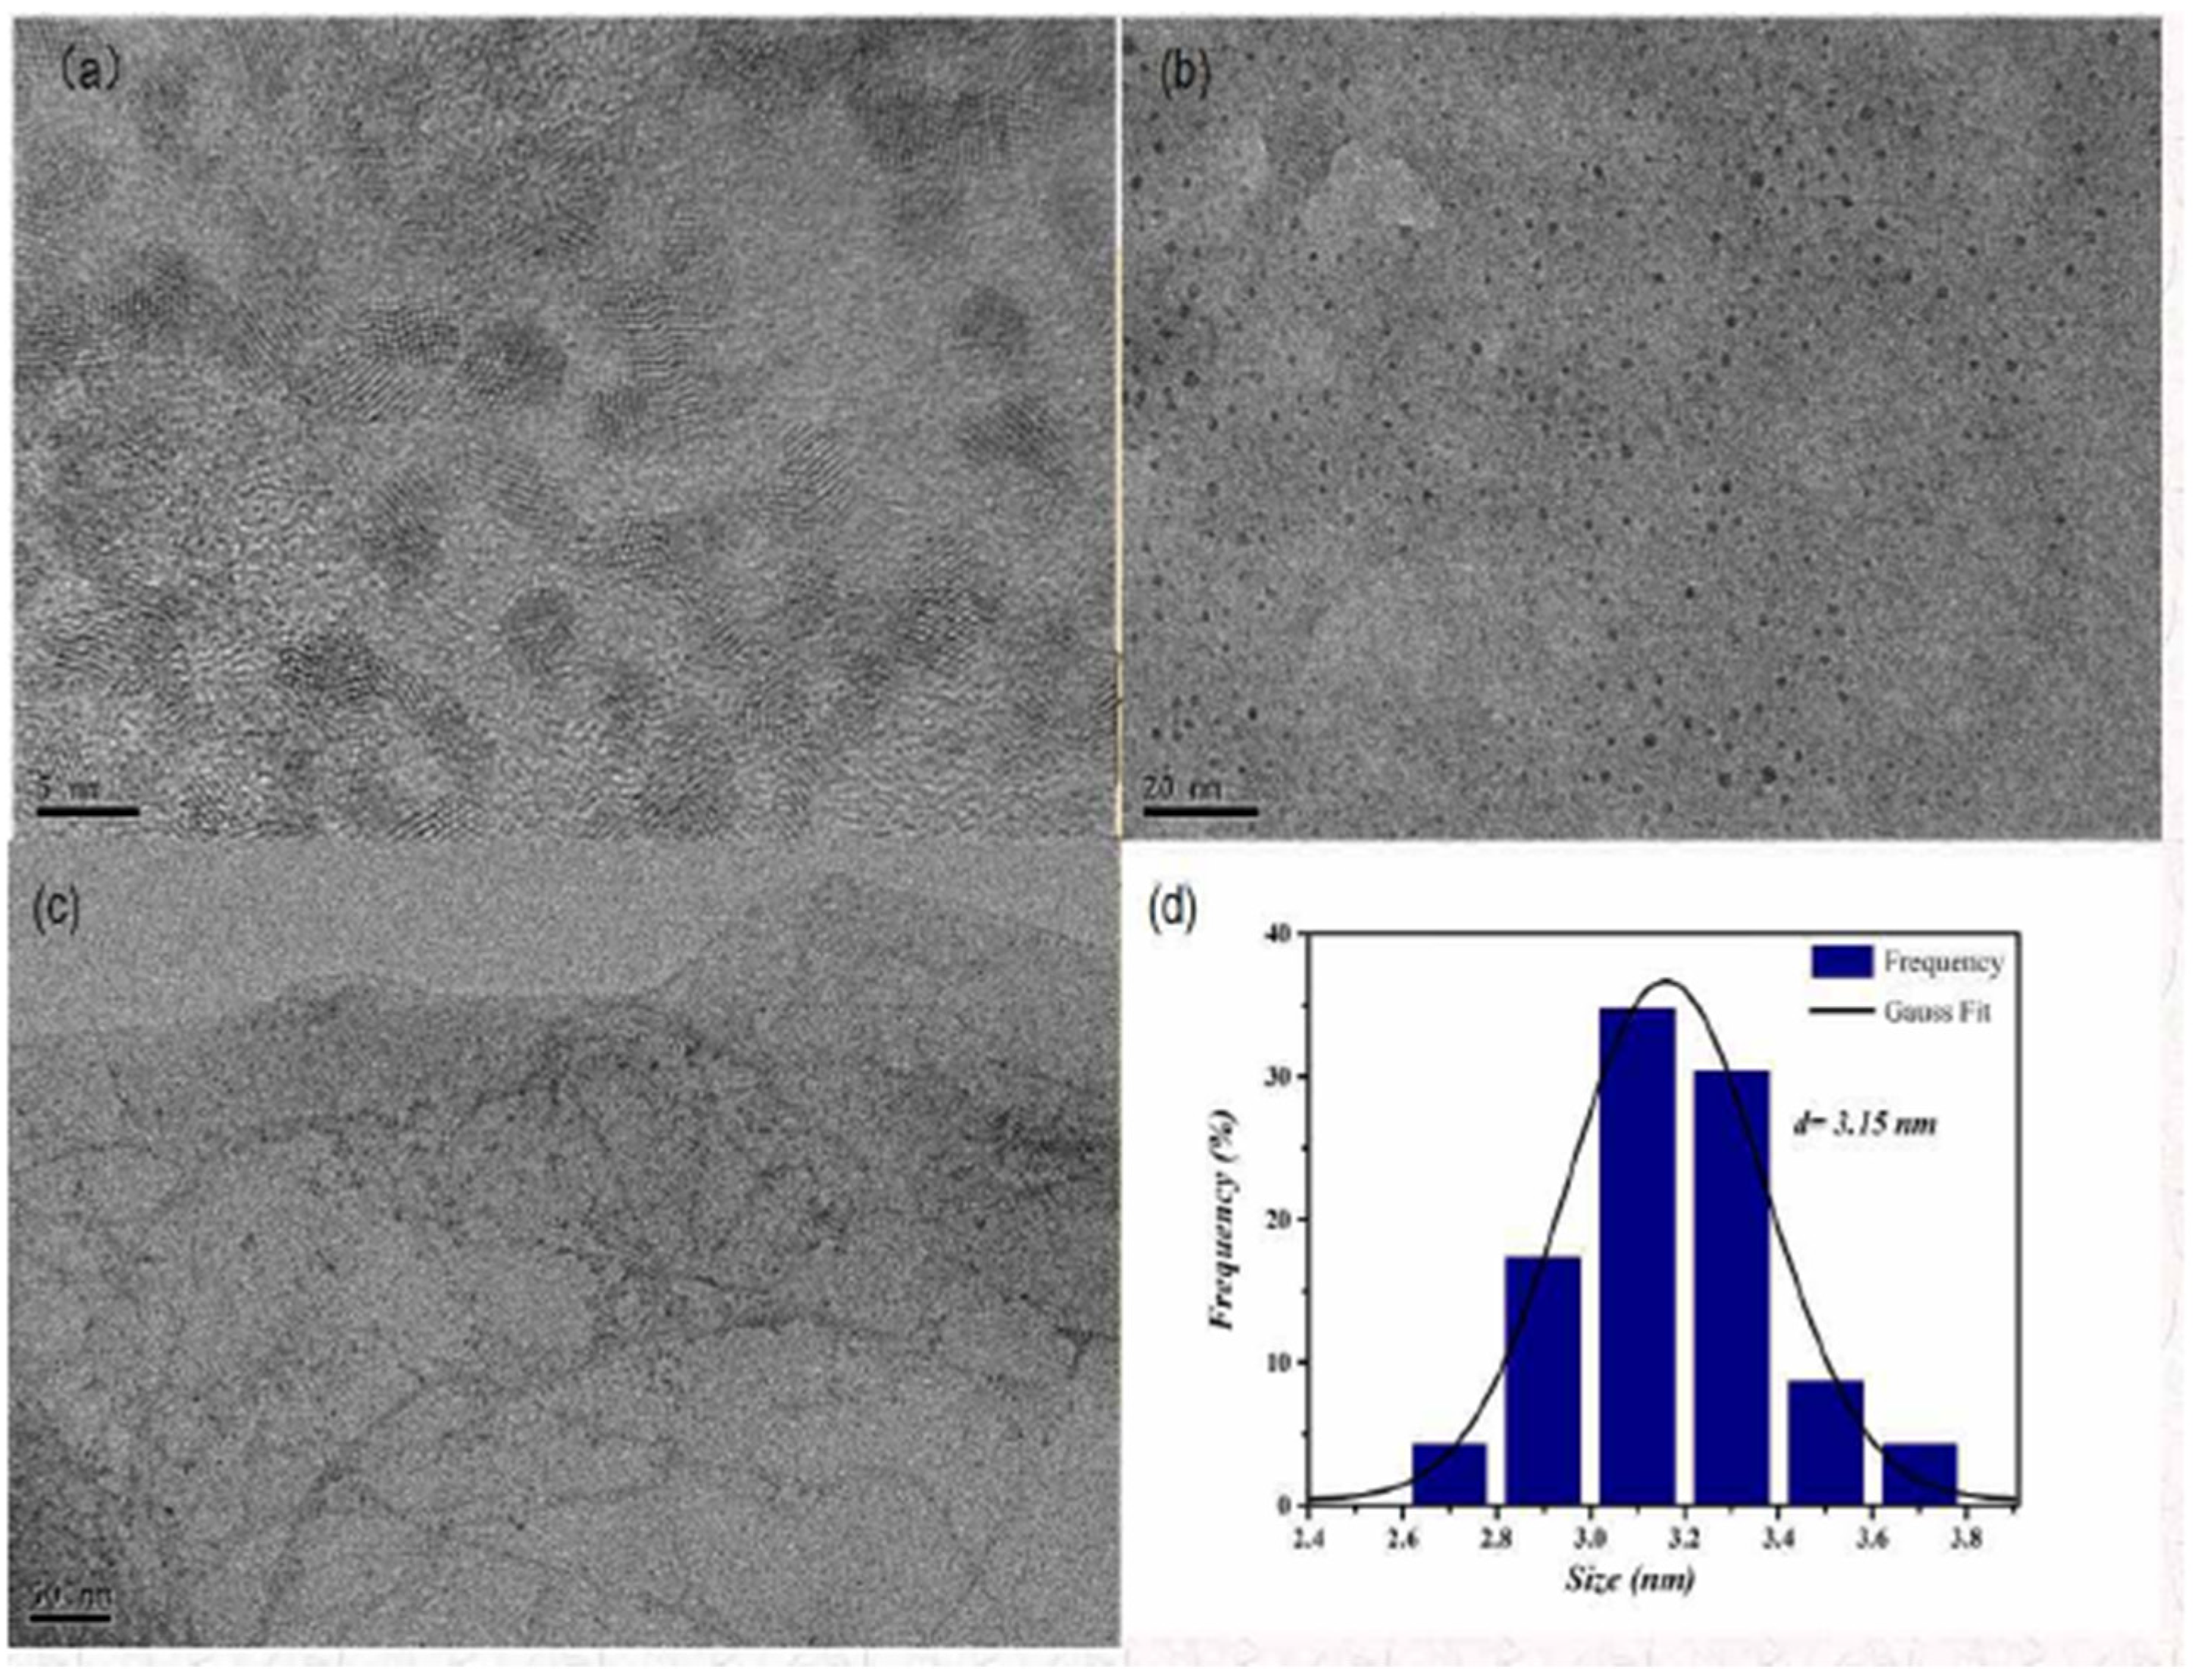
3.1. Characterization of GO-CdTe QDs

Morphology and size were observed by using TEM, as shown in Figure 1a–c, which were measured at 5, 20, and 50 nm. Figure 1b shows that its morphology was spherical and monodisperse. The particle size histogram is presented in Figure 1d, and its particle size was 3.15 nm.

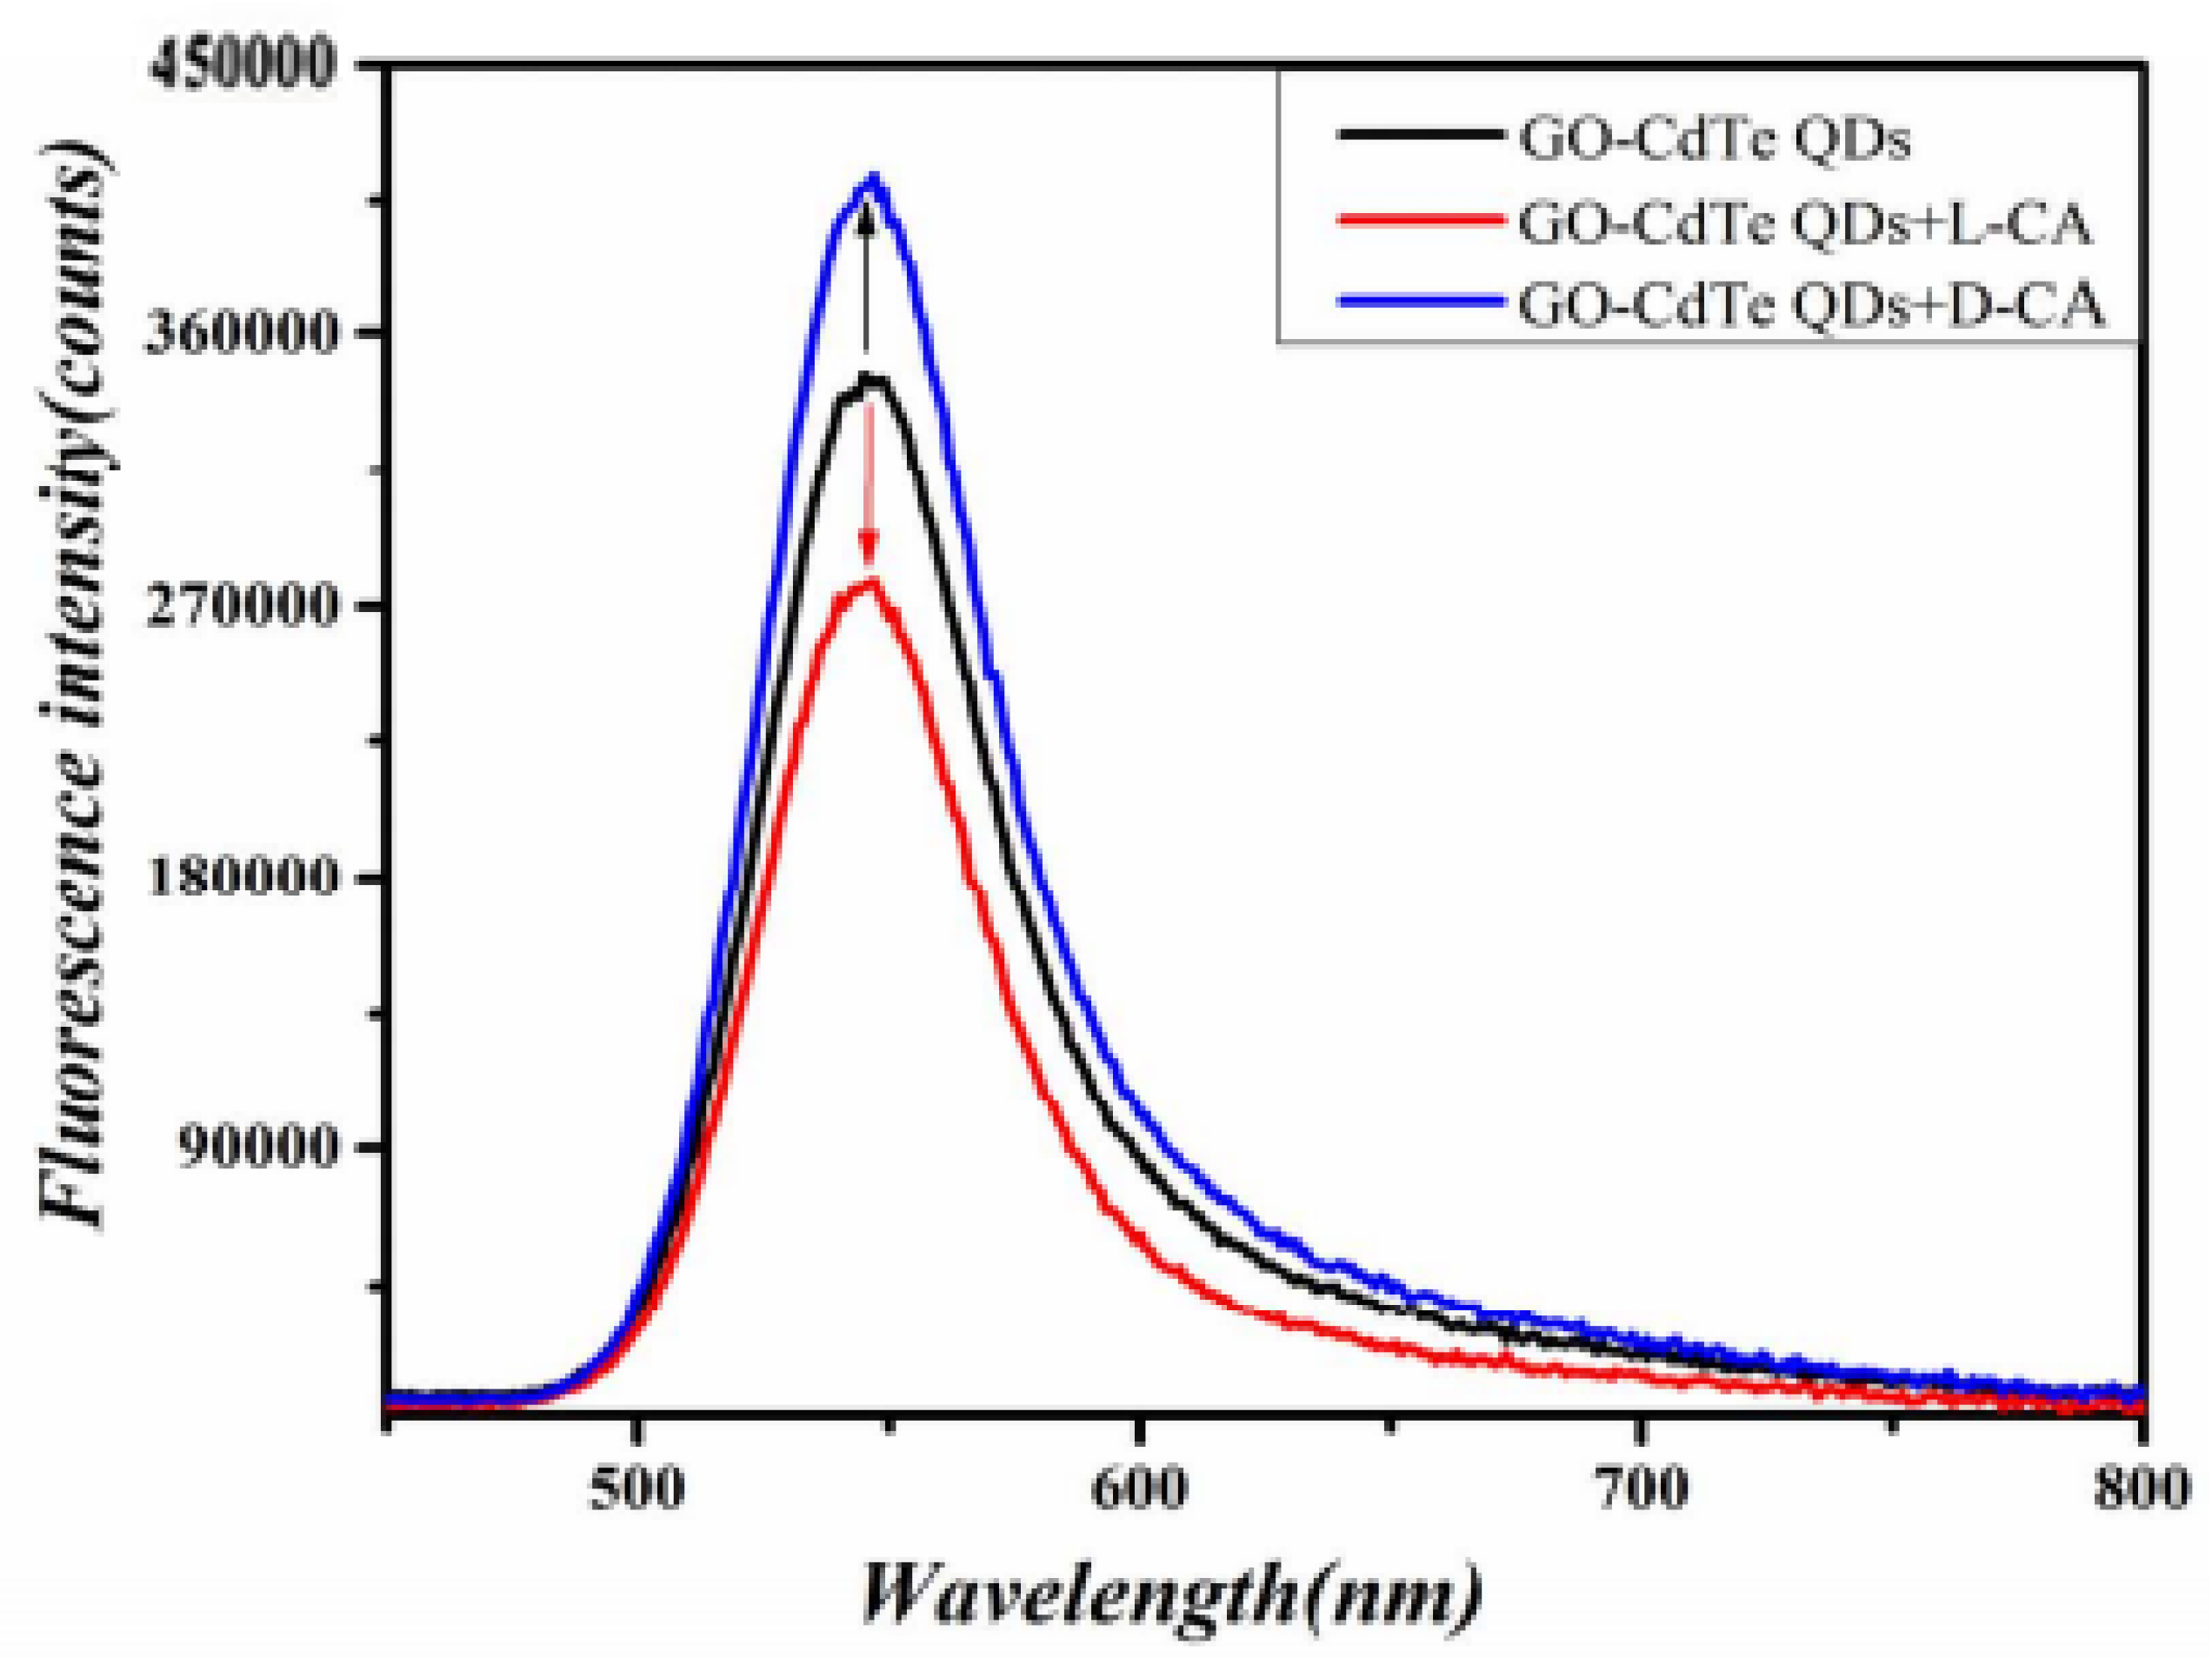
3.2. Chiral Recognition of CA Enantiomers by GO-CdTe QDs

As shown in Figure 2, GO-CdTe QDs have fluorescence. When D-CA and L-CA were added, the fluorescence signal changed in the opposite direction. D-CA enhanced the fluorescence intensity, while L-CA weakened the fluorescence intensity. Based on this, a new fluorescence spectroscopy method was proposed for the chiral identification of CA enantiomers and quantitative determination of D-CA and L-CA.
The fluorescence spectra of D-CA and L-CA reacting with GO-CdTe QDs in the range of 0–30 μM were observed, as shown in Figure 3 (left). With the increase in D-CA concentration, the fluorescence signal of the system was gradually enhanced, and the fluorescence intensity of the system no longer changed when the D-CA concentration reached 30 μM. To evaluate the sensitivity of the GO-CdTe QDs probe for the determination of D-CA, the degree of change in the fluorescence spectrum of the system caused by D-CA in a certain concentration range was calculated as shown in Figure 3.
The degree of change in the fluorescence of the system showed a linear relationship with the concentration of D-CA in the range of 0–30 μM. The linear equation is ΔF = 17,869.63 C + 55,319.42 (C represents the concentration of D-CA in μmol/L), and the linear correlation coefficient was 0.9988. Similarly, when L-CA was added to the GO-CdTe QDs solution, the fluorescence signal of the system was weakened. With a further increase in L-CA concentration, the fluorescence signal was weakened. When the concentration of L-CA reached 30 μM, the fluorescence intensity of the system no longer changed, as shown in Figure 4. These results indicate that the quenching effect of L-CA on GO-CdTe QDs has reached the limit. Figure 4 shows that the quenching degree of GO-CdTe QDs by L-CA has a linear relationship with its concentration. The linear equation is F0−F1 = 8766.52 C + 86,694.32 (C represents the concentration of L-CA, measured in μmol/L), and the linear correlation coefficient was 0.9909. According to the above results, the method can be further confirmed for the identification and determination of D-CA and L-CA.

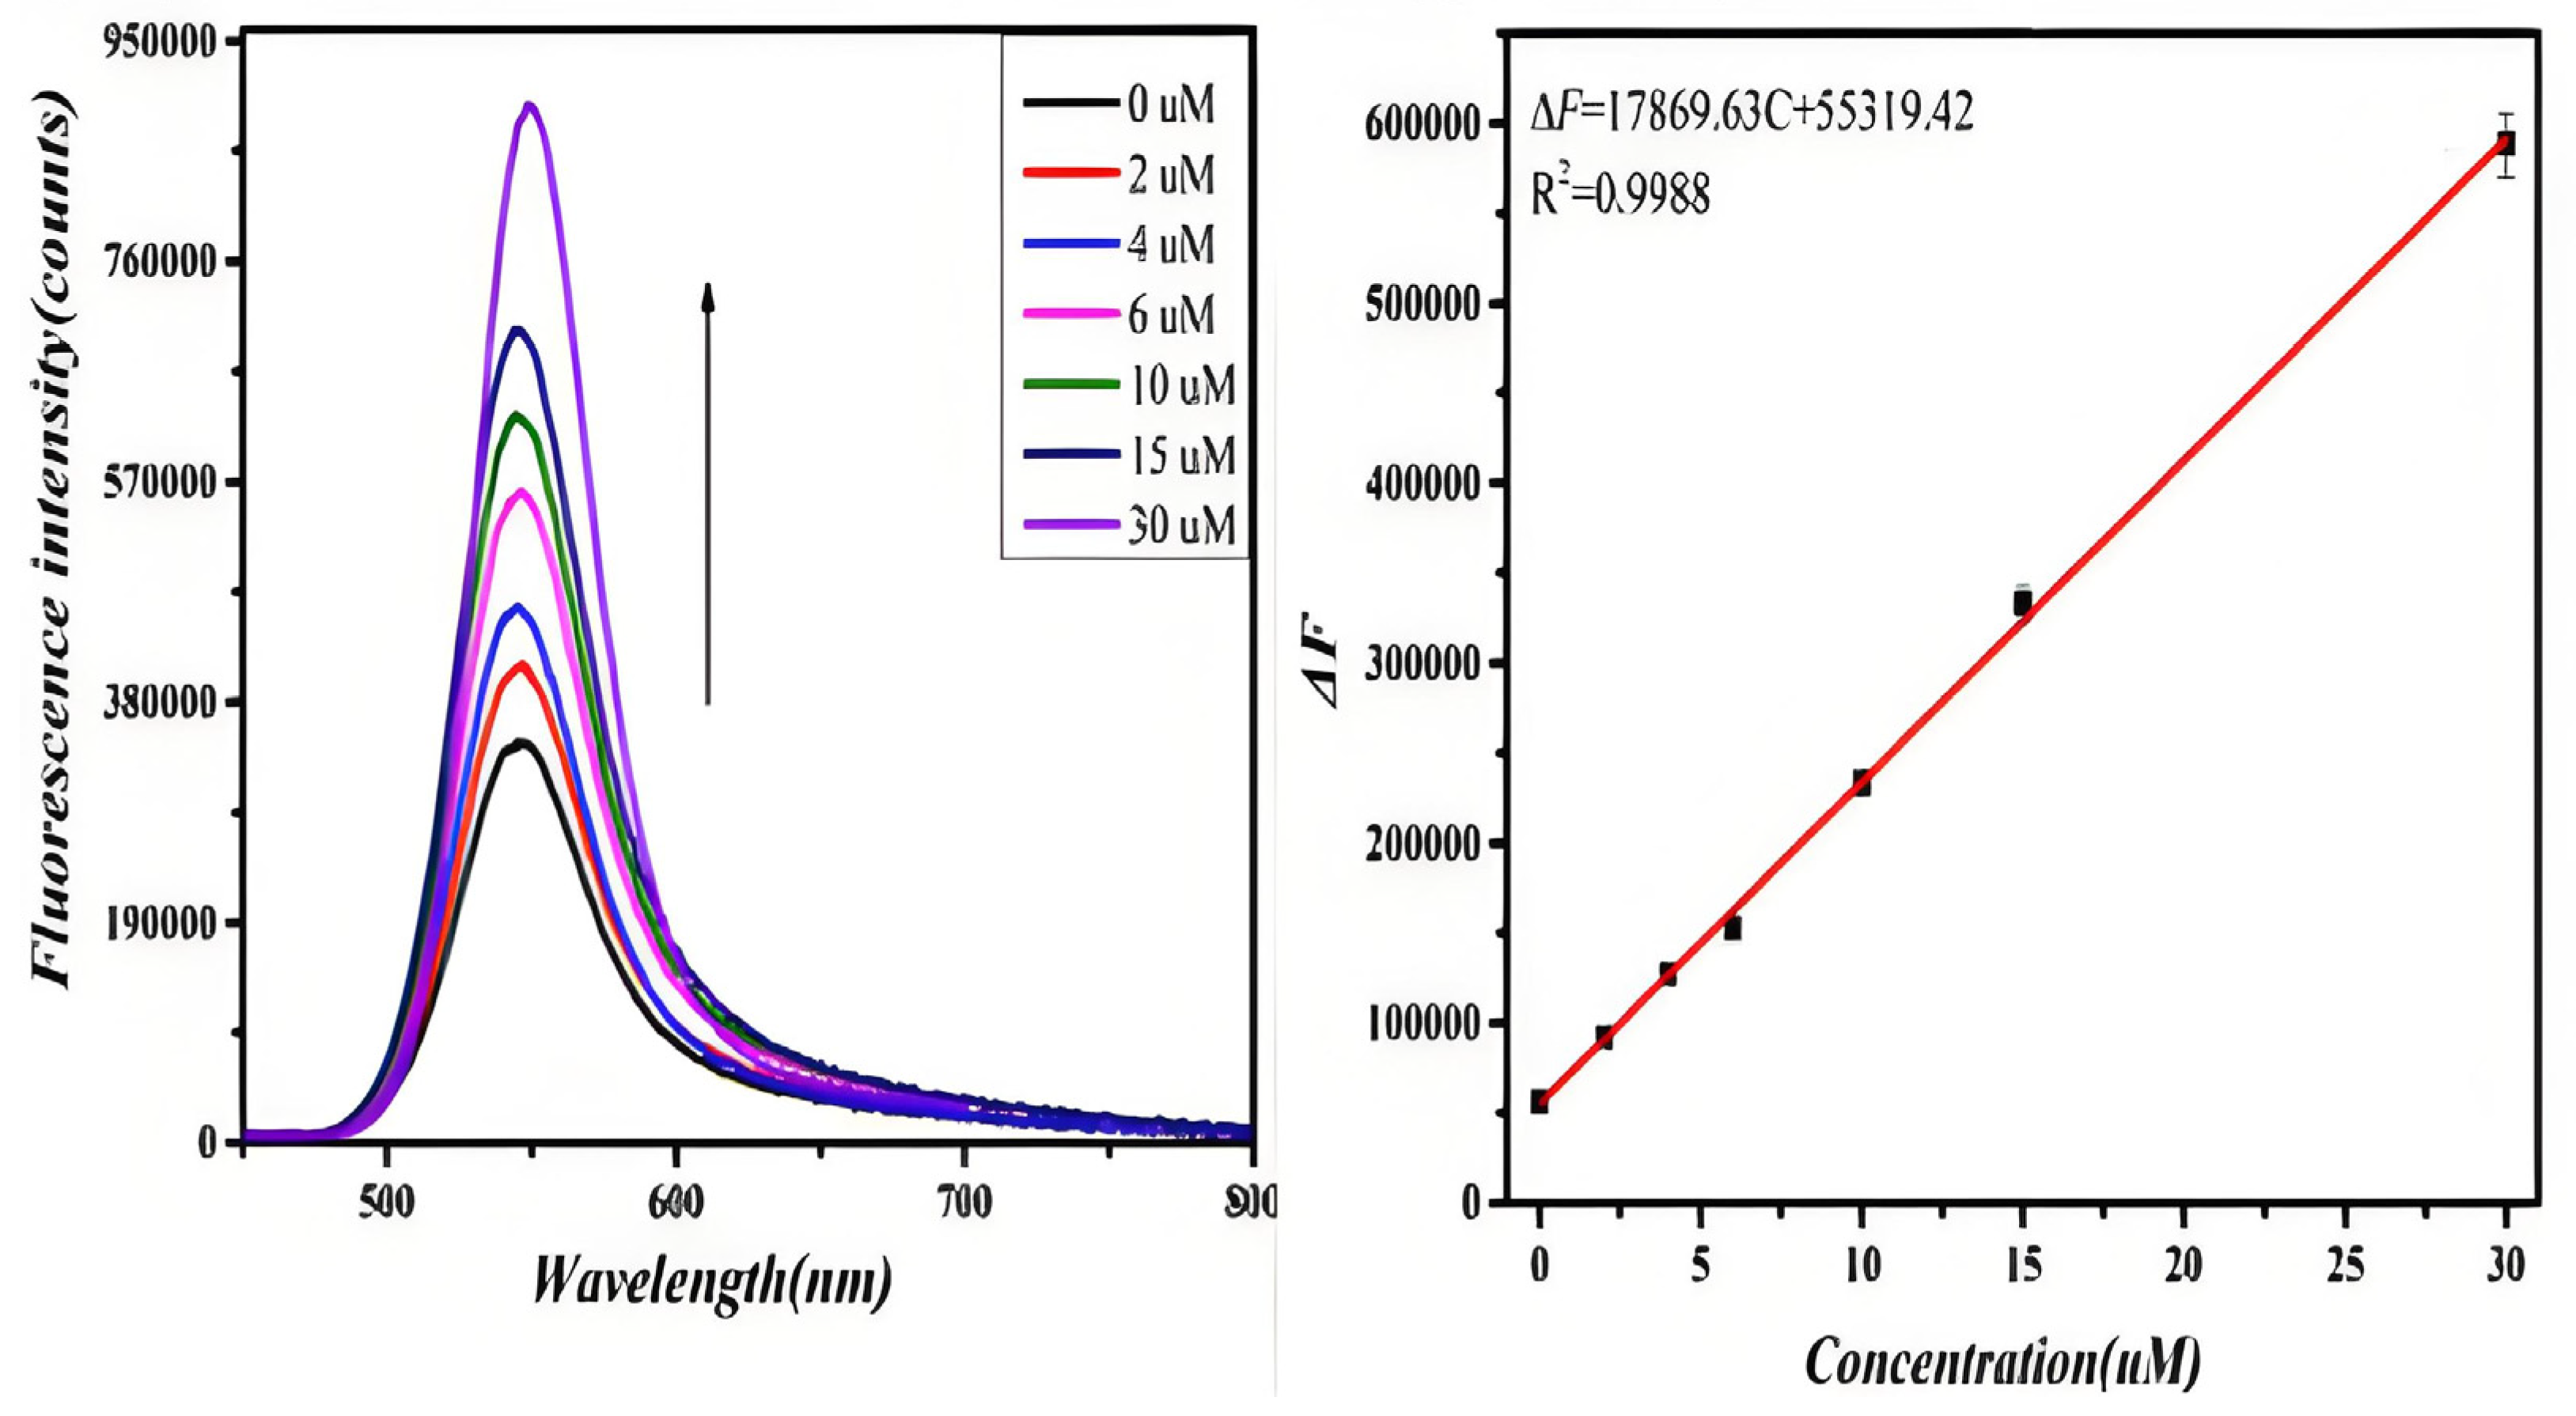
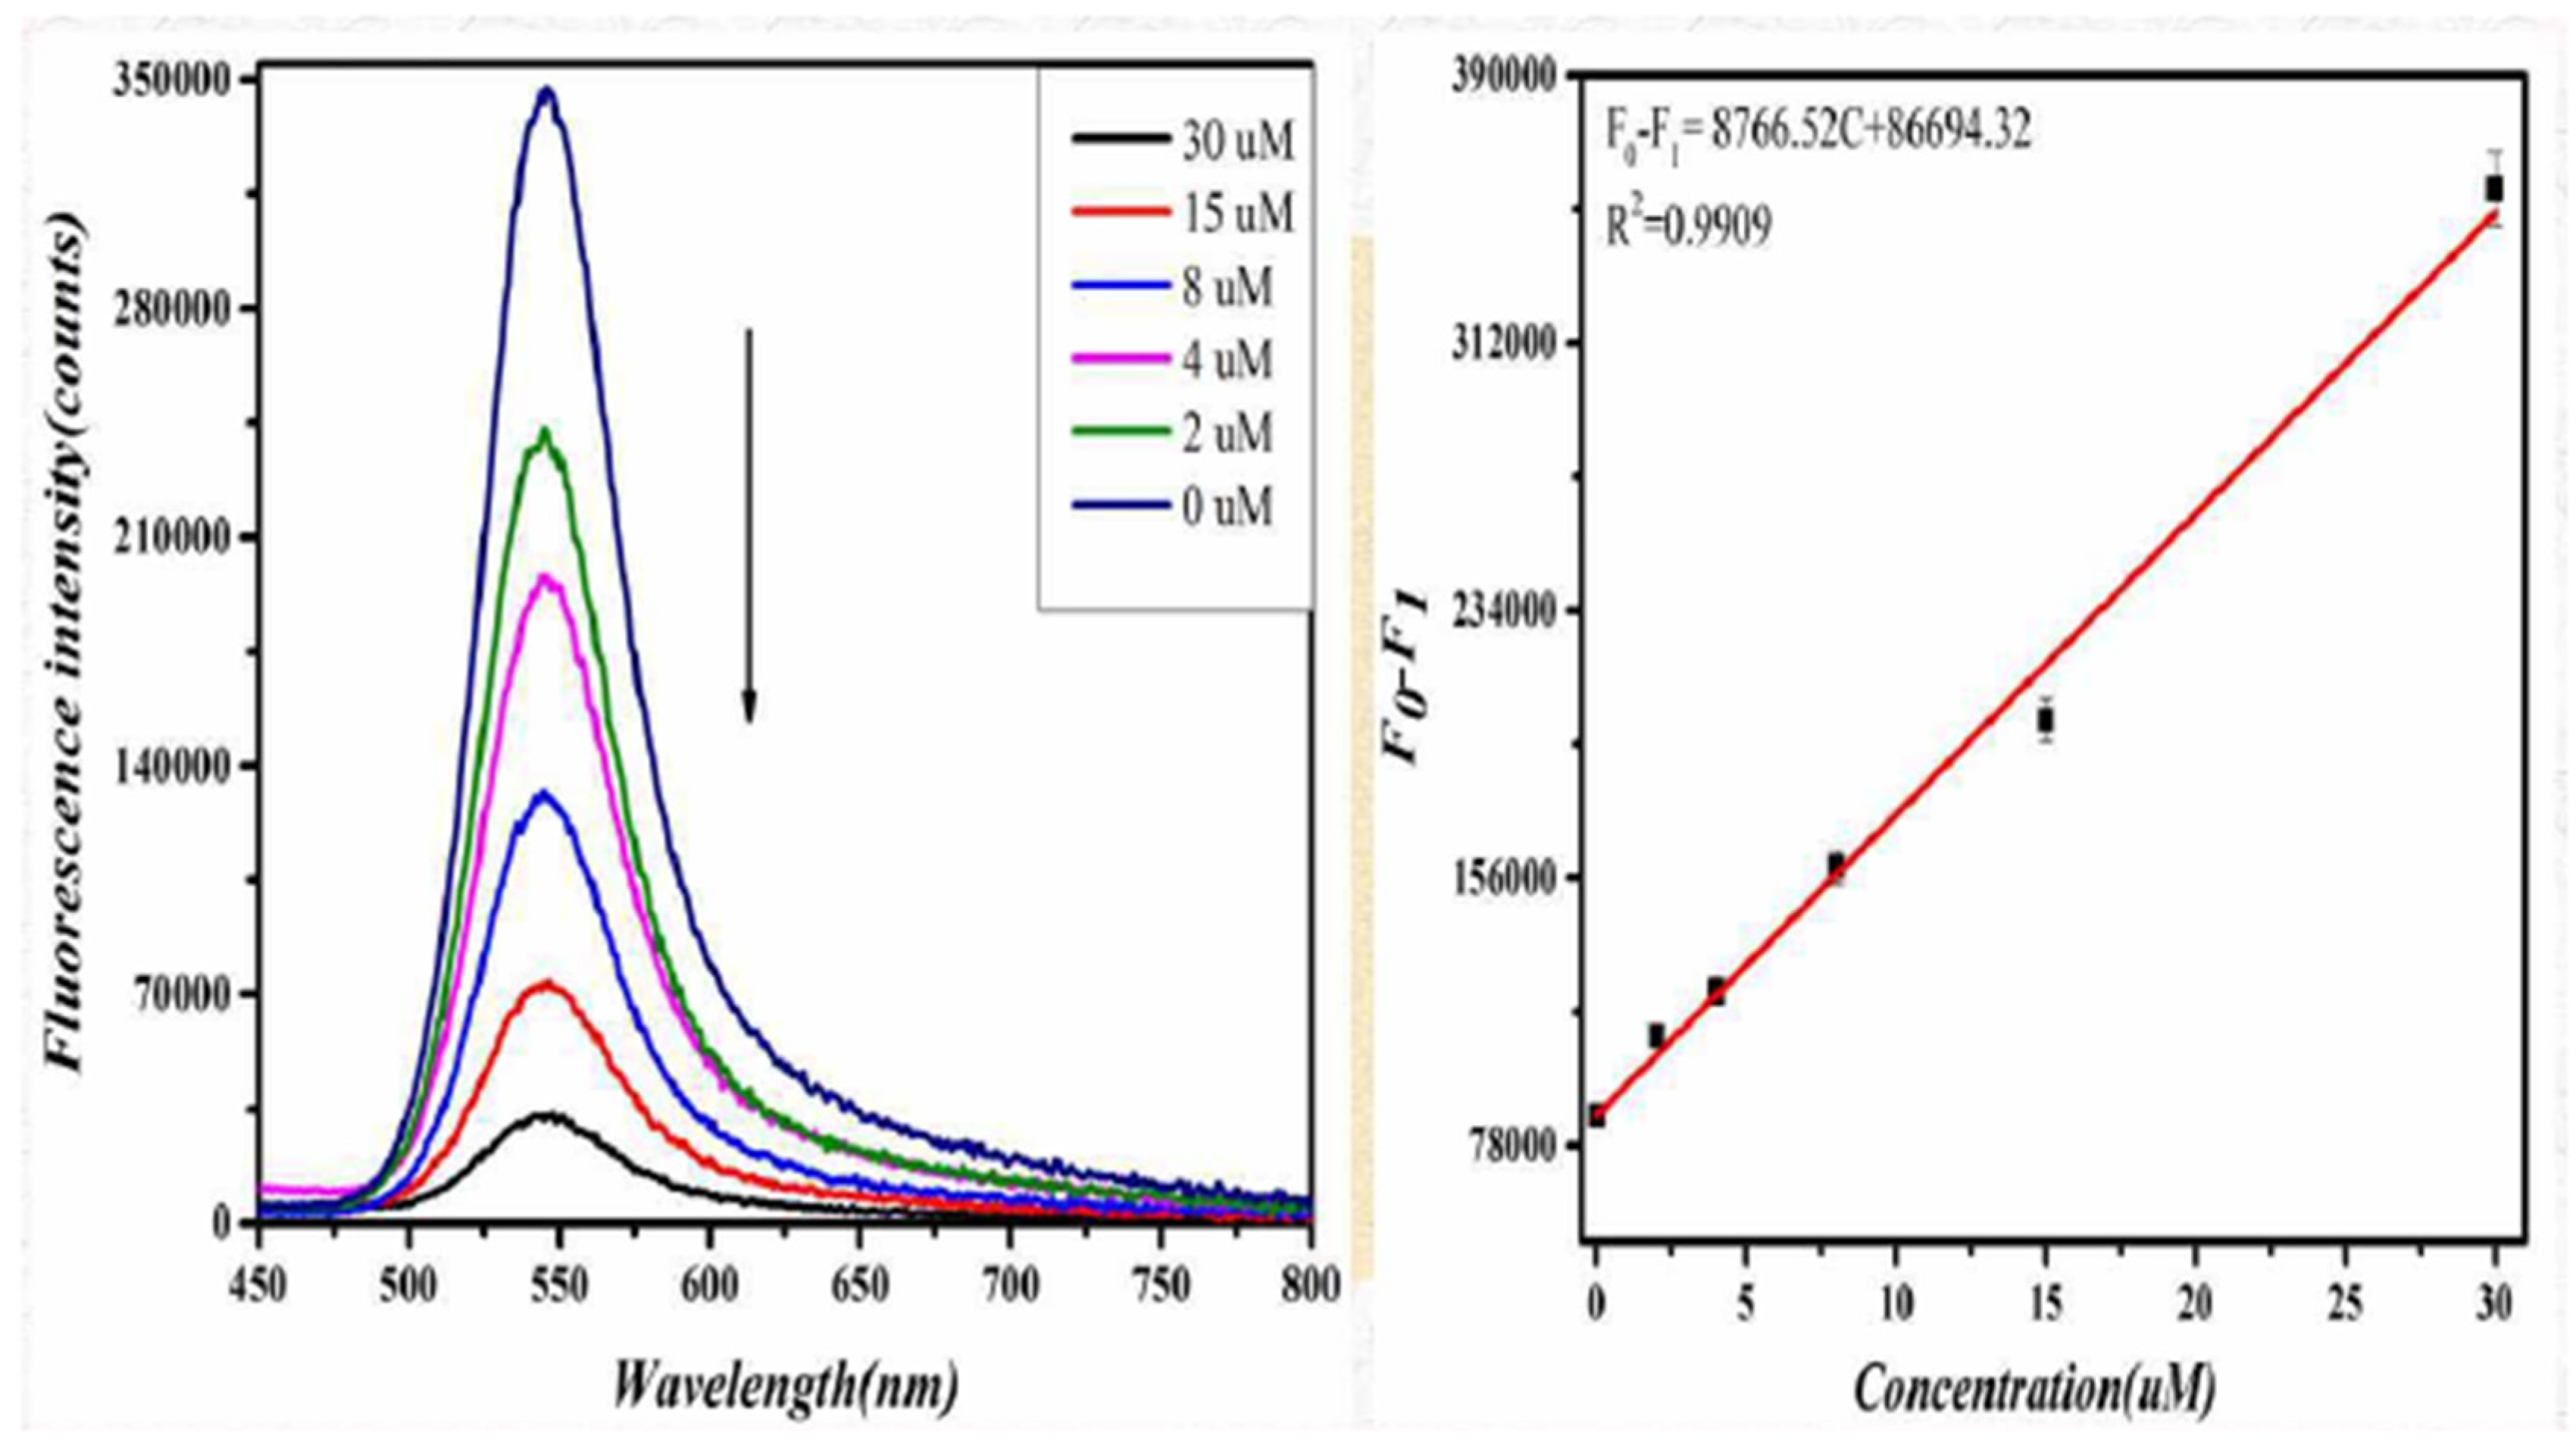
3.3. Change in Fluorescent Signal

The surface of GO has a large number of hydroxyl and carboxyl active groups, and many substances are easily embedded into the lamellar structure of GO through intermolecular hydrogen bonds, ionic bonds, covalent bonds, etc., forming a substance called the interlayer compound [1]. When GO-CdTe QDs react with CA enantiomers, due to the different spatial arrangement directions of its corresponding isomers, different ways appear in the embedding process. Compared with L-CA, D-CA has advantages in spatial arrangement. Therefore, D-CA can be smoothly embedded into the lamellae structure of GO, forming interlaminar compounds. The molecular volume is relatively small, and the fluorescence intensity is enhanced. In contrast, L-CA cannot be embedded into the GO laminar r, the molecular volume is larger, and the fluorescence signal is weakened after the reaction (Figure 5).

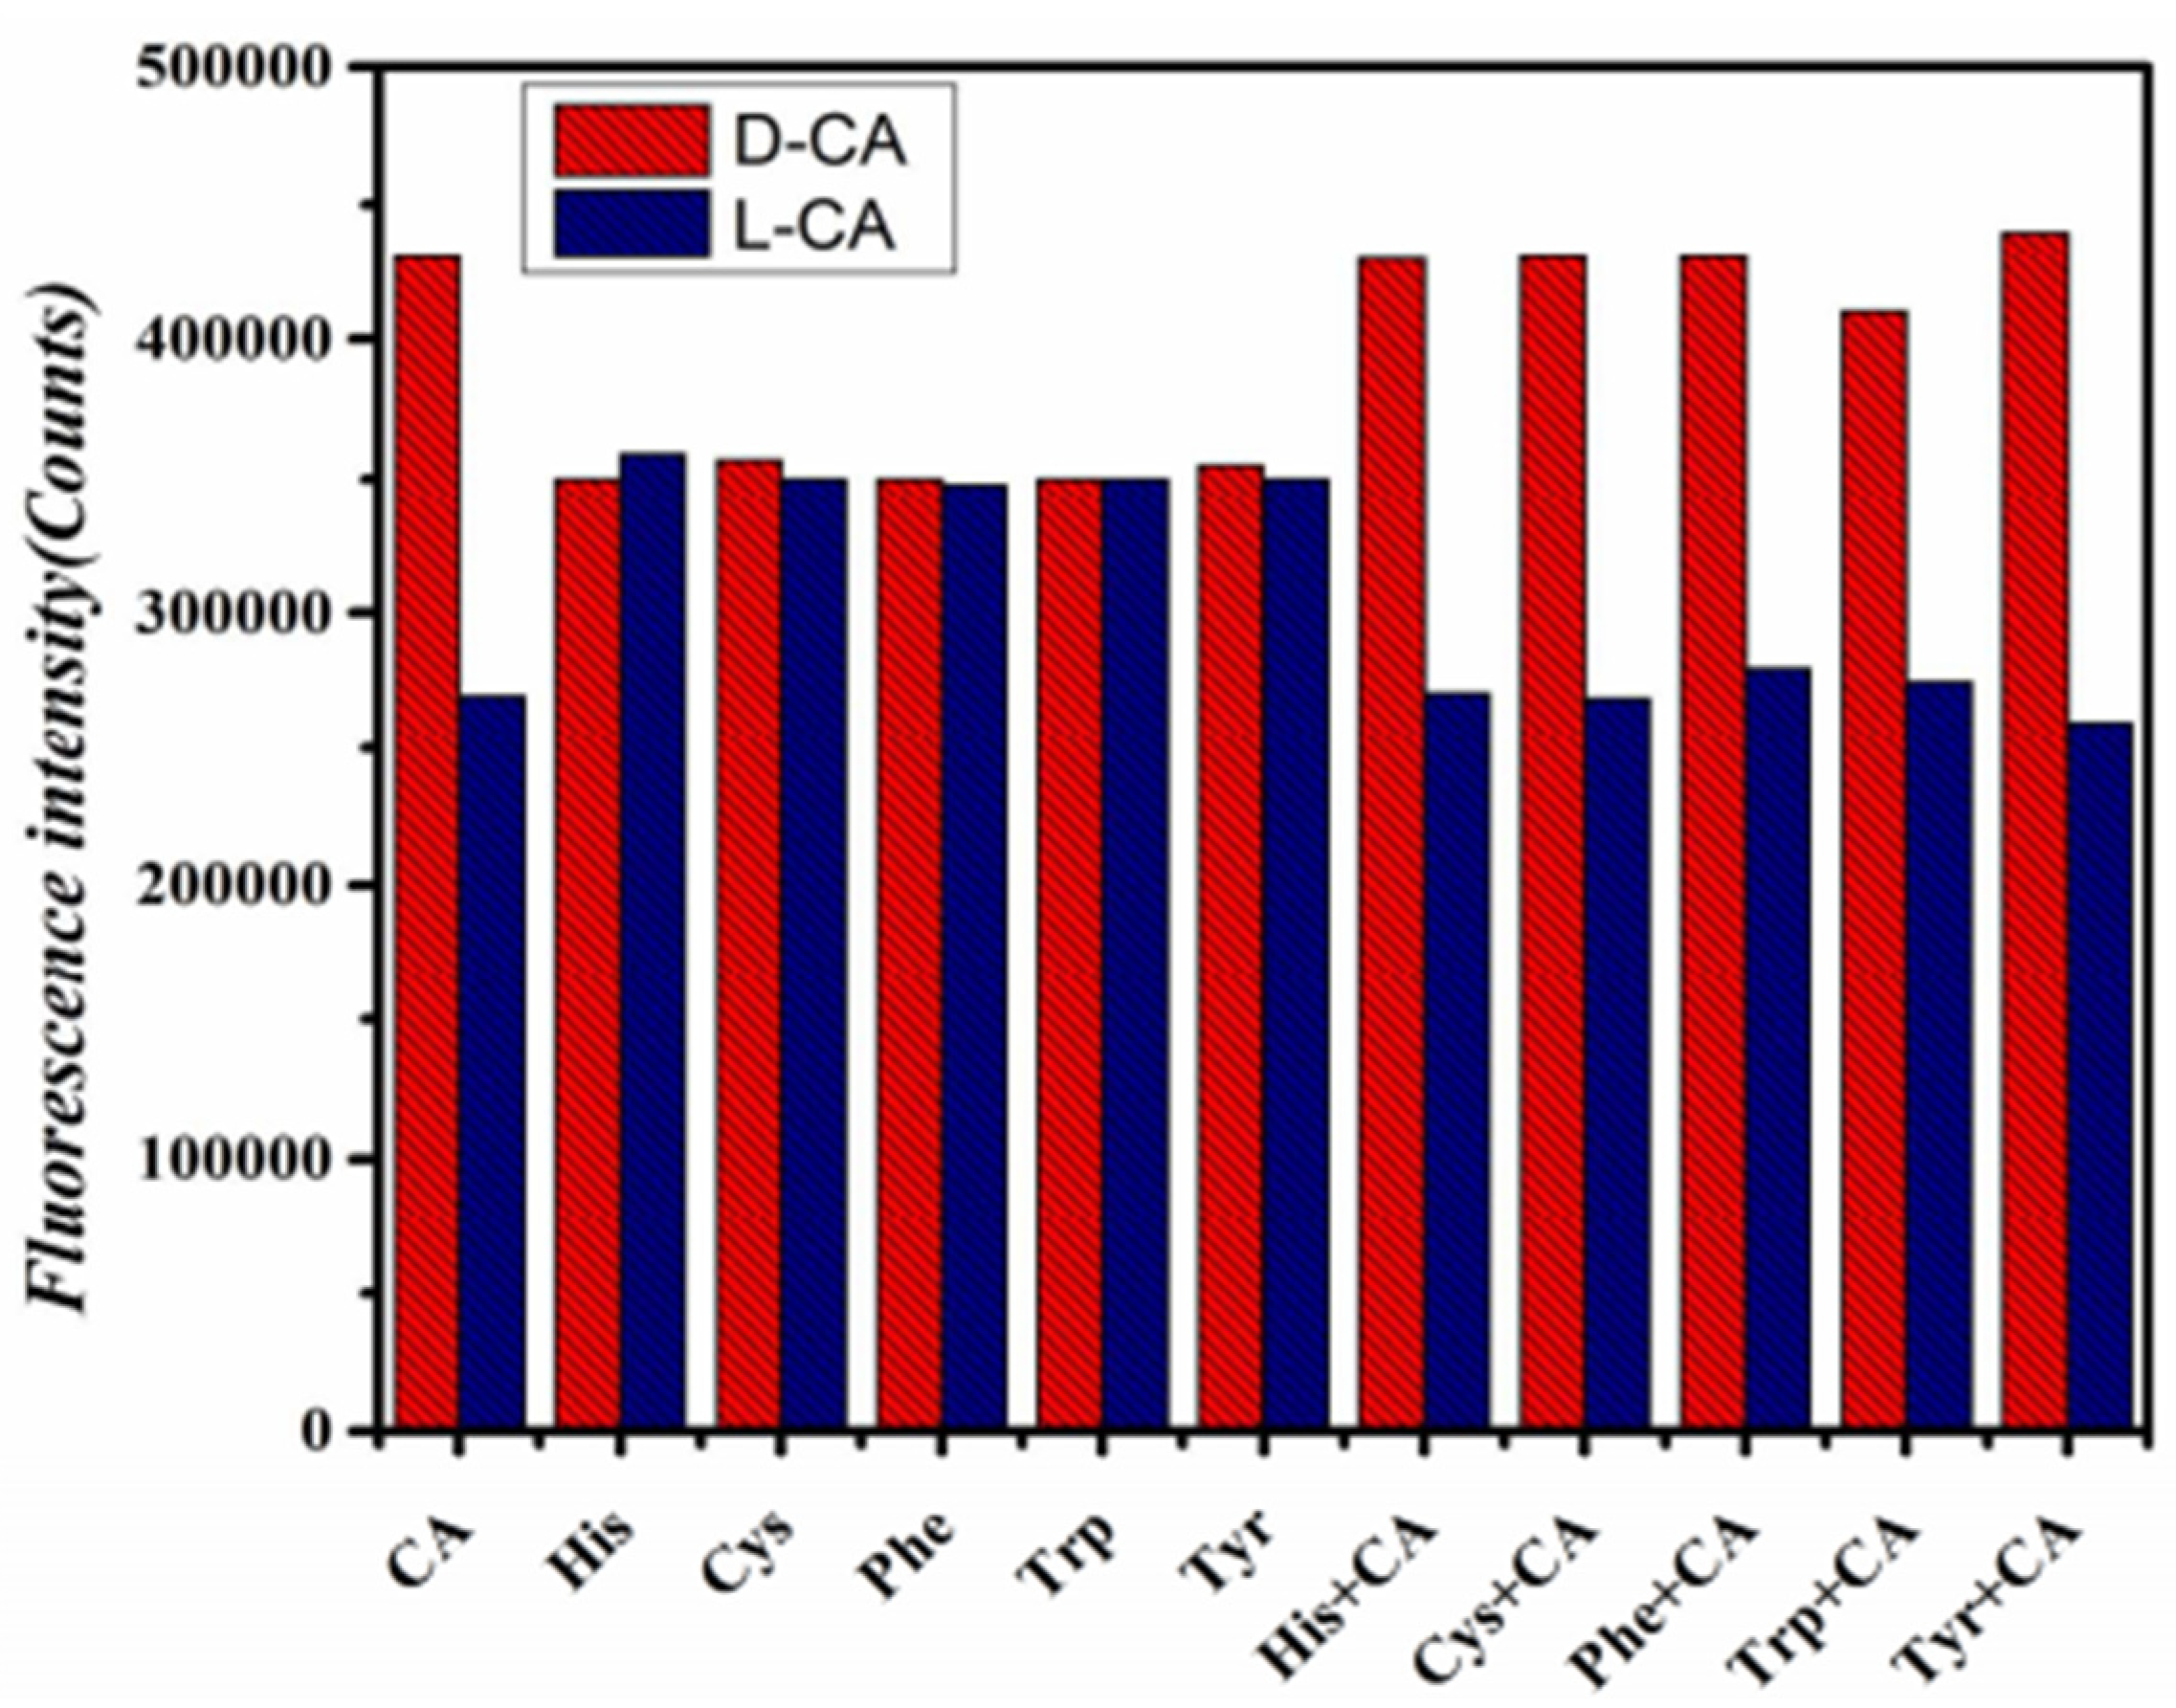
3.4. Selectivity of Proposed Method for CA Enantiomers

Under optimal experimental conditions, chiral amino acids such as His, Cys, Phe, Trp, and Tyr were selected for selective experiments. As shown in Figure 6, there was no significant change in fluorescence intensity after adding His, Cys, Phe, Trp, and Tyr enantiomers, respectively, to GO-CdTe QDs compared with CA enantiomers. However, when CA enantiomers were added to the above non-CA system, the fluorescence intensity changed again. These results confirm that the new fluorescence method with GO-CdTe QD as the fluorescent probe has good selectivity for CA enantiomers.

4. Real-Sample Assay

In order to further confirm the accuracy and reliability of the method for the determination of actual samples, the method was used for the determination of L-CA in L-CA tea polyphenol tablets by the spiked recovery method. L-CA tea polyphenol tablets (Guangdong Yichao Biotechnology Co., LTD, Guangdong, China, approval number: National Food Health word G20130769), sample specifications: 0.8 g/tablet. For 100 g sample/16 g CA, a sample was dissolved in a 1000 mL volumetric bottle, and the concentration of L-CA was calculated to be 7.9 × 10⁻⁴ mol/L. A 1 mL sample was given a fixed volume of 10 mL for testing, and then the labeled recovery method was adopted for the experiment, as shown in Table 1. Each experiment was performed 5 times, and the average value was taken. The experimental results are satisfactory.

5. Conclusions

CA is a non-essential amino acid and belongs to the quaternary ammonium salt compound. It has broad applications. In this study, a new nanomaterial GO was used for the first time to modify CdTe QD. CdTe QD cannot recognize CA enantiomers directly, but after being modified by GO, they showed excellent chiral selectivity. When L-CA was added to the GO-CdTe QDs, the fluorescence of the system was quenched. In contrast when D-CA was added, the fluorescence signal was enhanced. Based on the result, chiral identification and quantitative determination of CA enantiomers were realized. The detection limit obtained by this method reached 3.2 μM, and the linear range was 0–30 μM. After the optimization experiments, the optimal pH of D-CA was 8.5, the optimal dosage of GO-CdTe QD was 0.4 mL, and the optimal reaction time was 20 min. The method is simple, fast, and sensitive. The experimental results of analysis and application are satisfactory, and it has an application value.

Author Contributions

Investigation, conceptualization, writing—original draft preparation, writing—review and editing, visualization, H.Y.; writing—original draft preparation, the design of experiment supervision, project administration, funding acquisition, J.Y.; writing—Review & Editing, formal analysis, Y.M. and Y.Z.; writing—review and editing, formal analysis, data curation, Z.M., C.P. and Y.P. All authors have read and agreed to the published version of the manuscript.

Funding

This work was financially supported by the National Natural Science Foundation of China (Project No.: 21175015 and 21475014), and all authors here express their deep gratitude.

Institutional Review Board Statement

Not applicable.

Informed Consent Statement

Not applicable.

Data Availability Statement

The data that support the findings of this study are openly available on CNKI.

Conflicts of Interest

The authors declare no conflict of interest.

References

  1. Guoping, Z. Application of Chirality and Chiral Substances. J. Hubei Second Norm. Univ. 2013, 30, 28–31. [Google Scholar] [CrossRef]
  2. Wang, D.J.; Zhu, Z.X.; Wei, Y.; Deng, Z.; Miao, H. Effects of L-CA on microinflammatory status in patients with end-stage renal disease. Chin. Gerontol. 2009, 29, 467–469. [Google Scholar]
  3. Vogt, C.; Kiessig, S. Separation of D/L-CA enantiomers by capillary electrophoresis. J. Chromatogr. A 1996, 745, 53–60. [Google Scholar] [CrossRef]
  4. Zhao, Y.; Wu, H.; Yang, J. Prospect of chiral recognition methods in environmental analysis. J. Chongqing Three Gorges Univ. 2015, 31, 99–103. [Google Scholar]
  5. Rao, C.E.N.E.R.; Sood, A.E.K.; Subrahmanyam, K.E.S.; Govindaraj, A. Graphene: The new two-dimensional nanomaterial. Angew. Chem. Int. Ed. 2009, 48, 7752–7777. [Google Scholar] [CrossRef] [PubMed]
  6. Geim, A.K. Graphene: Status and prospects. Science 2009, 324, 1530–1534. [Google Scholar] [CrossRef] [PubMed]
  7. Wang, L.; Song, F.; Hou, J.; Li, J.; Cheng, Y.; Zhu, C. In situ Cu(II)-containing chiral polymer complex sensor for enantioselective recognition of phenylglycinol. Polymer 2012, 53, 6033–6038. [Google Scholar] [CrossRef]
  8. Ding, L.; Liu, P.; Li, S. Research progress on toxicity and safety of nanomaterials. Mater. Rev. 2010, 24, 29–32. [Google Scholar]
  9. Bremer, J. CA-metabolism and functions. Physiol. Rev. 1983, 63, 1420. [Google Scholar] [CrossRef] [PubMed]
  10. Haeckel, R.; Kaiser, E.; Oellerich, M.; Siliprandi, N. CA: Metabolism, function and clinical application. J. Clin. Chem. Clin. Biochem. Z. Klin. Chem. Klin. Biochem. 1990, 28, 291–295. [Google Scholar]
  11. Guo, Y.; Zeng, X.; Yuan, H.; Huang, Y.; Zhao, Y.; Wu, H.; Yang, J. Chiral recognition of phenylglycinol enantiomers based on N-acetyl-l-cysteine capped CdTe quantum dots in the presence of Ag. Spectrochim. Acta Part A Mol. Biomol. Spectrosc. 2017, 183, 23–29. [Google Scholar] [CrossRef] [PubMed]
Figure 1. TEM diagram and particle size histogram of GO-CdTe QDs. (a) Morphology and size were observed by using TEM at 5 nm. (b) Morphology and size were observed by using TEM at 20 nm. (c) Morphology and size were observed by using TEM at 50 nm. (d) The particle size is 3.15 nm.
Engproc 98 00034 g001
Figure 2. Fluorescence spectra of the reaction system.
Engproc 98 00034 g002
Figure 3. Fluorescence spectra of the probe due to introducing D-CA in the concentration range of 0 to 30 uM∙L−1 (left). The line calibration plot of the fluorescence intensity against the concentration of D-CA (right).
Engproc 98 00034 g003
Figure 4. Fluorescence spectra of the probe due to introducing L-CA in the concentration range of 0 to 30 μM∙L−1 (left). The line calibration plot of the fluorescence intensity against the concentration of L-CA (right).
Engproc 98 00034 g004
Figure 5. Mechanism of chiral recognition of CA enantiomers by GO-CdTe QDs.
Engproc 98 00034 g005
Figure 6. Selective experiment.
Engproc 98 00034 g006
Table 1. Recovery experiment of L-CA tea polyphenols tablets.
NumberValue
(g/tablet)
Added L-CA (g)Measured
L-CA (g)
Recovery Rate
(n = 5, %)
RSD
(%) (n = 5)
10.110.10.22104.12.1
20.090.20.2896.52.5
30.130.30.44102.32.2
Disclaimer/Publisher’s Note: The statements, opinions and data contained in all publications are solely those of the individual author(s) and contributor(s) and not of MDPI and/or the editor(s). MDPI and/or the editor(s) disclaim responsibility for any injury to people or property resulting from any ideas, methods, instructions or products referred to in the content.

