Proceeding Paper

Optimizing Safety Net Installation on Construction Sites Using YOLO and the Novel Linear Intersection over Union †

1
Department of Management Information Systems, National Chung Hsing University, Taichung 402202, Taiwan
2
Office of Physical Education and Sports, National Chung Hsing University, Taichung 402202, Taiwan
*
Author to whom correspondence should be addressed.
Presented at the 2024 4th International Conference on Social Sciences and Intelligence Management (SSIM 2024), Taichung, Taiwan, 20–22 December 2024.
Eng. Proc. 2025, 98(1), 27; https://doi.org/10.3390/engproc2025098027
Published: 30 June 2025

Abstract

This study aims to evaluate whether safety nets on construction sites are correctly installed using an image processing and deep learning technique. The developed method performs data preprocessing, including horizontal flipping, rotation, and contrast-limited adaptive histogram equalization, and then applies the YOLO model to estimate the accuracy of safety net installation. The developed method significantly improved the accuracy of the YOLO model detection and mitigated errors associated with large safety net surfaces and slanted steel beams using the novel linear intersection over union as a metric. The proposed method effectively improved the assessment of safety net installation.

1. Introduction

The construction industry has the highest incidence of occupational accidents, with fall injuries being the most common. Due to the complex environments of construction sites and the temporary nature of construction equipment assembly, workers are exposed to elevated risks. To minimize these risks, safety measures are used, including safety helmets, safety harnesses, safety cables, and safety nets. Safety helmets protect workers’ heads, safety harnesses and cables prevent falls from elevated areas, and safety nets act as a final line of defense, supporting falling workers or objects. Using these protective devices significantly reduces the risk of occupational accidents on construction sites.
In previous research on image-based detection methods for construction site safety, Du et al. proposed a hard hat detection method based on video sequences [1]. In the method, motion and color filtering, face detection, and hard hat detection were used. Hard hats were identified based on their color information from areas above the human face, with luminance (y), chrominance blue (cb), and chrominance red (cr) (YCbCr) and hue, saturation, and value (HSV) color spaces employed for area segmentation and detection. This method enabled the real-time detection of faces and hard hats on construction sites, enhancing safety measures. Weerasinghe et al. introduced a method using appropriately color-coded “construction safety helmets” as primary tracking objects to distinguish on-site personnel [2]. Their approach involved human body recognition, helmet recognition, and three-dimensional positioning. Hard hat detection requires specific features, such as the unique shape and color of the helmets, with template matching employed for pattern recognition. Xiong et al. proposed an automated hazard identification system (AHIS) using visual relationship recognition technology [3]. AHIS automatically detects hazards on construction sites by extracting operational descriptions from on-site videos and integrating them with a construction safety ontology. This system models visual relationships as connections between components or workers, encoding them using a three-tuple format.
Currently, convolutional neural networks (CNNs) are widely used in image recognition models since introduced by Yann et al. [4]. Object detection involves identifying the categories of objects in images and accurately locating their positions. Traditional object detection methods, such as the CNN (R-CNN) [5], fast R-CNN [6], and faster R-CNN [7] of regions, generate candidate frames before classification. While effective, these methods are computationally intensive and slow, limiting their real-time applicability. Redmon et al. proposed the You Only Look Once (YOLO) model, an end-to-end object detection framework that revolutionized previous detection methods [8]. YOLO transforms object detection into a single regression problem and predicts bounding boxes and object categories directly from images without generating candidate frames. This innovation significantly accelerates processing, making YOLO appropriate for real-time applications. YOLO’s development has enabled its widespread use in autonomous driving, surveillance systems, drones, and other fields requiring efficient visual processing. Such artificial intelligence (AI)-driven image recognition enhances safety measures and overall safety on construction sites [9].
Despite advancements in construction safety detection, limited research has been conducted on detecting safety nets at construction sites. Therefore, this study was conducted to develop a model to evaluate the effectiveness of safety net detection utilizing image processing techniques and the YOLO object detection model. The results can be used to improve detection accuracy and enhance construction site safety.

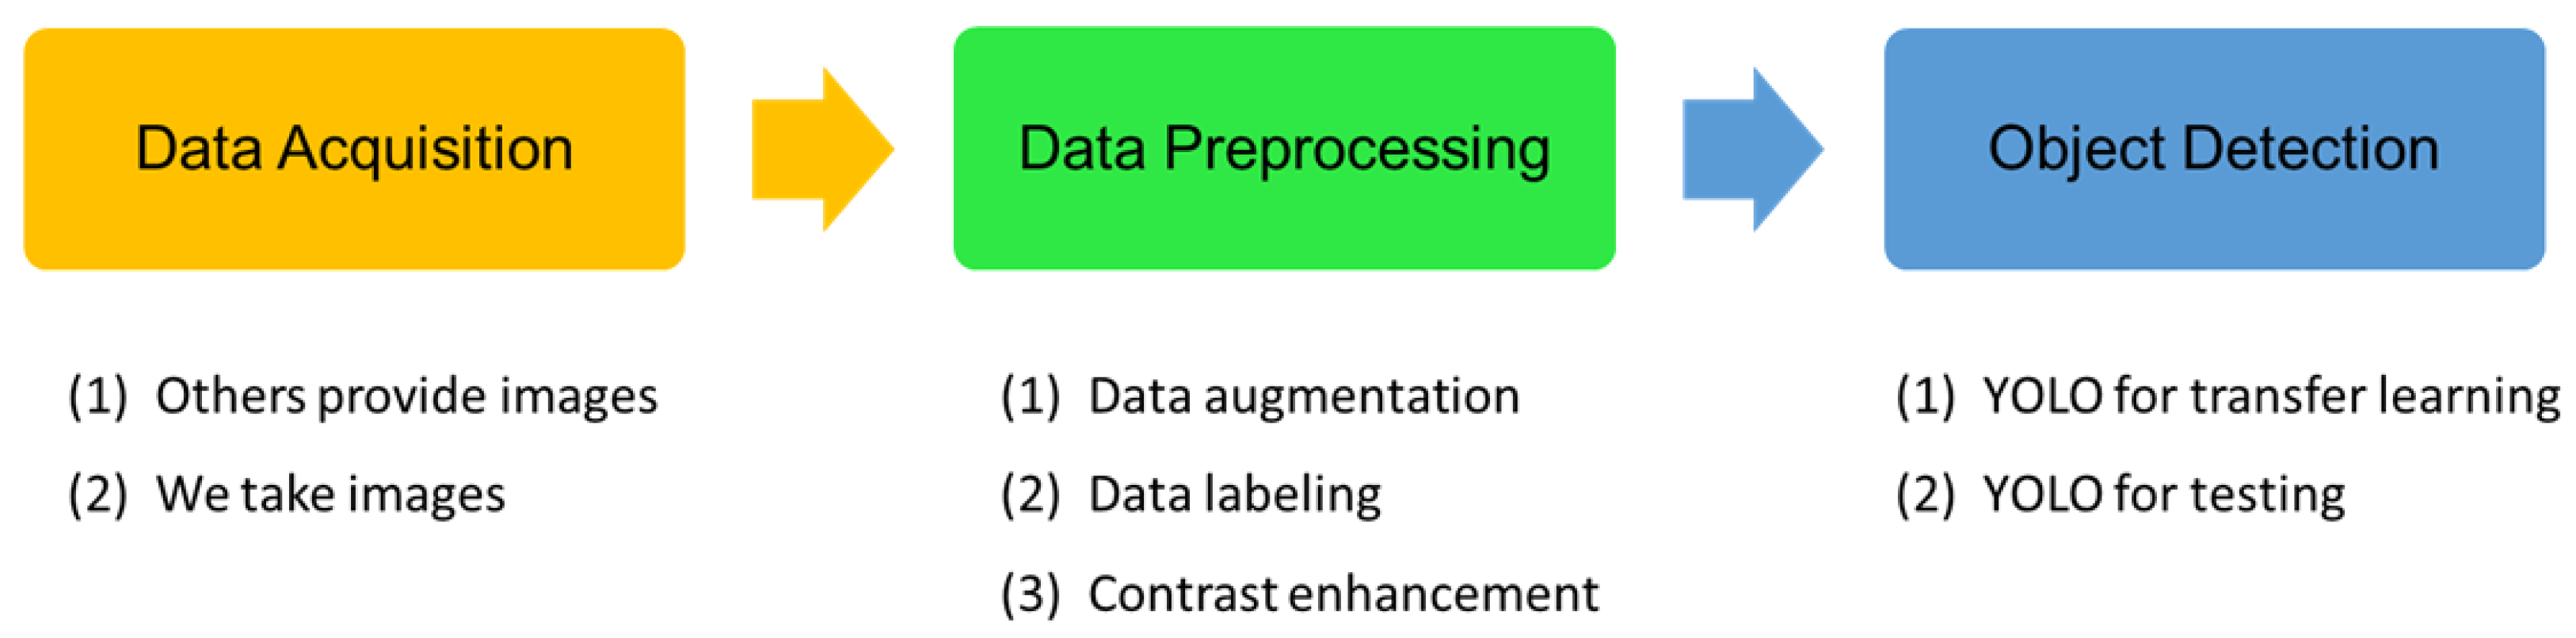
2. Materials and Methods

We used the YOLOv4 [10] object detection model to detect construction site safety nets. The detection process includes data acquisition, data preprocessing, and target detection (Figure 1). In the data acquisition stage, image data were compiled. Then, the images were augmented, labeled, and enhanced for image contrast. Object detection was applied in the YOLOv4 object detection model for transfer learning and testing its performance.

2.1. Data Acquisition

The safety net data set used in this study was obtained from Professor Chung-Ho Huang’s laboratory at the National Taipei University of Technology. The data also included the images of construction site safety nets which were taken in this study. From 2020 to 2021, a total of 257 construction site safety net images were taken at multiple high-rise steel structure construction sites.

2.2. Data Preprocessing

2.2.1. Data Augmentation

Sample imbalance hinders a model’s ability to effectively learn from data in fewer categories. Data augmentation mitigates this issue, reduces overfitting, and enhances model robustness and generalization. Minimizing class imbalance is crucial in training an object detection model [11]. The image dataset used in this study exhibited class imbalance. Therefore, data augmentation such as rotation and flipping was applied to the data. However, to prevent excessive distortion of the construction site safety net’s appearance, the rotation angles of −10° and +10° were used.

2.2.2. Data Labeling

We classified images into two categories of OK when the edge of the safety net was securely connected to the steel beam and NG when there was no secure connection between the net’s edge and the steel beam, resulting in a visible hole. Due to the skewed angles of steel beams, overly large bounding boxes poorly reflect the actual object’s size, impeding model learning. To address this, we used a large number of precise bounding boxes to capture the connections between safety net edges and steel beams.

2.2.3. Contrast Enhancement

In this study, several safety net images were overly bright or dark due to variations in illumination angles or obstructions. This resulted in the gray value concentrated within a narrow range, reducing contrast and making image details unclear. By enhancing the image contrast by widening the gray value range or evenly redistributing the gray-scaled area, detail visibility, and clarity were obtained. To address this issue, we applied image processing to enhance image contrast and make object outlines more distinct. This improvement allowed the model to better learn and recognize features during training, ultimately enhancing detection accuracy. To enhance image contrast, we employed three image processing methods: histogram stretching (HS) [12], histogram equalization (HE), and contrast-limited adaptive and histogram equalization (CLAHE).
HS is used to redistribute pixel values across the entire range based on the image’s actual brightness distribution. This enhances local contrast and the overall contrast of the image. HS stretches the image’s histogram so that its gray values are spanned to the full range from 0 to 255. The widened contrast makes object outlines more distinct and easier to identify. The calculation method for HS is presented in (1).
H S I = R o u n d I I m i n I m a x I m i n × L 1
where I is the pixel value of the image, I m i n is the minimum value among all pixels, I m a x is the maximum value among all pixels, L is the total number of pixels, and the R o u n d function rounds off the decimal point to an integer.
HE is used to adjust the histogram of the original image to be approximately evenly distributed across the entire grayscale range, enhancing the image’s overall contrast. The cumulative distribution function (CDF) is used as the mapping function to redistribute the gray values ranging from 0 to 255. The calculation method for HE is (2).
H E i = R o u n d C D F i C D F m i n C D F m a x C D F m i n × L 1
where i is the pixel value of the image, C D F i is the CDF of pixel value i , C D F m i n is the CDF of the minimum pixel value, C D F m a x is the CDF of the maximum pixel value, L is the total number of pixels, and the R o u n d function rounds off the decimal point to an integer.
CLAHE is particularly effective for improving local contrast and enhancing edge sharpness in specific regions of an image. It is used to divide the image into multiple smaller regions and applies HE to each region individually. This localized approach makes CLAHE more appropriate than HE for enhancing local contrast in images with varying brightness levels.

2.3. Object Detection

Transfer learning is a machine learning technique that leverages knowledge gained from training one model to address similar problems in other models. It has been widely applied in object detection tasks [13,14]. In this study, the YOLO model was used as a pre-trained model on the MS COCO open-source dataset. This model is fine-tuned with construction site safety net data to adapt it to the specific task. The YOLOv4 model architecture comprised a backbone, neck, and head. In the backbone, Darknet53 combined with the cross-stage partial network (CSPNet) was used [15]. The neck incorporated spatial pyramid pooling (SPP) [16] and path aggregation network (PANet) [17]. The Head output predictions on three different scales for multi-scale object detection.

2.4. Linear Intersection over Union (LIOU)

Since the area between the safety net and the steel beam occupied most of the image and the steel beam’s angles vary, using a single bounding box for labeling was insufficient for accurate interpretation. To address this, the linearity of the steel beam was used as the primary element for annotation. In labeling images, the actual steel beam sections were used as line segments and categorized by their attributes. Each steel beam section was labeled with its category, start and end points, direction, identifier, and coordinates. For model prediction, the number of pixels where the predicted frame overlapped with the corresponding labeled line segment was calculated.

3. Results

3.1. Data Augmentation Results

Two methods of data augmentation were used and their results were compared; horizontal flipping, and horizontal flipping and rotation. After horizontal flipping, the total number of images increased to 359, and after adding rotation, it increased further to 1077. The YOLOv4 model was employed with the threshold of an intersection over union (IOU) of 0.5. The results are shown in Table 1. The data augmented with horizontal flipping and rotation outperformed the one with horizontal flipping alone, improving the F1 score by 0.2.

3.2. Contrast Enhancement Comparison Experiment Results

For contrast enhancement, HS, HE, and CLAHE were evaluated. The YOLOv4 model was used with an IOU threshold of 0.5. The results are presented in Table 2. CLAHE was the most effective contrast enhancement method, improving the F1 score from 0.60 to 0.64.

3.3. Object Detection Model Comparison

For object detection, YOLO models including YOLOv3 [18], YOLOv4, and YOLOv5 [19] were used. The construction site safety net image dataset was split into a training set (70%) and a test set (30%). The results are summarized in Table 3. YOLOv4 and YOLOv5 achieved the best performance, both with an F1 score of 0.64.

3.4. Evaluation Metrics

Two evaluation metrics, IOU and LIOU were used, as compared in Table 4. LIOU enabled better results, demonstrating its effectiveness in assessing safety net detection.

4. Conclusions

We applied the YOLOv4 model to detect and assess the safety of construction site safety nets. The model conducted data processing, model training, and evaluation optimization. The model enhanced construction site safety management practices and addressed the limitations of traditional bounding box evaluation methods in assessing safety net detection. By using LIOU, the model’s performance for safety nets was accurately assessed as the nets are widely used with irregular shapes. Due to limited data availability, complex backgrounds, and subtle target features, instance segmentation is needed which necessitates further research. By employing pixel-level segmentation, the gap between the safety net and the steel beam can be precisely estimated, enabling an accurate assessment of the safety of the net installation to meet safety standards.

Author Contributions

Conceptualization, Y.-H.T., Y.-H.L., H.-C.H. and M.-H.T.; methodology, Y.-H.T. and Y.-H.L.; software, Y.-H.L.; validation, Y.-H.T.; formal analysis, Y.-H.T. and Y.-H.L.; investigation, Y.-H.L.; resources, Y.-H.T.; data curation, Y.-H.L.; writing—original draft preparation, Y.-H.T. and Y.-H.L.; writing—review and editing, Y.-H.T.; visualization, Y.-H.L.; supervision, H.-C.H.; project administration, M.-H.T. All authors have read and agreed to the published version of the manuscript.

Funding

This research received no external funding.

Institutional Review Board Statement

Not applicable.

Informed Consent Statement

Not applicable.

Data Availability Statement

The labeled datasets used to support the findings of this study are available from the corresponding author upon request.

Acknowledgments

Thanks to Chung-Ho Huang’s laboratory at National Taipei University of Technology for providing images of the construction site safety net data set.

Conflicts of Interest

The authors declare no conflicts of interest.

References

  1. Du, S.; Shehata, M.; Badawy, W. Hard hat detection in video sequences based on face features, motion and color information. In Proceedings of the 2011 3rd International Conference on Computer Research and Development, Shanghai, China, 11–13 March 2011; Volume 4, pp. 25–29. [Google Scholar]
  2. Weerasinghe, I.P.T.; Ruwanpura, J.Y.; Boyd, J.E.; Habib, A.F. Application of Microsoft Kinect Sensor for Tracking Construction Workers. In Proceedings of the Construction Research Congress, West Lafayette, IN, USA, 21–23 May 2012; American Society of Civil Engineers: Reston, VA, USA, 2012; pp. 858–867. [Google Scholar]
  3. Xiong, R.; Song, Y.; Li, H.; Wang, Y. Onsite video mining for construction hazards identification with visual relationships. Adv. Eng. Inform. 2019, 42, 100966. [Google Scholar] [CrossRef]
  4. Lecun, Y.; Bottou, L.; Bengio, Y.; Haffner, P. Gradient-Based Learning Applied to Document Recognition. Proc. IEEE 1998, 86, 2278–2324. [Google Scholar] [CrossRef]
  5. Girshick, R.; Donahue, J.; Darrell, T.; Malik, J. Rich feature hierarchies for accurate object detection and semantic segmentation. In Proceedings of the IEEE Conference on Computer Vision and Pattern Recognition, Columbus, OH, USA, 23–28 June 2014; pp. 580–587. [Google Scholar]
  6. Girshick, R. Fast r-cnn. In Proceedings of the IEEE International Conference on Computer Vision, Santiago, Chile, 7–13 December 2015; pp. 1440–1448. [Google Scholar]
  7. Ren, S.; He, K.; Girshick, R.; Sun, J. Faster r-cnn: Towards real-time object detection with region proposal networks. IEEE Trans. Pattern Anal. Mach. Intell. 2016, 39, 1137–1149. [Google Scholar] [CrossRef] [PubMed]
  8. Redmon, J.; Divvala, S.; Girshick, R.; Farhadi, A. You only look once: Unified, real-time object detection. In Proceedings of the IEEE Conference on Computer Vision and Pattern Recognition, Las Vegas, NV, USA, 27–30 June 2016; pp. 779–788. [Google Scholar]
  9. Nath, N.D.; Behzadan, A.H. Deep Convolutional Networks for Construction Object Detection Under Different Visual Conditions. Front. Built Environ. 2020, 6, 97. [Google Scholar] [CrossRef]
  10. Bochkovskiy, A.; Wang, C.Y.; Liao, H.Y.M. Yolov4: Optimal speed and accuracy of object detection. arXiv 2020, arXiv:2004.10934. [Google Scholar]
  11. Oksuz, K.; Cam, B.C.; Kalkan, S.; Akbas, E. Imbalance problems in object detection: A review. IEEE Trans. Pattern Anal. Mach. Intell. 2020, 43, 3388–3415. [Google Scholar] [CrossRef] [PubMed]
  12. Im, J.; Jeon, J.; Hayes, M.H.; Paik, J. Single image-based ghost-free high dynamic range imaging using local histogram stretching and spatially-adaptive denoising. IEEE Trans. Consum. Electron. 2011, 57, 1478–1484. [Google Scholar] [CrossRef]
  13. Lim, J.J.; Salakhutdinov, R.; Torralba, A. Transfer learning by borrowing examples for multiclass object detection. In Proceedings of the International Conference on Neural Information Processing Systems, Granada, Spain, 12–17 December 2011; Curran Associates Inc.: Vancouver, BC, Canada, 2011; pp. 118–126. [Google Scholar]
  14. Shin, H.C.; Roth, H.R.; Gao, M.; Lu, L.; Xu, Z.; Nogues, I.; Yao, J.; Mollura, D.; Summers, R.M. Deep convolutional neural networks for computer-aided detection: CNN architectures, dataset characteristics and transfer learning. IEEE Trans. Med. Imaging 2016, 35, 1285–1298. [Google Scholar] [CrossRef] [PubMed]
  15. Wang, C.Y.; Liao, H.Y.M.; Wu, Y.H.; Chen, P.Y.; Hsieh, J.W.; Yeh, I.H. CSPNet: A new backbone that can enhance learning capability of CNN. In Proceedings of the IEEE/CVF Conference on Computer Vision and Pattern Recognition Workshops, Seattle, WA, USA, 14–19 June 2020; pp. 390–391. [Google Scholar]
  16. He, K.; Zhang, X.; Ren, S.; Sun, J. Spatial pyramid pooling in deep convolutional networks for visual recognition. IEEE Trans. Pattern Anal. Mach. Intell. 2015, 37, 1904–1916. [Google Scholar] [CrossRef] [PubMed]
  17. Liu, S.; Qi, L.; Qin, H.; Shi, J.; Jia, J. Path aggregation network for instance segmentation. In Proceedings of the IEEE Conference on Computer Vision and Pattern Recognition, Salt Lake City, UT, USA, 18–23 June 2018; pp. 8759–8768. [Google Scholar]
  18. Redmon, J.; Farhadi, A. Yolov3: An incremental improvement. arXiv 2018, arXiv:1804.02767. [Google Scholar]
  19. Jocher, G. YOLOv5 by Ultralytics. 2020. Available online: https://github.com/ultralytics/yolov5 (accessed on 22 November 2022).
Figure 1. Process of YOLOv4 object detection model.
Engproc 98 00027 g001
Table 1. Data augmentation result comparison.
Data AugmentationPrecision RecallF1-Score
Horizontal flipping0.560.320.4
Horizontal flipping + rotation0.600.590.6
Table 2. Contrast enhancement result comparison.
Contrast Enhancement Precision RecallF1-Score
Original image0.600.590.60
HE0.640.620.63
HS0.690.310.43
CLAHE0.800.540.64
Table 3. Comparison of object detection model results.
ModelPrecision RecallF1-Score
YOLOv30.760.530.63
YOLOv40.800.540.64
YOLOv50.590.710.64
Table 4. Evaluation metric comparison.
Metric Precision RecallF1-Score
IOU0.800.540.64
LIOU0.990.900.94
Disclaimer/Publisher’s Note: The statements, opinions and data contained in all publications are solely those of the individual author(s) and contributor(s) and not of MDPI and/or the editor(s). MDPI and/or the editor(s) disclaim responsibility for any injury to people or property resulting from any ideas, methods, instructions or products referred to in the content.

