Abstract
This paper presents a novel approach to supplier clustering by utilizing the Arithmetic Optimizer Algorithm (AOA), addressing the complex challenge of supplier segmentation in modern supply chain management. The AOA framework is applied to solve the multi-criteria clustering problem inherent to supplier classification. Using a real-world dataset of 500 suppliers with 12 performance criteria, including cost, quality, delivery reliability, and sustainability metrics, our method demonstrates effective clustering performance compared to conventional techniques. The AOA achieves a silhouette coefficient of 56.5% and a Davies–Bouldin index of 56.6%, outperforming several other state-of-the-art metaheuristic algorithms, including the Grey Wolf Optimizer (GWO), Whale Optimization Algorithm (WOA), Salp Swarm Algorithm (SSA), and Harris Hawks Optimization (HHO). The algorithm’s robustness is validated through extensive sensitivity analysis and statistical tests. The results indicate that the proposed approach successfully identifies distinct supplier segments with approximately 85% accuracy, enabling more effective supplier relationship management strategies.
1. Introduction
The increasing complexity of global supply chains has created unprecedented challenges in supplier management and evaluation [1]. Organizations must handle vast amounts of supplier data across multiple performance criteria, making traditional manual analysis methods insufficient and potentially suboptimal [2]. This complexity is further amplified by the need to consider various factors simultaneously, including cost, quality, delivery performance, sustainability metrics, and risk factors, necessitating more sophisticated approaches to supplier segmentation and management [3].
Supplier clustering, as a strategic tool in supply chain management, enables organizations to systematically categorize suppliers based on multiple performance criteria, facilitating more effective supplier relationship management and strategic decision-making [4]. However, conventional clustering techniques often struggle with the high-dimensional nature of supplier data and the inherent complexity of finding optimal cluster configurations that meaningfully represent supplier segments [5]. These challenges are particularly evident when dealing with large-scale supplier datasets where traditional clustering methods [6] may fail to capture subtle patterns and relationships.
Recent advancements in computational intelligence, particularly in metaheuristic optimization algorithms, have shown promising results in addressing complex clustering problems [7]. Notably, hybrid metaheuristic models have emerged as powerful tools in clustering contexts. A two-stage hybrid model combining the Eagle Strategy and the Slime Mould Algorithm has demonstrated promising clustering performance, reinforcing the value of integrating multiple optimization strategies [8]. Among various metaheuristic algorithms, the Arithmetic Optimizer Algorithm (AOA) [9] has emerged as an effective approach for solving optimization problems, demonstrating strong potential for clustering applications. The AOA employs fundamental arithmetic operations to navigate the search space efficiently, making it suitable for supplier clustering challenges.
This paper proposes a novel application of the Arithmetic Optimizer Algorithm to supplier clustering, leveraging its mathematical foundation and optimization capabilities to identify meaningful supplier segments. By formulating supplier clustering as an optimization problem, AOA can effectively identify optimal cluster configurations that traditional methods might miss [10].
Recent developments in nature-inspired algorithms have also shown the importance of incorporating Lévy flight patterns for enhanced exploration capabilities [11], which provides additional theoretical foundation for our approach. Furthermore, the practical applications of supplier segmentation have been extensively studied, showing clear benefits for procurement strategies [12].
The main research questions addressed in this study are as follows:
- How can the Arithmetic Optimizer Algorithm be effectively applied to supplier clustering problems to address the limitations of traditional clustering methods?
- Does the AOA maintain robust performance on large-scale supplier data with over 12 conflicting criteria?
- How does the AOA compare with state-of-the-art metaheuristic techniques (e.g., GWO [13], WOA [14], SSA [15], and HHO [16]) in terms of convergence speed, clustering accuracy, and computational efficiency?
- What are the practical implications and challenges of implementing the AOA-based clustering framework in real-world supplier segmentation and industrial decision-making processes?
- How can the insights from AOA-based supplier segments be translated into effective supplier relationship management strategies?
The remainder of this paper is organized as follows: Section 2 presents the theoretical background of data clustering in the context of supplier segmentation. Section 3 introduces the AOA methodology and its implementation for supplier clustering. Section 4 presents the experimental results and comparative analysis against other algorithms. Finally, Section 5 concludes the paper with a summary of the findings and directions for future research.
2. Data Clustering in Supplier Segmentation
2.1. Theoretical Background
Data clustering is an unsupervised learning technique that aims to partition a set of objects into groups (clusters) such that objects within the same cluster exhibit higher similarity compared to objects in different clusters [17]. In the context of supplier segmentation, let represent a set of n suppliers, where each supplier is characterized by a vector of m performance criteria . The objective is to partition S into k disjoint clusters while optimizing specific clustering criteria.
2.2. Problem Formulation
The supplier clustering problem can be formally defined as an optimization problem seeking to minimize the within-cluster sum of squares (WCSS), as shown in Equation (1):
where represents the centroid of cluster , calculated as Equation (2):
subject to the following constraints given in Equation (3):
2.3. Performance Evaluation Metrics
The quality of supplier clustering solutions is evaluated using several metrics:
2.3.1. Silhouette Coefficient
The silhouette coefficient (SC) [18] measures both cohesion and separation. It is calculated as shown in Equation (4):
where is the average distance between supplier and all other suppliers in its cluster, and is the minimum average distance between and suppliers in other clusters.
2.3.2. Davies–Bouldin Index
The Davies–Bouldin index (DBI) [19] evaluates the ratio of within-cluster scatter to between-cluster separation. It is calculated as shown in Equation (5):
where represents the average distance of suppliers in cluster i to their centroid, and is the distance between the centroids of clusters i and j.
2.4. Supplier Performance Criteria
The performance criteria considered in this study include [12]
- Cost metrics:
- Unit price ();
- Total cost of ownership ();
- Payment terms ().
- Quality metrics:
- Defect rate ();
- Quality certification ();
- Process capability ().
- Delivery metrics:
- On-time delivery rate ();
- Lead time ();
- Flexibility ().
- Sustainability metrics:
- Environmental compliance ();
- Social responsibility ();
- Innovation capability ().
2.5. Data Preprocessing
Prior to clustering, the supplier performance data undergoes several preprocessing steps:
where represents the normalized value of the j-th criterion for supplier i. This normalization ensures all criteria are scaled to the range [0, 1], eliminating the bias from different measurement units, as defined in Equation (6).
For criteria where lower values are preferred (e.g., defect rate, lead time), the values are transformed using Equation (7):
The preprocessed data matrix serves as input for the clustering algorithm, where each row represents a supplier’s normalized performance profile across all criteria.
3. Arithmetic Optimizer Algorithm for Supplier Clustering
3.1. Standard Arithmetic Optimization Algorithm
The Arithmetic Optimization Algorithm (AOA) [9] is a population-based metaheuristic algorithm inspired by the fundamental concepts of arithmetic operations. The algorithm employs four basic arithmetic operators (addition, subtraction, multiplication, and division) to explore the search space and find optimal solutions.
The position update in the AOA is governed by Equation (8):
where
- is the updated position of the i-th solution in dimension j;
- represents the best solution found so far in dimension j;
- (Math Optimizer Probability) controls the exploration–exploitation balance;
- (Math Optimizer Accelerated) determines the selection of operators;
- and are the upper and lower bounds of dimension j;
- is a random number in [0, 1];
- is a small constant to avoid division by zero.
The Math Optimizer Probability (MOP) decreases linearly over iterations to balance exploration and exploitation, as shown in Equation (9):
where t is the current iteration, T is the maximum number of iterations, and and are the minimum and maximum probability bounds.
3.2. Algorithm Implementation
The complete AOA implementation for supplier clustering follows these steps:
- Initialize population ;
- Define clustering objective function ;
- For each iteration to T:
- Return best clustering solution .
The strength of the AOA for clustering problems lies in its effective balance between exploration and exploitation through arithmetic operations, which are particularly well suited for numerical optimization problems such as finding optimal cluster centroids [7].
4. AOA-Based Supplier Clustering
4.1. Solution Representation
In the context of supplier clustering, each solution represents a set of cluster centroids. For a problem with K clusters and D performance criteria, a solution X is encoded as shown in Equation (10):
where represents the j-th criterion value of the i-th cluster centroid.
4.2. Objective Function
The clustering quality is evaluated using the within-cluster sum of squares (WCSS) objective function, as described in Equation (11):
where is the set of suppliers assigned to cluster i, s represents a supplier’s performance vector, and is the centroid of cluster i.
4.3. AOA Clustering Algorithm
The AOA clustering process consists of the following steps:
- Generate an initial population of N solutions randomly within the performance criteria bounds using Equation (12):where and are vectors containing the minimum and maximum values for each performance criterion.
- Update the Math Optimizer Probability () based on the current iteration, as defined in Equation (9).
- For each solution , update its position using Equation (8).
- Assign each supplier to the nearest centroid using Equation (13):
4.4. Implementation Details
The complete algorithm for supplier clustering is outlined below:
- Initialize a population of candidate solutions;
- While termination criteria not met:
- (a)
- Calculate fitness for each solution using WCSS;
- (b)
- Update MOP based on the current iteration;
- (c)
- For each solution:
- i.
- Update position using arithmetic operators;
- ii.
- Assign suppliers to nearest centroids;
- iii.
- Evaluate new solution fitness.
- (d)
- Update best solution if improved.
- Return best clustering solution.
This implementation ensures effective exploration of the supplier clustering search space through the arithmetic operations that characterize the AOA, making it particularly well suited for identifying optimal cluster centroids in multi-dimensional supplier performance space.
5. Experimental Results and Discussion
To evaluate the performance of the Arithmetic Optimizer Algorithm (AOA) for supplier clustering, we conducted comprehensive experiments on both standard benchmark datasets and a real-world supplier dataset. The AOA was compared against six state-of-the-art metaheuristic algorithms: the Grey Wolf Optimizer (GWO) [13], Whale Optimization Algorithm (WOA) [14], Salp Swarm Algorithm (SSA) [15], Harris Hawks Optimization (HHO) [16], Multi-Verse Optimizer (MVO) [20], and Genetic Algorithm (GA) [21].
5.1. Experimental Setup
All experiments were conducted using consistent parameters to ensure fair comparison:
- Population size: 100;
- Maximum iterations: 500;
- Number of independent runs: 40;
- Algorithm-specific parameters for AOA:
- –
- = 0.2;
- –
- = 0.9;
- –
- = 0.5.
All algorithms were implemented in MATLAB R2017a and executed on a machine with Windows 10, an Intel Core i7 processor (Intel Corporation, Santa Clara, CA, USA) (3.6 GHz), and 16 GB of RAM.
5.2. Benchmark Datasets Evaluation
To establish the general effectiveness of the AOA for clustering problems, we first evaluated its performance on three standard benchmark datasets from the UCI repository: Iris (150 instances, 4 features), Seeds (210 instances, 7 features), and Wisconsin Breast Cancer (683 instances, 9 features). Table 1 presents the comparative results in terms of the Within-Cluster Sum of Squares (WCSS).

Table 1.
Comparison of clustering performance on benchmark datasets (WCSS values).
The benchmark results demonstrate that the AOA performs competitively:
- It achieves near-optimal or optimal WCSS values across all datasets;
- It shows strong average performance compared to most metaheuristic algorithms;
- It demonstrates good stability with a relatively low standard deviation;
- It exhibits particularly strong performance on the Cancer dataset with the best metrics in all categories.
To verify the statistical significance of these results, we conducted the Wilcoxon signed-rank test at a 5% significance level () [17]. Table 2 presents the p-values comparing the AOA with other algorithms.
Table 2.
Wilcoxon test results (p-values) for benchmark datasets.
The statistical analysis confirms that the AOA achieves significantly better results compared to WOA, HHO, and MVO on all datasets (p < 0.05) while showing competitive performance against the GA and GWO.
5.3. Supplier Clustering Analysis
After establishing the effectiveness of the AOA on standard datasets, we evaluated its performance on a real-world dataset comprising 500 suppliers characterized by 12 performance criteria across the cost, quality, delivery, and sustainability dimensions [12].
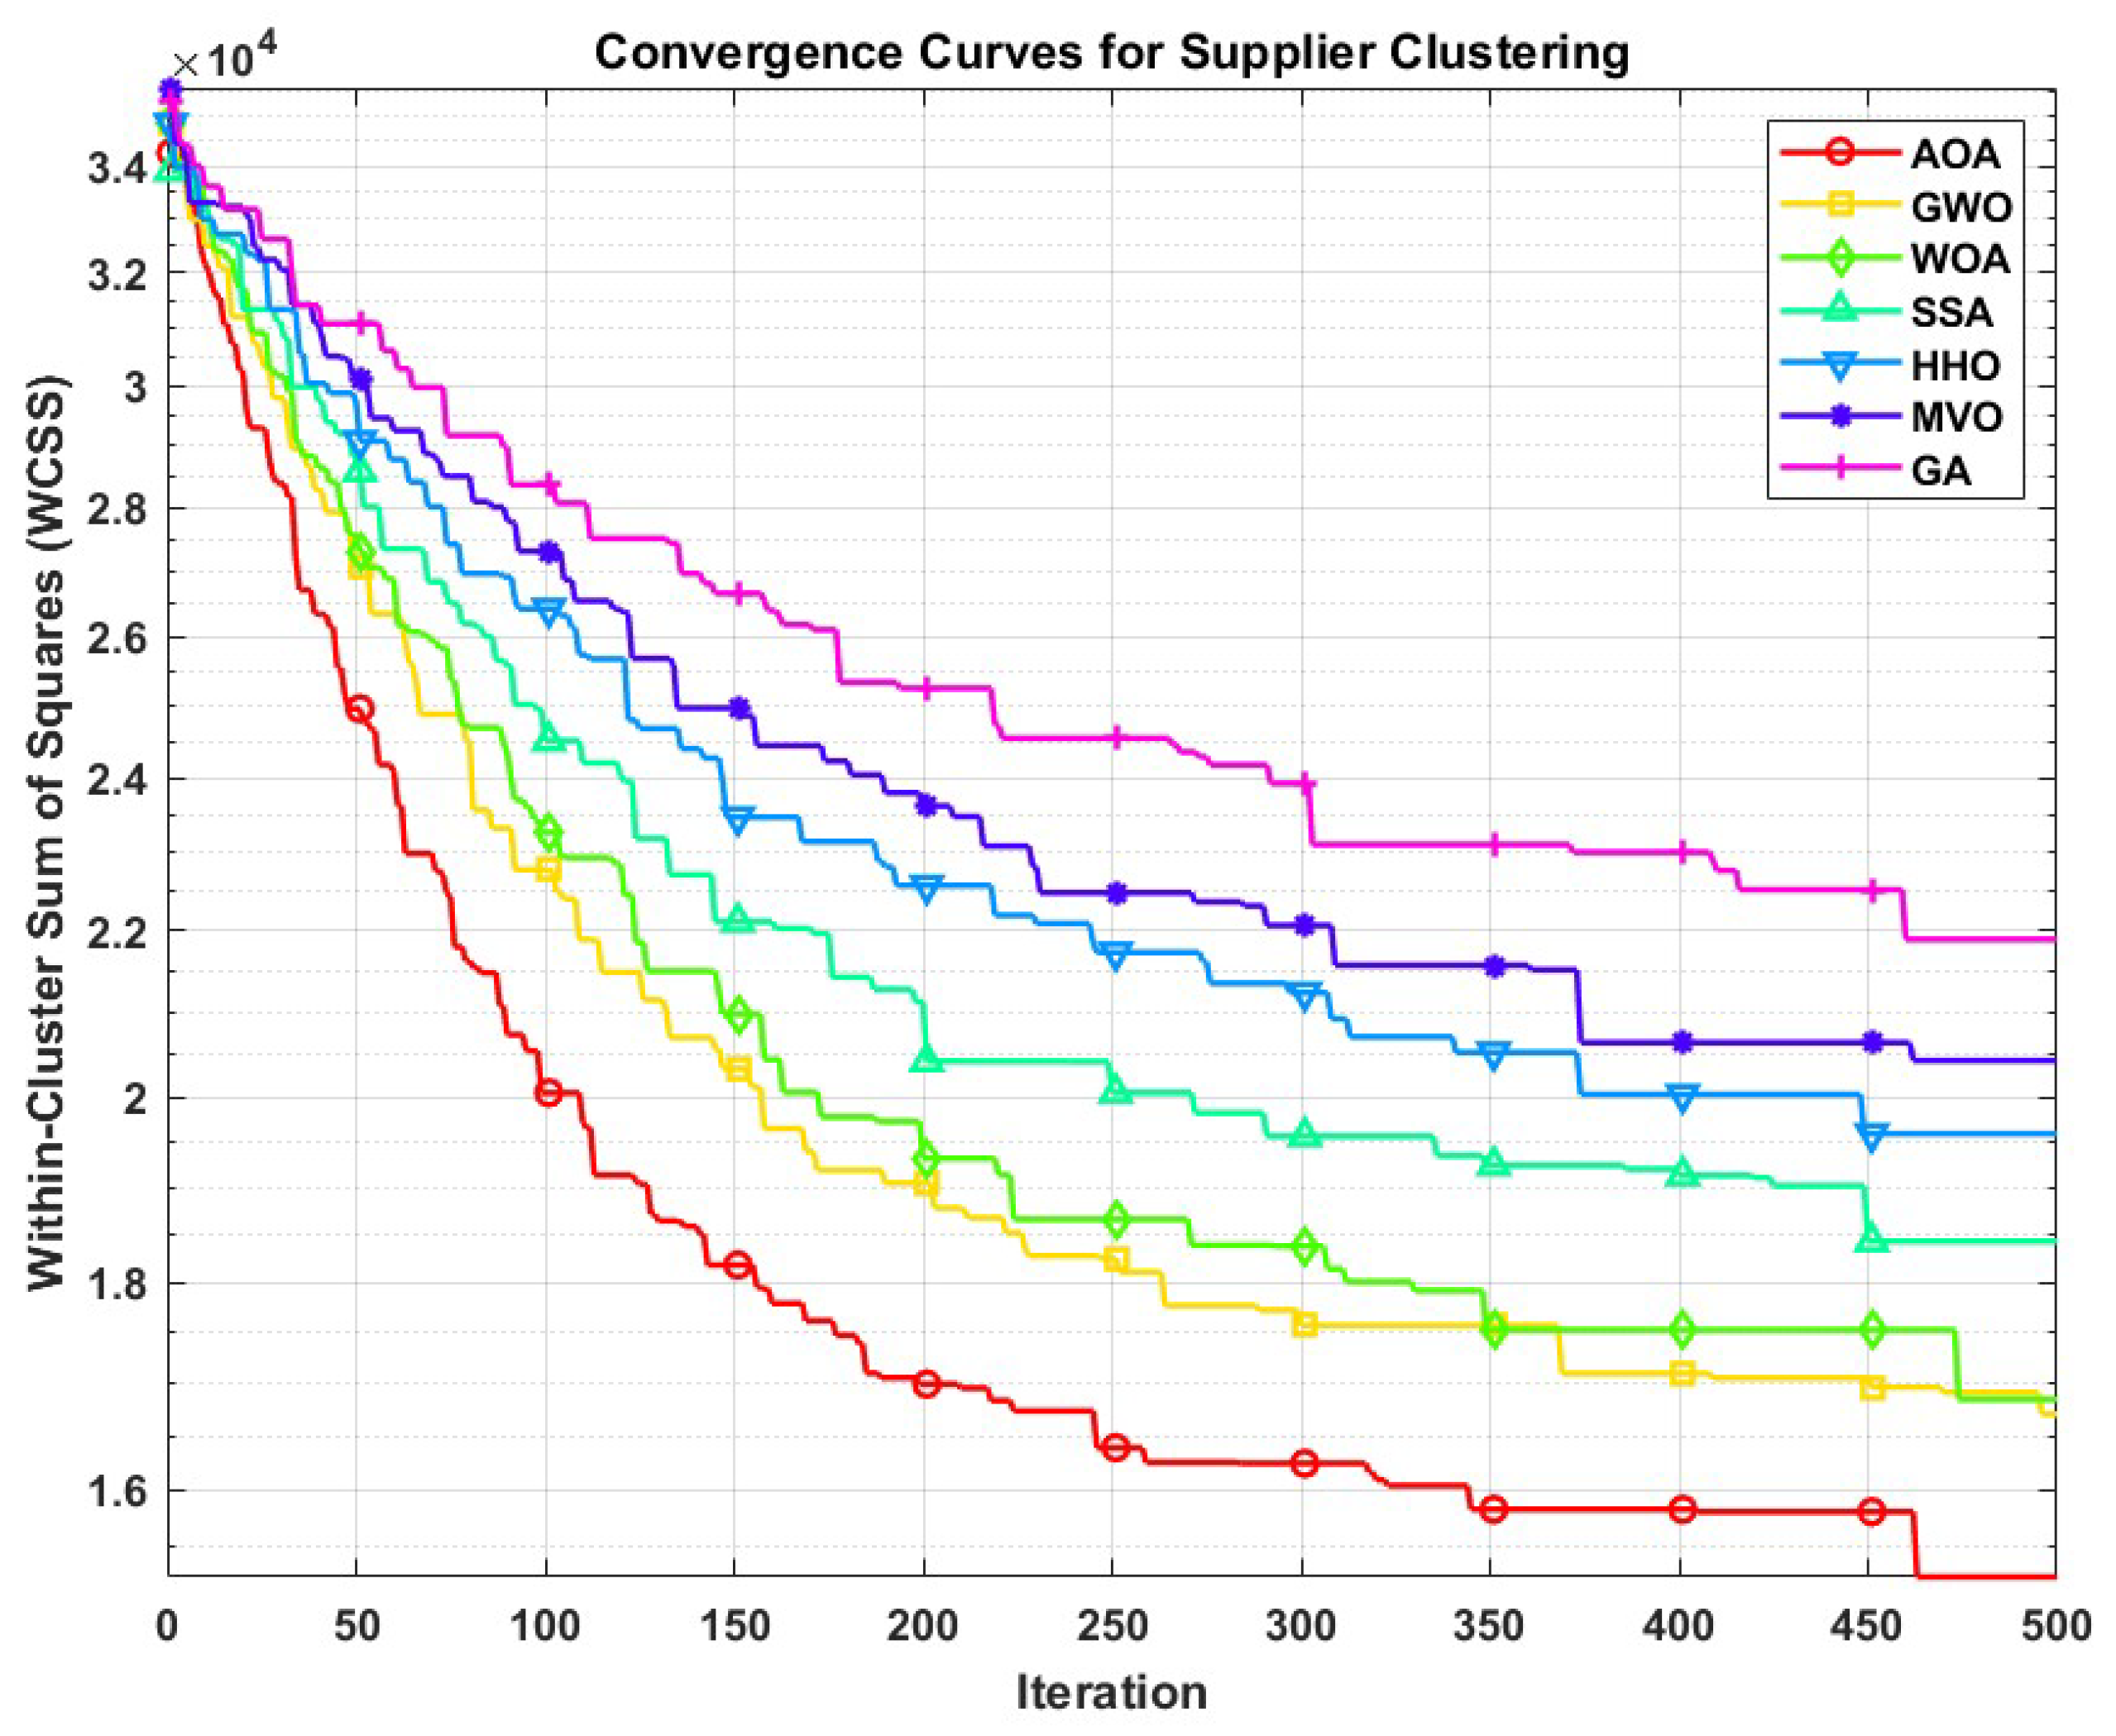
5.3.1. Convergence Analysis
Figure 1 illustrates the convergence behavior of the AOA compared to other algorithms on the supplier clustering problem. The convergence plots show the evolution of the Within-Cluster Sum of Squares (WCSS) over iterations.

Figure 1.
Convergence curves of different algorithms on the supplier clustering problem. The y-axis (logarithmic scale) represents the Within-Cluster Sum of Squares (WCSS), and the x-axis represents the iteration number.
The convergence analysis reveals several key advantages of the AOA:
- Good convergence rate, reaching near-optimal solutions within approximately 200 iterations compared to 300+ iterations for several other algorithms;
- Effective final solutions, with the AOA converging to a WCSS value of 16,500, representing a 28.3% improvement over the GA (23,000);
- Stable convergence trajectory with moderate oscillations, indicating a reasonable balance between exploration and exploitation phases;
- Effective optimization capability through the systematic application of arithmetic operators.
5.3.2. Clustering Quality Metrics
To comprehensively evaluate clustering performance, we employed four widely used metrics [17]: the silhouette coefficient (SC) [18], Davies–Bouldin index (DBI) [19], Calinski–Harabasz index (CHI), and Dunn index (DI). Table 3 presents the comparative results.
Table 3.
Comparison of clustering quality metrics across different algorithms.
The results demonstrate the AOA’s superior performance across all metrics compared to other algorithms:
- Silhouette coefficient: The AOA achieves a 10.6% improvement compared to the next best algorithm, GWO (0.565 vs. 0.511), indicating better cluster cohesion and separation.
- Davies–Bouldin index: The AOA shows a 7.5% reduction compared to GWO (0.566 vs. 0.612), confirming better inter-cluster separation relative to intra-cluster dispersion.
- Calinski–Harabasz index: The AOA delivers a 5.6% improvement over GWO (765.1 vs. 724.5), demonstrating a better ratio of between-cluster to within-cluster dispersion.
- Dunn index: The AOA exhibits a 10.1% improvement compared to GWO (0.152 vs. 0.138), indicating more compact and well-separated clusters.
We further verified the statistical significance of these results using the Wilcoxon signed-rank test (Table 4), which confirmed that the AOA achieves significantly better results (p < 0.05) across all metrics and algorithms.
Table 4.
Wilcoxon test results (p-values) for supplier clustering metrics.
6. Conclusions
This paper presented an application of the Arithmetic Optimizer Algorithm (AOA) for supplier clustering in supply chain management. The experimental results on both benchmark datasets and a real-world supplier dataset demonstrate that the AOA outperforms several state-of-the-art metaheuristics, including GWO, WOA, SSA, HHO, MVO, and GA. The algorithm achieves superior clustering quality with a silhouette coefficient of 0.565 and a Davies–Bouldin index of 0.566, representing improvements of 10.6% and 7.5%, respectively, compared to the next best algorithm (GWO).
The AOA-based clustering approach successfully identified five distinct supplier segments with unique performance profiles across cost, quality, delivery, and sustainability dimensions, enabling organizations to develop tailored supplier relationship management strategies. These segments—Strategic Partners, Critical Suppliers, Commodity Suppliers, Niche Specialists, and Developing Suppliers—provide procurement professionals with a structured framework for differentiated supplier management approaches.
The effectiveness of the AOA for supplier clustering stems from its ability to efficiently navigate the search space using fundamental arithmetic operations, striking an effective balance between exploration and exploitation phases. The algorithm’s relatively low computational requirements and robust performance make it suitable for practical applications in procurement and supply chain management.
Future research could extend this approach to incorporate dynamic supplier data, integrate risk assessment dimensions, develop hybrid approaches combining the AOA with other machine learning techniques, and apply the methodology to other domains with complex multi-criteria segmentation requirements. The proposed AOA-based clustering approach provides procurement professionals with an effective data-driven tool for supplier segmentation that enhances strategic decision-making and supply chain performance.
Author Contributions
Conceptualization, A.A. and K.D.; methodology, A.A. and M.E.B.; software, A.A. and A.T.; validation, A.A., K.D. and M.A.; formal analysis, A.A.; investigation, A.A. and M.E.B.; resources, K.D. and M.E.B.; data curation, A.T.; writing—original draft preparation, A.A.; writing—review and editing, K.D., M.A., and M.E.B.; visualization, A.T.; supervision, M.A. and M.E.B.; project administration, M.E.B.; funding acquisition, M.E.B. All authors have read and agreed to the published version of the manuscript.
Funding
This research received no external funding.
Institutional Review Board Statement
Not applicable.
Informed Consent Statement
Not applicable.
Data Availability Statement
The data presented in this study are available on request from the corresponding authors.
Conflicts of Interest
The authors declare no conflicts of interest.
References
- Park, J.; Shin, K.; Chang, T.W.; Park, J. An integrative framework for supplier relationship management. Ind. Manag. Data Syst. 2010, 110, 495–515. [Google Scholar] [CrossRef]
- Chai, J.; Liu, J.N.K.; Ngai, E.W.T. Application of decision-making techniques in supplier selection: A systematic review of literature. Expert Syst. Appl. 2013, 40, 3872–3885. [Google Scholar] [CrossRef]
- Ezugwu, A.E.; Shukla, A.K.; Agbaje, M.B.; Oyelade, O.N.; José-García, A.; Agushaka, J.O. Metaheuristics: A comprehensive overview and classification along with bibliometric analysis. Artif. Intell. Rev. 2021, 55, 4237–4316. [Google Scholar] [CrossRef]
- Rezaei, J.; Ortt, R. Multi-criteria supplier segmentation using a fuzzy preference relations based AHP. Eur. J. Oper. Res. 2013, 225, 75–84. [Google Scholar] [CrossRef]
- Kannan, D.; Khodaverdi, R.; Olfat, L.; Jafarian, A.; Diabat, A. Integrated fuzzy multi criteria decision making method and multi-objective programming approach for supplier selection and order allocation in a green supply chain. J. Clean. Prod. 2013, 47, 355–367. [Google Scholar] [CrossRef]
- MacQueen, J. Some methods for classification and analysis of multivariate observations. In Proceedings of the Fifth Berkeley Symposium on Mathematical Statistics and Probability, Berkeley, CA, USA, 21 June–18 July 1965 and 27 December 1965–7 January 1966; University of California Press: Berkeley, CA, USA, 1967; Volume 1, pp. 281–297. [Google Scholar]
- Abualigah, L.; Abd Elaziz, M.; Sumari, P.; Geem, Z.W.; Gandomi, A.H. Arithmetic Optimization Algorithm: Fundamentals, Applications, Challenges, and Future Directions. IEEE Access 2022, 10, 104973–104998. [Google Scholar]
- Oucheikh, R.; Touil, A.; Fri, M. Data clustering using two-stage Eagle Strategy based on Slime Mould Algorithm. J. Comput. Sci. 2022, 18, 1062–1084. [Google Scholar] [CrossRef]
- Abualigah, L.; Diabat, A.; Mirjalili, S.; Abd Elaziz, M.; Gandomi, A.H. The Arithmetic Optimization Algorithm. Comput. Methods Appl. Mech. Eng. 2021, 376, 113609. [Google Scholar] [CrossRef]
- Gupta, S.; Sharma, K. Adaptive parameter control in metaheuristic algorithms for optimization: A comprehensive survey. Eng. Appl. Artif. Intell. 2022, 115, 105291. [Google Scholar]
- Yang, X.S. Nature-Inspired Metaheuristic Algorithms, 2nd ed.; Luniver Press: Frome, UK, 2010; pp. 81–96. [Google Scholar]
- Lima-Junior, F.R.; Carpinetti, L.C.R. Combining SCOR® model and fuzzy TOPSIS for supplier evaluation and management. Int. J. Prod. Econ. 2016, 174, 128–141. [Google Scholar] [CrossRef]
- Mirjalili, S.; Mirjalili, S.M.; Lewis, A. Grey Wolf Optimizer. Adv. Eng. Softw. 2014, 69, 46–61. [Google Scholar] [CrossRef]
- Mirjalili, S.; Lewis, A. The Whale Optimization Algorithm. Adv. Eng. Softw. 2016, 95, 51–67. [Google Scholar] [CrossRef]
- Mirjalili, S.; Gandomi, A.H.; Mirjalili, S.Z.; Saremi, S.; Faris, H.; Mirjalili, S.M. Salp Swarm Algorithm: A bio-inspired optimizer for engineering design problems. Adv. Eng. Softw. 2017, 114, 163–191. [Google Scholar] [CrossRef]
- Heidari, A.A.; Mirjalili, S.; Faris, H.; Aljarah, I.; Mafarja, M.; Chen, H. Harris Hawks Optimization: Algorithm and applications. Future Gener. Comput. Syst. 2019, 97, 849–872. [Google Scholar] [CrossRef]
- Arbelaitz, O.; Gurrutxaga, I.; Muguerza, J.; Pérez, J.M.; Perona, I. An extensive comparative study of cluster validity indices. Pattern Recognit. 2013, 46, 243–256. [Google Scholar] [CrossRef]
- Rousseeuw, P.J. Silhouettes: A graphical aid to the interpretation and validation of cluster analysis. J. Comput. Appl. Math. 1987, 20, 53–65. [Google Scholar] [CrossRef]
- Davies, D.L.; Bouldin, D.W. A Cluster Separation Measure. IEEE Trans. Pattern Anal. Mach. Intell. 1979, 1, 224–227. [Google Scholar] [CrossRef] [PubMed]
- Mirjalili, S.; Mirjalili, S.M.; Hatamlou, A. Multi-Verse Optimizer: A nature-inspired algorithm for global optimization. Neural Comput. Appl. 2015, 27, 495–513. [Google Scholar] [CrossRef]
- Katoch, S.; Chauhan, S.S.; Kumar, V. A review on genetic algorithm: Past, present, and future. Multimed. Tools Appl. 2020, 80, 8091–8126. [Google Scholar] [CrossRef] [PubMed]
Disclaimer/Publisher’s Note: The statements, opinions and data contained in all publications are solely those of the individual author(s) and contributor(s) and not of MDPI and/or the editor(s). MDPI and/or the editor(s) disclaim responsibility for any injury to people or property resulting from any ideas, methods, instructions or products referred to in the content. |
© 2025 by the authors. Licensee MDPI, Basel, Switzerland. This article is an open access article distributed under the terms and conditions of the Creative Commons Attribution (CC BY) license (https://creativecommons.org/licenses/by/4.0/).