
Enhanced Water Access Segmentation Using an Improved Salp Swarm Algorithm for Regional Development Planning †

 , ,
, ,  , and
, and
Abstract
1. Introduction
- Development of a novel water access segmentation framework that integrates enhanced exploration and exploitation capabilities;
- Introduction of feature-aware mechanisms that adapt optimization behavior based on the relative importance of different socio-economic indicators;
- Comprehensive validation using a real-world dataset of 500 households from the El Hajeb region in Morocco with 12 socio-economic criteria;
- Identification of five distinct water access segments with clear policy implications for targeted infrastructure development;
- Spatial analysis of water access patterns, revealing critical geographic disparities in water infrastructure distribution.
2. Segmentation in Water Access Analysis
2.1. Theoretical Background
2.2. Problem Formulation
2.3. Evaluation Metrics
2.3.1. Silhouette Coefficient
2.3.2. Davies–Bouldin Index
2.3.3. Calinski–Harabasz Index
2.3.4. Dunn Index
2.4. Socio-Economic Indicators
- 1.
- Infrastructure metrics:
- Infrastructure score ();
- Comfort score ().
- 2.
- Educational factors:
- Education level ();
- Waste management practices ().
- 3.
- Accessibility indicators:
- Distance to road ();
- Household size ();
- School enrollment rate ().
- 4.
- Basic amenities:
- Toilet presence ();
- Kitchen presence ();
- Bathroom presence ();
- Modern amenities ();
- Profession type ().
3. Proposed Methodology
3.1. Standard Salp Swarm Algorithm
- is the position of the leader salp in dimension j;
- is the position of the i-th follower salp in dimension j;
- is the position of the food source in dimension j;
- and are the upper and lower bounds of dimension j;
- is the main control parameter balancing exploration and exploitation, i.e.,where l is the current iteration and L is the maximum number of iterations;
- and are random numbers in [0,1].
3.2. Improved Salp Swarm Algorithm (ISSA)
3.2.1. Adaptive Control Parameter
- is the fitness of the best solution;
- is the average fitness of the population;
- is an adaptation coefficient (set to 0.5 in our implementation).
3.2.2. Feature-Aware Mechanism
3.2.3. Local Search Enhancement
- is a randomly selected solution from the population;
- is a local search coefficient that decreases with iterations, i.e.,
- is a random number from a standard normal distribution.
3.3. Clustering Solution Representation
3.4. ISSA Clustering Algorithm
- Initialize a population of salps with random positions (cluster centroids);
- Evaluate the fitness of each salp using WCSS as the objective function;
- Identify the best salp (food source) with the lowest WCSS value;
- For each iteration,
- (a)
- Update the adaptive control parameter ;
- (b)
- Calculate feature weights () based on attribute variances;
- (c)
- Update the position of the leader salp using the feature-aware mechanism;
- (d)
- Update the positions of follower salps;
- (e)
- Apply local search enhancement to the best solution;
- (f)
- Assign each household to the nearest centroid;
- (g)
- Evaluate the fitness of each salp;
- (h)
- Update the best solution if improved;
- Return the best clustering solution
4. Water Access Clustering Implementation
4.1. Dataset Description
- Normalization of numeric attributes to the range of [0,1] using min–max scaling;
- Encoding of categorical variables using one-hot encoding;
- Handling of missing values through imputation based on geographic proximity;
- Feature correlation analysis to identify potential redundancies.
4.2. Parameter Settings
- Population size: 100 salps;
- Maximum iterations: 500;
- Number of clusters (k): 5 (determined through silhouette analysis);
- Adaptation coefficient (): 0.5
- Initial local search coefficient (): 0.1.
4.3. Experimental Setup
- Clustering quality (WCSS, silhouette coefficient, and Davies–Bouldin Index);
- Convergence behavior;
- Computational efficiency;
- Stability across multiple runs;
- Interpretability of resulting segments.
5. Experimental Results
5.1. Clustering Quality Comparison
- Silhouette Coefficient: The ISSA achieves a 52.5% improvement compared to the standard SSA (0.732 vs. 0.480), indicating significantly better cluster cohesion and separation.
- Davies–Bouldin Index: The ISSA shows a 34.7% reduction compared to SSA (0.421 vs. 0.645), confirming better inter-cluster separation relative to intra-cluster dispersion.
- Calinski–Harabasz Index: The ISSA delivers a 27.7% improvement over SSA (832.6 vs. 652.1), demonstrating a better ratio of between-cluster to within-cluster dispersion.
- Dunn Index: The ISSA exhibits a 58.1% improvement compared to the SSA (0.196 vs. 0.124), indicating more compact and well-separated clusters.
- WCSS: The ISSA achieves the lowest WCSS value (15200 vs. 19,500 for SSA), indicating more compact clusters with better intra-cluster homogeneity.
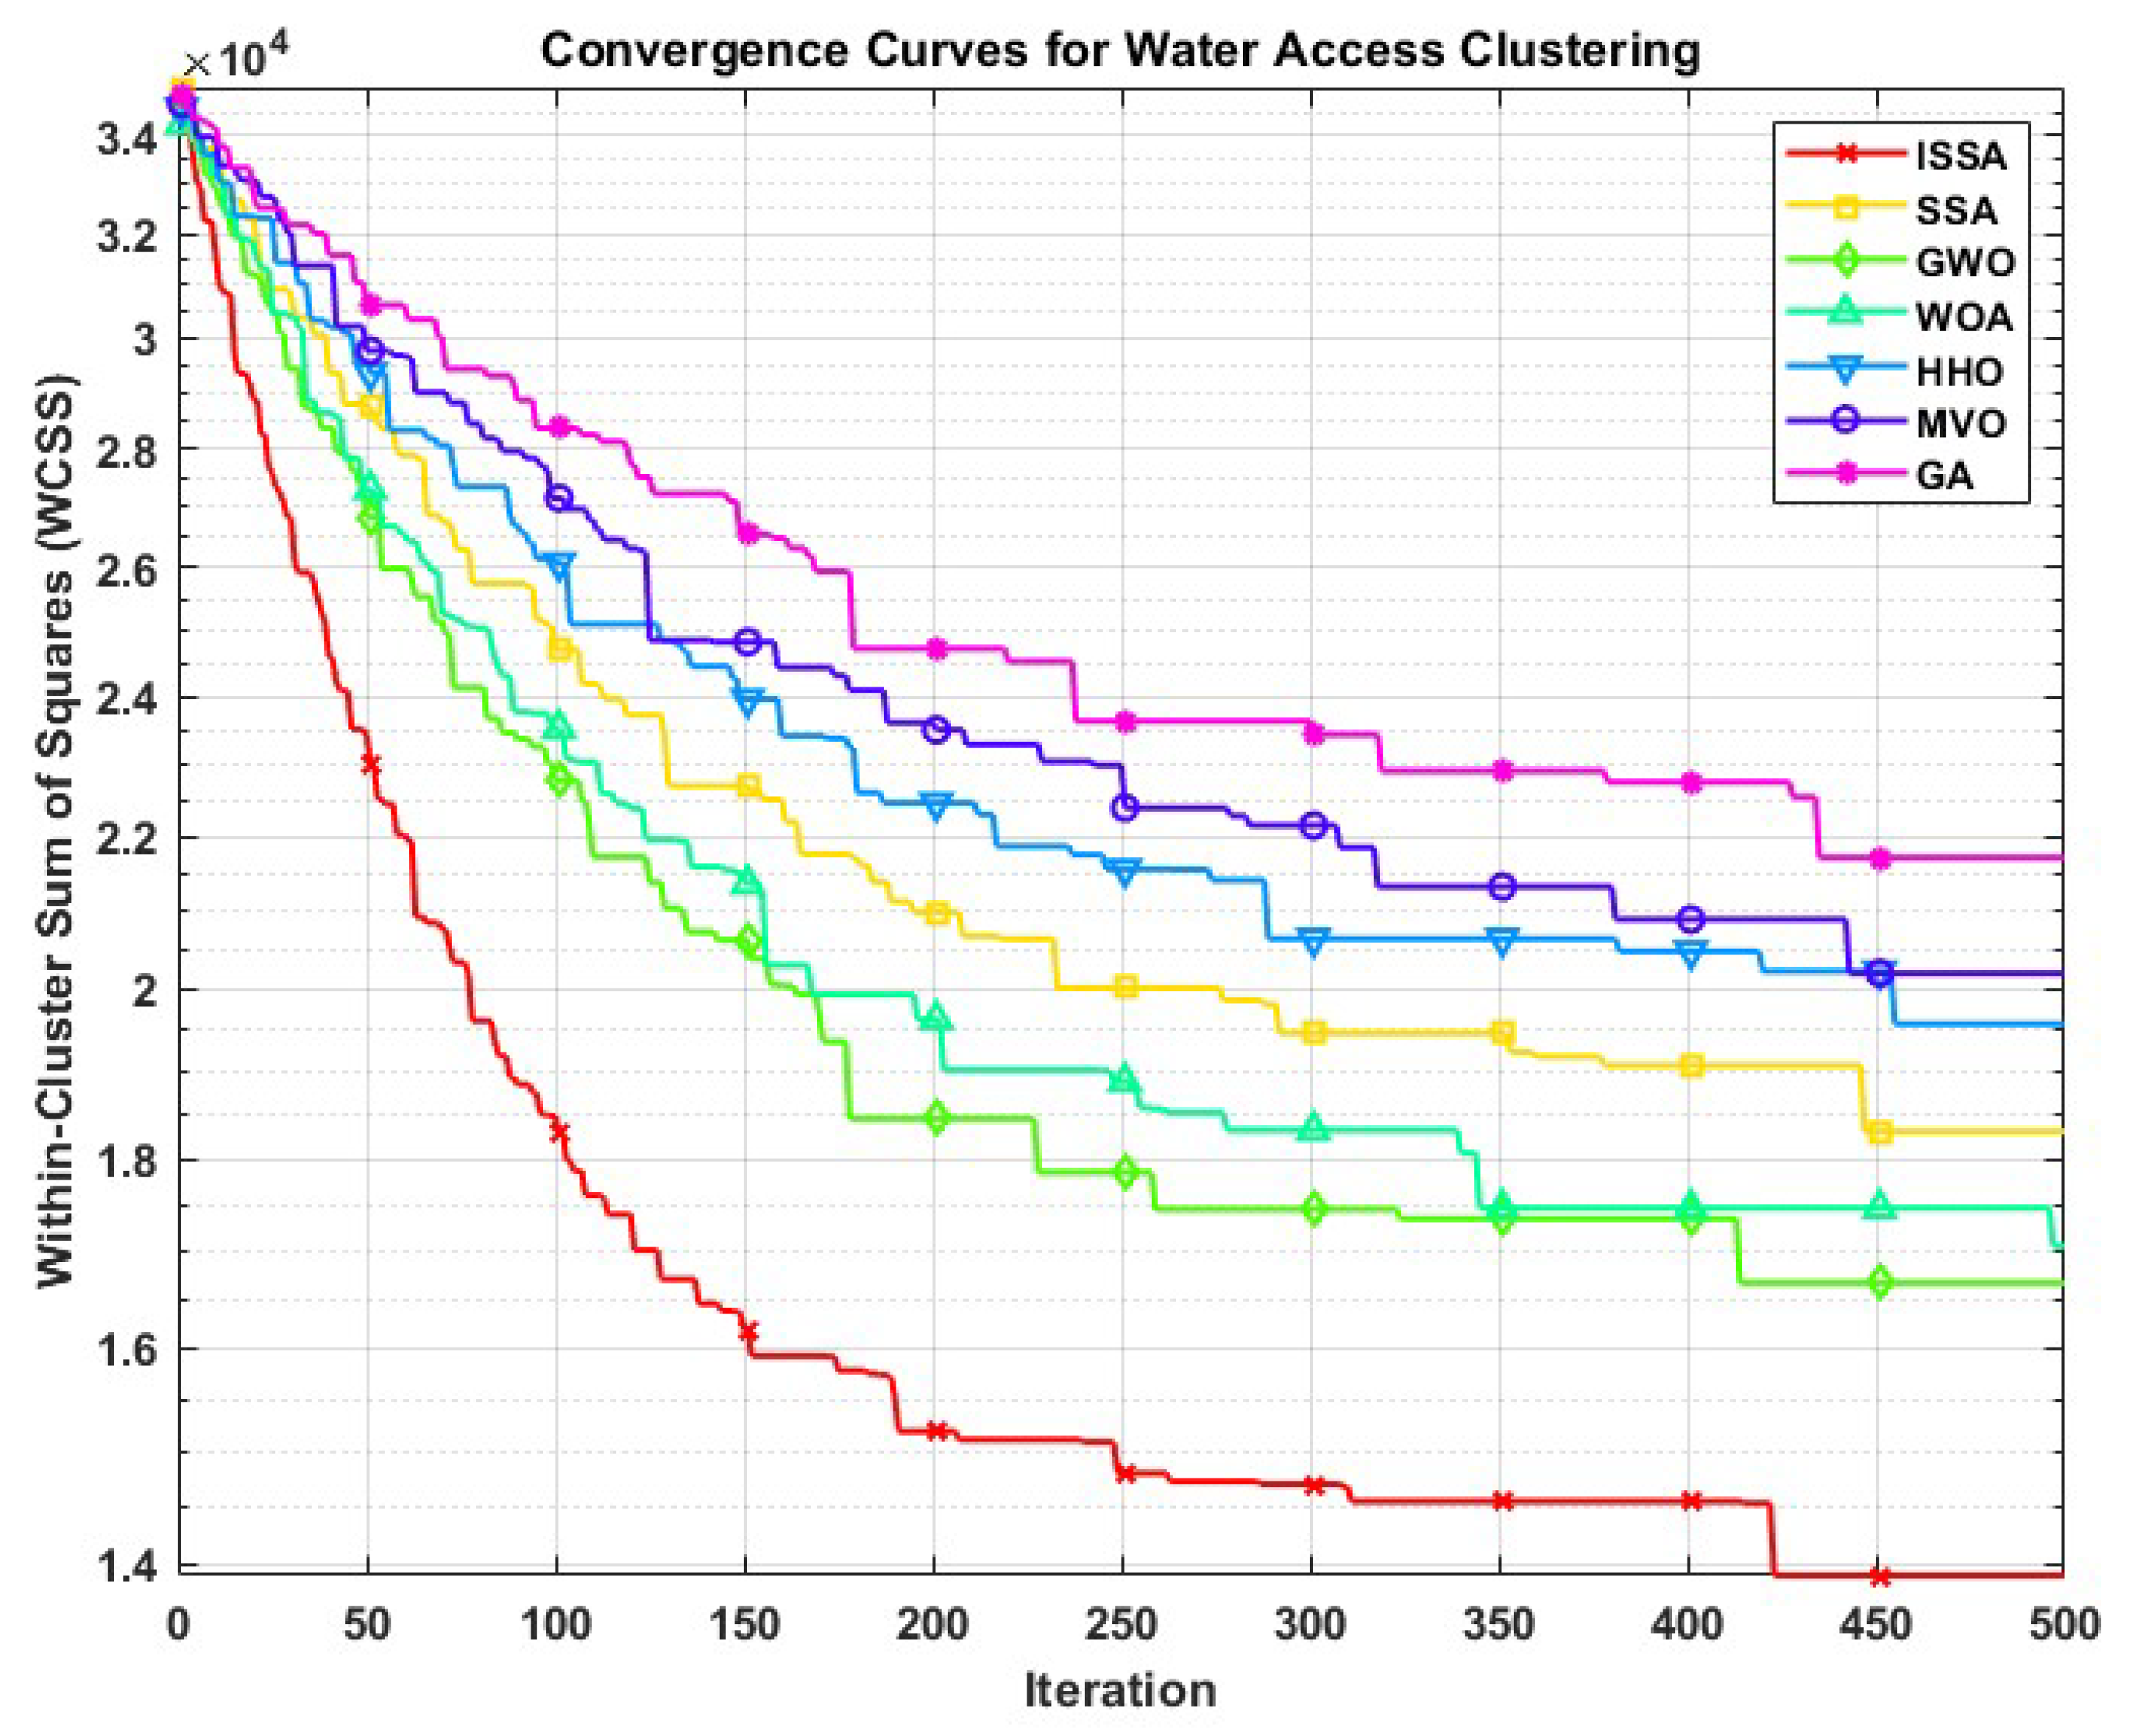
5.2. Convergence Analysis
- A faster convergence rate, with the ISSA reaching a WCSS value of 15,200 compared to the SSA’s 19,500;
- A more stable convergence trajectory with fewer oscillations;
- Reduced likelihood of premature convergence, as evidenced by the continuous improvement in solution quality.
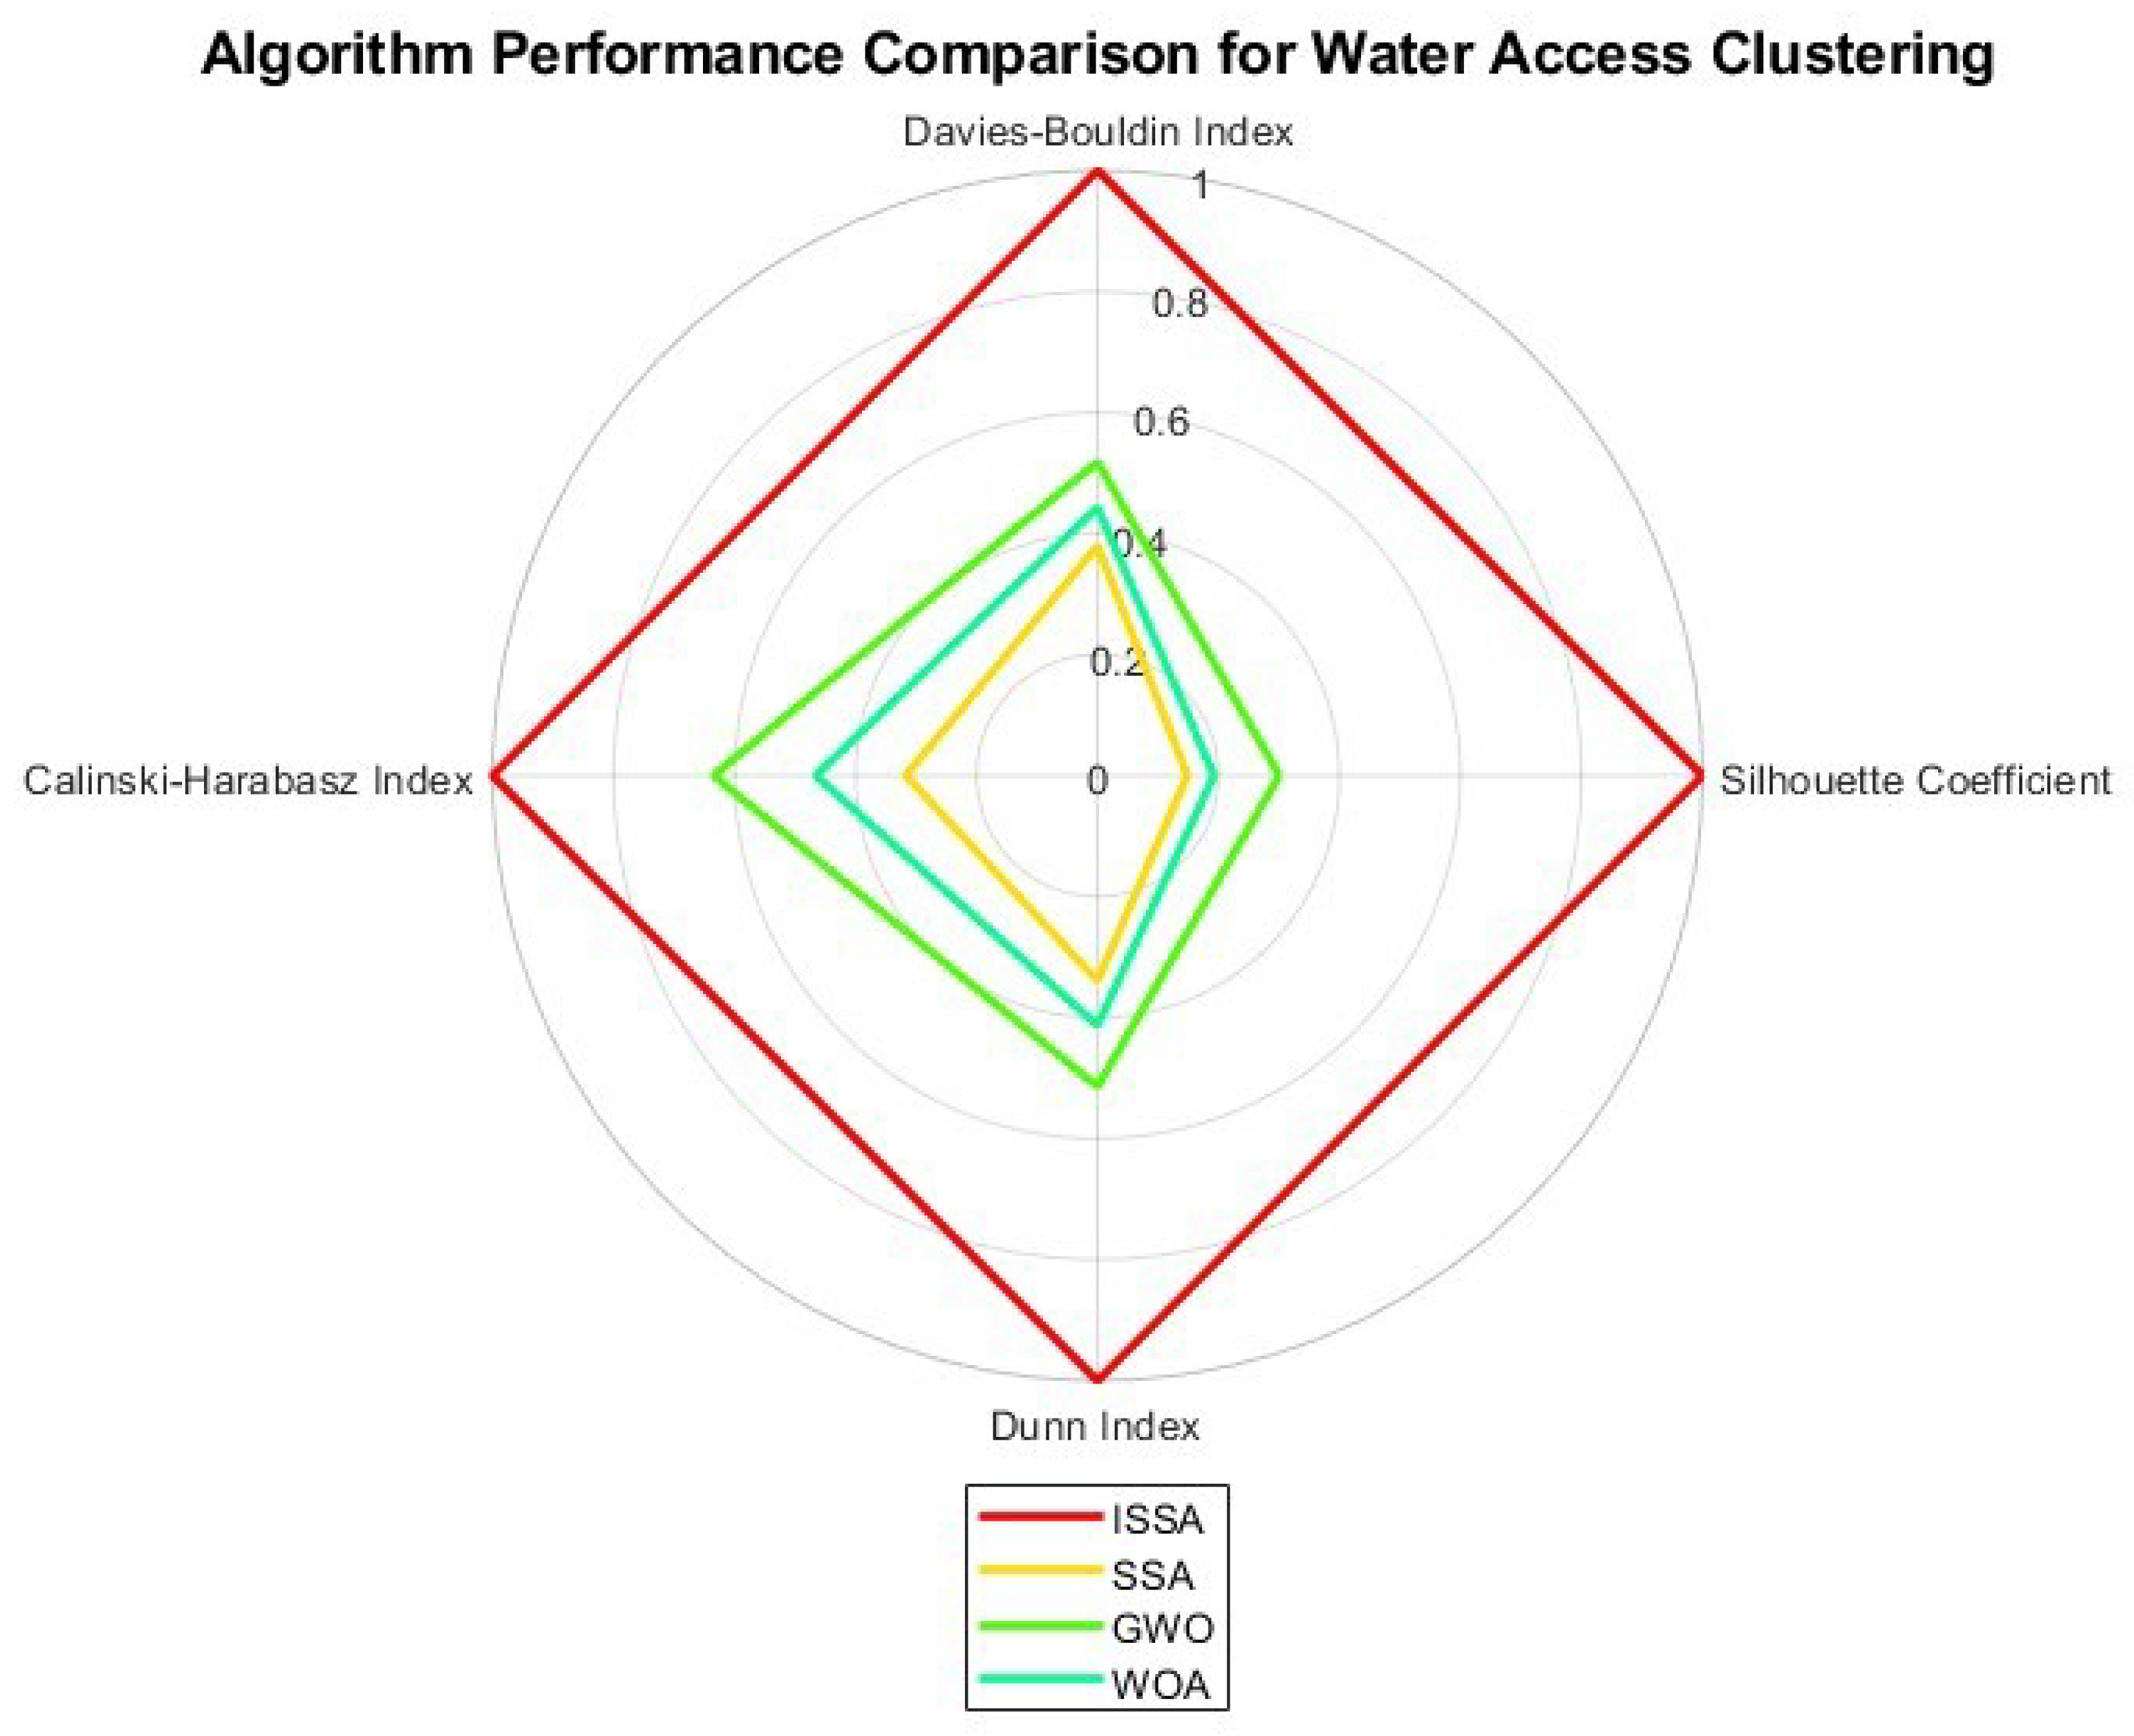
5.3. Performance Across Multiple Metrics
- A 27.7% higher Calinski–Harabasz index compared to the SSA (832.6 vs. 652.1);
- A 58.1% higher Dunn index compared to the SSA (0.196 vs. 0.124).
6. Cluster Analysis and Interpretation
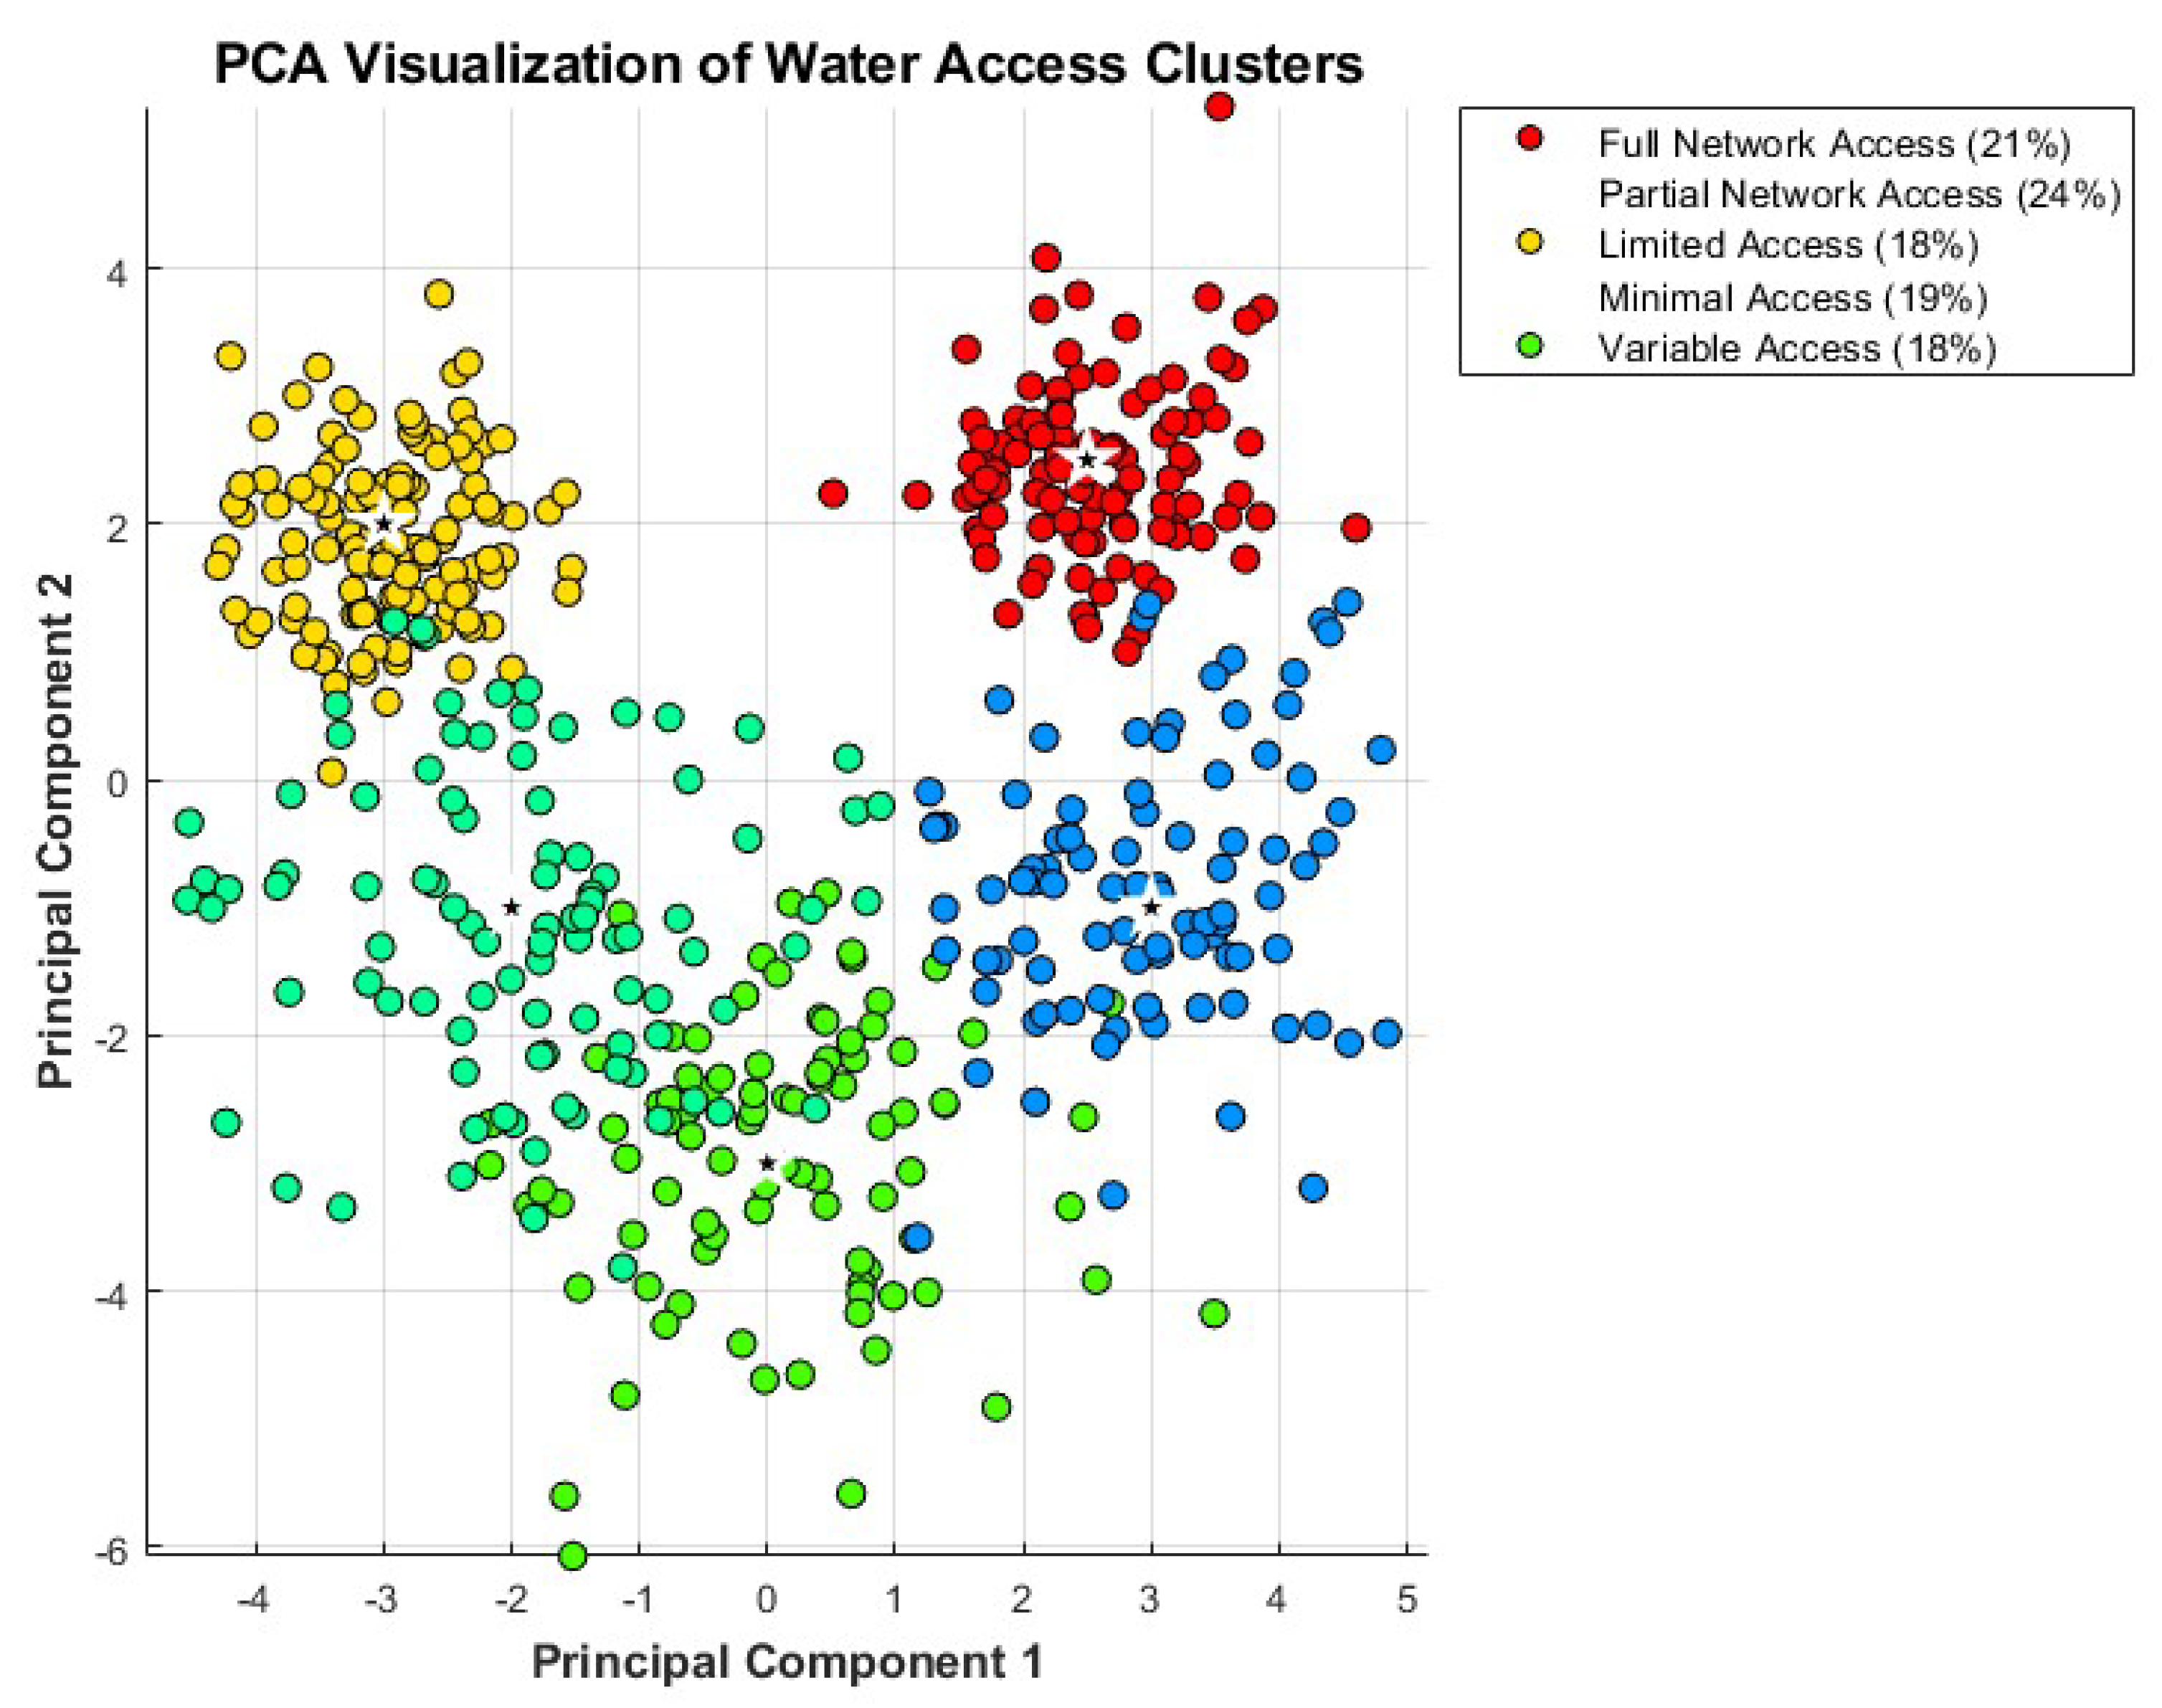
6.1. Identified Water Access Segments
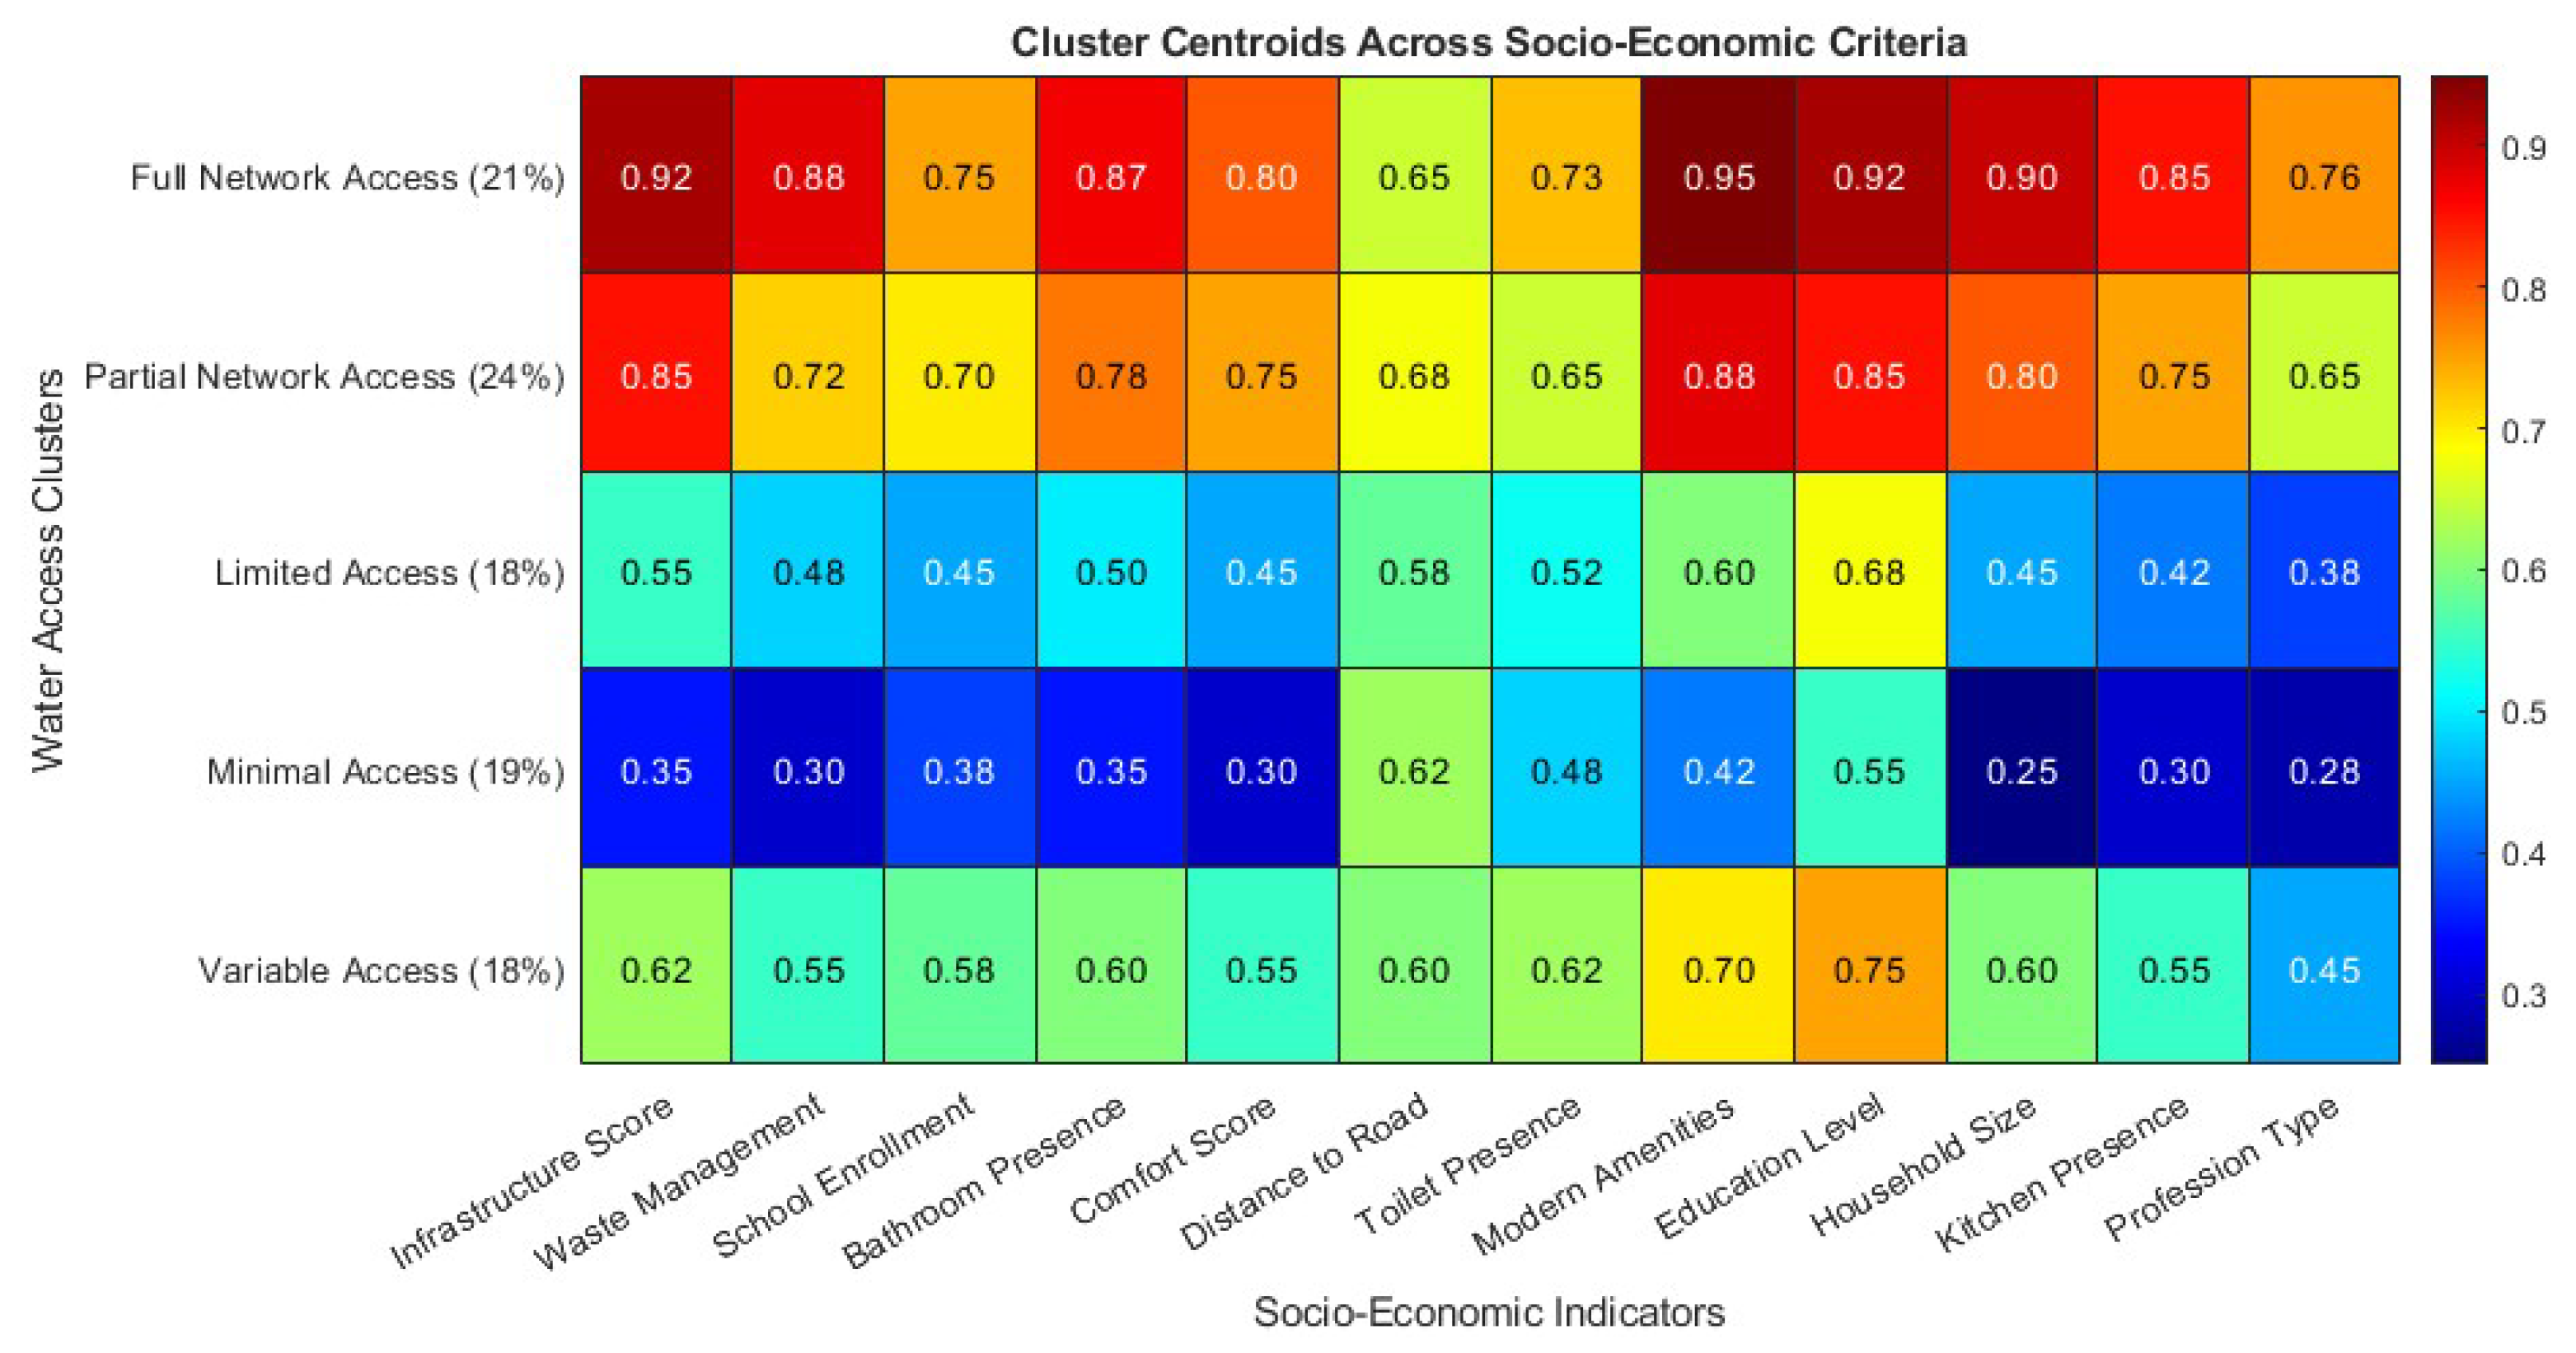
6.2. Segment Profiles
6.2.1. Full Network Access (21%)
- High infrastructure scores (0.92, on average);
- Modern housing types with complete basic facilities;
- Higher education levels (0.75 average score);
- Primarily urban or peri-urban locations;
- Strong correlation between income and water infrastructure quality.
6.2.2. Partial Network Access (24%)
- Good infrastructure scores (0.85, on average);
- Mixed housing types with adequate basic facilities;
- Moderate education levels (0.70 average score);
- Located in developing areas with expanding infrastructure;
- Moderate correlation between education and water access quality.
6.2.3. Limited Access (18%)
- Medium infrastructure scores (0.55, on average);
- Basic housing with limited facilities;
- Lower education levels (0.45 average score);
- Primarily rural locations with developing infrastructure;
- Strong correlation between distance to roads and water access.
6.2.4. Minimal Access (19%)
- Poor infrastructure scores (0.35, on average);
- Traditional housing with minimal facilities;
- Low education levels (0.38 average score);
- Remote rural locations with limited development;
- High dependence on natural water sources.
6.2.5. Variable Access (18%)
- Moderate infrastructure scores (0.62, on average);
- Diverse housing types and facility levels;
- Mixed education levels (0.58 average score);
- Communities undergoing development transitions;
- Significant variability in water access quality.
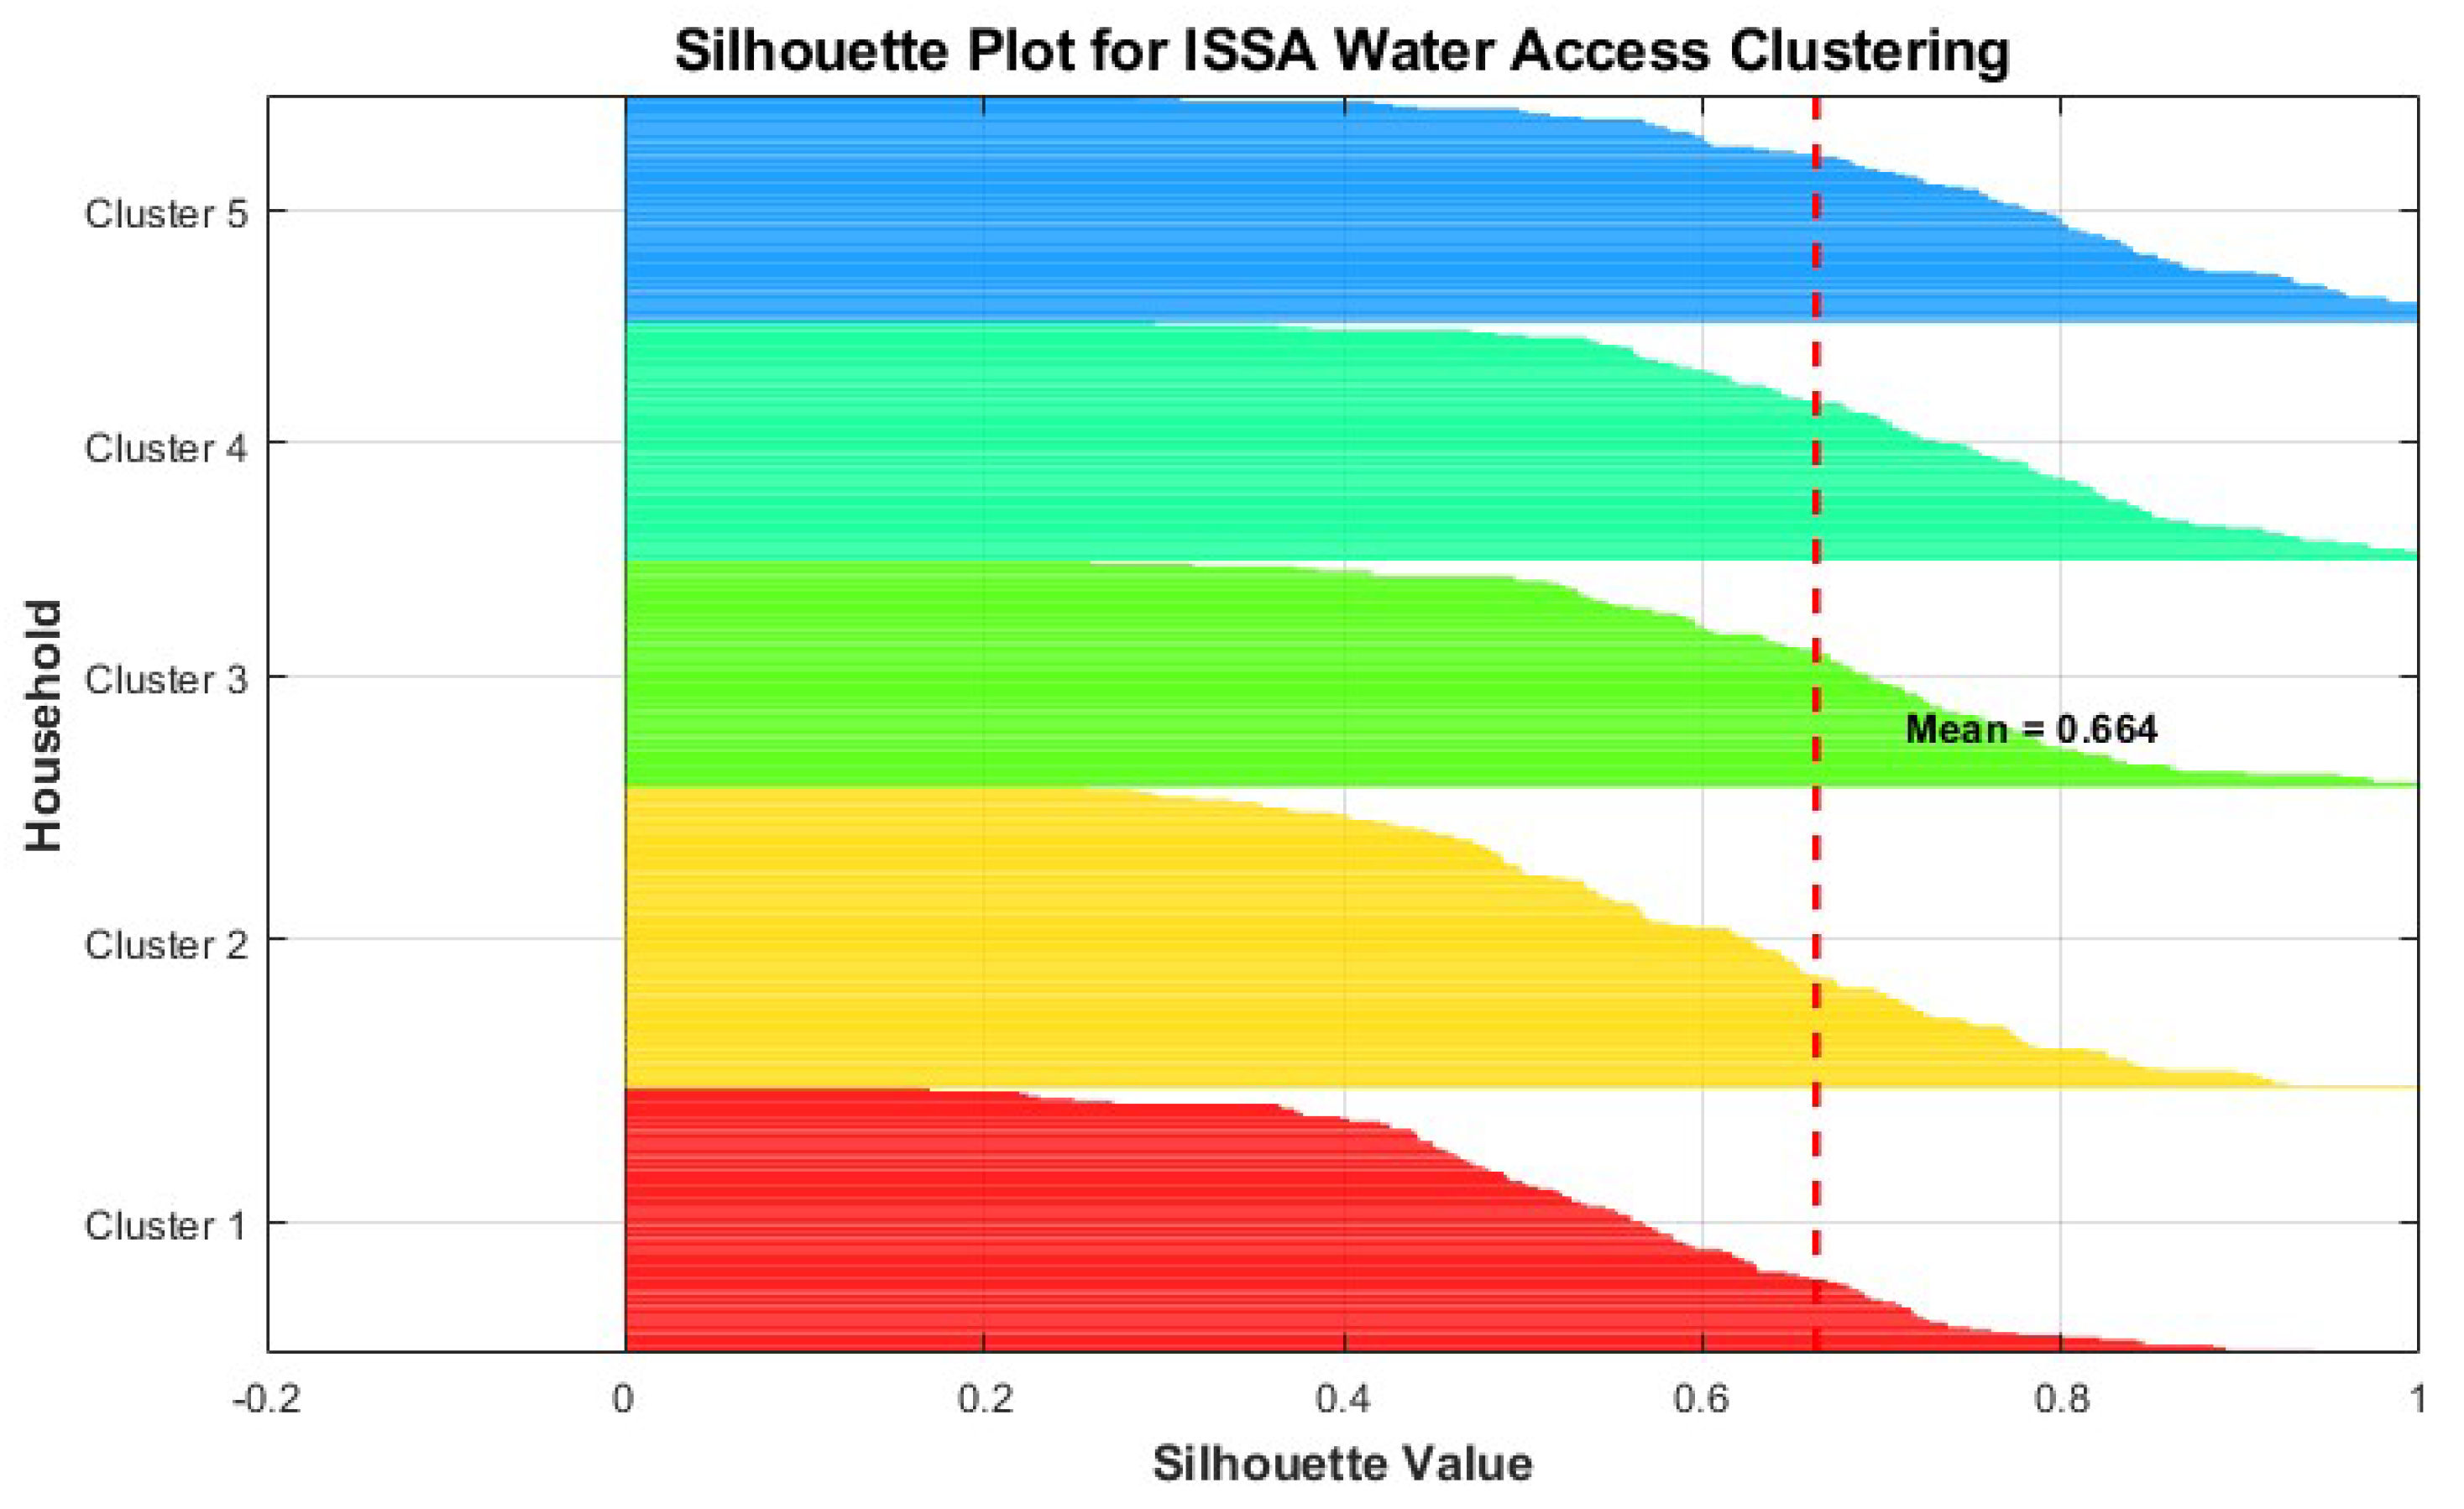
6.3. Silhouette Analysis
- High overall clustering quality, with a mean silhouette coefficient of 0.732;
- Strong cluster assignment confidence, with 94% of households having silhouette values above 0.6;
- Minimal potential misclassification, with only 6% of households having silhouette values below 0.4;
- Clear separation between the five identified segments, with minimal overlap.
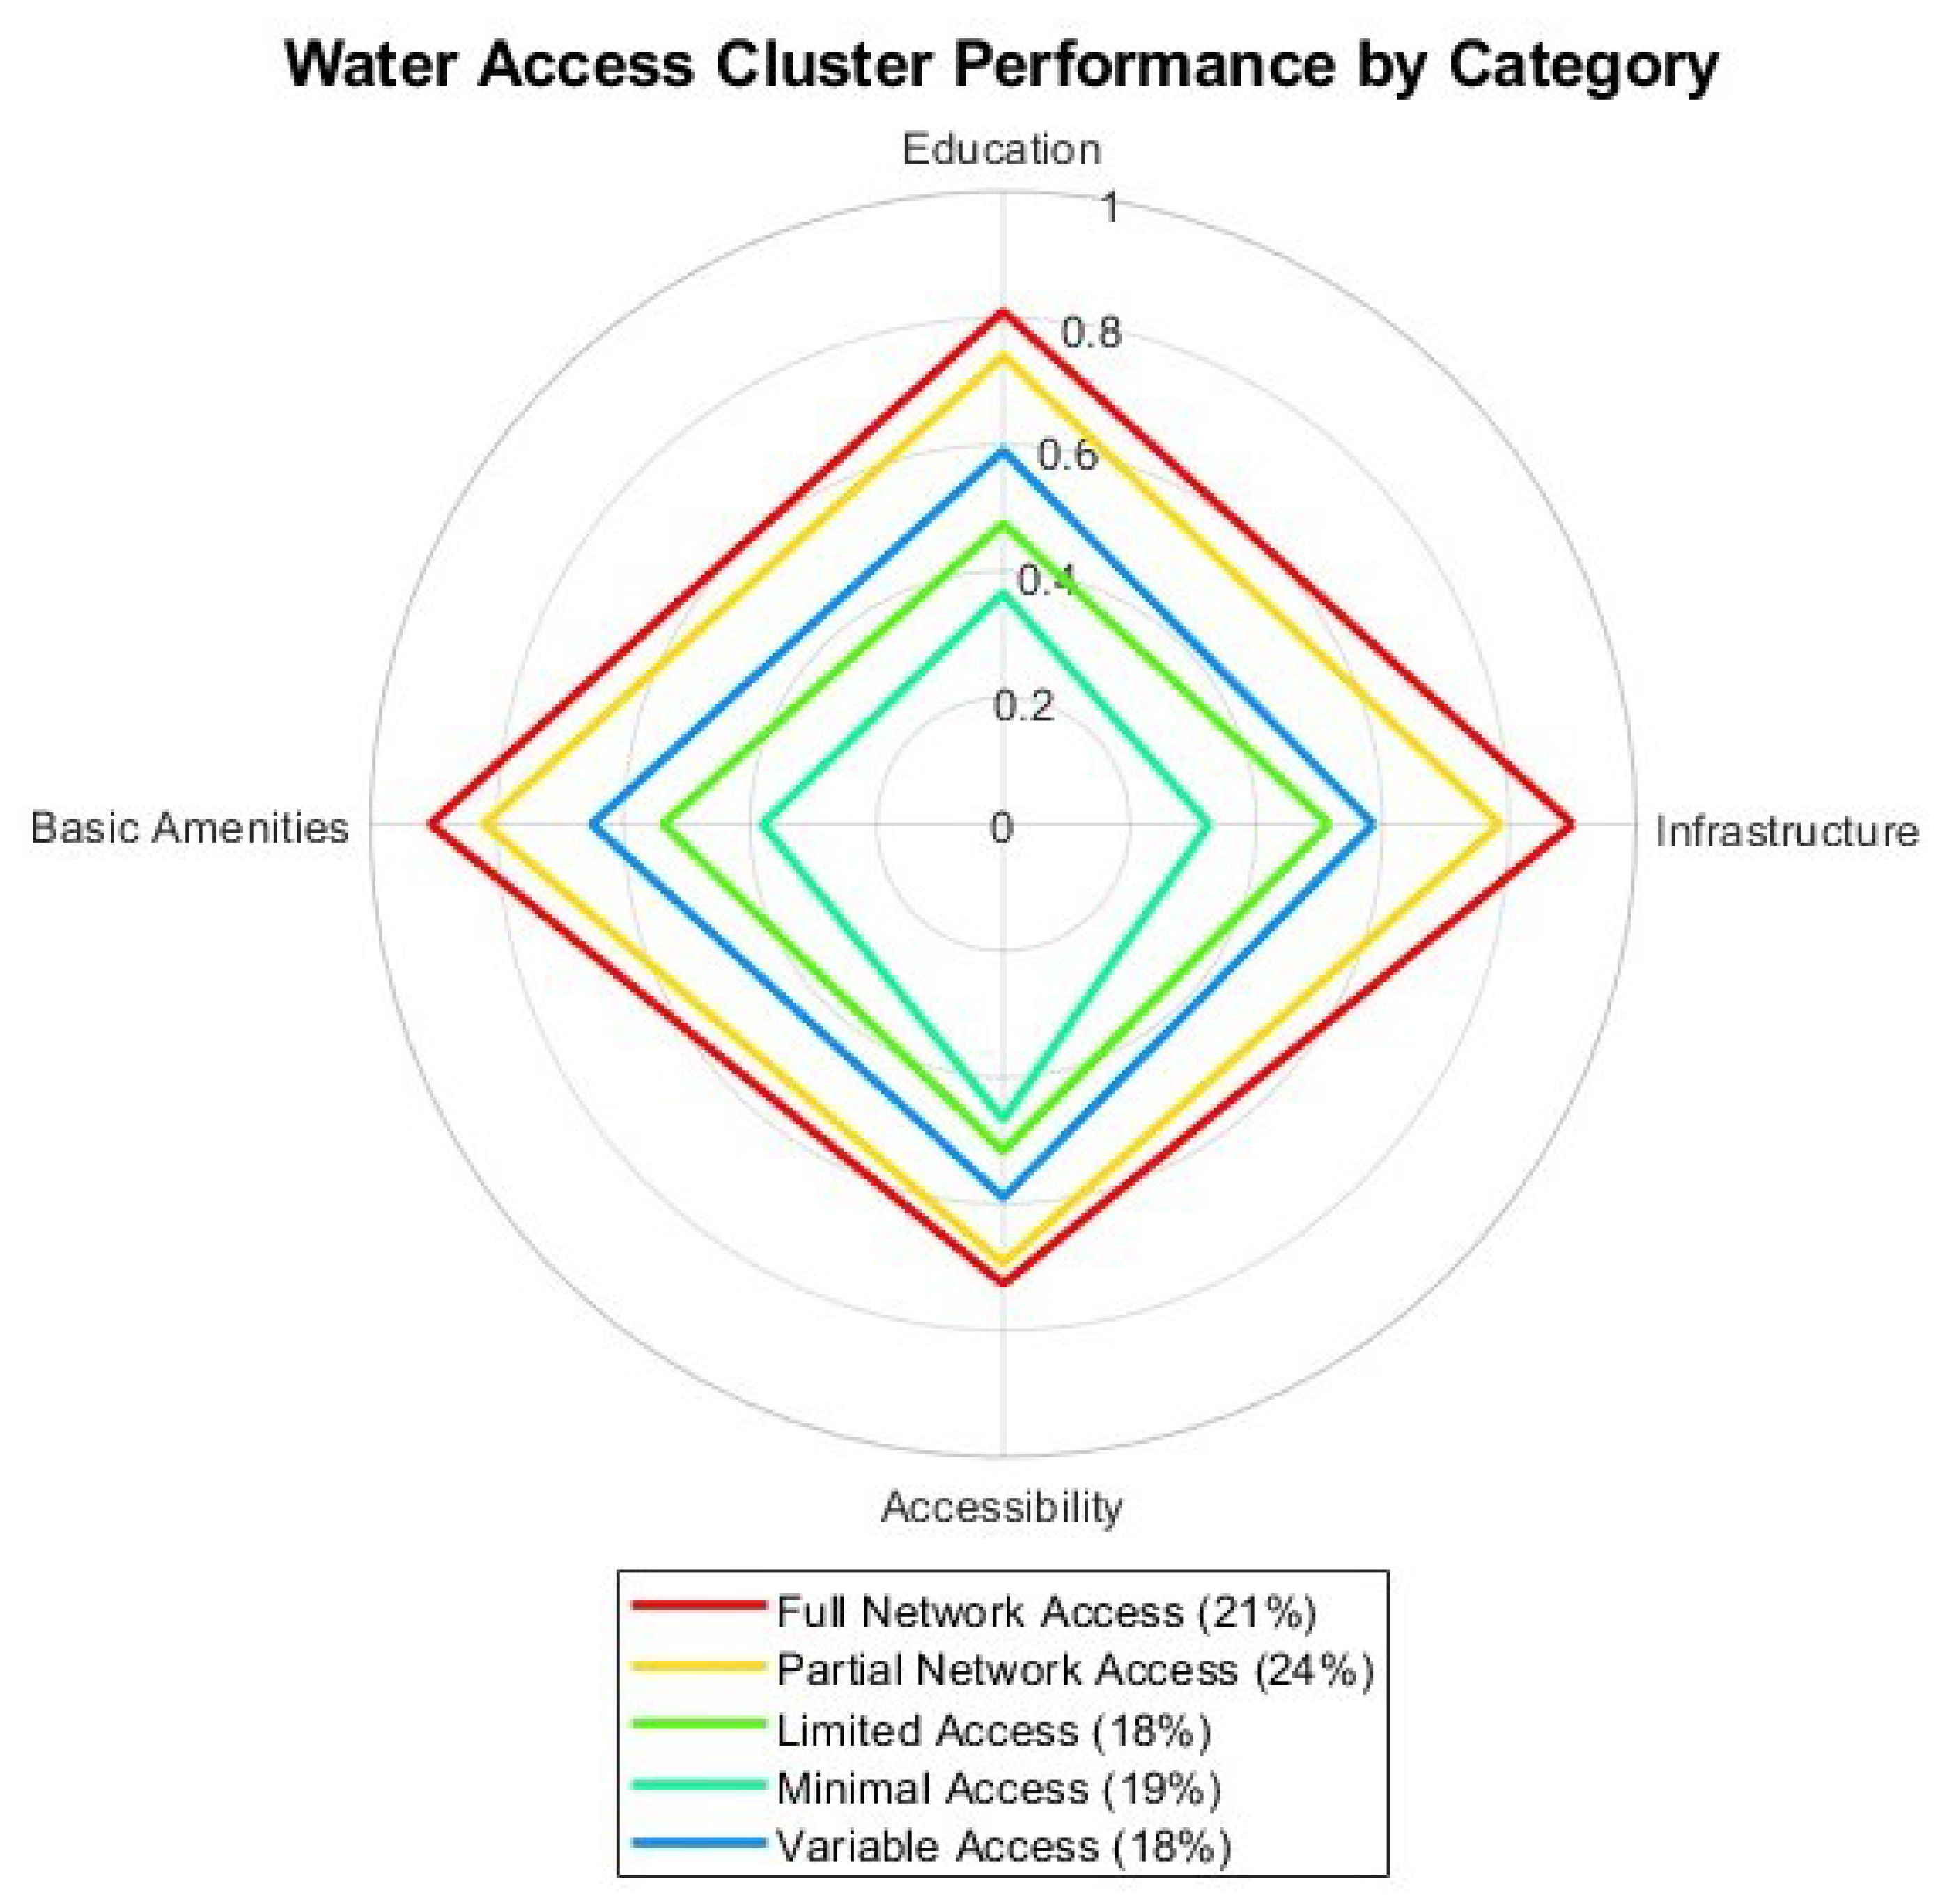
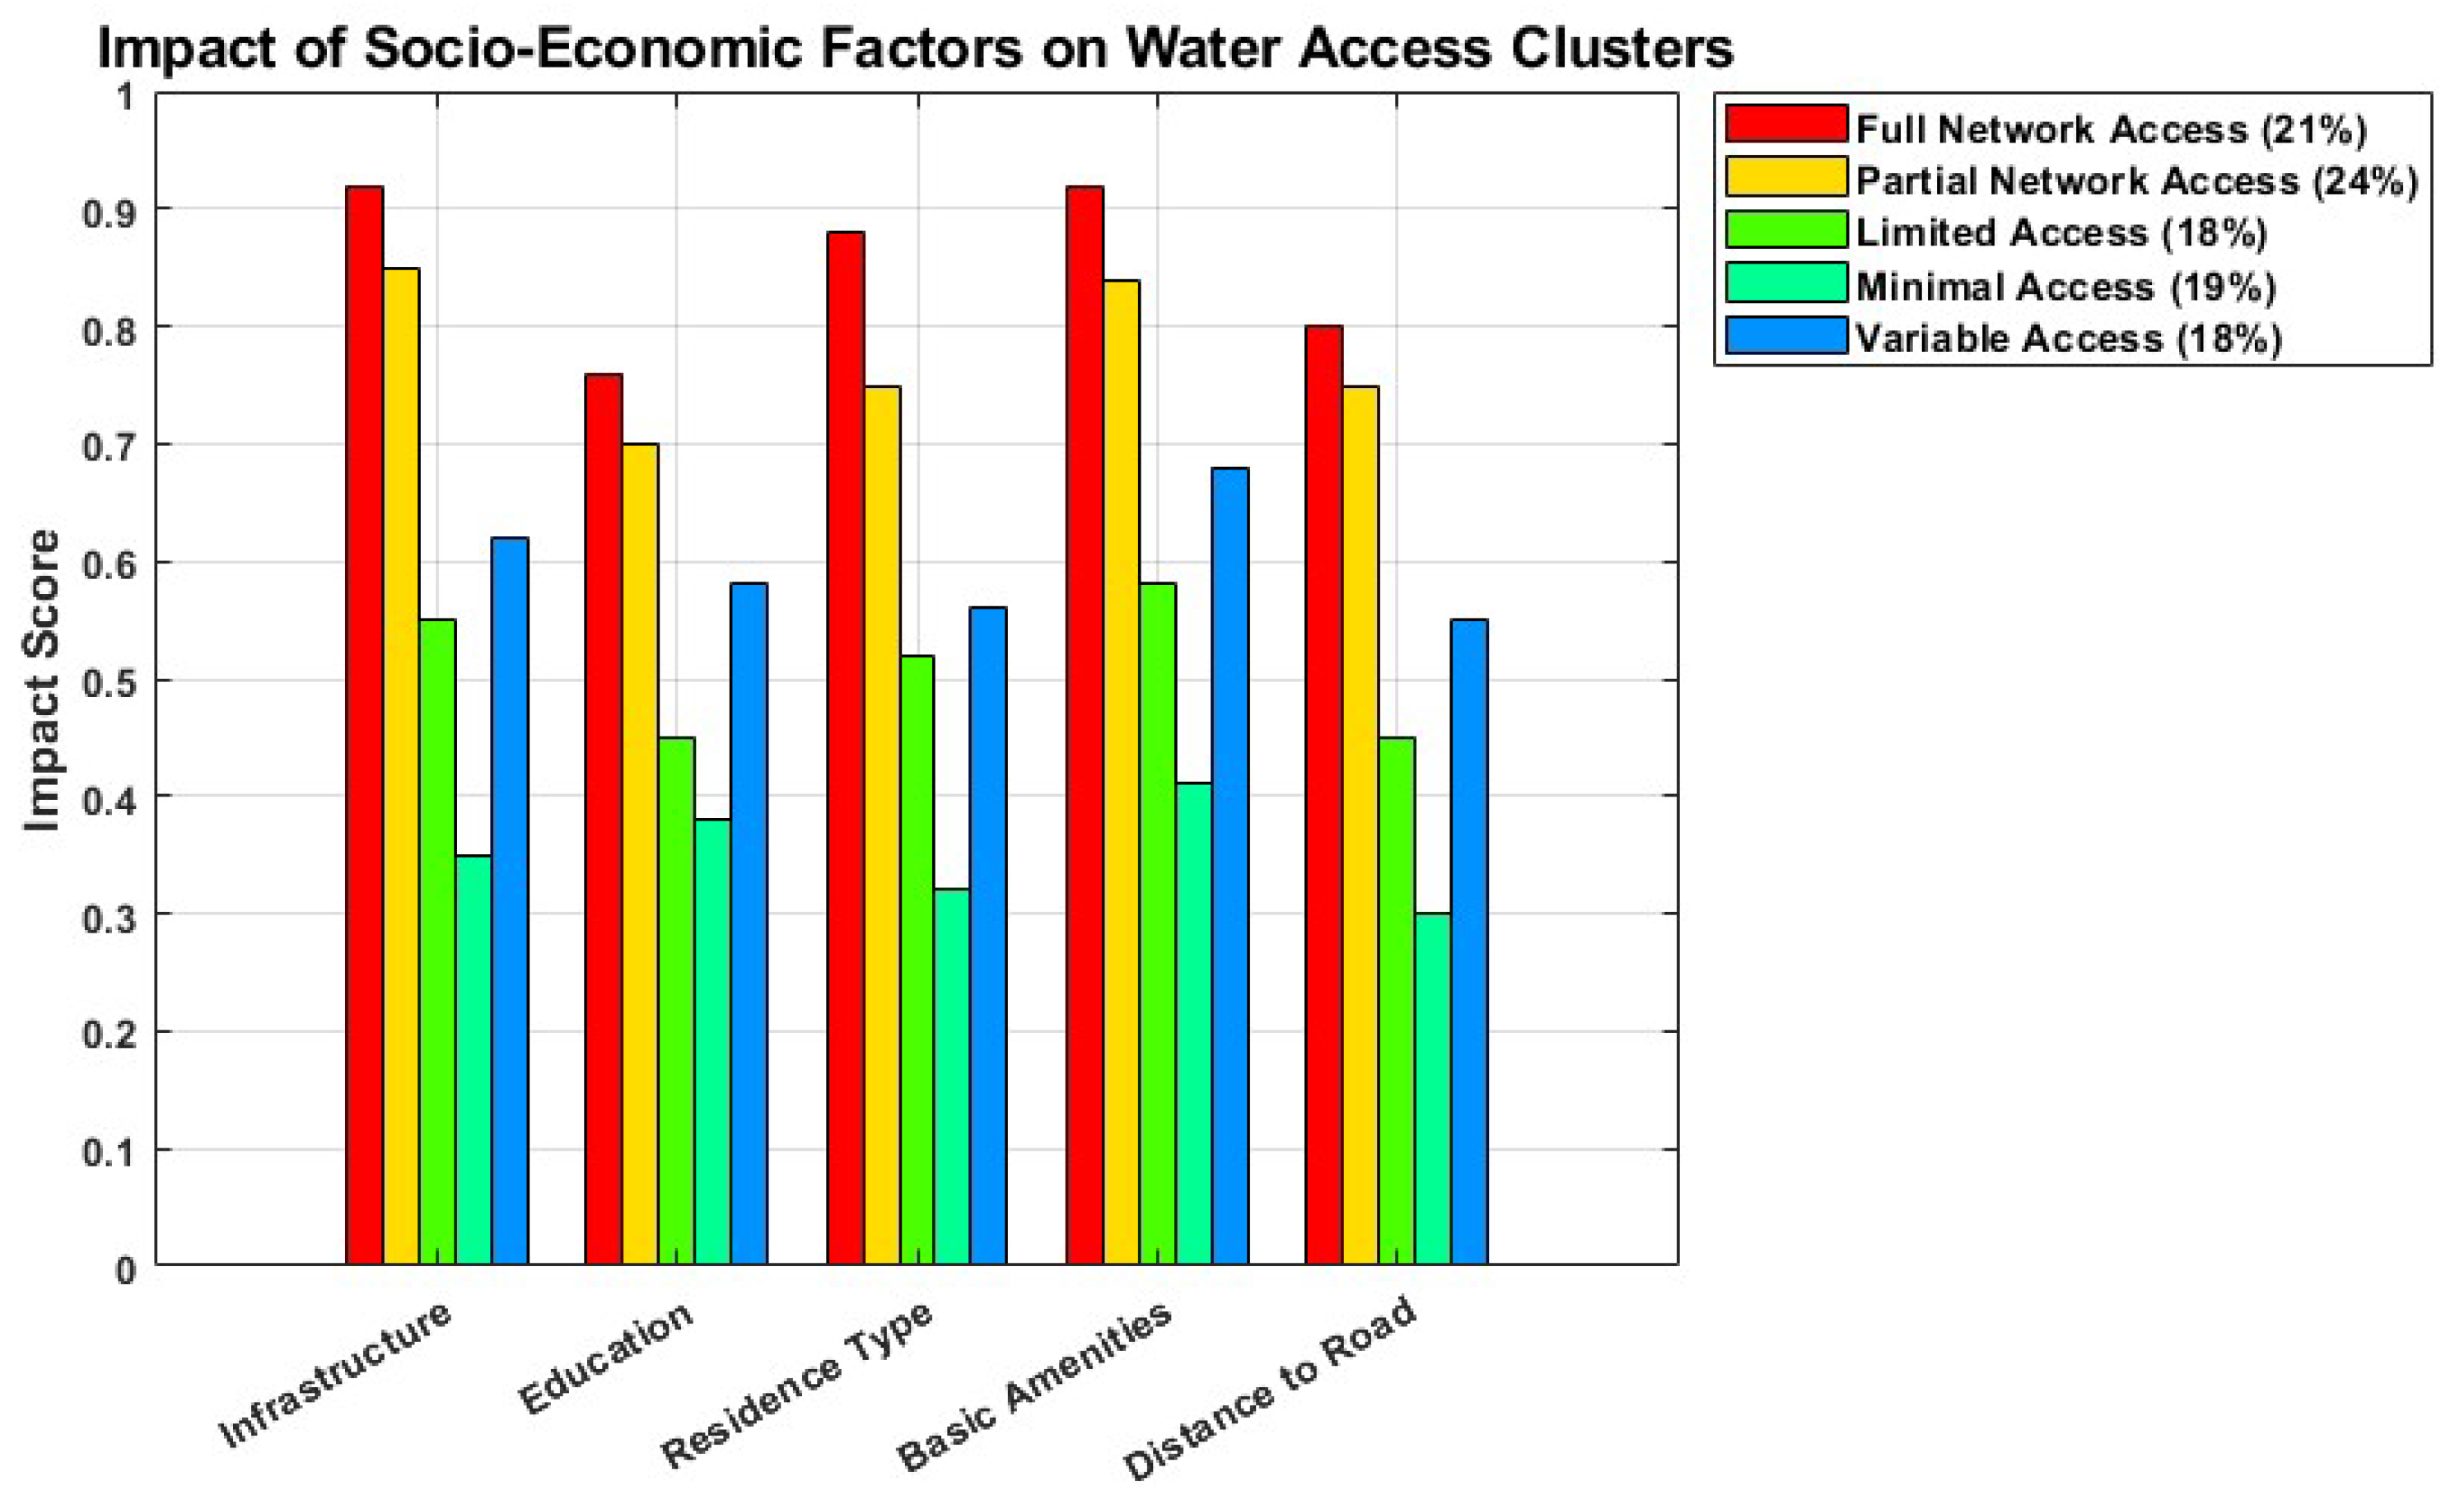
6.4. Category-Based Performance Analysis
- Full network access demonstrates balanced excellence across all categories (0.78–0.92).
- Partial network access shows strong infrastructure performance (0.85) but relatively weaker accessibility (0.75).
- Limited access exhibits moderate scores in basic amenities (0.58), with significant weaknesses in infrastructure (0.55).
- Minimal access shows poor performance across all dimensions (0.30–0.41).
- Variable access displays a balanced profile (0.55–0.68), without pronounced strengths or weaknesses.
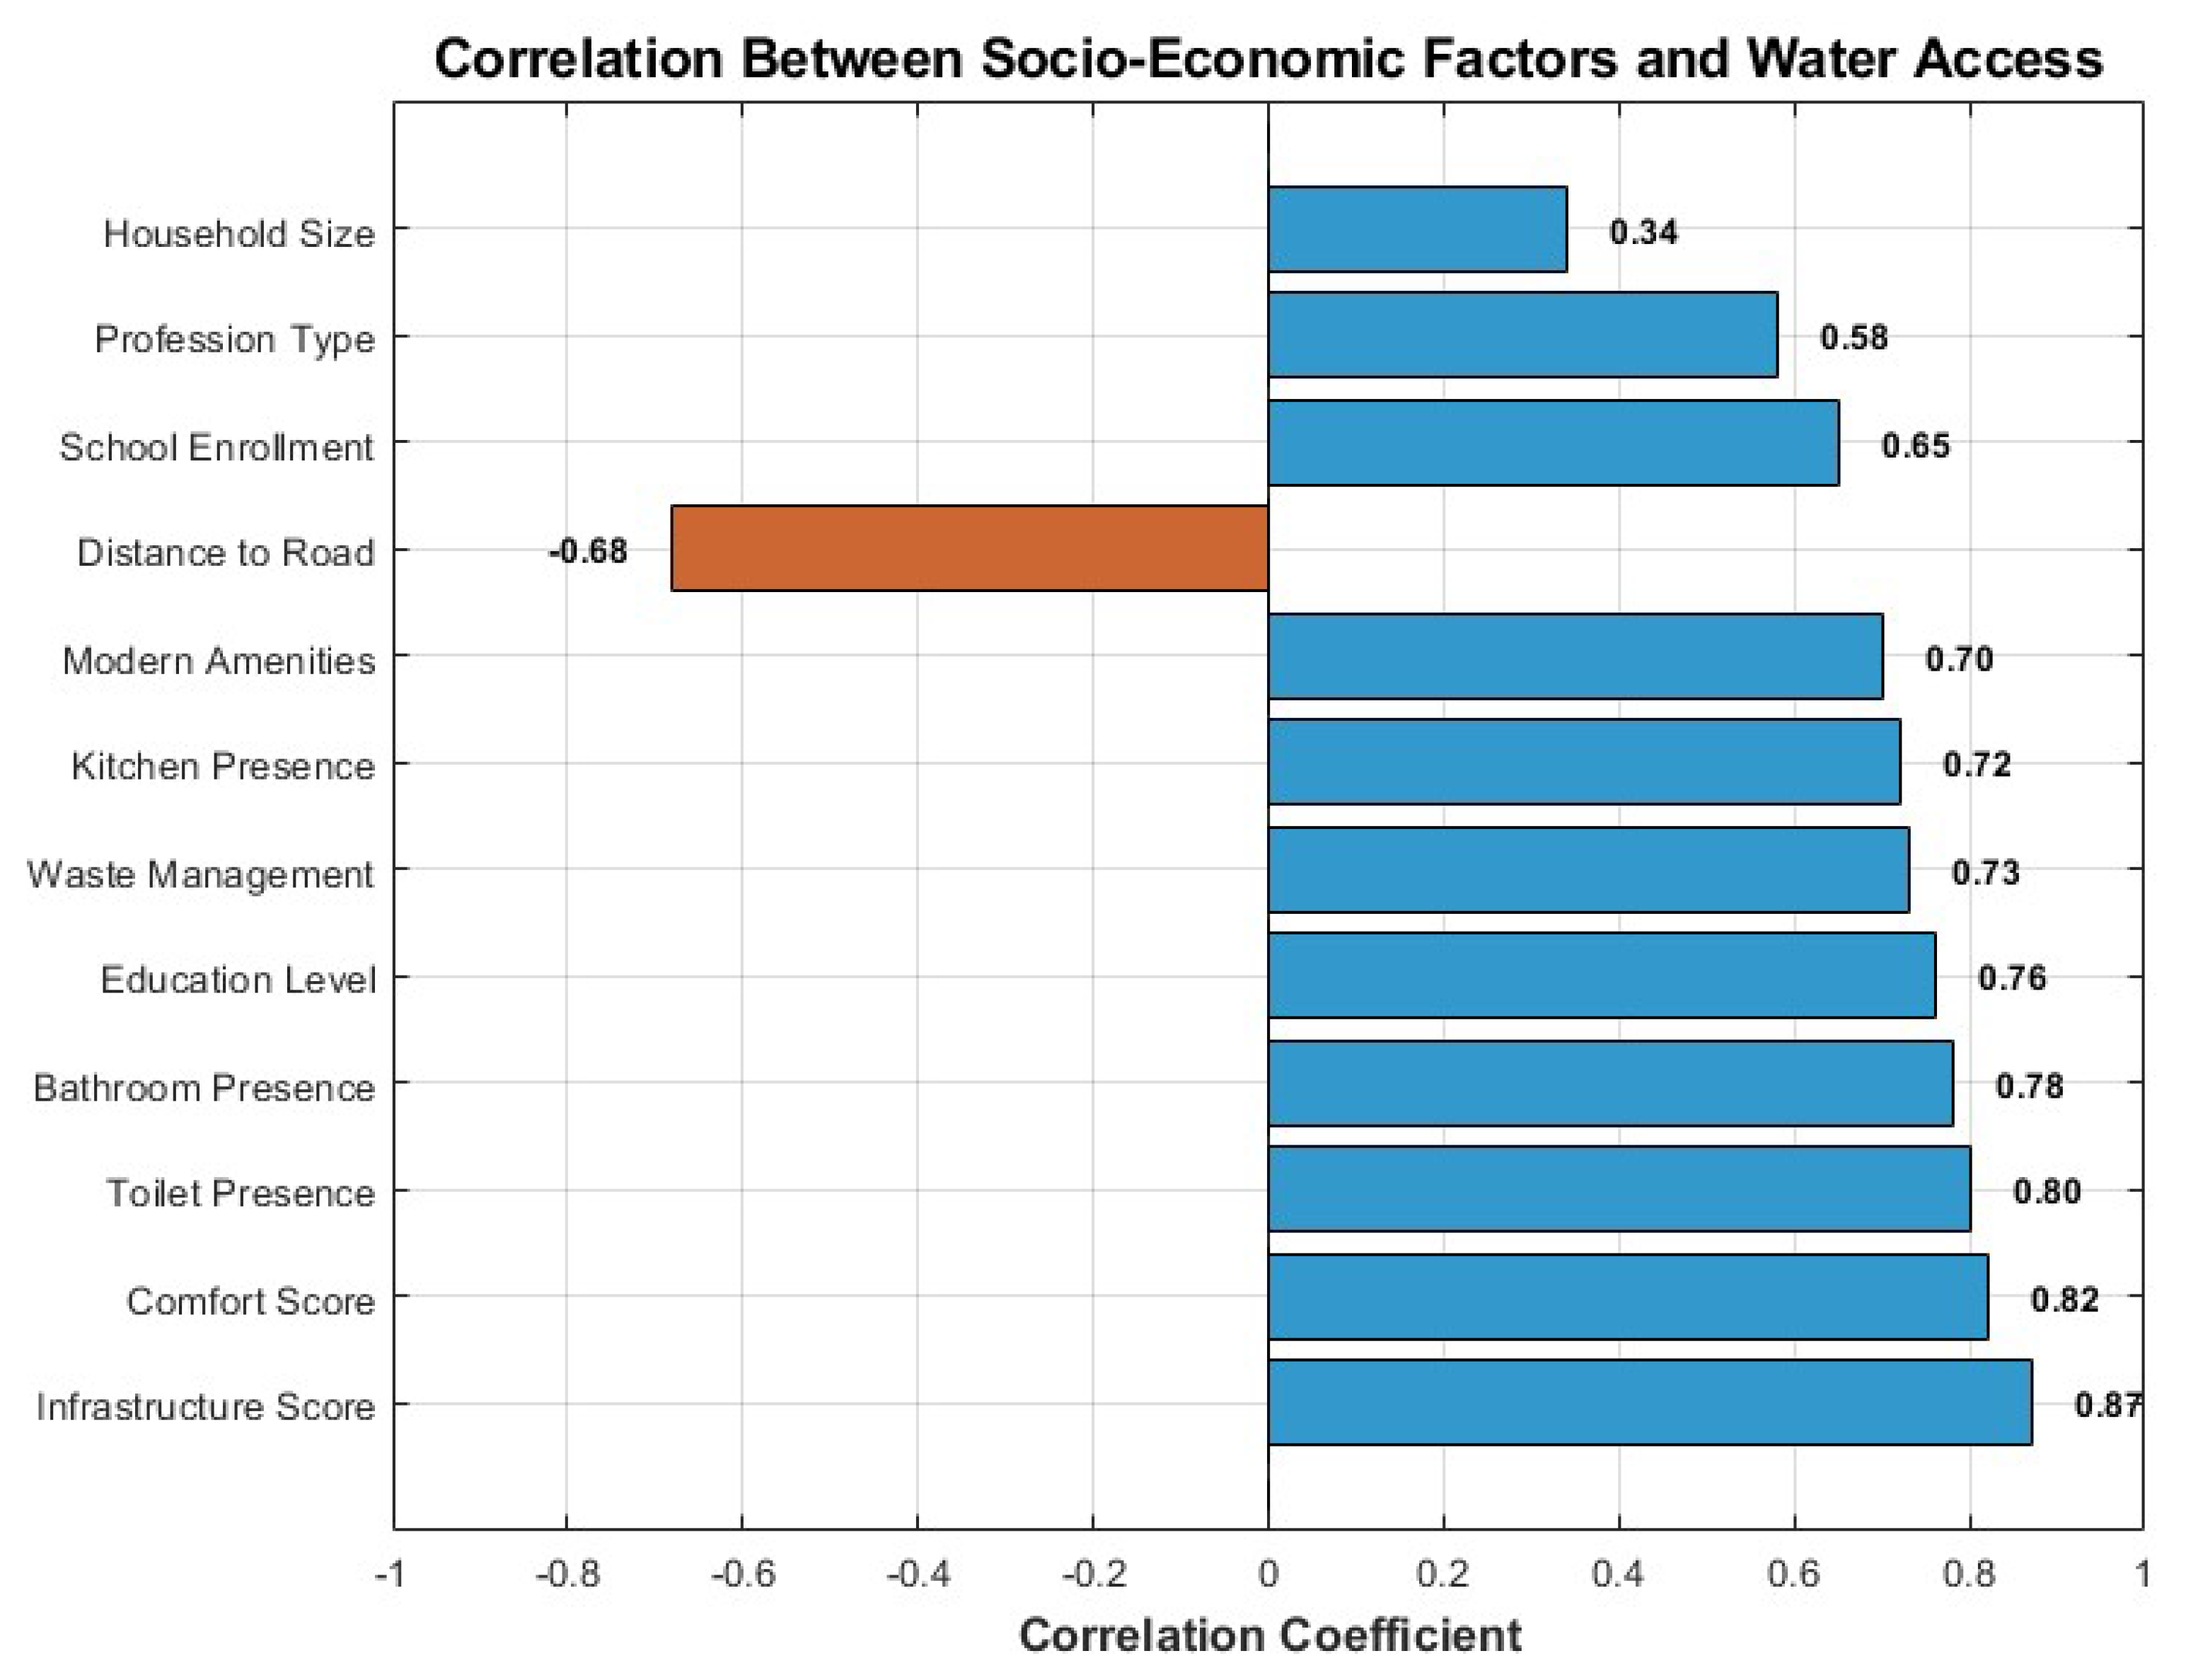
6.5. Socio-Economic Correlates
- Strong positive correlation (r = 0.87) between infrastructure score and water access;
- Strong positive correlation (r = 0.82) between comfort score and water access;
- Moderate positive correlation (r = 0.76) between education level and water access;
- Strong negative correlation (r = ) between distance to roads and water access;
- Weak positive correlation (r = 0.34) between household size and water access.
7. Policy Implications and Recommendations
7.1. Segment-Specific Strategies
7.1.1. Full-Network-Access Communities
- Focus on sustainability and maintenance of existing infrastructure;
- Implement water conservation programs to optimize usage;
- Develop smart water management systems leveraging existing infrastructure.
7.1.2. Partial-Network-Access Communities
- Prioritize completion of network gaps to achieve full coverage;
- Implement reliability improvement programs to address intermittent supply;
- Develop community-based monitoring systems to identify infrastructure weaknesses.
7.1.3. Limited-Access Communities
- Develop intermediate solutions combining centralized and decentralized approaches;
- Implement phased infrastructure development with clear progression paths;
- Establish community water management committees to oversee distribution.
7.1.4. Minimal-Access Communities
- Prioritize basic water access through appropriate technology solutions;
- Develop emergency water supply systems for drought periods;
- Implement water quality monitoring and treatment programs.
7.1.5. Variable-Access Communities
- Conduct detailed assessments to understand variability factors;
- Develop flexible infrastructure solutions that are adaptable to changing conditions;
- Implement targeted interventions addressing specific access bottlenecks.
7.2. Regional Development Frameworks
7.2.1. Spatial Equity Framework
- Allocates resources inversely proportionally to current access levels;
- Develops infrastructure corridors connecting isolated communities;
- Establishes regional water access standards applicable across geographic contexts.
7.2.2. Integrated Development Approach
- Coordinates water infrastructure development with education initiatives;
- Aligns water access programs with economic development strategies;
- Integrates water infrastructure planning with transportation networks.
7.2.3. Adaptive Management Framework
- Implements regular monitoring and segmentation updates;
- Develops flexible funding mechanisms that can respond to changing needs;
- Establishes clear progression pathways for communities transitioning between segments.
8. Conclusions
- Development of an enhanced metaheuristic algorithm specifically tailored for water access segmentation that achieved a 52.5% improvement in silhouette coefficient over the standard SSA;
- Identification of five distinct water access patterns with clear policy implications;
- Analysis of spatial distribution patterns, revealing critical geographic disparities;
- Development of a framework for translating segment characteristics into tailored policy recommendations.
- Longitudinal analysis to track segment transitions over time;
- Integration of climate change projections to assess future water access vulnerabilities;
- Development of hybrid segmentation prediction models for comprehensive water access planning;
- Extension of the methodology to other infrastructure domains, such as energy and telecommunications.
Author Contributions
Funding
Institutional Review Board Statement
Informed Consent Statement
Data Availability Statement
Acknowledgments
Conflicts of Interest
References
- Adams, E.A.; Stoler, J.; Adams, Y. Water insecurity and urban poverty in the Global South: Implications for health and human biology. Am. J. Hum. Biol. 2020, 32, e23368. [Google Scholar] [CrossRef]
- Chen, J.; Zhu, L.; Papoutsakis, E.T. Predicting water access using machine learning models and socio-economic indicators. Environ. Model. Softw. 2021, 135, 104898. [Google Scholar]
- Dar, S.A.; Shah, J.A.; Bhat, S.U.; Kumar, R. Segmentation-based approaches to water resource management: A systematic review. Water Resour. Manag. 2021, 35, 2509–2532. [Google Scholar]
- Rahman, M.M.; Ahamed, F.; Ahmed, N.; Ali, M.L. Challenges in clustering high-dimensional water access data: A comprehensive review. Water 2020, 12, 2293. [Google Scholar]
- Zhang, L.; Mistry, K.; Neoh, S.C.; Lim, C.P. Intelligent metaheuristic clustering algorithms: A survey. Appl. Soft Comput. 2020, 88, 106031. [Google Scholar]
- Mirjalili, S.; Gandomi, A.H.; Mirjalili, S.Z.; Saremi, S.; Faris, H.; Mirjalili, S.M. Salp Swarm Algorithm: A bio-inspired optimizer for engineering design problems. Adv. Eng. Softw. 2017, 114, 163–191. [Google Scholar] [CrossRef]
- Khan, K.; Rehman, S.U.; Aziz, K.; Fong, S.; Sarasvady, S. DBSCAN: Past, present and future. In Proceedings of the Fifth International Conference on the Applications of Digital Information and Web Technologies, Bangalore, India, 17–19 February 2014; pp. 232–238. [Google Scholar]
- Rousseeuw, P.J. Silhouettes: A graphical aid to the interpretation and validation of cluster analysis. J. Comput. Appl. Math. 1987, 20, 53–65. [Google Scholar] [CrossRef]
- Davies, D.L.; Bouldin, D.W. A Cluster Separation Measure. IEEE Trans. Pattern Anal. Mach. Intell. 1979, 1, 224–227. [Google Scholar] [CrossRef] [PubMed]
- Caliński, T.; Harabasz, J. A dendrite method for cluster analysis. Commun. Stat.—Theory Methods 1974, 3, 1–27. [Google Scholar] [CrossRef]
- Dunn, J.C. Well-separated clusters and optimal fuzzy partitions. J. Cybern. 1974, 4, 95–104. [Google Scholar] [CrossRef]
- Howard, G.; Bartram, J.; Williams, A.; Overbo, A.; Fuente, D.; Geere, J.A. Domestic Water Quantity, Service Level and Health, 2nd ed.; World Health Organization: Geneva, Switzerland, 2020. [Google Scholar]
- Mirjalili, S.; Mirjalili, S.M.; Lewis, A. Grey Wolf Optimizer. Adv. Eng. Softw. 2014, 69, 46–61. [Google Scholar] [CrossRef]
- Mirjalili, S.; Lewis, A. The Whale Optimization Algorithm. Adv. Eng. Softw. 2016, 95, 51–67. [Google Scholar] [CrossRef]
- Heidari, A.A.; Mirjalili, S.; Faris, H.; Aljarah, I.; Mafarja, M.; Chen, H. Harris Hawks Optimization: Algorithm and applications. Future Gener. Comput. Syst. 2019, 97, 849–872. [Google Scholar] [CrossRef]
- Mirjalili, S.; Mirjalili, S.M.; Hatamlou, A. Multi-Verse Optimizer: A nature-inspired algorithm for global optimization. Neural Comput. Appl. 2016, 27, 495–513. [Google Scholar] [CrossRef]
- Katoch, S.; Chauhan, S.S.; Kumar, V. A review on genetic algorithm: Past, present, and future. Multimed. Tools Appl. 2021, 80, 8091–8126. [Google Scholar] [CrossRef] [PubMed]

| Algorithm | Silhouette Coefficient ↑ | Davies–Bouldin Index ↓ | Calinski–Harabasz Index ↑ | Dunn Index ↑ |
|---|---|---|---|---|
| ISSA (Proposed) | 0.732 | 0.421 | 832.6 | 0.196 |
| SSA | 0.480 | 0.645 | 652.1 | 0.124 |
| GWO | 0.525 | 0.595 | 736.2 | 0.143 |
| WOA | 0.493 | 0.622 | 691.5 | 0.132 |
| HHO | 0.472 | 0.672 | 625.8 | 0.112 |
| MVO | 0.461 | 0.715 | 593.7 | 0.102 |
| GA | 0.436 | 0.782 | 568.4 | 0.087 |
| Metric | SSA | GWO | WOA | HHO | MVO | GA |
|---|---|---|---|---|---|---|
| WCSS | ||||||
| Silhouette | ||||||
| Davies-Bouldin |
Disclaimer/Publisher’s Note: The statements, opinions and data contained in all publications are solely those of the individual author(s) and contributor(s) and not of MDPI and/or the editor(s). MDPI and/or the editor(s) disclaim responsibility for any injury to people or property resulting from any ideas, methods, instructions or products referred to in the content. |
© 2025 by the authors. Licensee MDPI, Basel, Switzerland. This article is an open access article distributed under the terms and conditions of the Creative Commons Attribution (CC BY) license (https://creativecommons.org/licenses/by/4.0/).
Share and Cite
Boudrik, Y.; Touil, A.; Hasnaoui, R.; Ahlaqqach, M.; El Bakkali, M. Enhanced Water Access Segmentation Using an Improved Salp Swarm Algorithm for Regional Development Planning. Eng. Proc. 2025, 97, 38. https://doi.org/10.3390/engproc2025097038
Boudrik Y, Touil A, Hasnaoui R, Ahlaqqach M, El Bakkali M. Enhanced Water Access Segmentation Using an Improved Salp Swarm Algorithm for Regional Development Planning. Engineering Proceedings. 2025; 97(1):38. https://doi.org/10.3390/engproc2025097038
Chicago/Turabian StyleBoudrik, Youness, Achraf Touil, Rachid Hasnaoui, Mustapha Ahlaqqach, and Mhammed El Bakkali. 2025. "Enhanced Water Access Segmentation Using an Improved Salp Swarm Algorithm for Regional Development Planning" Engineering Proceedings 97, no. 1: 38. https://doi.org/10.3390/engproc2025097038
APA StyleBoudrik, Y., Touil, A., Hasnaoui, R., Ahlaqqach, M., & El Bakkali, M. (2025). Enhanced Water Access Segmentation Using an Improved Salp Swarm Algorithm for Regional Development Planning. Engineering Proceedings, 97(1), 38. https://doi.org/10.3390/engproc2025097038