Abstract
This paper predicts offered wage rates and job requirements in the logistics industry by utilizing data from online job postings collected through two methods: search tools and web scraping. We apply conventional estimation techniques, such as ordinary least squares and kernel density estimation, to analyze the collected data. Additionally, for the first time, we employ nowcasting methods (linear regression, decision tree, and K-nearest neighbor methods) in this context to generate robust results. Our main findings are as follows: First, the average real wage derived from online job postings aligns with officially published GDP per capita data for the studied countries and regions. Second, we identify significantly positive causal effects of work experience on real wages in the logistics industry. Third, skill requirements exhibit year-over-year variations. Finally, the decision tree method generates the closest nowcasted results in line with the actual web scraped data. The proposed methodologies and their findings establish a reliable approach using search tools and web scraping to define and predict labor demand for stakeholders in this sector as well as others.
1. Introduction
The demand for labor is the derived demand which means the labor demand depends on labor productivity, the price of goods, and the business output of a particular industry [1]. The labor demand can be affected by economic changes that shift the curve, such as a rise in output that would result in a shift in labor demand [2]. Hamermesh concluded employment is unchanged in response to minor demand shocks but moves instantaneously to a new long-run equilibrium if the shocks are enormous [3]. Earlier empirical research also showed that labor-demand elasticities depend on product-market conditions. According to Drazen, labor-demand elasticities alter with product-market demand while Lawrence et al. stated employees in manufacturing industries (the steel manufacturing industry in the US in the 1970s) saw the demand curve for their labor shifting adversely and becoming less elastic [4,5]. They responded by imposing a relative wage increase and making it stick. Hence, to predict the demand for labor one may look at how well the firms perform in the industry and how well the industry grows.
In this study for labor demand prediction, we focus on the logistics industry because logistics is a key factor in economic development and spatial and market integration [6]. The logistics sector also significantly created jobs and is expected to raise the employment rate by 7% from 2016 to 2026 [7,8]. However, some unprecedented events including the COVID-19 pandemic, conflict between Russia and Ukraine, and the energy crisis have significantly reduced global economic activities, threatening the global labor market [9]. Thus, this also influences the logistics sector. Consequently, the number of people employed in the logistics sector in 2020 decreased by 2.5% compared to 2019 [10]. As the pandemic is starting to wane and the global markets are starting to recover, employment in the logistics industry is increasing again and remains intensively high [11]. This situation raises the need for analyzing and predicting labor demand, particularly in the vulnerable industry as logistics, to inform policymakers to mitigate the adverse effects of economic shocks such as pandemics and war on employment [12].
Traditional data on the labor market used in analysis and forecast is often extracted from national labor force survey data, firm-level survey data, or household survey data which is time consuming and hard to access [13]. In contrast, online job postings offer a fast, reliable, and accessible alternative to traditional wage data sources, providing real-time insights into labor demand and wage. The availability of internet tools for job postings searches, applicant searches, and matching has revolutionized job postings searches [14]. The utilization of new sources of data and analytical approaches for studying the labor market is becoming more popular as labor economists are utilizing non-traditional sources like the internet and online job portals to collect web vacancies for job demand and supply matching [15,16,17]. Considering the number of job postings, routines, and details would give further insights into the labor demand and labor trends or labor shifts [18].
In this paper, we are trying to exploit the online job postings in the logistics sector to forecast the labor demand for the sector from 2019–2023 when the sector and economies experienced unprecedented uncertainties. This research analyzes the labor demand prediction including the prediction for wages and required skills, working experience, and education backgrounds from online job postings worldwide. The research combines traditional statistics and parametric and non-parametric estimation methods to exploit untraditional data. We applied Houthakker (1973)’s theorem of revealed demand preference that online job postings are the revealed demand preference for a particular job position. We also utilize the model of Heckscher–Ohlin to assume there is no labor mobility among countries which fits with the situation of an unprecedented crisis such as the COVID-19 pandemic. This builds a solid background for further analysis in demand prediction. Practically, this research could guide students to learn how to exploit conventional data to analyze the labor market and better prepare for future jobs when understanding firms’ annual trends in recruitment for a particular job position. Secondly, employers can exploit free information from online job postings to offer a reasonable wage based on referencing job postings and utilize the effectiveness of online postings to attract suitable candidates. Lastly, policymakers and researchers can urgently observe this market’s trend with nowcasting results from online job postings, especially in the unprecedented shocks, and stakeholders could exploit the online information without location borders.
The research focuses on labor demand prediction in the logistics industry in several selected regions of Vietnam, mainland China, Hong Kong (China), Taiwan (China), Thailand, Singapore, Germany, France, Australia, the UK, and the US. We collect data in 2019, 2022, and 2023 by search tools and compare them to the data collected by web scraping. Using these datasets, we sketch out the kernel estimated density to investigate the difference between wages offered to workers with distinct levels of education and working experience in the logistics market. Furthermore, we take a closer look at logistics’ job requirements in Vietnam and compare to other selected countries.
Based on the objectives, this study focuses on answering the following questions. First, we attempt to find evidence from the online job postings to observe whether the labor demand for logistic jobs changed due to the unprecedented crisis. Second, more particularly, we analyze the change in wages and job requirements before and after the crisis. Last, we investigate if working experience affects the wage for logistics jobs.
2. Literature Review
Efforts to estimate labor demand worldwide have long been a concern, with Sargent researching the dynamic demand schedule for labor [19]. Some empirical research has looked at the response of wages to labor productivity and economic shocks. Bewley in 1999 and Kaur in 2019 have looked at the nominal wage rigidities illustrated to hinder labor markets from clearing after unprecedented economic events, which leads to excess unemployment rates [20,21]. Prasad and Keane examined the effect of oil price change on labor demand, which found that oil price increases would increase labor demand, given that the labor and energy were gross substitutes [22]. They also indicated that a rise in the price of oil does not have an adverse effect on aggregate employment in the long run. The oil price increase substantially reduces wages while workers continue to supply as much or more labor. A study in India found that over 50% of workers have reduced wages, with young ophthalmologists being the most affected and women and young professionals experiencing the most reductions [23]. Marinescu et al., however, stated that the number of applications per job on average increased substantially during the COVID-19 crisis [24]. In addition, the job market values various competencies differently, and these benefits have changed over time. Daniya et al. recognized the urgent need to address the specific demands of different labor markets and developed a methodology for predicting the necessary skill sets based on key indicators [25]. In the US and Sweden, social and non-cognitive abilities are becoming more critical [26,27], while manual skills are becoming less critical [28]. These changes are related to shifts in job requirements [29,30]. Hershbein and Kahn found that, when unemployment rose in local areas, employers became more selective in their job postings, demanding higher levels of education and more work experience from candidates [31]. This trend was especially noticeable for jobs involving routine or repetitive tasks. Thus, predicting demand for labor is essential in analyzing the changes in labor wage and job requirements (working experience and education) when economic shocks happen.
Online job postings have become a familiar and effective means of job searching, particularly for job seekers. Kuhn and Skuterud have found that online job searching was used by about one-quarter of unemployed job seekers in 2000 [32]. They stated that the use and the effectiveness of online job searching have changed significantly since the turn of the twenty-first century as, during the 2008–2009 recession, three times more unemployed people were using online job searches than ten years earlier. Their research from 2011 confirms their findings about the high usage and effectiveness of online job searches. Kuhn and Mansour’s research showed that the unemployed from 2008–2009 were three times more likely to use online job searches than about ten years earlier [33]. They also found that job searchers who utilized the web to seek employment had shorter unemployment spells and spent less time unemployed than non-internet users. However, when observable qualities remained consistent, the unemployment differential between internet and non-internet users was eliminated and, in some cases, even reversed. Job postings also play a crucial role for firms worldwide as they utilize multiple channels to attract potential applicants, benefiting from technology and the internet’s broader reach [34].
Data on the labor market, analysis, and forecasts are often extracted from the national labor force, firm-level, or household survey data [12]. Besides these traditional data sources, labor economists currently pay more attention to other novel sources for the analysis and prediction of the labor market, for example, data collected from newspaper job advertisements or data retrieved from the internet or web-portal data for labor market analysis [35,36,37]. Web scraping is a technique that transforms disorganized data found on websites into a structured format suitable for analysis and storage in databases or spreadsheets. This method has emerged as one of the most widely adopted and efficient approaches for gathering data from web portals, enabling organizations to systematically collect and utilize information from online sources [38]. Several studies have utilized firm-level and household survey data to examine the topic, including Konings and Vanormelingen’s research using firm-level data, Topalova’s analysis of the Indian national household survey, and McCaig and Pavcnik use of the Vietnam household living standard survey [39,40,41].
Rea and Maloney conducted a study that utilized higher-frequency administrative data to estimate the overall unemployment rate, employing a nowcasting approach through the UR-NOW model [42]. The UR-NOW model differs from previously conducted research in that it uses administrative data from the Monthly Employment Index on the number of current income-tested main benefits and filled positions (MEI). The model is also in use, and a routine nowcast happens once a month. The model’s three distinct stages involved evaluating the predictability of various models and factors, refining chosen models with different variables and lag structures, and comparing the performance of various model groups utilizing out-of-sample forecast errors generated by a roll-forward methodology to construct the model. The UR-NOW model’s accuracy was ensured by utilizing only available data during the forecast period and by predicting the monthly unemployment rate with improved precision, outperforming the simple AR (1) benchmark. Although there is a slight deviation from the standard, it only becomes statistically significant in the last quarter of the month with a confidence interval of 95% at +/− 0.54%. The UR-NOW model uses data from individuals receiving any income-tested main benefit instead of those on the Jobseeker Support-Work Ready benefit. In conclusion, they discovered that there is also a statistical association between the unemployment rate and the percentage of the population who get income-tested significant benefits, offering a simple, “rough and ready” relationship between the two indicators.
Vietnam’s job market has seen declines in demand for purchasing, materials, and logistics roles in early 2023 compared to pre-pandemic levels in 2019. Specifically, recruiting demand for purchasing, materials, and supply chain positions decreased by 25% in the first four months of 2023 relative to the same stable period before COVID-19 [43]. This drop comes on the heels of a slight 3% decline in the first part of 2022 compared to pre-pandemic norms. The recent decrease aligns with broader economic downturns and market fluctuations globally and in Vietnam. Slowdowns in hiring demand for procurement and supply chain talent could relate to specific impacts on manufacturing and exporting industries central to Vietnam’s economy. However, the data signals employers remain cautious about expanding purchasing and logistics personnel [44].
3. Methodology and Data Description
3.1. Methodology
Our analysis framework follows Houthakker’s theorem of revealed demand preference, i.e., revealed demand for jobs from online advertisements, to exploit online job postings data to predict wages and relevant job requirements. The theorem suggests the assumption that, if the demand functions of a customer meet the strong axiom of revealed preference and specific continuity criteria, then in any market situation, the buyers will choose among available commodity vectors as if the buyers were maximizing a continuous, strongly quasi-concave utility function constrained by their budget. For two-dimensional commodity vectors, this theorem, with the strong axiom replaced by the weak axiom, is due to P. Samuelson, who originated the theory of revealed preference [45].
In this study, the decision of wage payment in the economy is assumed to follow the Heckscher–Ohlin model [46]. The theorem states that nations sell things that utilize easily accessible and inexpensive factors of production and import those that require relatively few forces of production. There is no labor mobility among countries.
We apply three statistical methods in the study: ordinary least squares, kernel density estimation, and nowcasting. This study updates the conventional statistical method for predicting wage from web advertisements, that of Nguyen et al. (2024) [47].
3.1.1. Ordinary Least Squares (Baseline Estimation)
Our baseline estimation for analyzing logistics labor wage is based on the Mincer earnings function that explains wage as a function of schooling and experience [48]:
where:
- Log(Rwage): monthly real wage in log value.
- Edu: dummy variable, Edu = 1 if the job requires the candidate to have a master’s degree and Edu = 0 if the job requires the candidate to have a bachelor’s degree.
- Exp: years of working in the logistics industry.
- ੬: statistical residual.
Due to data limitations from search tools and web scraping, our analysis focuses on two key variables: education (Edu) and experience (Exp). While economic models often incorporate a more comprehensive range of factors, we were constrained by the available information. Despite the simplified approach, our analysis provides valuable insights into the relationship between education, experience, and wages within the logistics industry.
3.1.2. Kernel Density Estimation
We apply kernel density estimation to observe the difference between working experience and wage because the model is a common non-parametric approach; they are unsupervised techniques to detect outliers that utilize kernel functions [49]. The kernel density estimator has several benefits over the widely used histogram [50]. Kernel density estimation (KDE) is expressed by the following formula. For x ∈ R the following equations determine the kernel density, computed from observations X1,…, Xt:
where:
- h > 0: the bandwidth, which controls the smoothing of the KDE.
- K: the kernel estimation.
3.1.3. Nowcasting Estimation
Nowcasting is a vital technique in economics, providing forecasts of an economic indicator’s status in the recent past, present, and near future. Bok et al. demonstrated its significance by using nowcasting to predict actual GDP growth rates in the United States [51]. Their study leveraged high-frequency data, such as retail sales and manufacturing output, to update real-time GDP forecasts. Their research concluded that nowcasting improved the accuracy of GDP predictions, enabling policymakers to make more informed decisions during periods of economic uncertainty. Aastveit et al. took the concept of nowcasting further by combining various short-term models to enhance accuracy [52]. They applied this approach to predict unemployment rates across European countries. Their research showed that integrating diverse models, including autoregressive and Bayesian approaches, significantly improved the precision of short-term unemployment forecasts.
Linear regression serves as a core statistical approach that examines how one variable responds to changes in other variables. This technique creates a linear mathematical model that establishes relationships between a response variable (the outcome being studied) and one or more explanatory variables (the factors that may influence that outcome). By fitting a straight-line equation to the available data, linear regression enables analysts to both understand variable relationships and generate predictions based on those patterns. Linear regression is a statistical technique grounded in the principles of ordinary least squares (OLS) regression [53]. OLS aims to identify the line (or hyperplane in multidimensional scenarios) that minimizes the sum of squared discrepancies between predicted values based on the regression equation and actual observed values. This minimization process determines optimal coefficients to align the model with the data best. The adoption of the linear regression formula in research stems from its inherent simplicity and interpretability. This method offers a transparent and comprehensible means of quantifying the relationships between variables. Moreover, it excels in cases characterized by linear or nearly linear associations between the examined variables [54].
where:
Wage = constant + β × Date,
- Wage: nominal wage collected from the job postings.
- Date: the date when job was posted.
- β: slope.
Decision trees are significant in machine learning as robust tools for classification and regression tasks [55]. These algorithms recursively partition data into subsets based on distinctive attribute values, primarily creating segments that exhibit high homogeneity concerning the target variable [56]. The process involves selecting an attribute and splitting the data into subsets corresponding to unique attribute values. This recursive procedure continues until specific stopping criteria are met, including a specified tree depth or a certain level of impurity reduction. The terminal nodes, called leaf nodes, represent the final predictions or classifications [57]. One of the notable benefits of this technique is interpretability, often facilitated through visualization, which makes it invaluable for comprehending intricate data relationships.
K-Nearest Neighbor (KNN) is an extensively utilized machine learning algorithm with pivotal roles in classification and regression tasks [58]. Rooted in the foundational principle that data points sharing similar attributes tend to exhibit common characteristics, KNN proves invaluable across various research applications [59]. Notably, it refrains from making assumptions about the underlying data distribution, rendering it particularly suitable for scenarios characterized by intricate or undefined data patterns. A defining parameter, “K”, governs KNN’s behavior, determining the number of neighboring data points to consider during analysis. Achieving an optimal balance with this parameter is crucial; a small K may yield noisy results, while an extensive K can lead to over-smoothed outcomes [60].
3.2. Data Description
3.2.1. Web Search Data
Information of the aggregate registered online job vacancies, job applications, employment, and unemployment statistics in the logistics industry can be known using the web search data of advertisements for a particular country or across countries, including Vietnam, mainland China, Hong Kong, Taiwan, Thailand, Singapore, Germany, France, Australia, the UK, and the US. Economic hubs in Vietnam, including Hanoi, Ho Chi Minh City, and Danang, are also selected for the analysis [61]. Information by country and region is possibly obtained using a web search and was made available for analysis:
- (1)
- Basic details about the job opening (job position name and categorized workplace, type of contract).
- (2)
- Criteria for the applicant (level of required education, years of working experience, required skills and categorized).
- (3)
- Details about the business (location, quantity of employees, business area).
- (4)
- Data on skill requirements employers put on employees when filling open vacancies.
For more details on advertisement and web search data applied in economic research, see Dörfler and Van de Werfhorst’s and Benjamin’s studies [35] (several tools may be used to extract data from different websites. See also: Štefánik [62]).
3.2.2. Web Scraped Data
Web scraping is an automated technique for collecting data from web browsers, allowing for cost-effective extraction of vast amount of data continuously generated online [63].
This approach utilized APIs to collect job posting data from platforms like Glassdoor, Google Job Recommendations, Glints, and Seek, enabling creation of datasets with quantifiable requirements, including average wages. This method reduces data latency, allowing researchers to analyze emerging trends before traditional datasets become available.
Following Krotov and Tennyson, we conducted five steps in crawling data from websites using Python version 3.9 [64]. In the first step, the desired website with the necessary information must be reached using HTTP protocol—an internet standard for sending and receiving requests. In the process, Cloudflare requests users to do some verification to avoid traffic, so we undetected Chrome to bypass. During this stage, the captcha may appear again as several requests in the Chrome driver, so we close Chrome after crawling the data from one URL and then open it again for the following URL.
The next step is checking data and required elements and filtering the requirements. It must be ensured that each online job posting includes the required elements (job titles, education, skills, and working experience). Assessing the website reveals that the wage is included within a div class named “jobsearch-JobMetadataHeader-ite”. Concurrently, finding the tag that stores all these items is necessary for the minimum requirements since they are included within a lengthy phrase. All of the data and required elements are then filtered into keywords based on academic degree and skills needed: bachelor’s, master’s, BC, skills, knowledge, abilities, experience, ability, proficiency, etc. Subsequently, we crawl the data by finding which tag stores the job title and the wage. For each website, we get about 200 URLs for the logistics job, then look for some required information, including wage, skills, academic degree, etc., using the above tag. We take extra steps to calculate and convert wages into the same range because some postings have different wage information (per year, month, or hour) and do not reveal it. The relevant data available may be organized into a structured format for display or storage.
Appart from using the traditional data collection method such as web search data, we used web scraping as a more efficient solution for multiple data sources. Web scraping involves developing software to automatically collect the information displayed in a web browser. Specifically, in this study, we scrape prestigious job-searching websites to construct datasets of online job postings, including average wages, with measurable and comparable requirements. As a lot of websites and web apps are publicly accessible, datasets can be generated without involving data providers. Although web-scraped data may initially appear similar to other naturally collected datasets addressing comparable research questions, using automated web scraping methods for educational purposes introduces distinct and potentially problematic validation challenges. One significant concern is that web scraping may fail to adequately capture important contextual information, particularly in dynamic environments where websites frequently update their data collection and presentation methods. The use of web scraping can lead to the failure to capture contextual information in a rapidly changing environment (e.g., updates to the website’s data-generating process). By using this method, only a one-shot capturing the labor market at a specific time is still relevant. Second, web scraping can fail to retain raw website or API data necessary for construct validation, sampling, and analysis. However, the increasing usage of web scraping shows that it is an efficient data collection solution despite some limitations. First, the interval between market phenomena and data availability for academic study is frequently shortened by collecting data through web scraping or APIs. For scholars, the inherent timeliness of web data remains crucial for advancing understanding of cutting-edge, important subjects like the sharing economy (Airbnb), access-based business models (Spotify), and fake online content [63,65,66]. More generally, online data allows academics to comment on current topics before “traditional” datasets are accessible. This is relevant to our research objective to forecast the labor demand and average wage for logistics work. Second, collecting data independently allows researchers to maintain scientific objectivity and prioritize research integrity. Since data collection does not require direct involvement from companies or data providers, researchers can pursue important societal questions without being constrained by corporate interests or preferences (e.g., firms might be unwilling to share data about the tracking tools they use on websites) [67]. Furthermore, this approach ensures that research findings can be published regardless of whether they reflect favorably on the organizations being studied, thereby maintaining academic independence and transparency. As we have limited access to the actual job poster, this advantage outweighs the limitation of the web scraping method.
4. Research Results
4.1. Descriptive Statistics
Based on the analysis of survey data comprising 2961 validated responses (in 2019 and in 2022), the findings revealed modest upward trends in mean values across most regions. However, several countries—Australia, France, Thailand, Malaysia, and Indonesia—deviated from this pattern. The stability of mean values between these two years suggests reliability in the data, as the absence of dramatic fluctuations indicates consistent measurement. Furthermore, the research established a correlation between regional mean values and their respective GDP per capita, highlighting the relationship between economic performance and survey outcomes. Regarding the number of observations, in 2022, all regions included 150 observations, while there was a significant gap between regions, from 16 to 149 vacancies, in 2019, indicating considerable differences in standard deviation. To evaluate the expectations of employers for skills, we categorized skills (2019 and 2022) into professional and soft skills and found a difference in skill requirements between high-income and middle-income countries.
According to Table 1, it is evident that the number of observations decreases significantly after applying the filtering process since certain data points did not meet the specified criteria or were deemed irrelevant for the analysis.

Table 1.
Descriptive statistics—Quarter 1/2023.
Upon examining the data, it becomes apparent that there are variations in the average mean values across different country codes. Among the provided data, Danang, Cantho, and Haiphong has the highest average mean value, reaching 0.619.
The standard deviation is a crucial statistical measure that quantifies the amount of variability or dispersion within a dataset. Hanoi has the highest standard deviation of 1.631, indicating a wide spread of data points. Conversely, the UK has the lowest standard deviation, standing at 0.393, implying a relatively smaller variability within its dataset.
Table 2 illustrates that success in the logistics sector within middle-income countries depends on a combination of professional and soft skills. Professional skills involve industry experience, technical knowledge, and proficiency with standard applications. Additionally, soft skills like leadership, effective communication, presentation abilities, negotiation, and language proficiency play a crucial role. Also, the globalization of the logistics industry requires effective communication with clients and suppliers. The analysis of the skills required for jobs in the logistics industry in middle-income countries in 2019 and 2022 reveals several key points. Noticeably, there was a decrease in the demand for analytical competencies by 2%, hands-on experience in the related field by 6%, and knowledge in the field by 3%. This suggests a shift in the industry’s focus and reliance on these skills.
Table 2.
Percentage of skills in middle-income countries extracted from online job postings between 2019 and 2022.
Communication skills saw a notable increase in importance (from 14.53% to 21.5%), highlighting the growing need for effective coordination and collaboration within the industry. English proficiency saw a significant rise in 2019 (20.1%) and 2022 (25.1%), reflecting the global nature of the logistics industry and the need for effective communication with international stakeholders.
Table 3 shows that the logistics industry is demanding updated and advanced skills. High-income countries demand a broader set of skills, including SQL, UI/UX, and more. They also adhere to a greater number of standards and principles compared to middle-income nations, which elevates the importance of communication skills beyond just verbal and written abilities. In contrast, middle-income countries primarily focus on verbal and written communication (Table 3). There is a growing emphasis across high-income countries from 2019 to 2022 on analytical competencies and hands-on experience, indicating the importance of data-driven decision making and practical knowledge in managing logistics operations effectively. Leadership skills have maintained a stable demand, and effective communication, both verbal and written, has become increasingly crucial. A well-rounded working attitude (between 12.06% and 14.37%), including qualities like punctuality, responsibility, and flexibility, has gained prominence. English proficiency remains a significant requirement, highlighting the need for effective communication and collaboration skills in the logistics industry.
Table 3.
Percentage of skills in high-income countries extracted from online job postings between 2019 and 2022.
4.2. Ordinary Least Squares (OLS) Regression
4.2.1. Variable Construction
Prior research has extensively documented the relationship between human capital investments and wages. According to human capital theory, first formalized by Becker, investments in productive skills and knowledge, whether through formal education or work experience, increase individuals’ cognitive and technical capabilities, making them more valuable and productive workers [68]. This greater productivity then enables higher earning power in the labor market. Decades of empirical analysis have borne out this theory, finding evidence that additional years of schooling and experience contribute to higher wages, even when accounting for other influences [69]. Given the well-established links between education, experience, and wages, including reliable measures of worker skills and qualifications is vital for understanding labor market dynamics. Controlling human capital allows isolation of other factors’ effects, assessment of returns to schooling and tenure, and deeper investigation of relative supply and demand across demographic segments. Omitting critical proxies for productivity like education level and years of prior experience risks confounding estimates for variables of interest like gender or industry. Furthermore, comparing gaps across education brackets and career stages informs policy targeting and organizational strategy geared toward addressing labor force needs. Thus, per the cumulative weight of prior literature and for a sound analytical approach, our wage regression models incorporate years of education and experience as crucial explanatory factors driving wage outcomes (Table 4).
Table 4.
Summary statistics.
The basic trends in wage differences based on age and education have been acknowledged since at least the early 1950s [69]. A simple static model based on Becker’s study can clarify many conceptual issues involved in interpreting recent research on the returns to education. This model suggests that each individual faces a market opportunity curve that shows the earnings associated with different schooling choices. The static model focuses on the relationship between completed education and average wages, ignoring the dynamic nature of education and earnings. This focus is appropriate if individuals complete their formal education before entering the workforce (except for casual or part-time work) and if, as assumed in the traditional human capital earnings model, the effect of education on log wages is separate from the effect of experience. Young people often switch between full- or part-time schooling and employment, making the school-to-work transition complex. However, most individuals have completed their formal education by their mid-20s.
4.2.2. Baseline Results
Table 5 shows that on average the real wage in the logistics industry in 2022 increased by 0.453% compared to 2019. Seniors were paid 0.662% more than juniors in the research countries and regions, but who got Master degree were paid lower in 0.185%. The employees who were senior and obtained a Master degree earned more than their counterparts who were junior and had no Master degree in the 4-year period. Table 5 also shows a massive gap in the wage level between developing countries’ logistic labor (excluding China, the biggest developing country in this research) and developed countries.
Table 5.
Baseline result for the causal effects of education and experience on real wage.
Table 6 examines the gap between developing countries’ wage levels and those of developed countries. It looks at the impacts of the business cycle, regional/country-level policy variation, and the combination of education level and working experience on real wages. It also shows that those with a master’s in the logistics industry were paid a lower wage than those with a bachelor’s, while seniors earned a higher wage than juniors, which is consistent with the results from Table 5. However, the coefficient of education and log real wage is not significant enough to validate it. This leads to the conclusion that educational level is not the essential factor influencing the real wage but experience in the logistics industry. Other surveyed countries, except for the US, possess lower wage rates than Australia.
Table 6.
Further estimation results for the causal effects of education and experience on real wage.
The results in Table 6 also confirms the result of Table 5 that seniors were paid more than the real wage of juniors. Obtaining Master degree does not ensure the higher income. Insignificant resuls are shown for seniors who got Master degree. The average predicted real wage of our researched regions and countries is USD 1628 per month (predicted value for log real wage equals 2.79).
4.3. Kernel Density Estimation Using Data from Search Tools
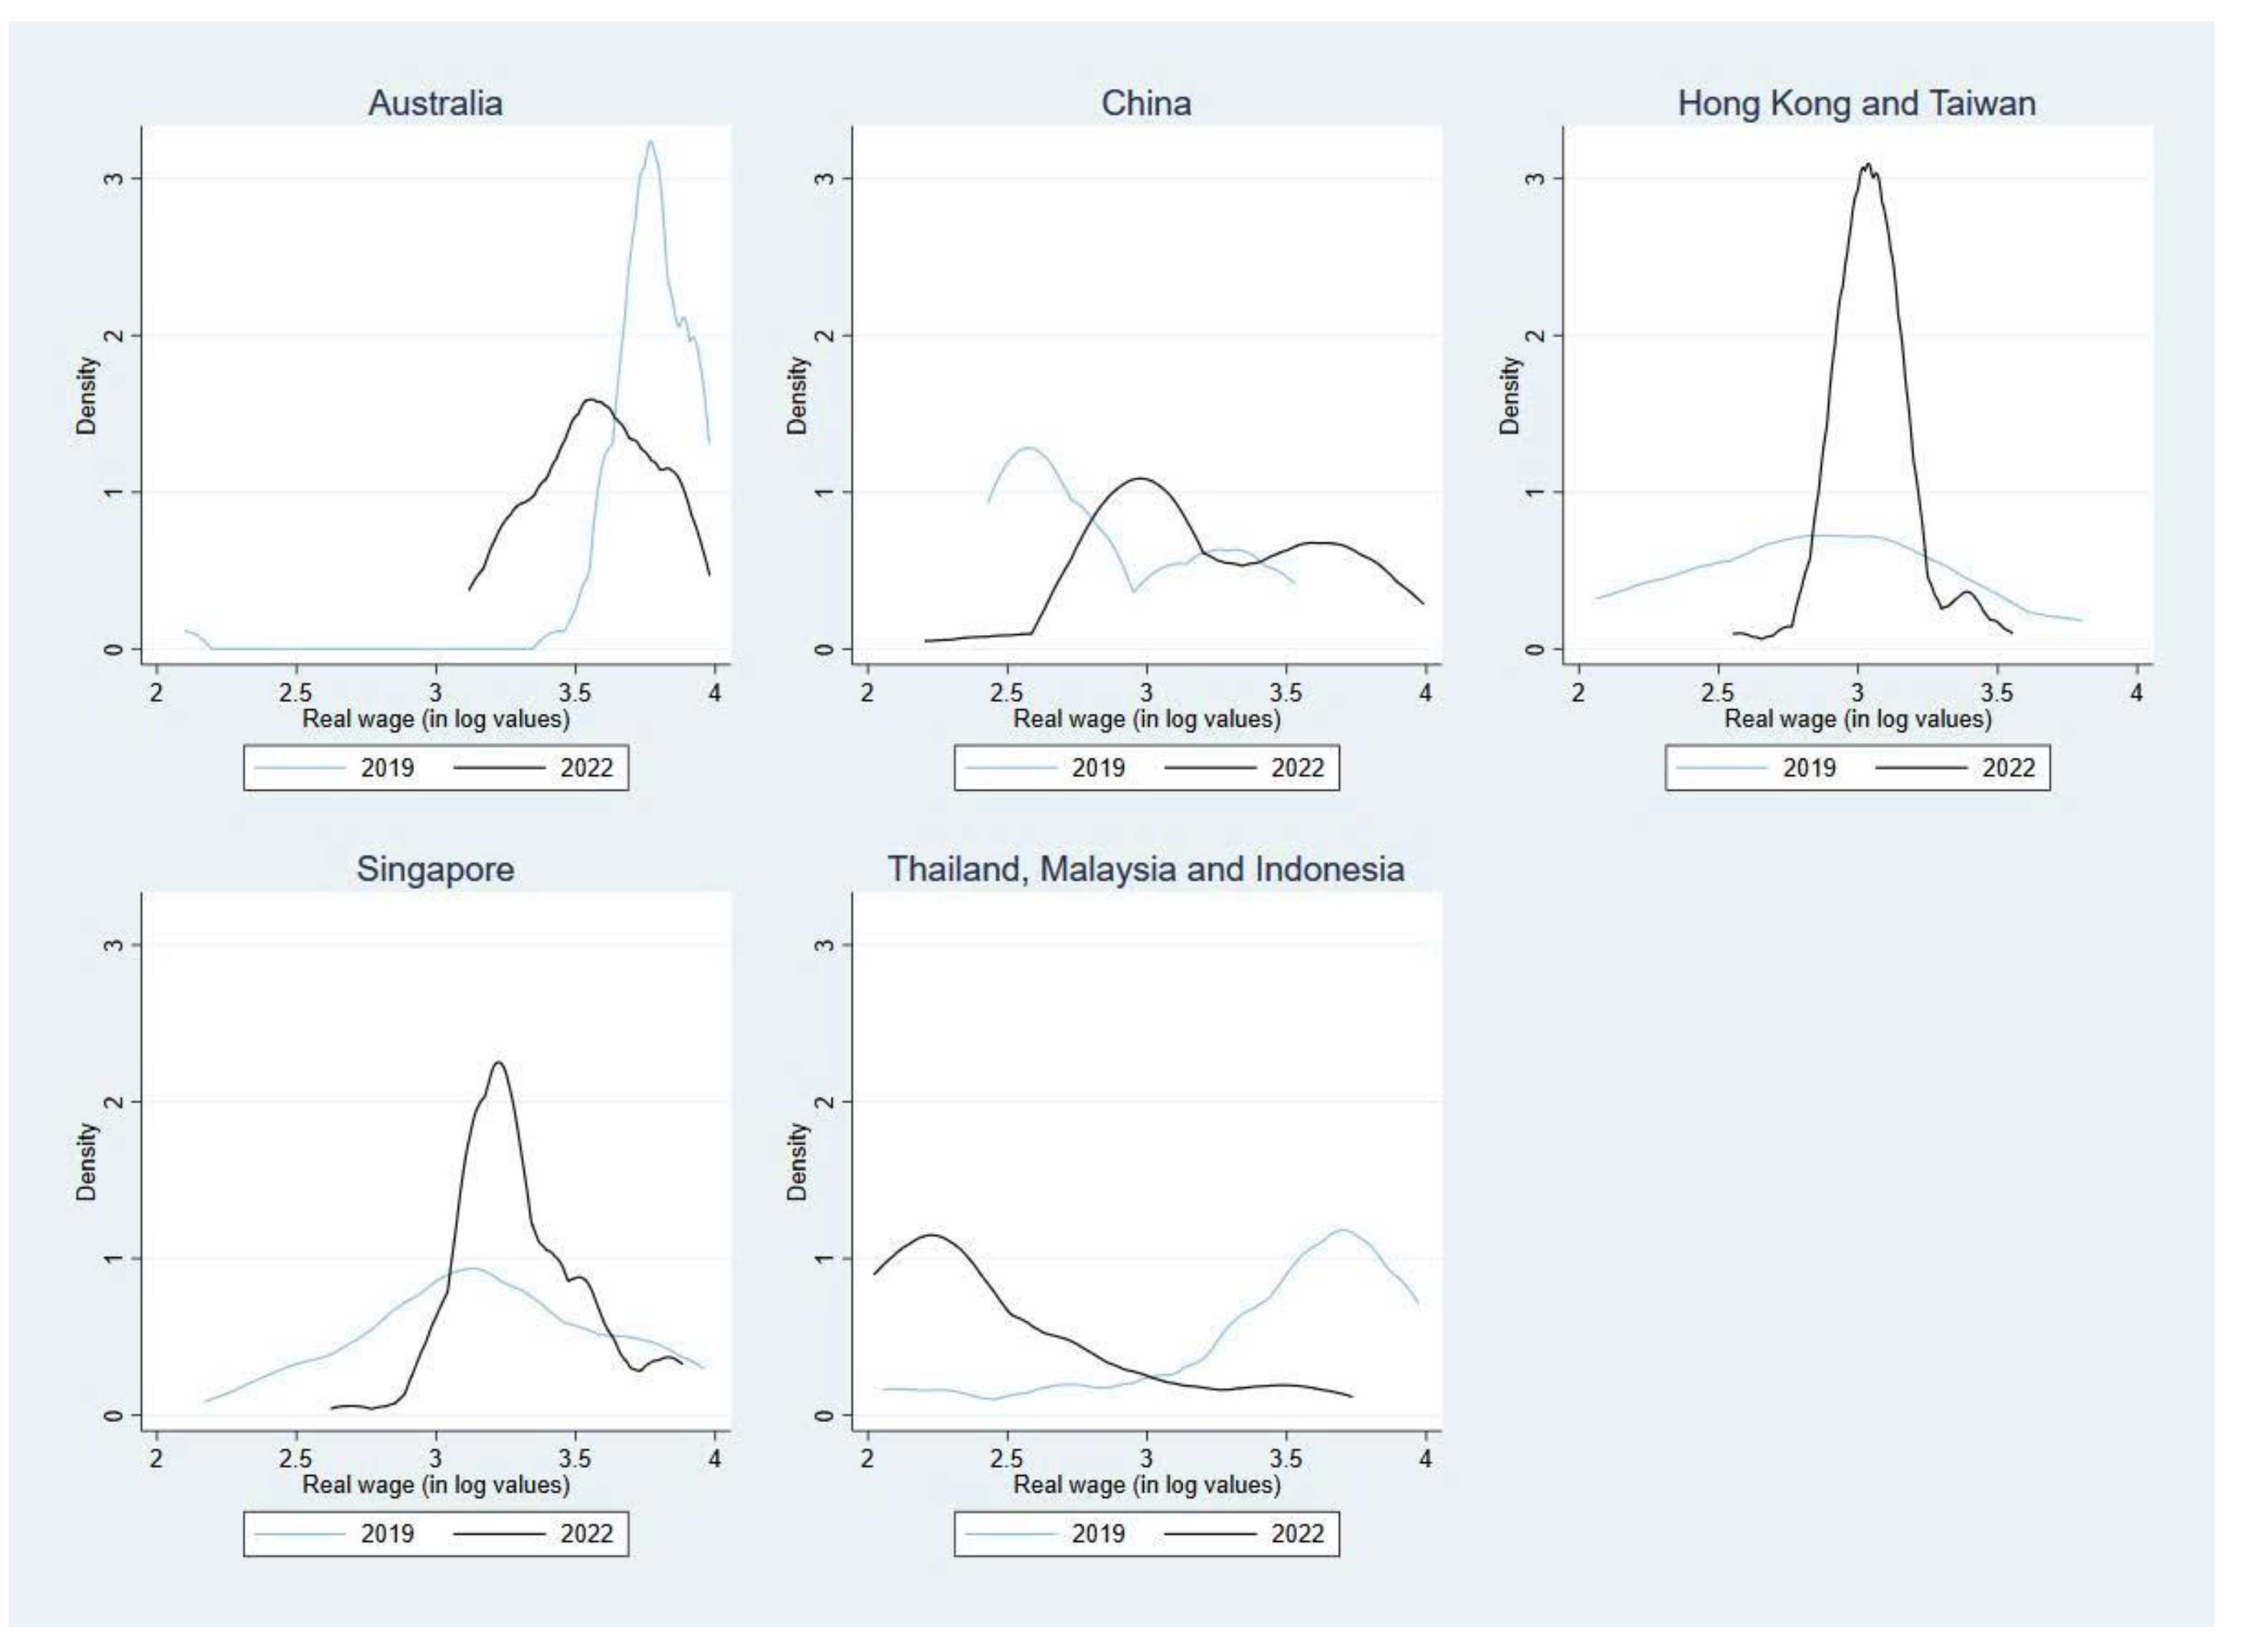
Kernel density estimation shows a more accurate distribution of the real wages between the year 2019 and the year 2022. Figure 1 shows how the wage range contributes to how much the average real wage of logistics jobs in Asian countries changes yearly (data in 2019, 2022).

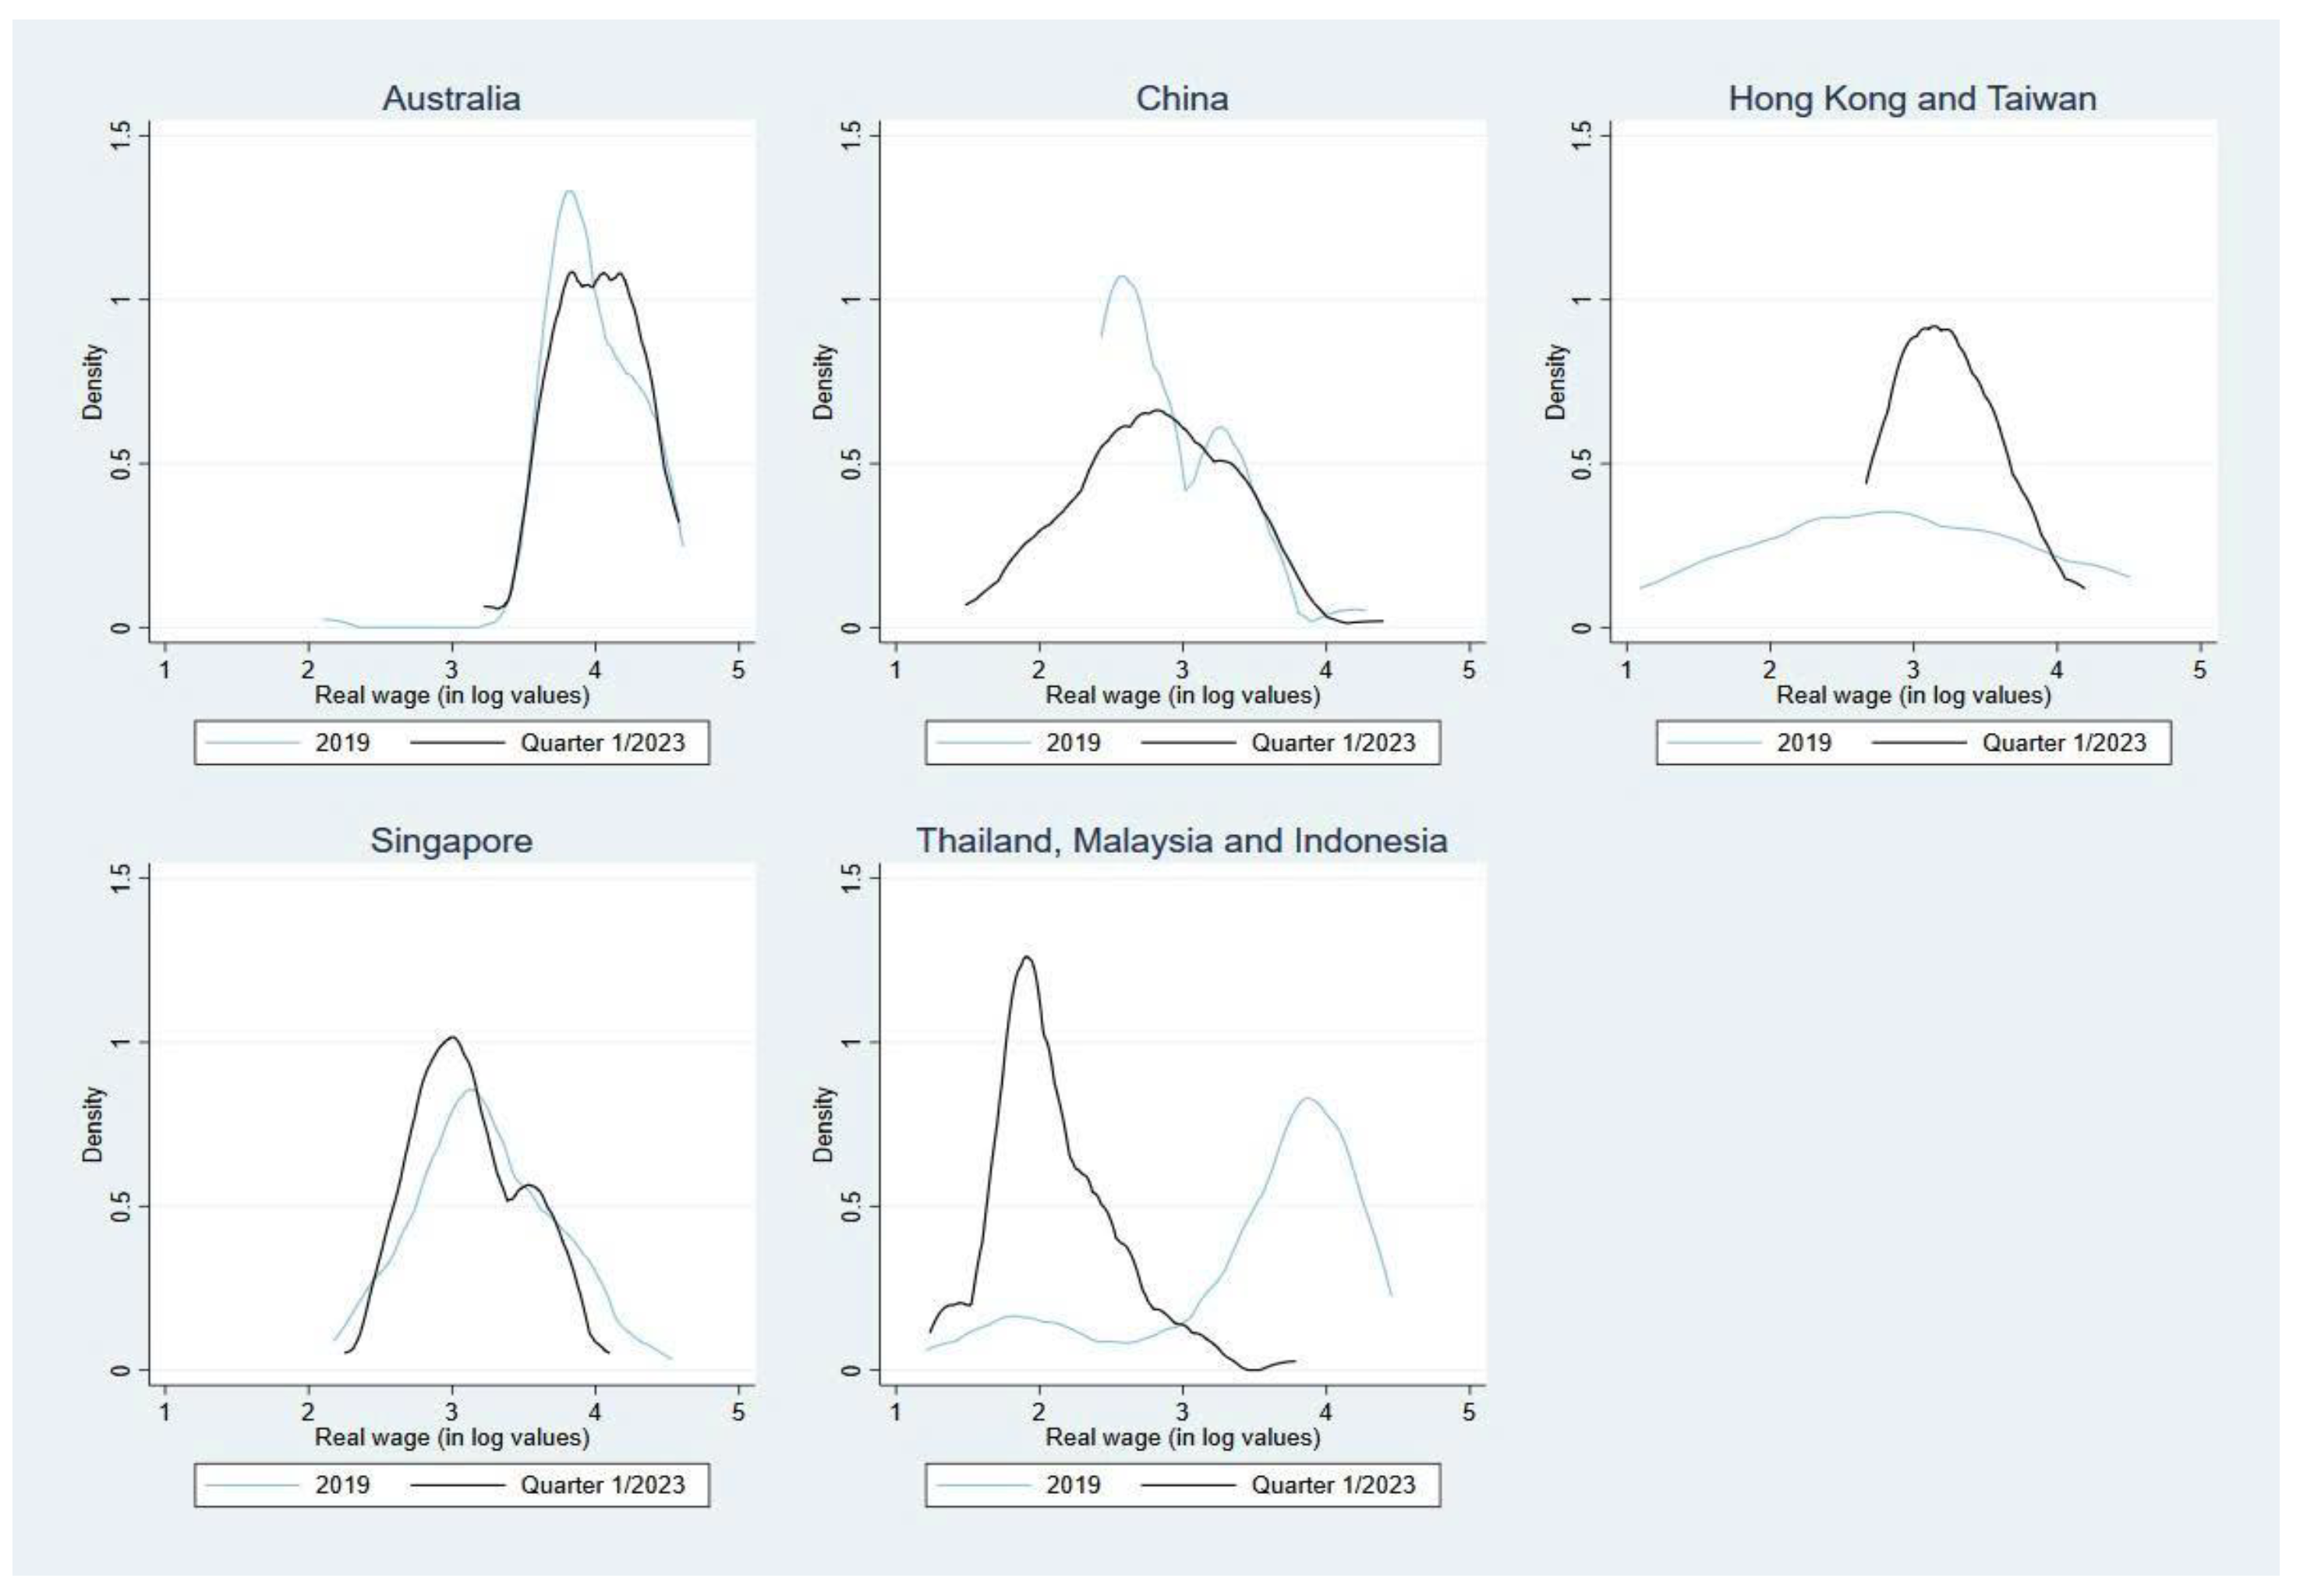
Figure 1.
Kernel Density Estimation of Asia Pacific in 2019 and 2022. Source: Authors’ calculation using data collected from online job postings.
In Hong Kong, Taiwan, and Singapore, the cost of labor in logistics jobs has moved to the central point, which indicates the consistent labor force cost for logistics jobs. It is more likely for an employee working in this field to be paid in the average wage range than they used to be in the past. It could result from higher-level logistic jobs offered due to Singapore’s globalization or some regulations that raise Singapore’s income. China’s density and natural wage curve of logistics jobs moves to the right while keeping the same shape from 2019. Thailand, Malaysia, and the Philippines show the opposite trend, with the probability of earning a lower income than the average level becoming as high as achieving a high income in 2021.
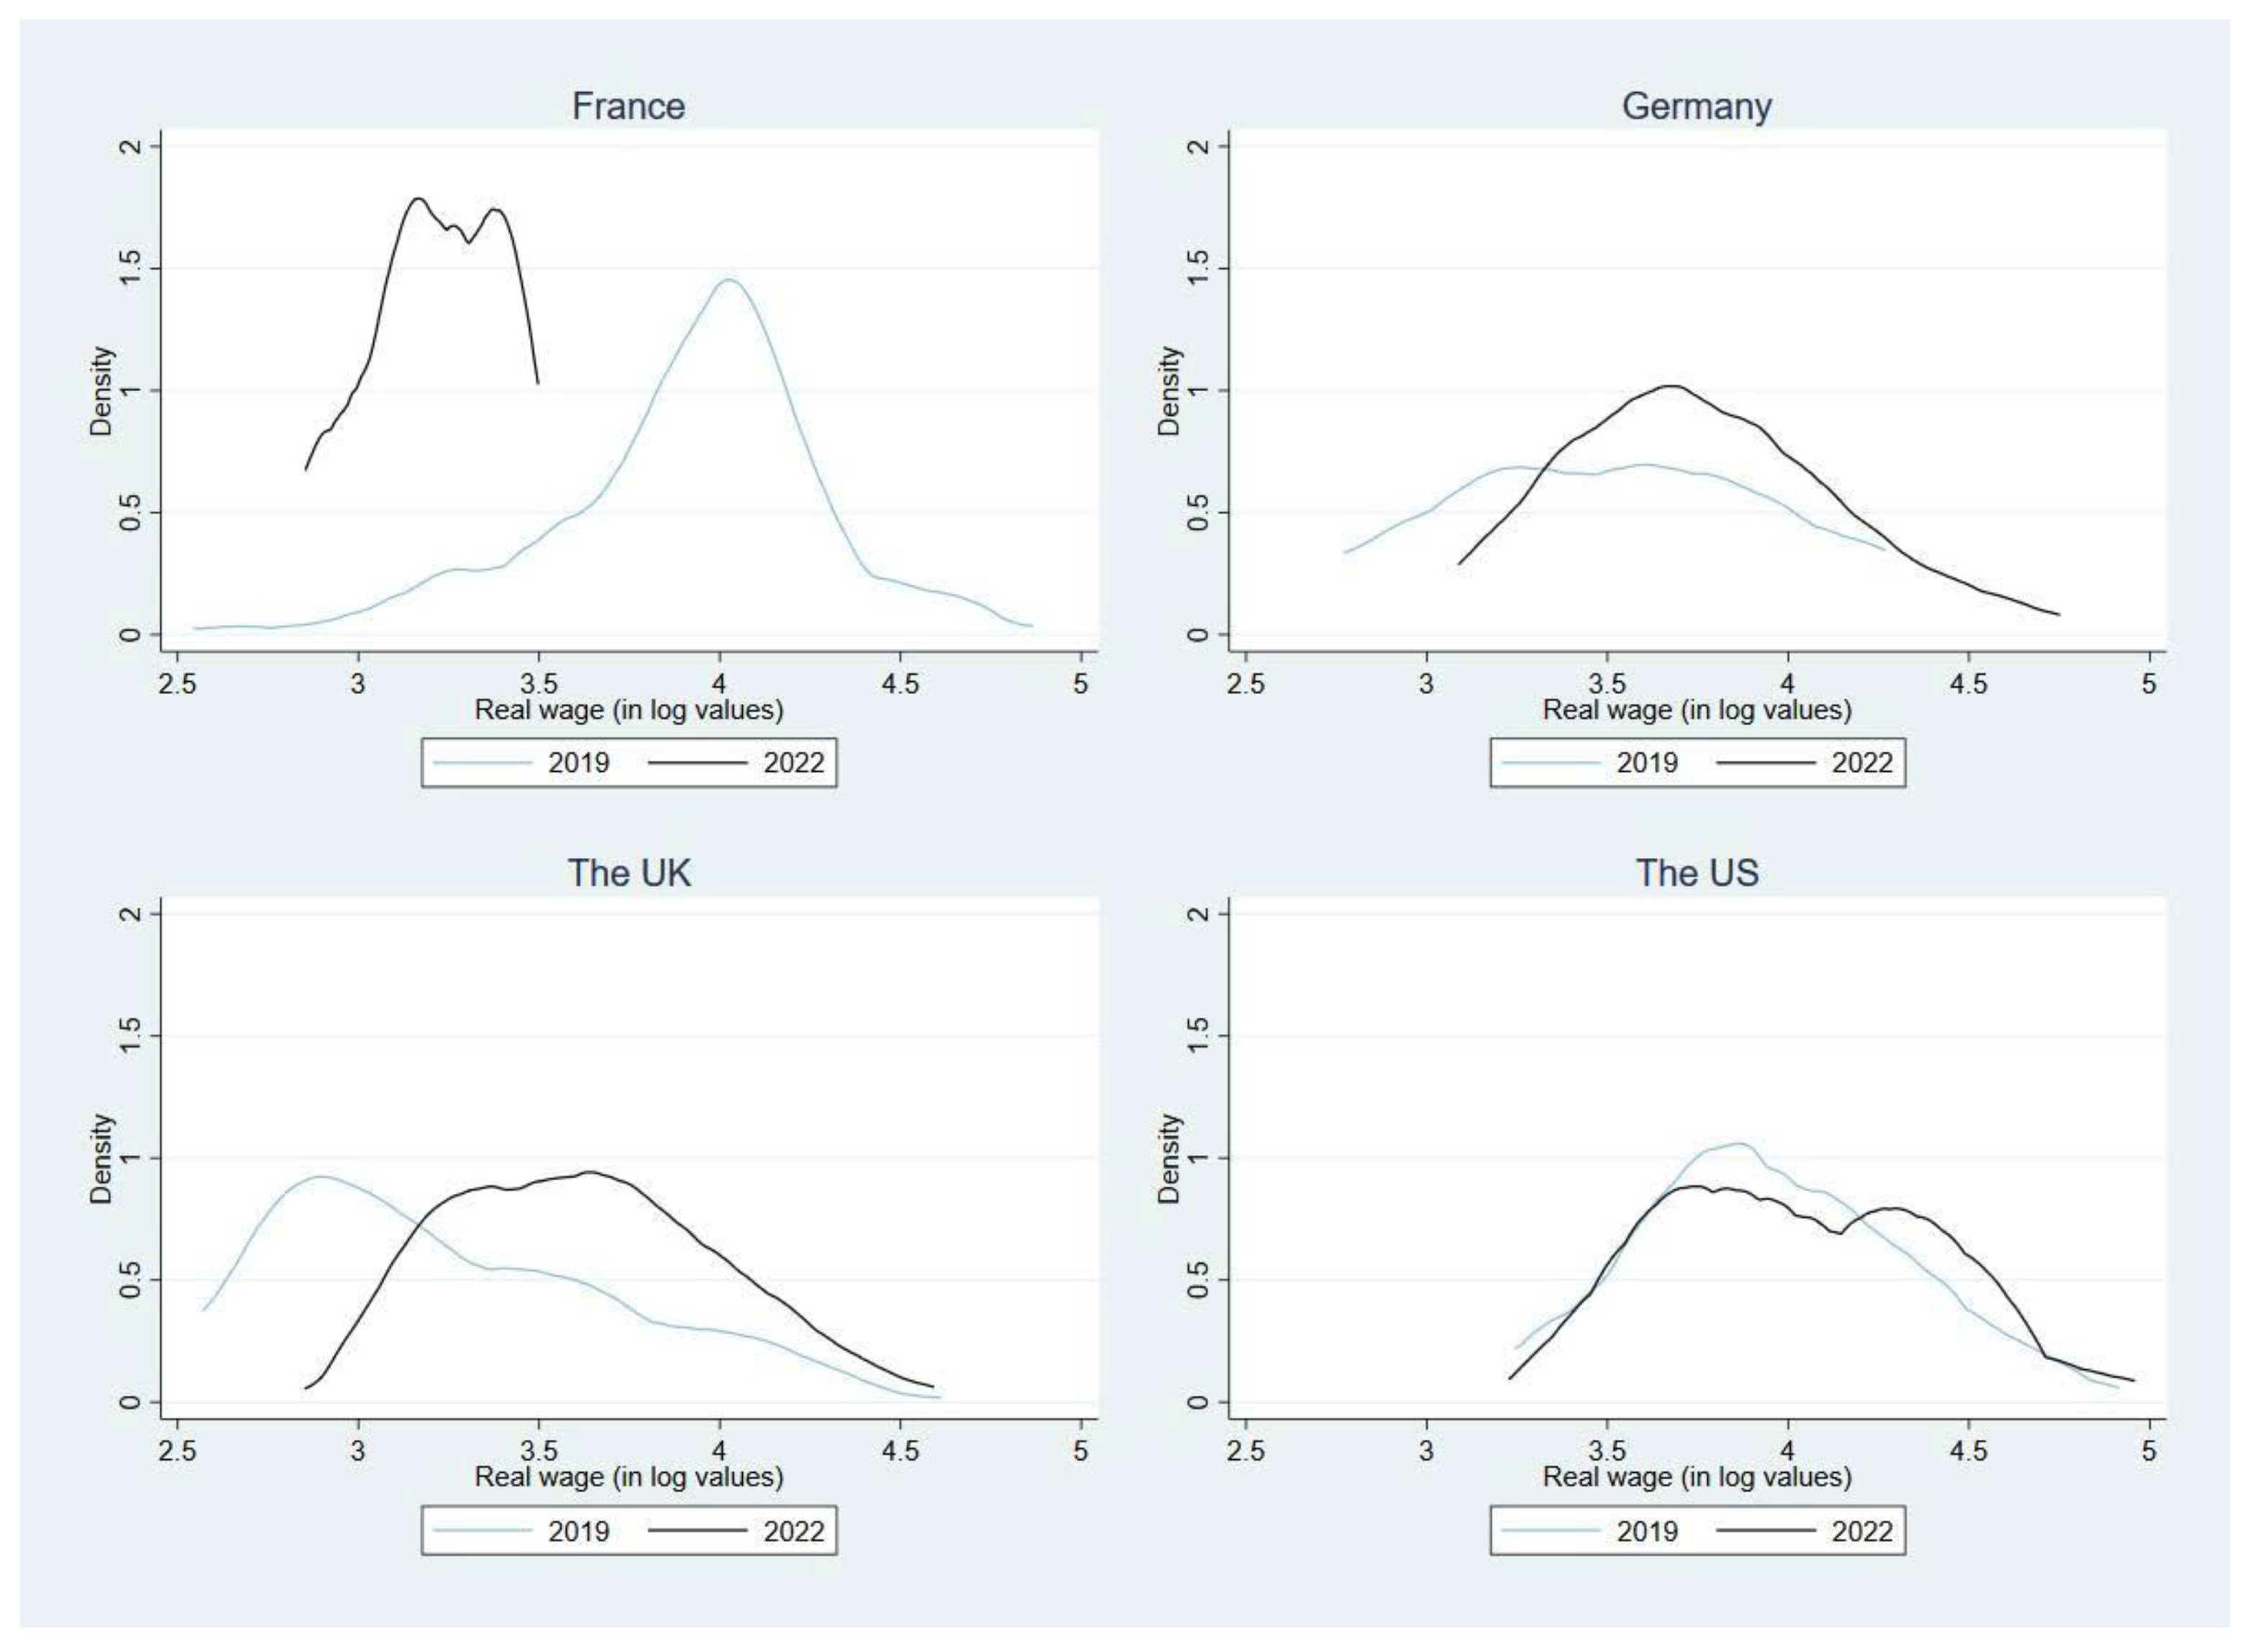
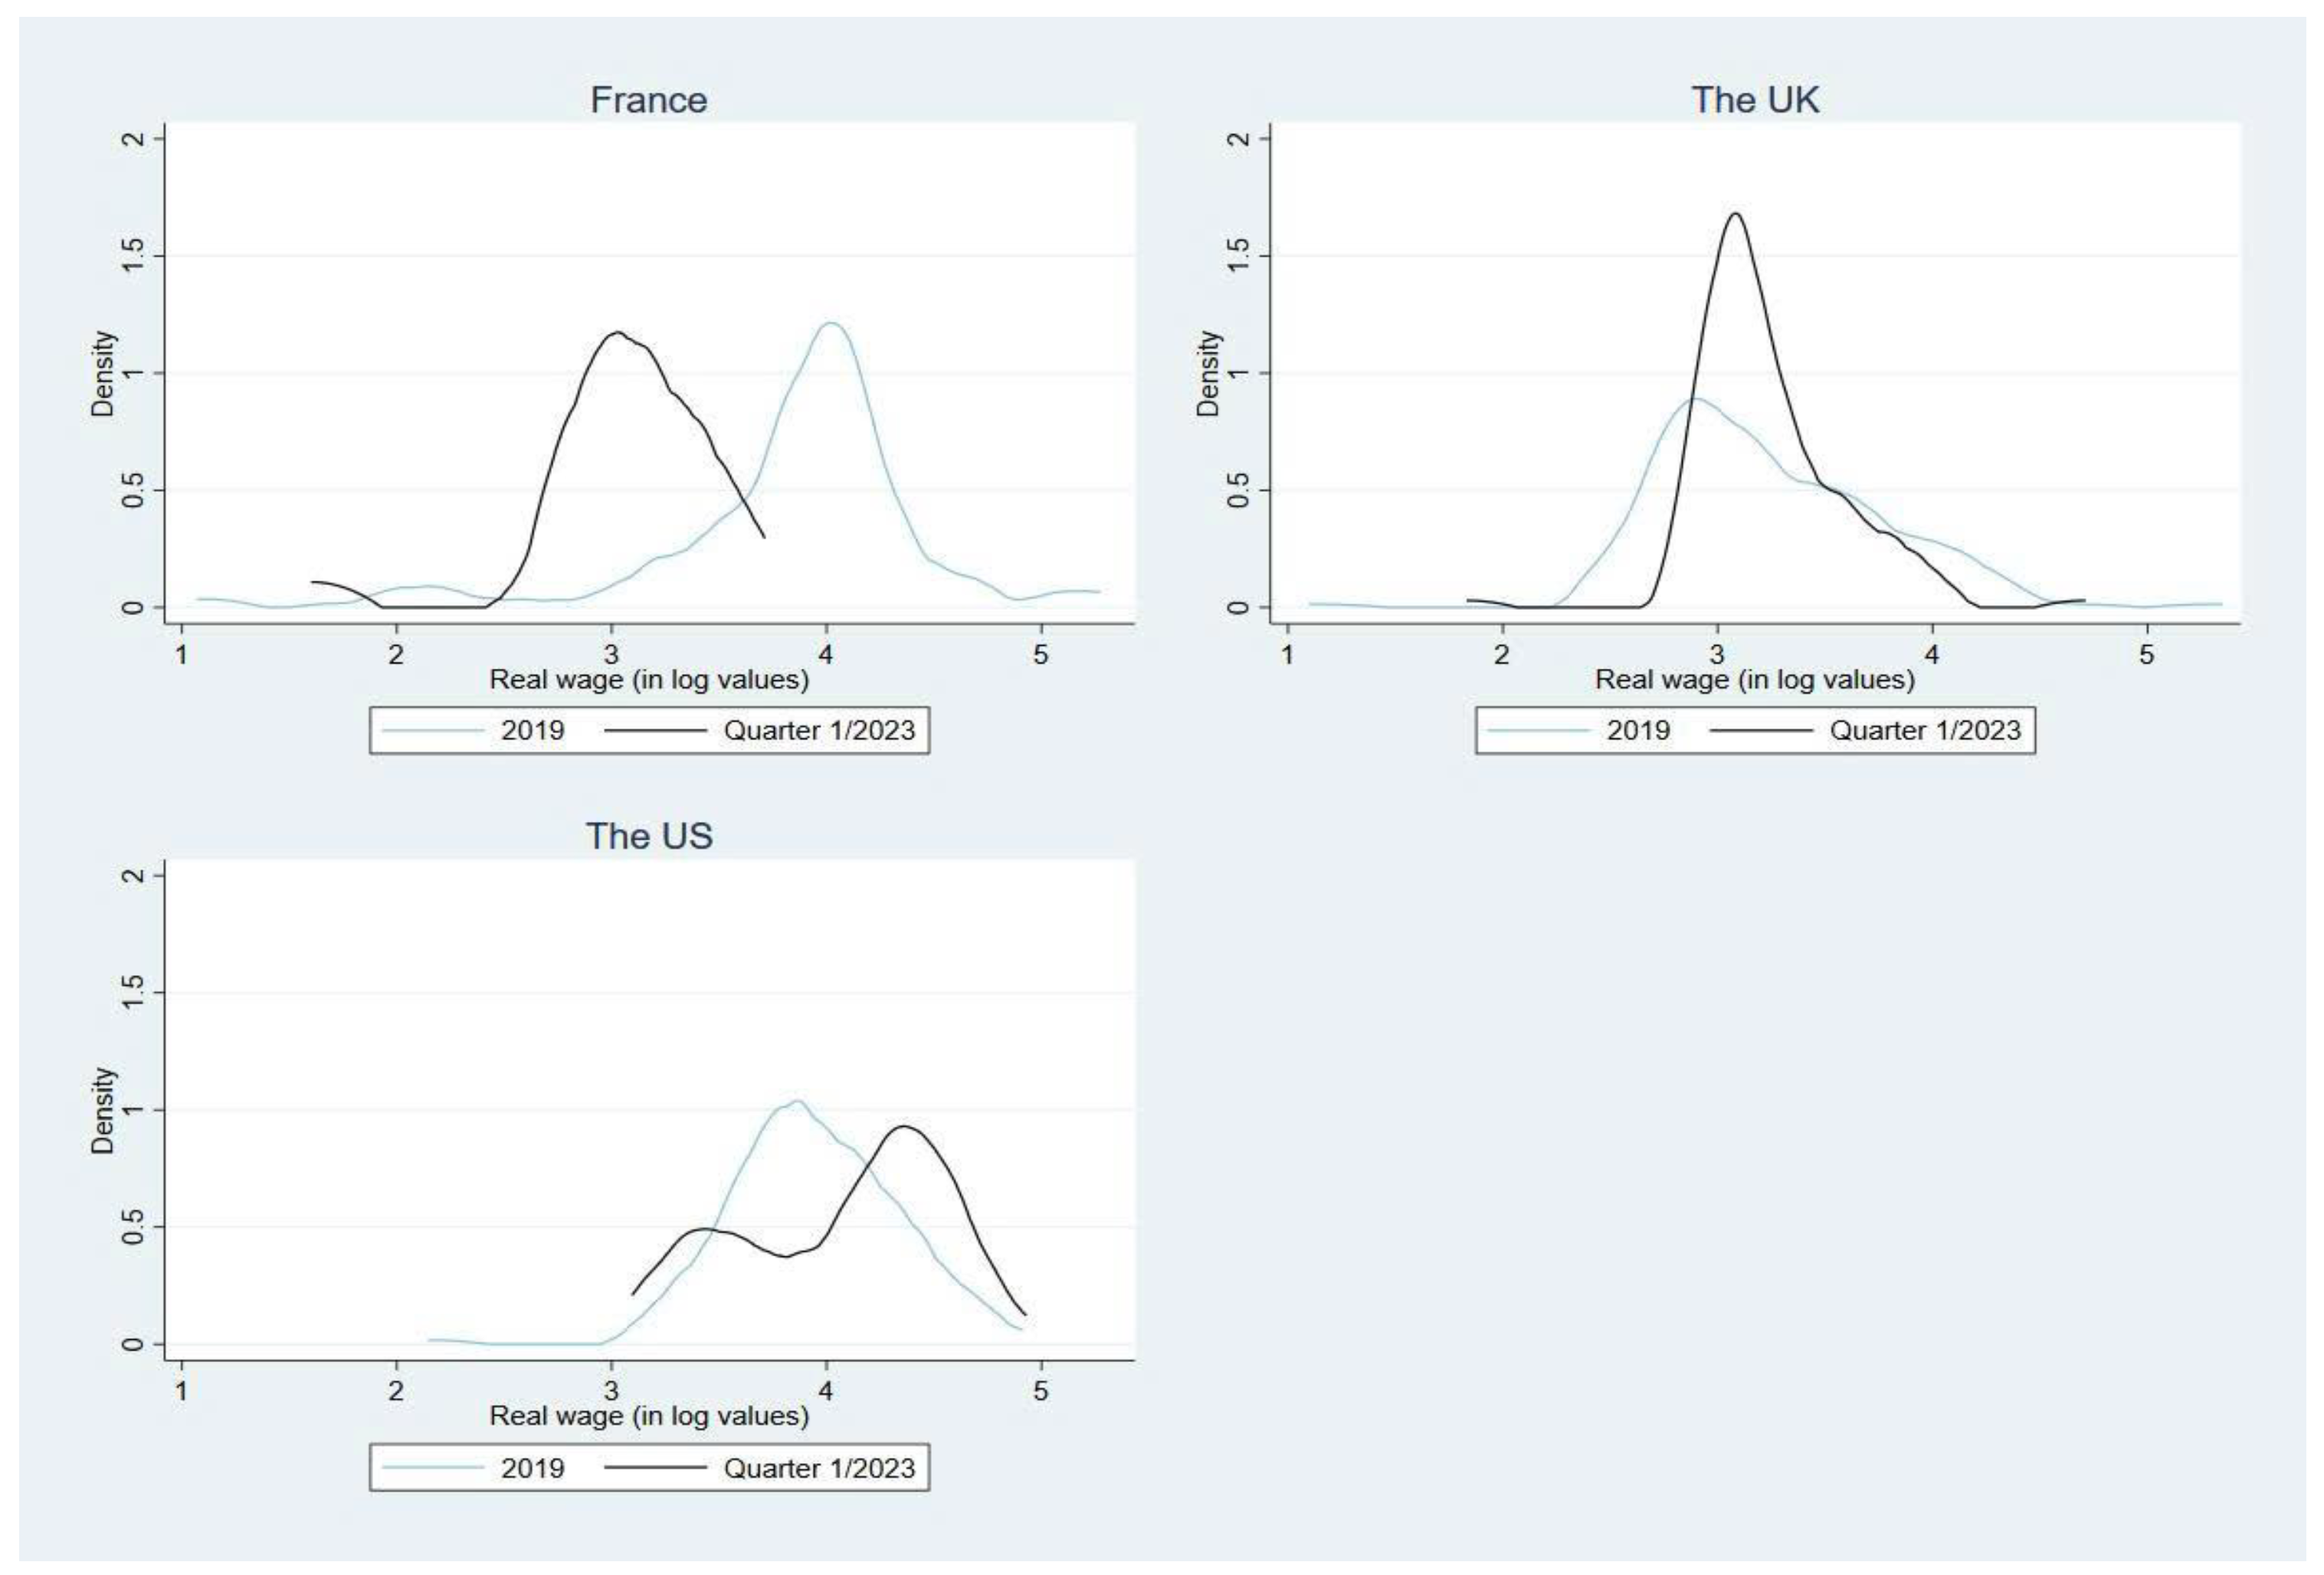
Figure 2 illustrates that the most prominent wage distribution trends during the period were slight wage amount and density increases, except in France. Germany’s real wage increased from 3.1 log values to 4.75 log values and the UK’s real wage increased from 2.75 to 3.8 log values, while that of the US remained nearly the same. France’s data generated a new curve, showing a different picture of the industry.
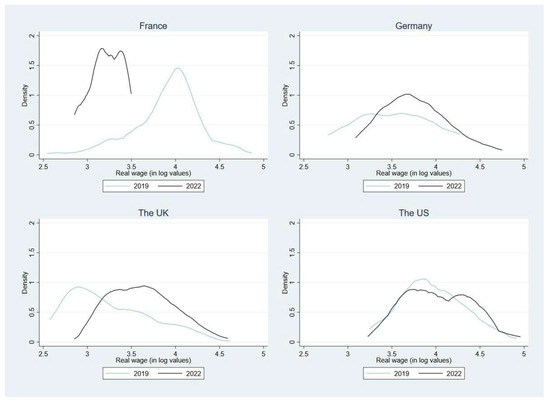
Figure 2.
Kernel Density Estimation of European countries, UK, and US in 2019 and 2022. Source: Authors’ calculation using data collected from online job postings.
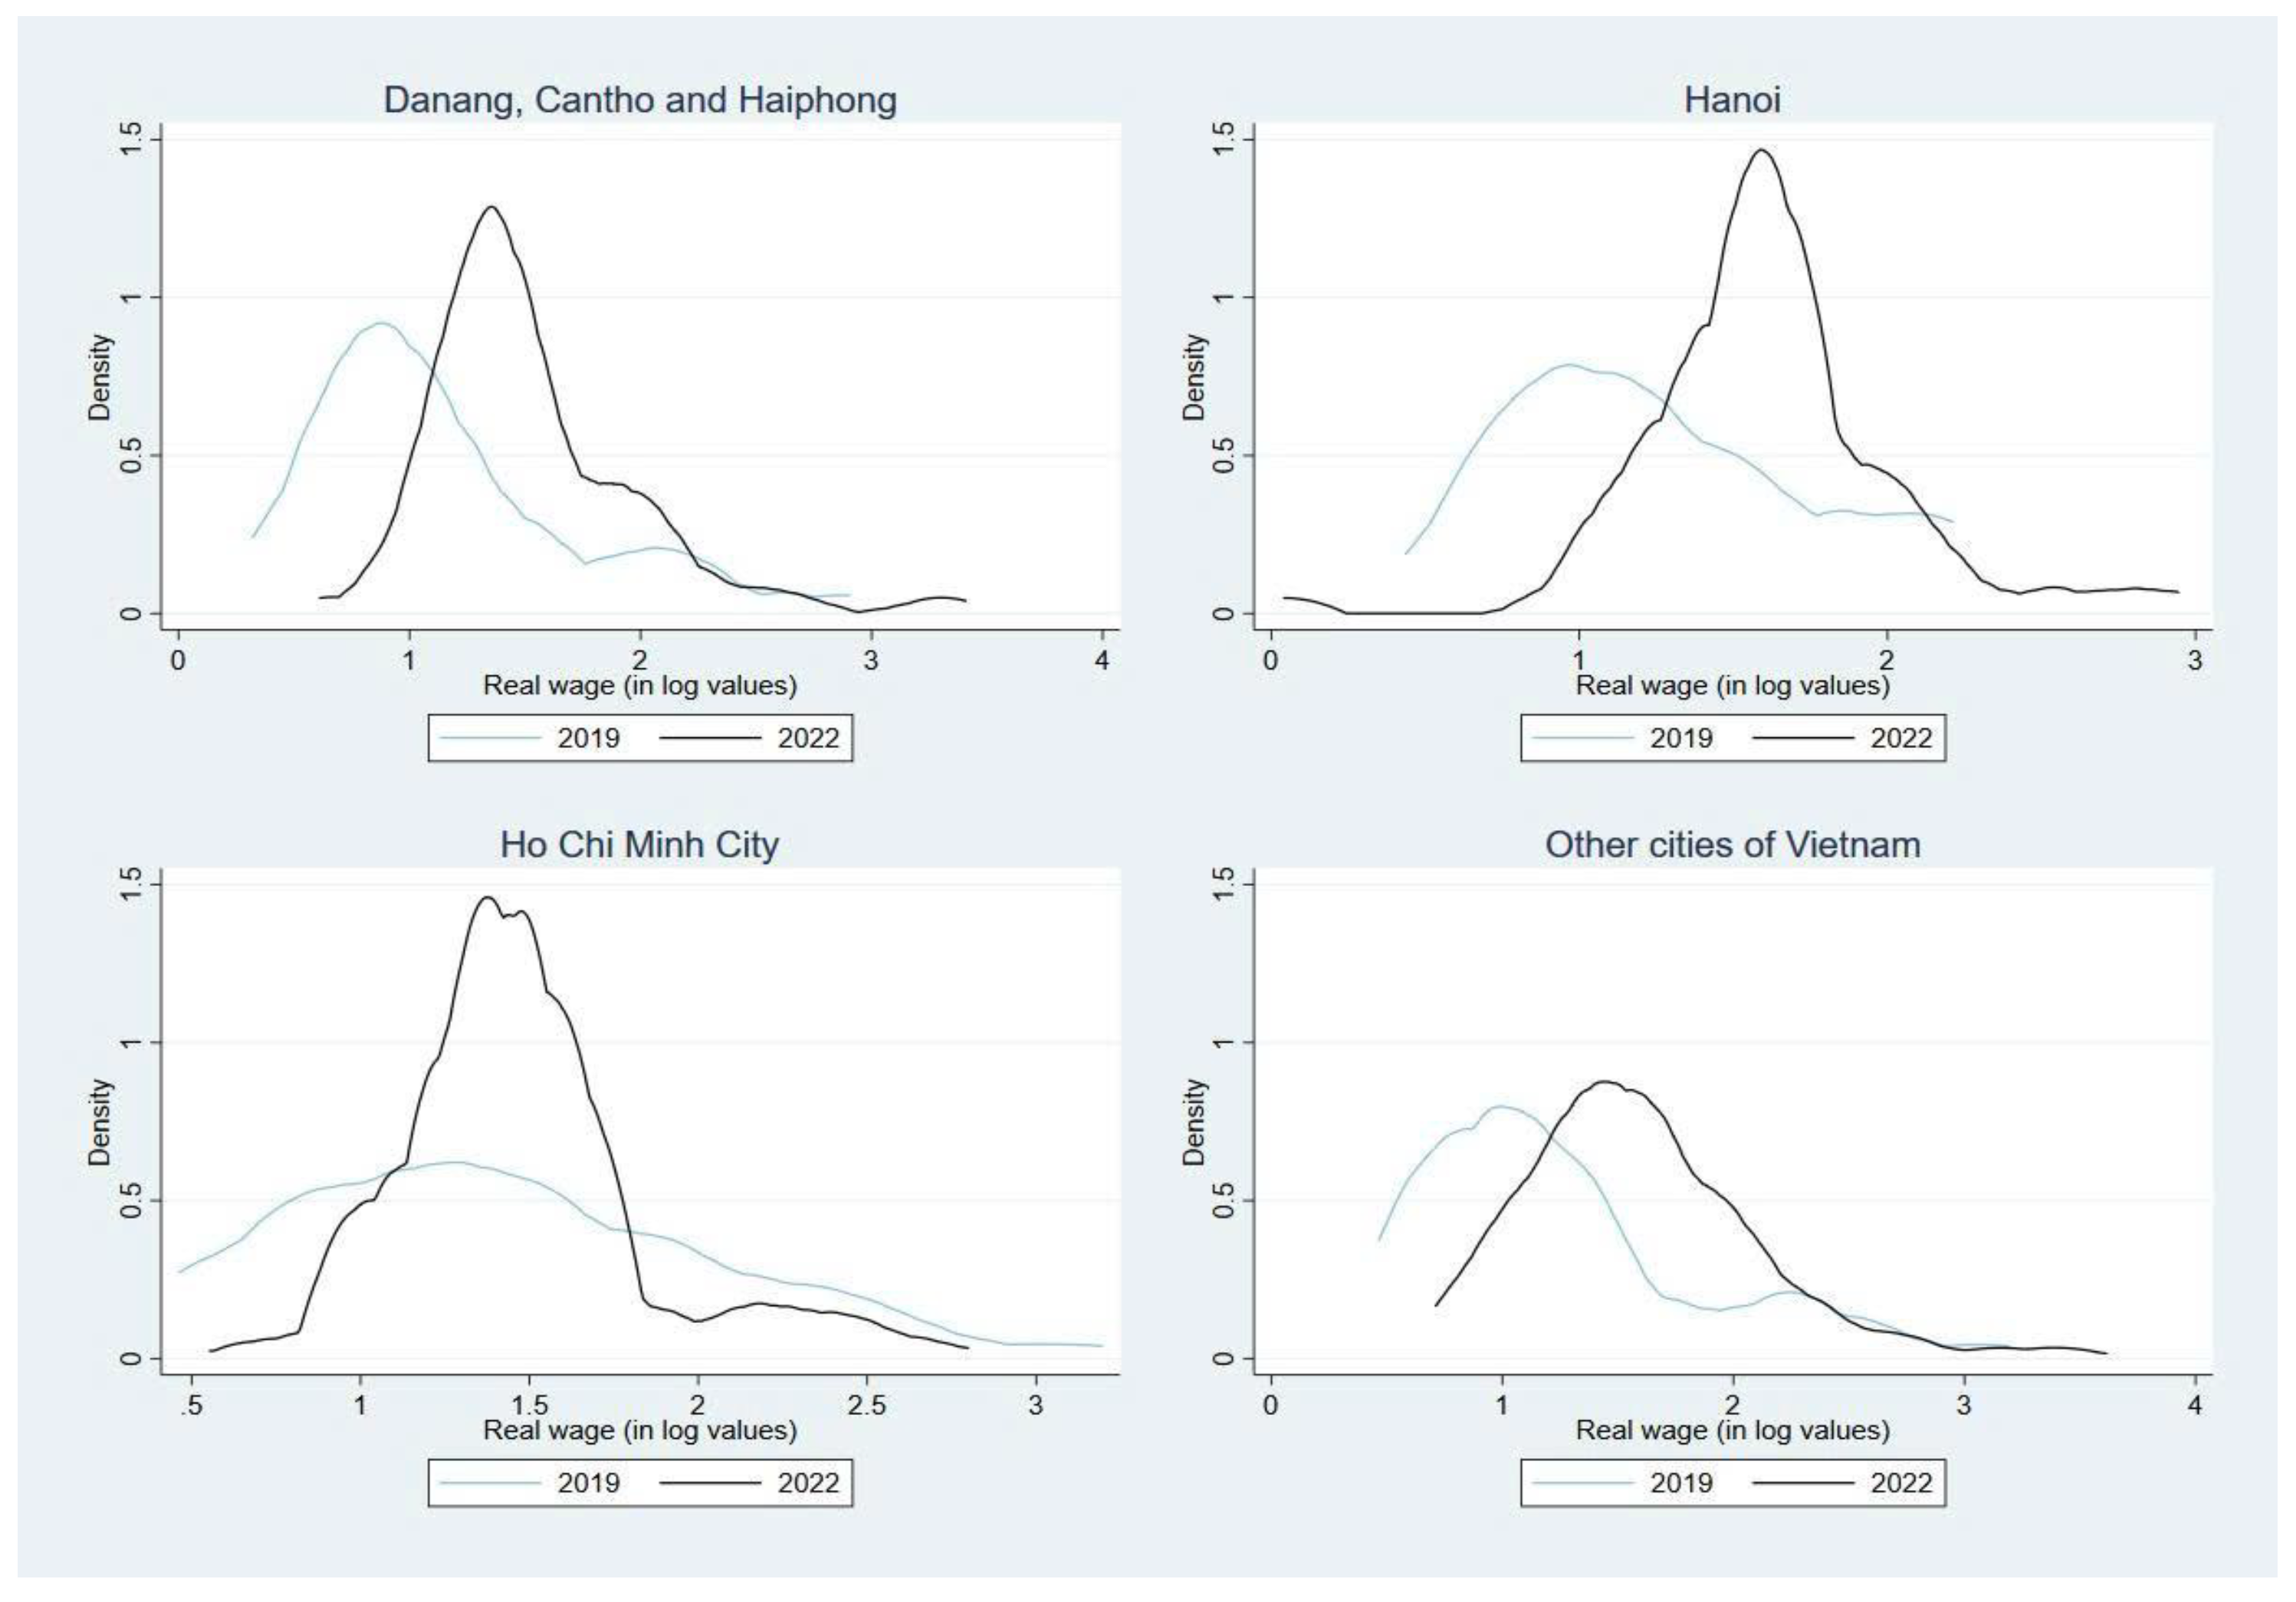
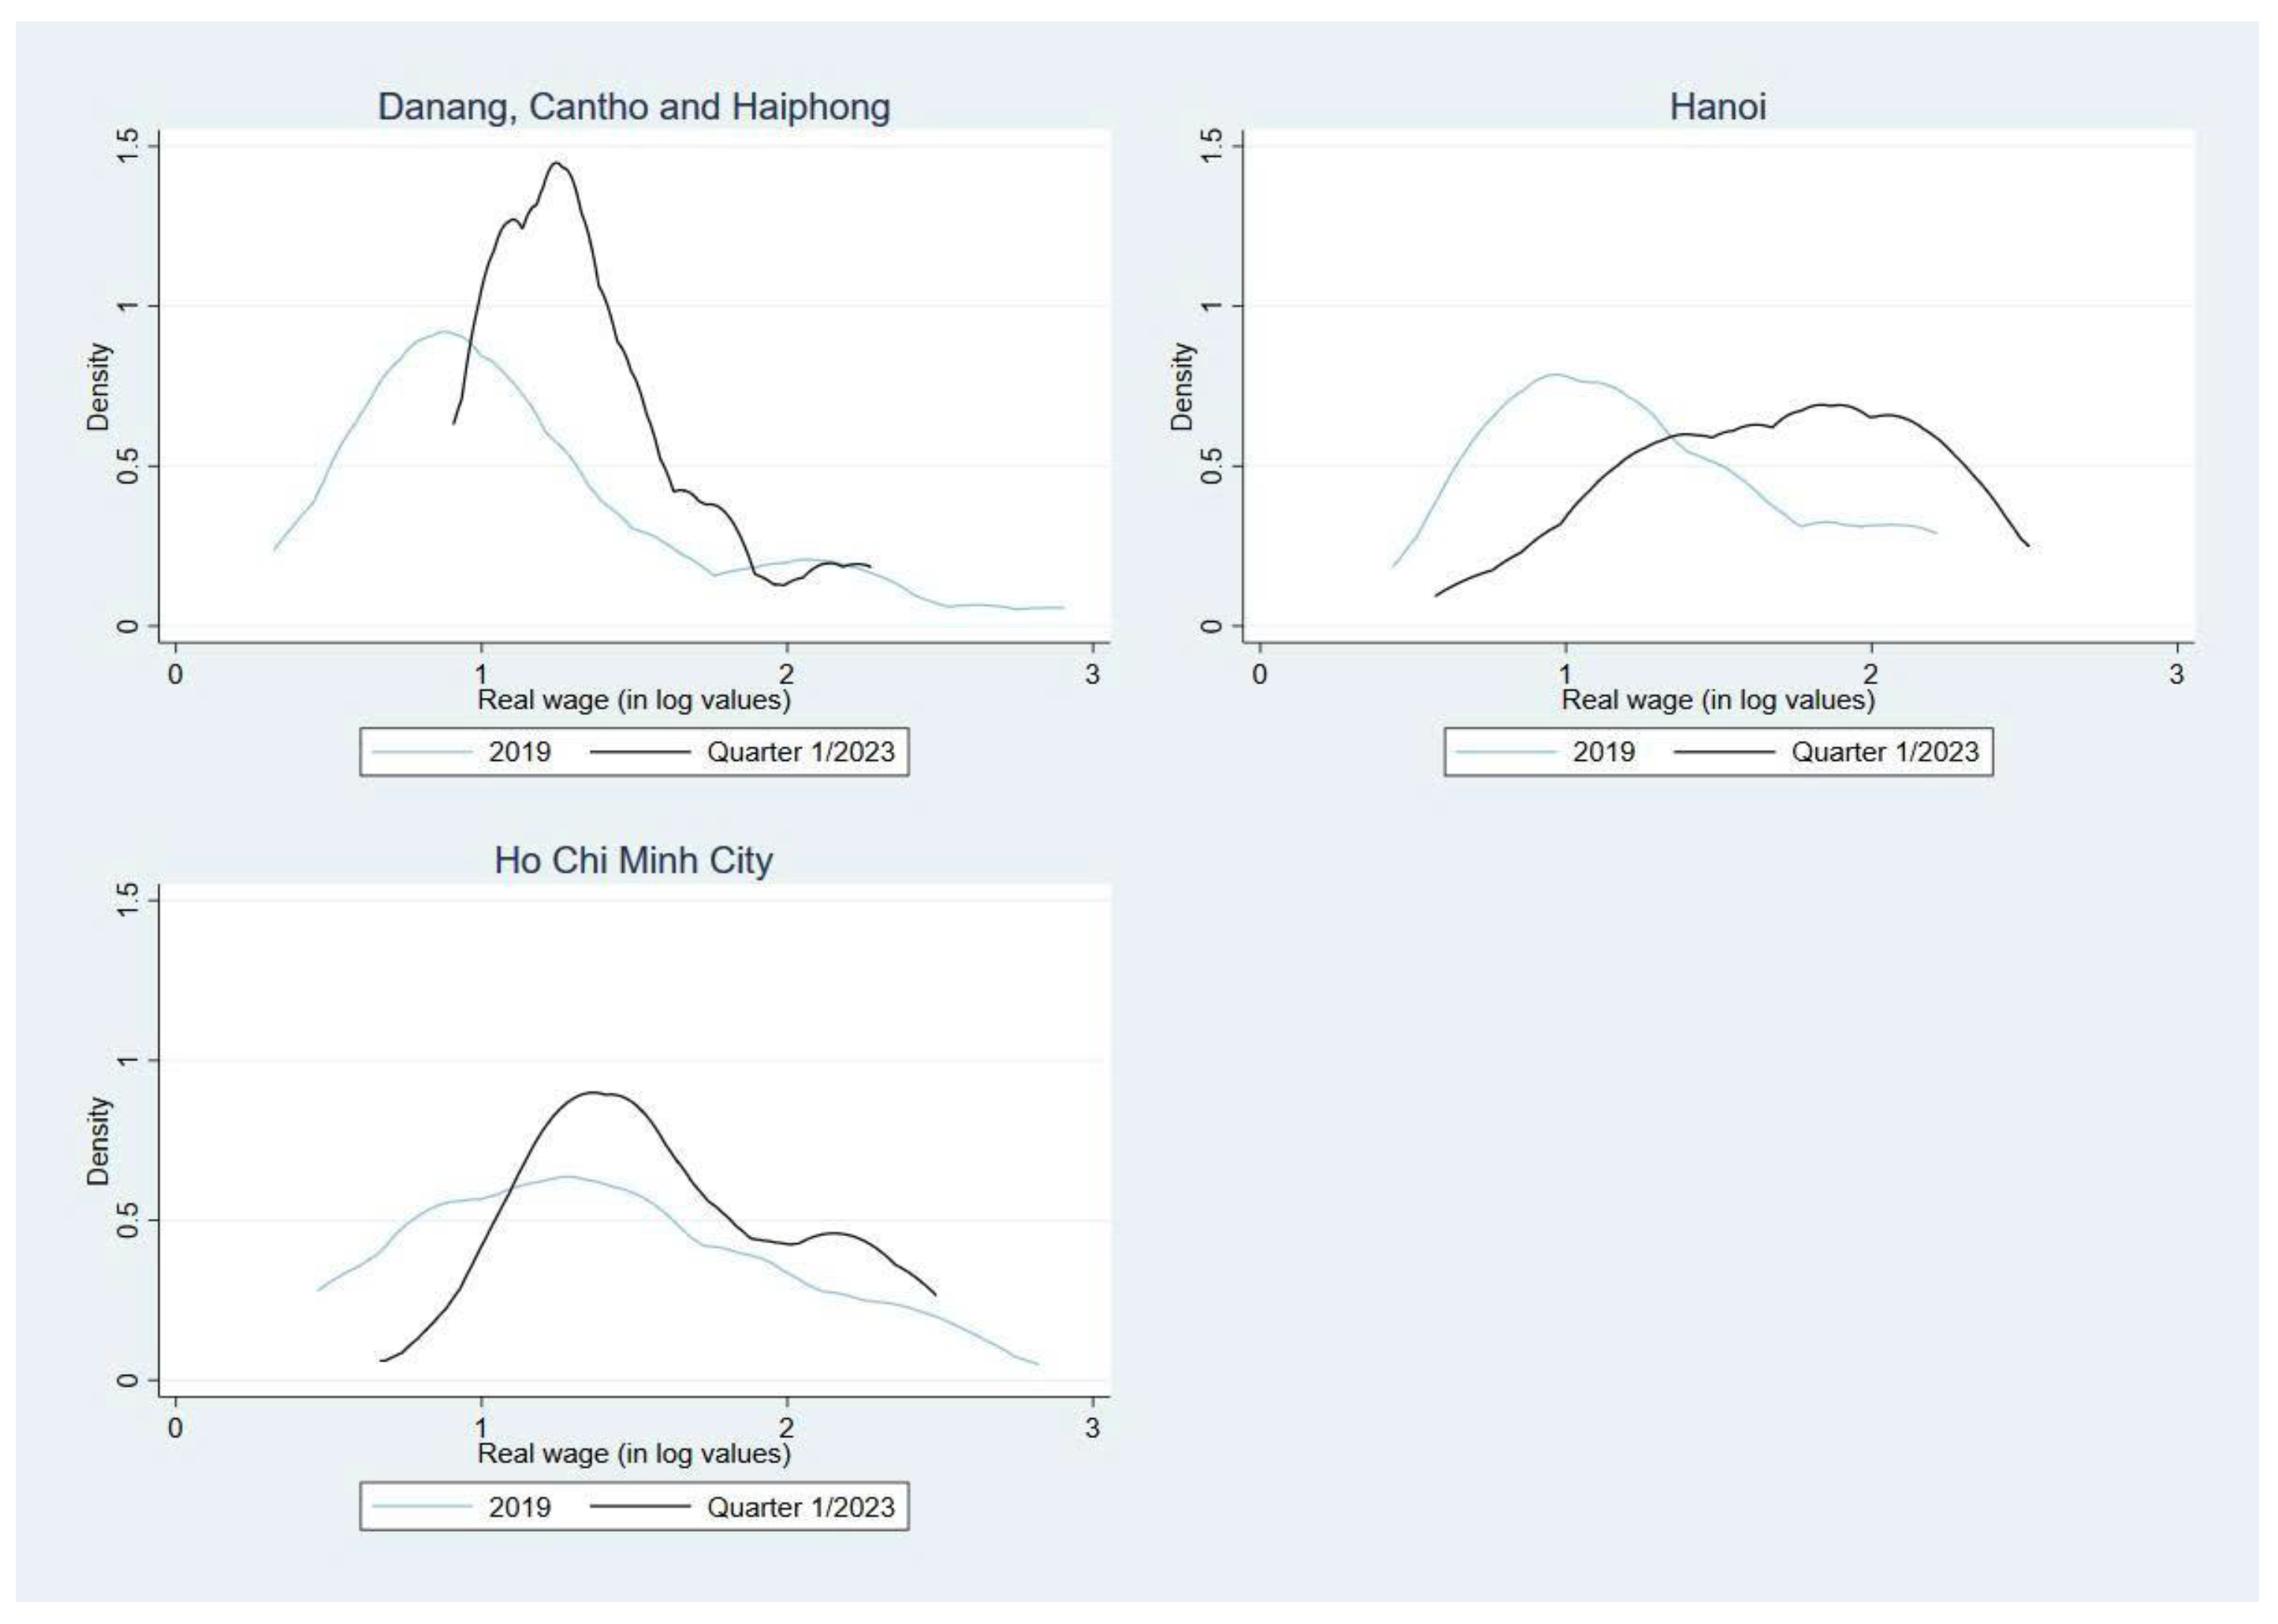
According to Figure 3, the logistic wage range in Vietnam has seen significant changes in the past few years, particularly in port-owning and developing cities such as Danang, Cantho, Haiphong, Hanoi, and Ho Chi Minh City. This is a good sign of a developing country and the industry, as the wage paid at the density of around 1.5 points increased from 0.8 to 1.5 log values in Danang, Cantho, and Haiphong, from 1 to 1.75 log values in Hanoi, and from 1 to 1.5 log values in other cities of Vietnam. Ho Chi Minh City data showed a different trend, with more employees being paid at 1.4–1.5 log values in 2022 than in 2019.
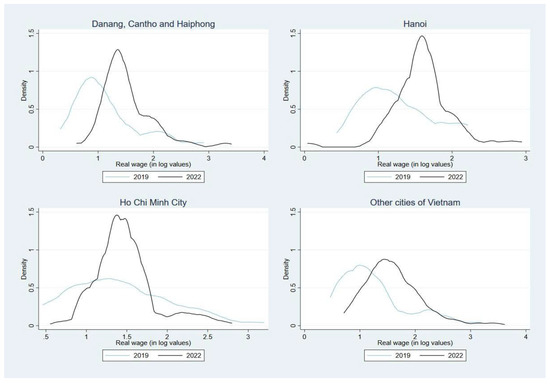
Figure 3.
Kernel Density Estimation of Vietnam in 2019 and 2022. Source: Authors’ calculation using data collected from online job postings.
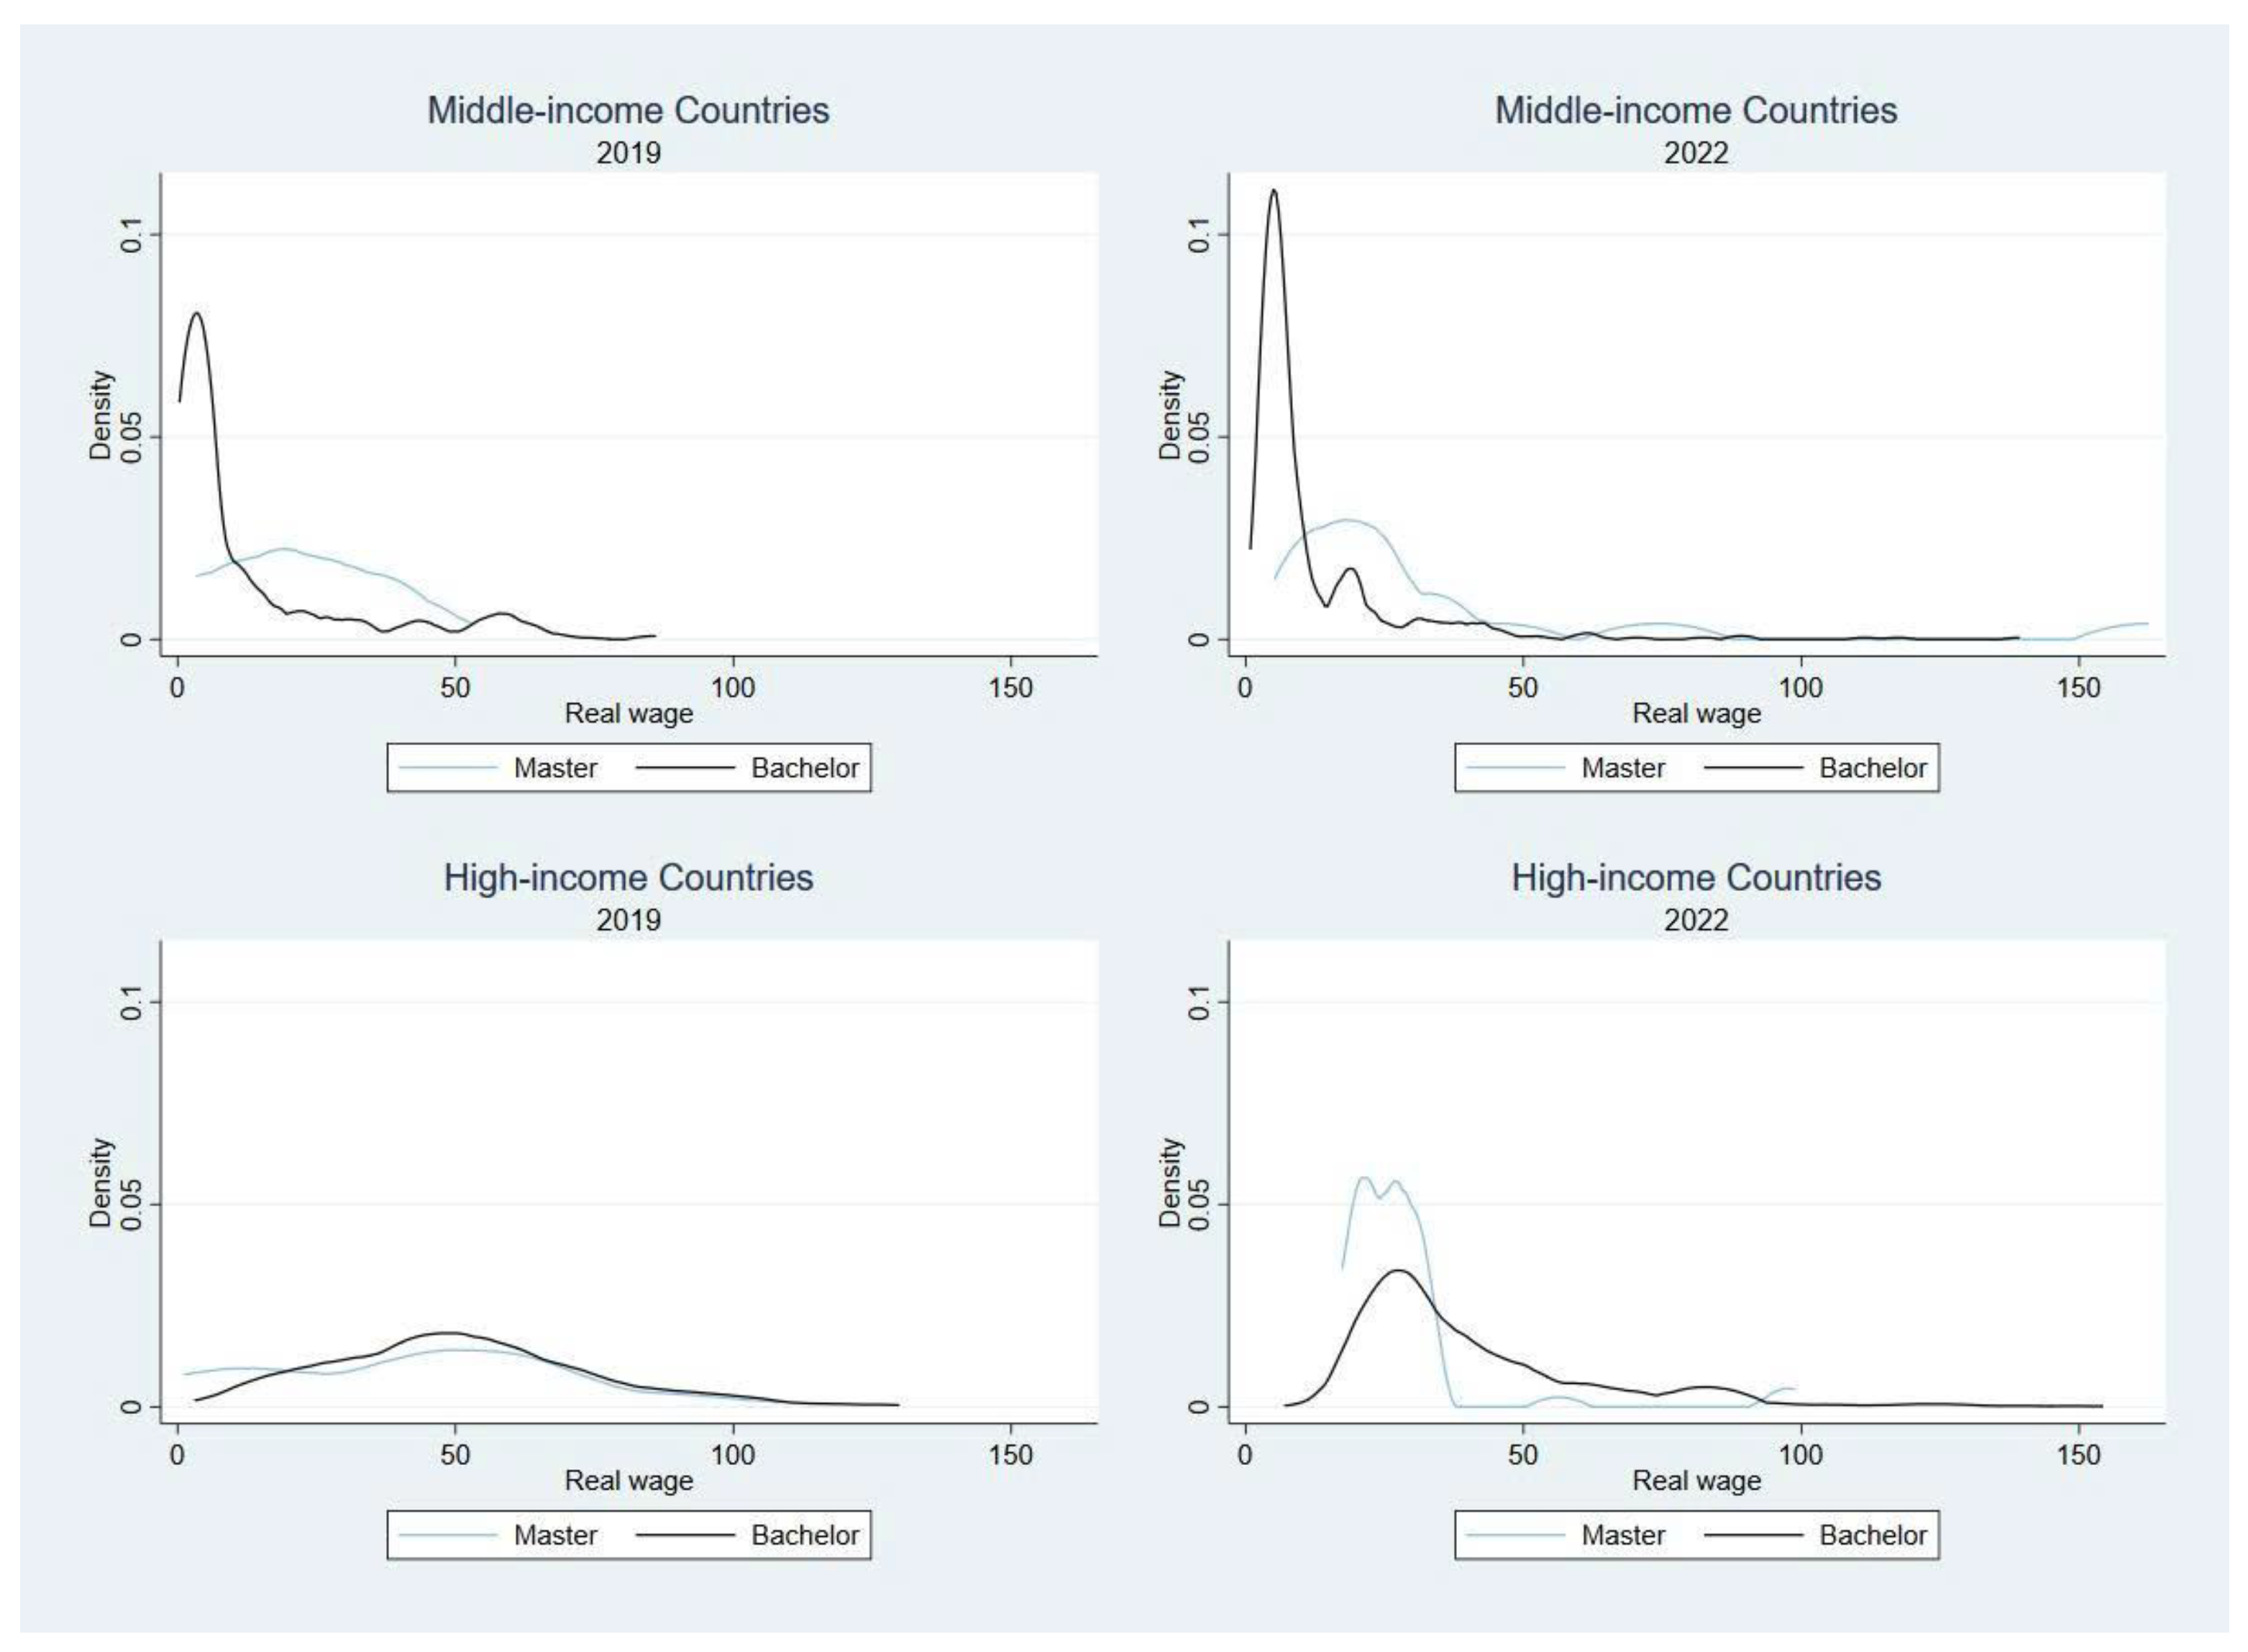
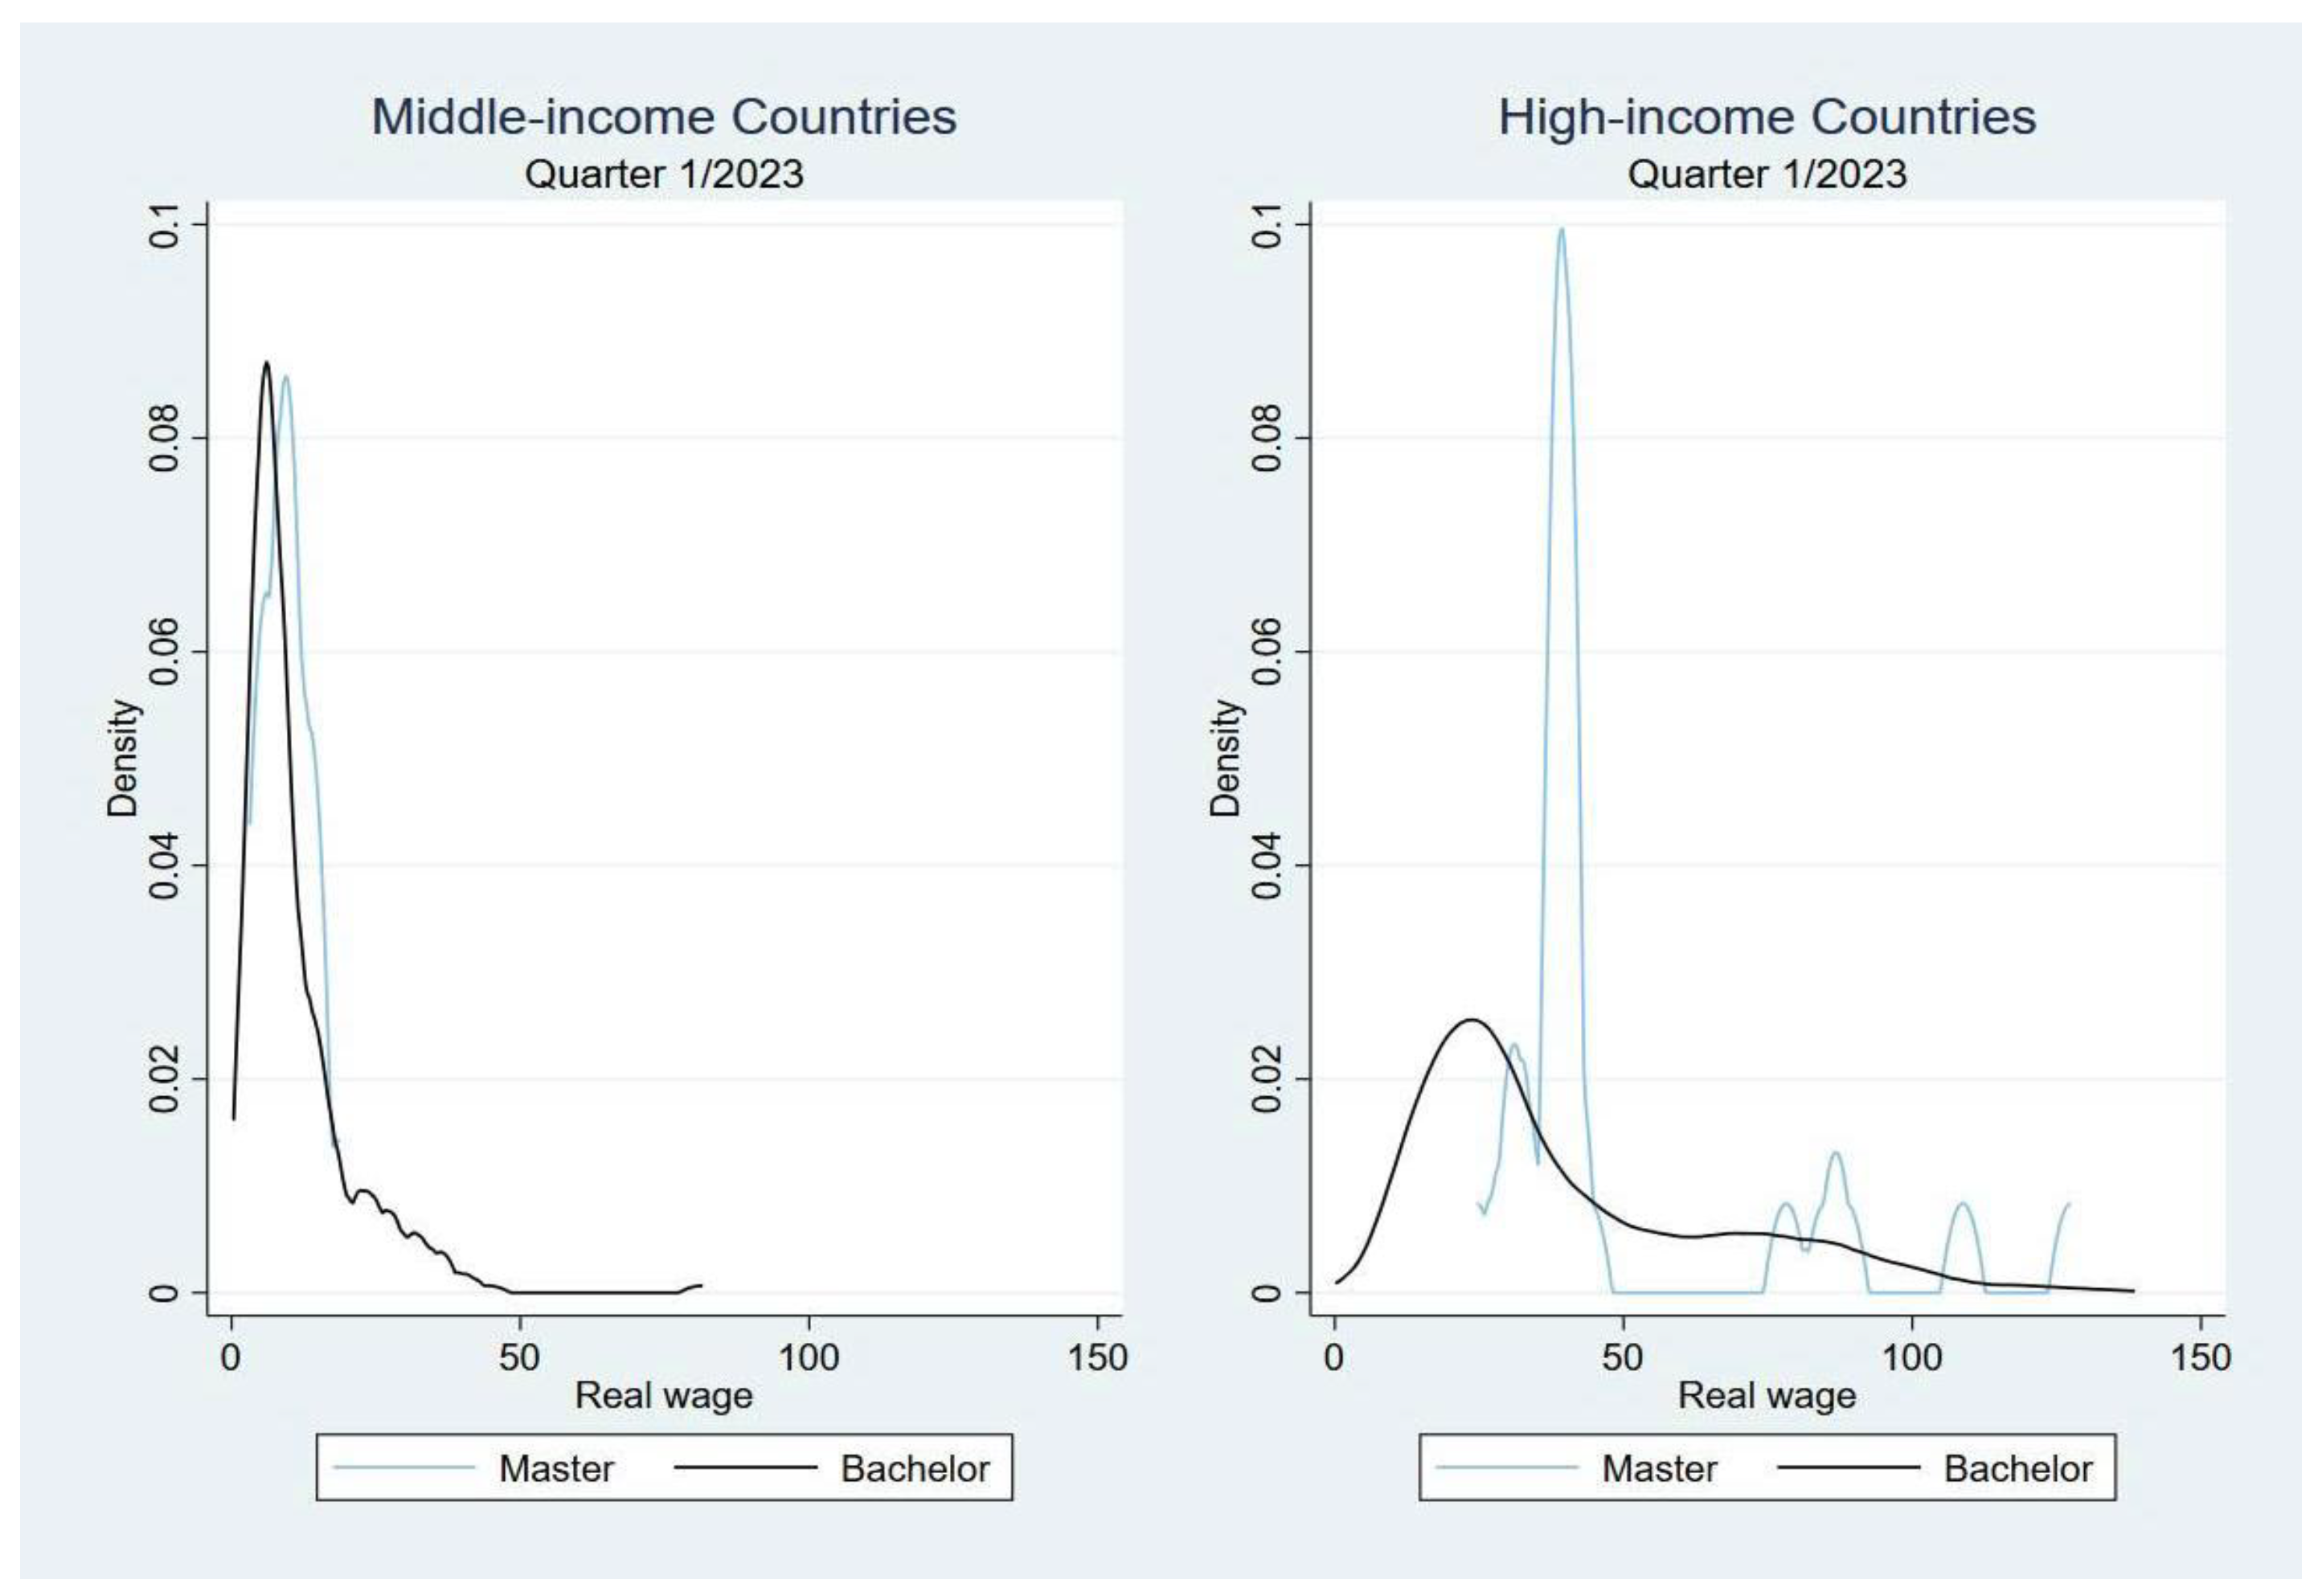
According to Figure 4, the wage differences between bachelor’s and master’s degree holders in high-income countries are minor. In 2019, bachelor’s earnings were not inferior to master’s wages, and there are even many bachelor’s degree holders with wages above USD 5000. In 2022, more job postings demand a bachelor’s degree, which offers a higher income than a master’s degree requirement. In other words, there is barely any earnings distinction among bachelor’s and master’s graduates in high-income nations. Moreover, data from Figure 4 shows that there is a significant gap between bachelor’s and master’s incomes in middle-income nations, with bachelor’s wages primarily in the USD 2000 range and master’s wages ranging from USD 3000 to USD 5000. This suggests that a master’s degree holder will earn a better wage than a bachelor’s degree holder.
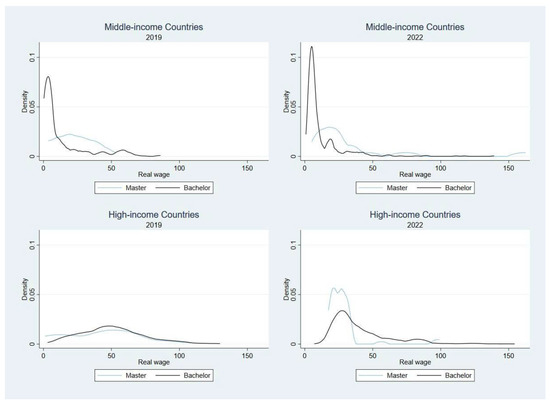
Figure 4.
Kernel Density Estimation by education levels in 2019 and 2022. Source: Authors’ calculation using data collected from online job postings.
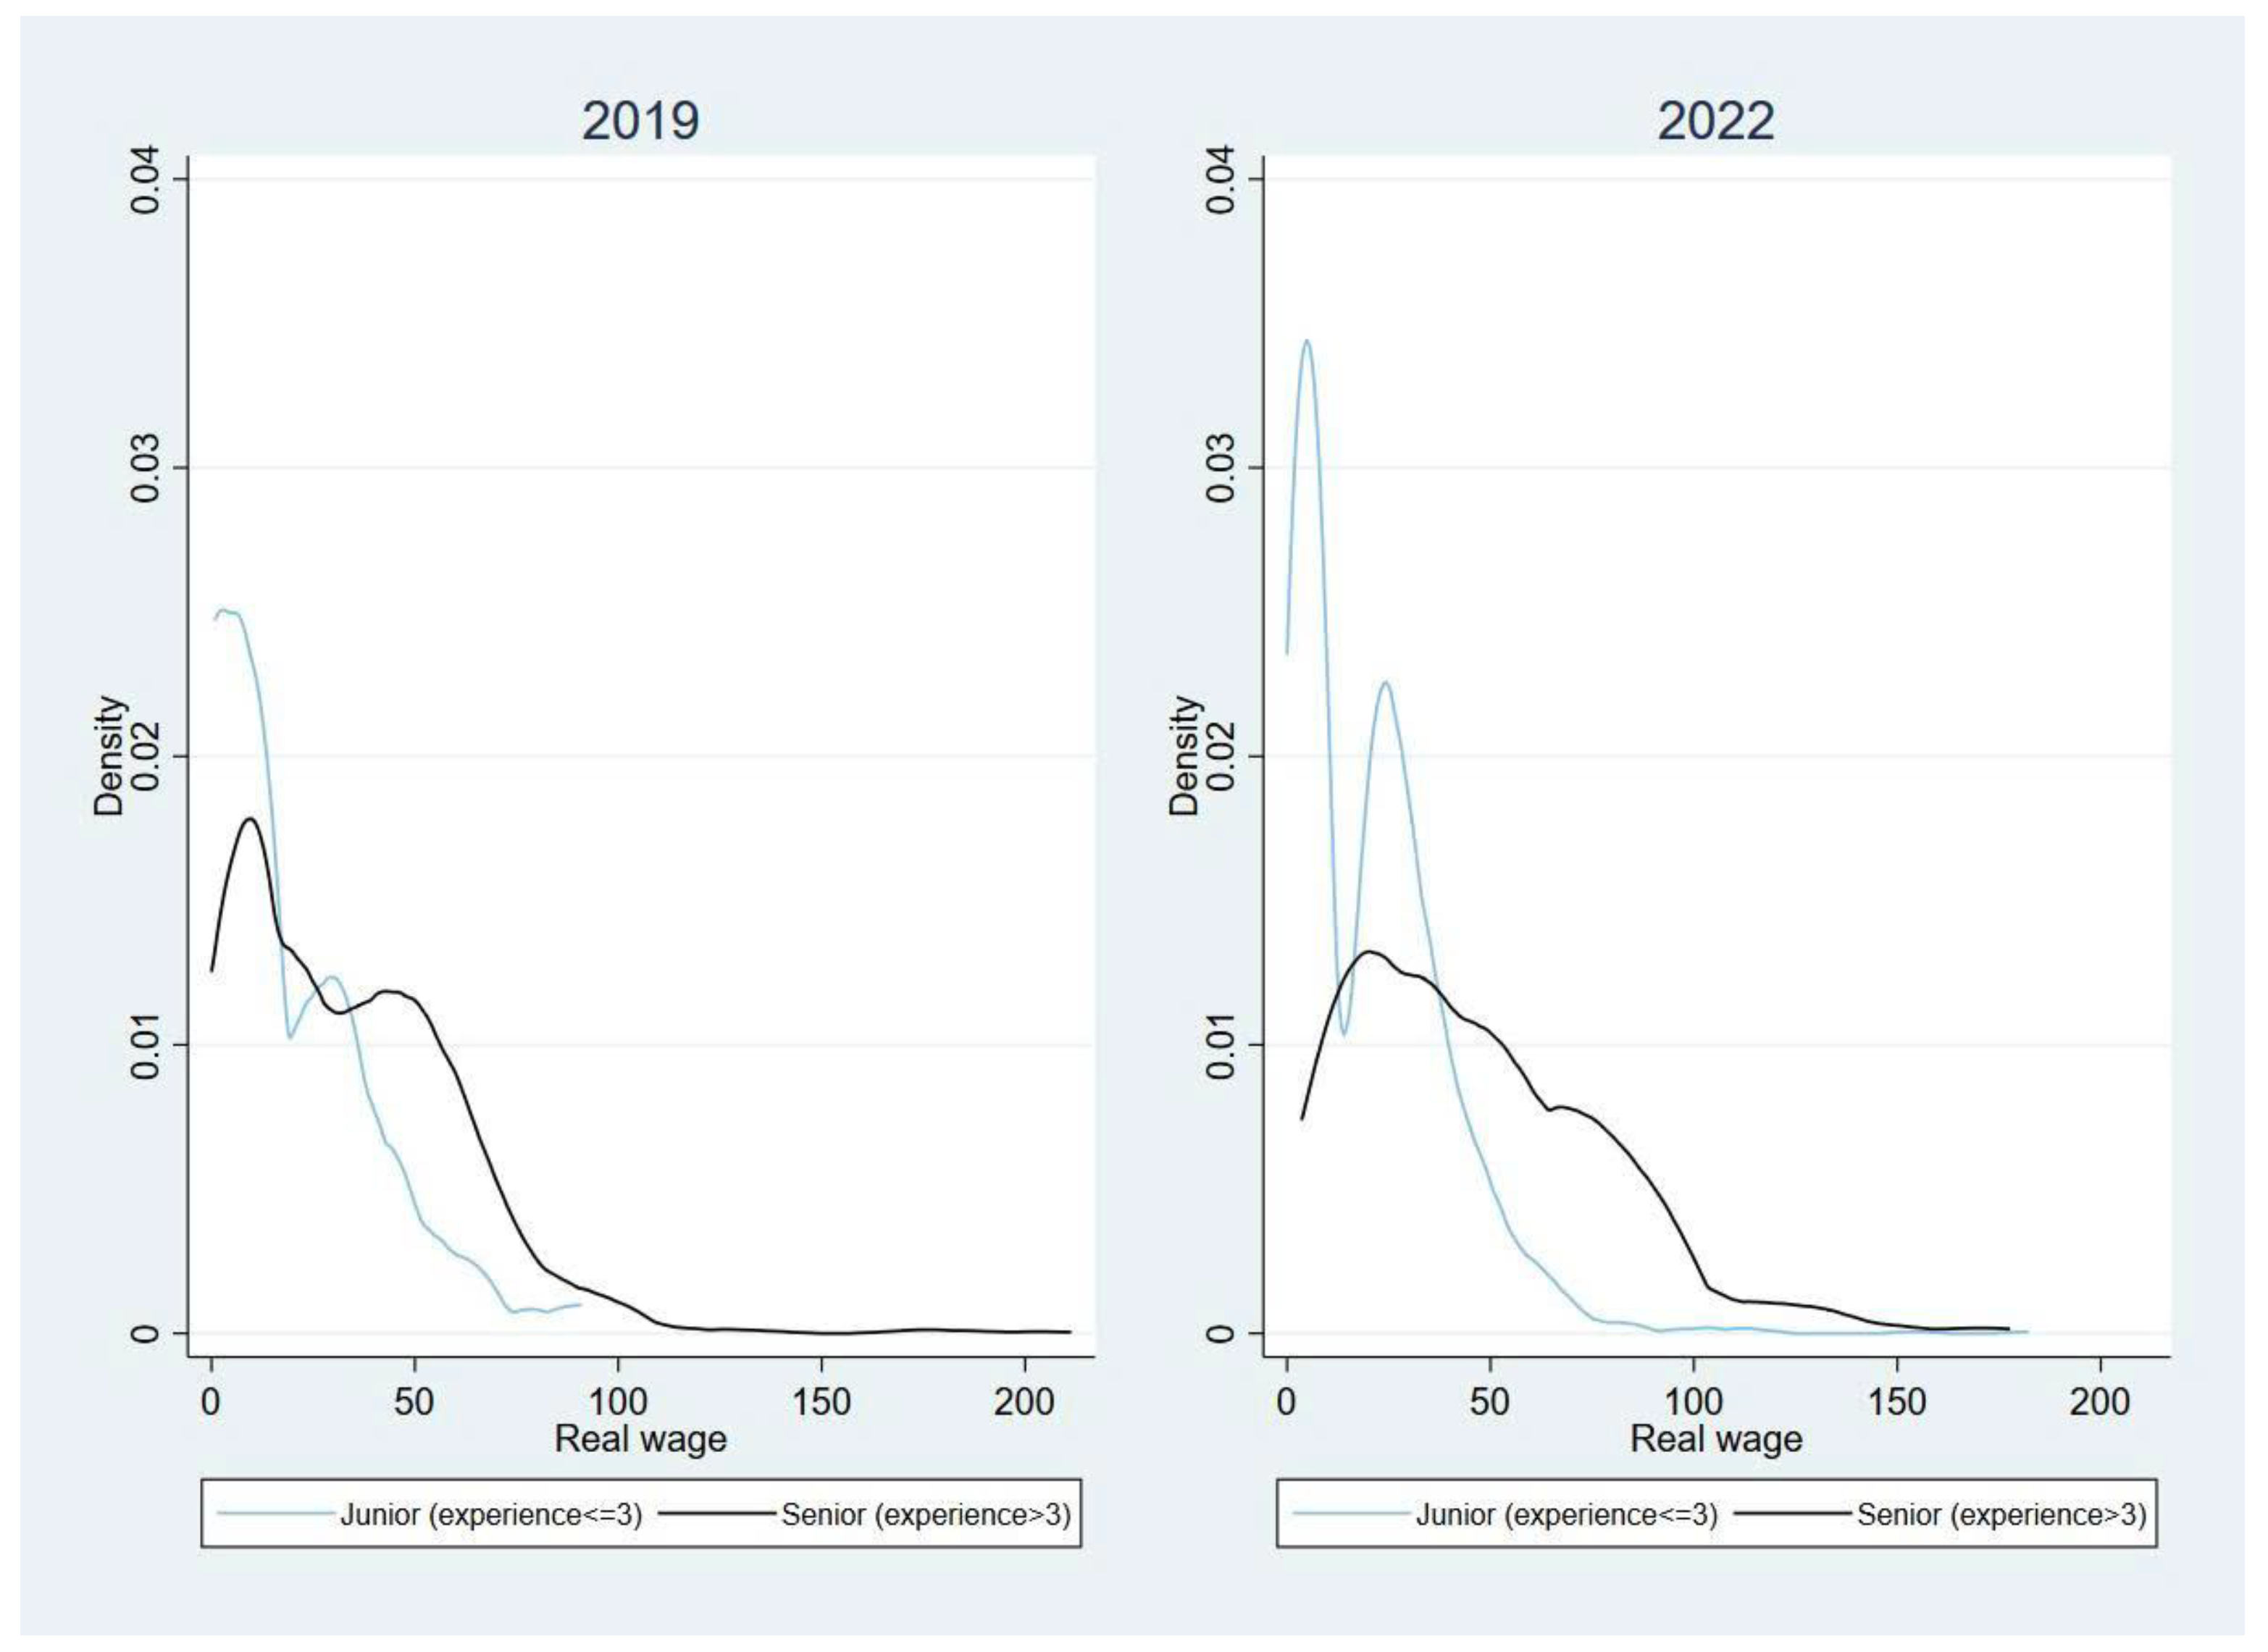
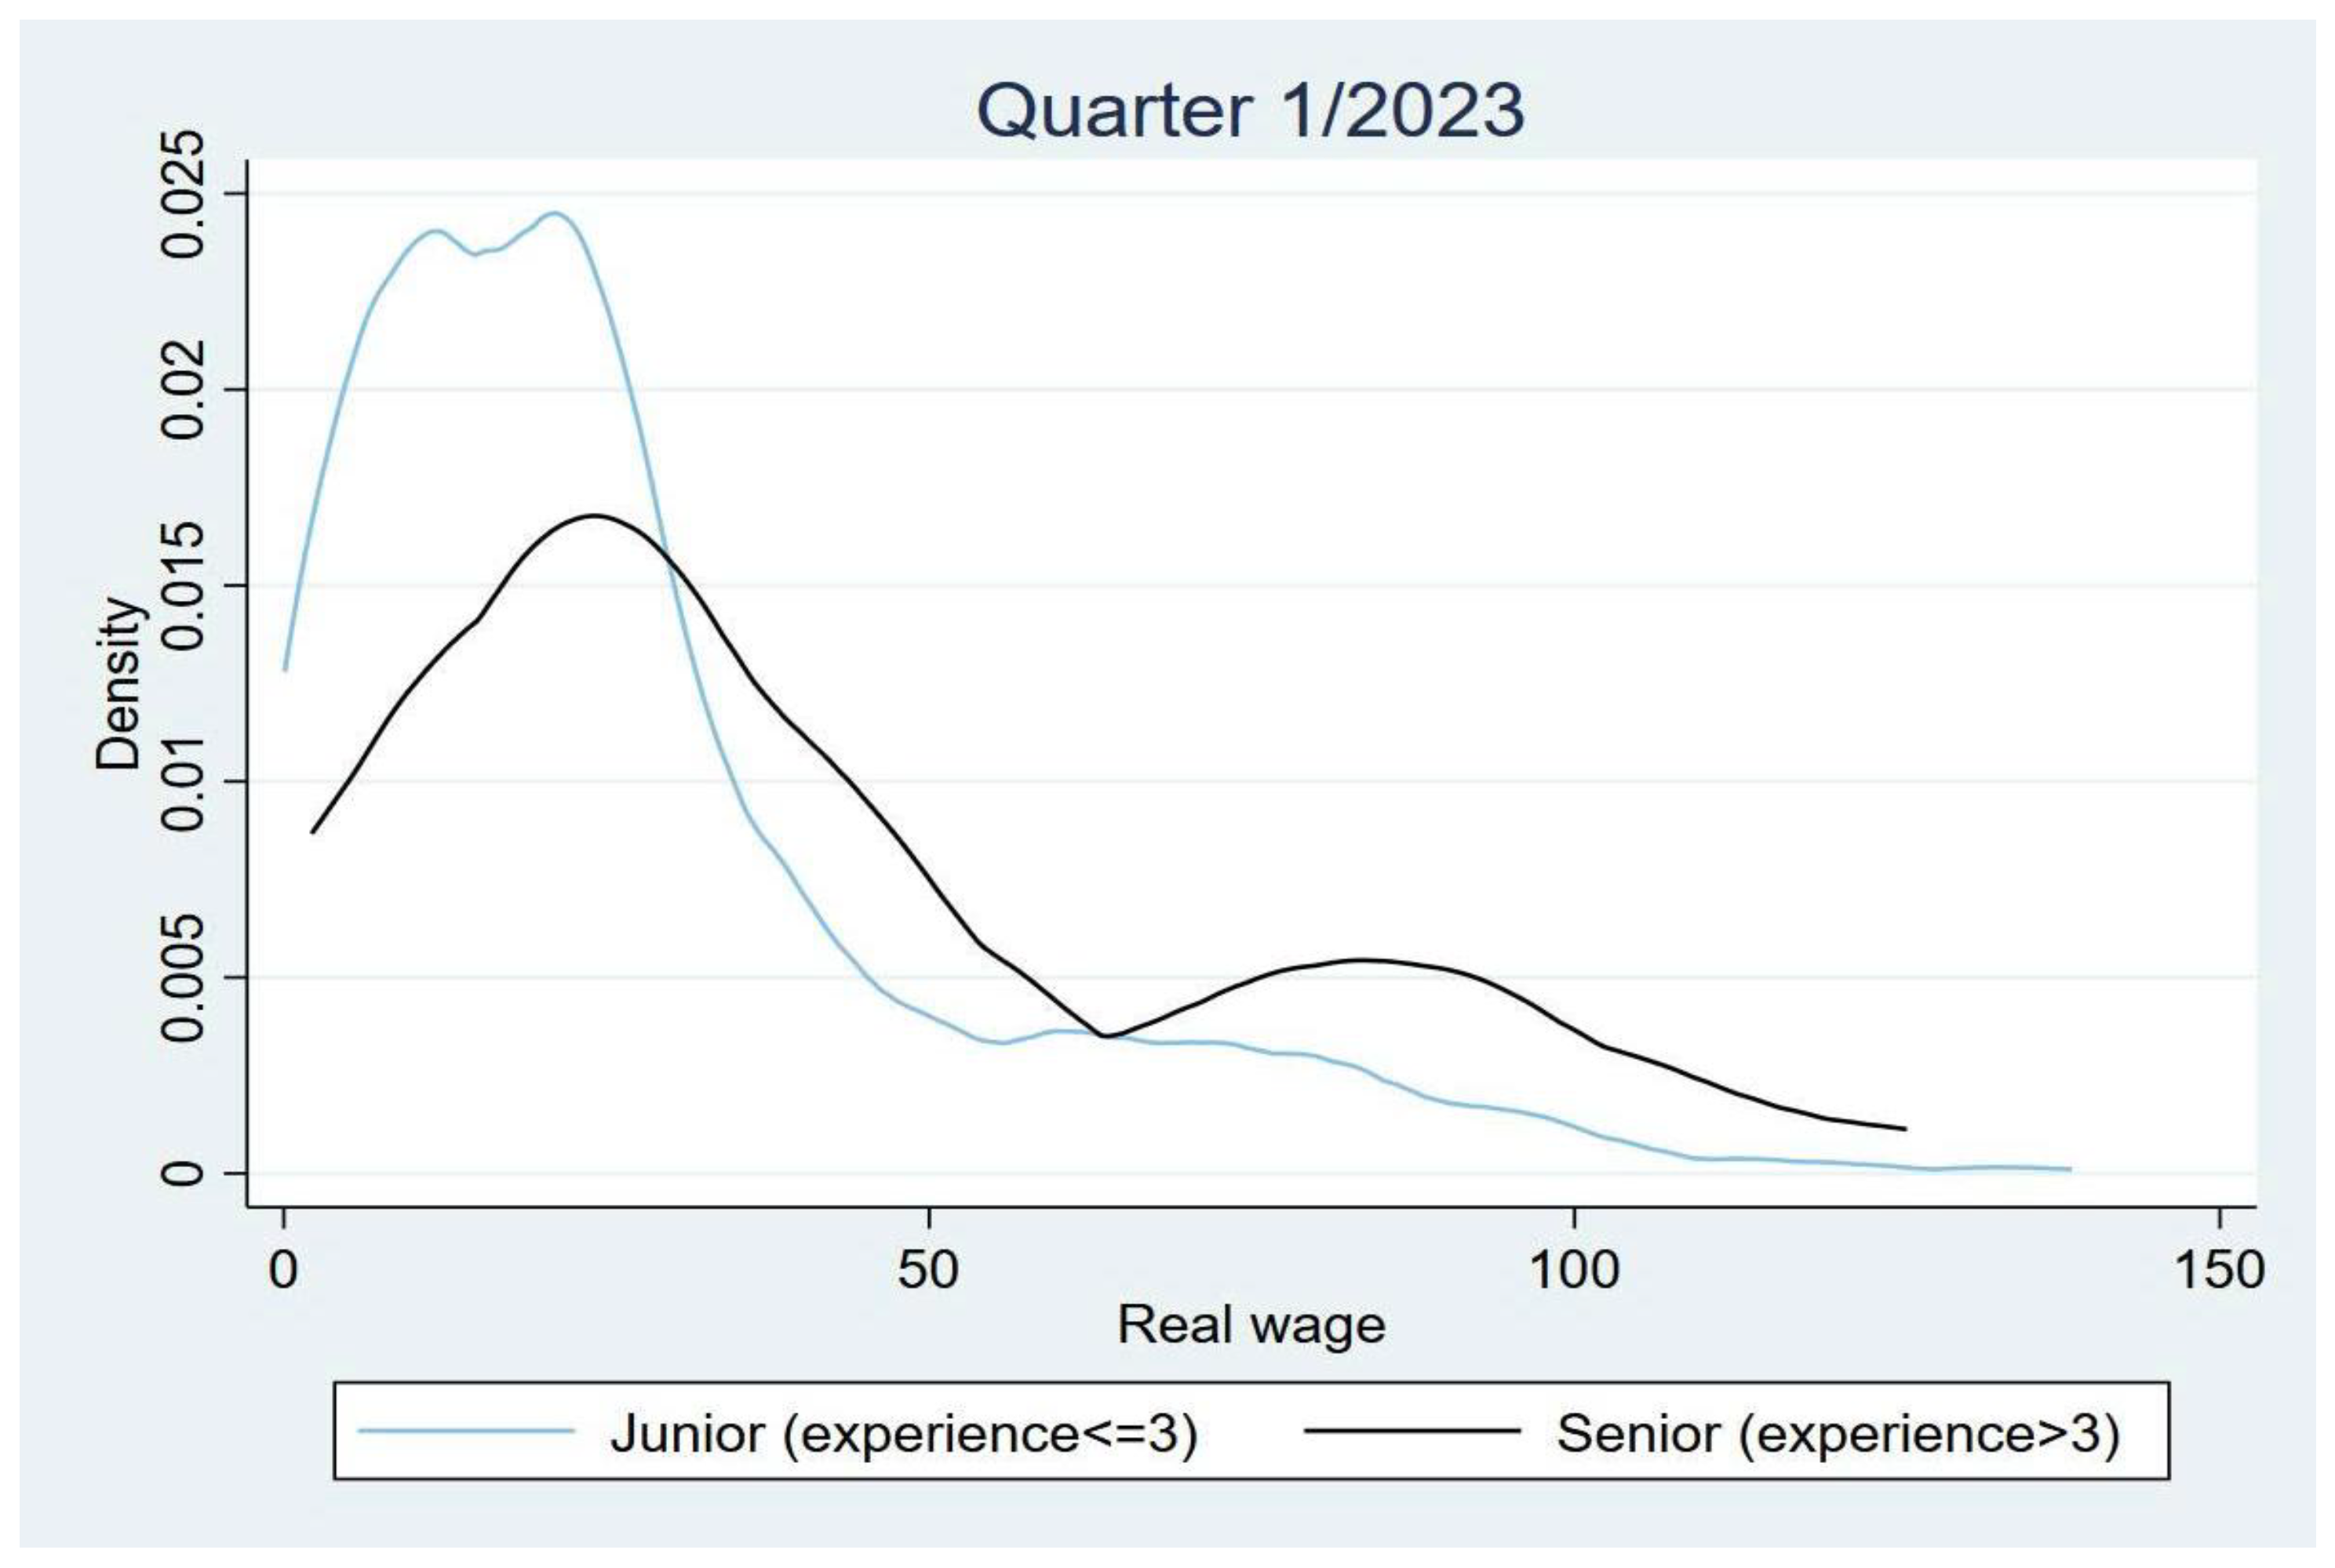
Figure 5 indicates a significant wage disparity between juniors and seniors. This gap will continue to grow as more junior-demanding positions are available. We conclude that there is a significant difference, and the wage disparity will continue to rise in the future.
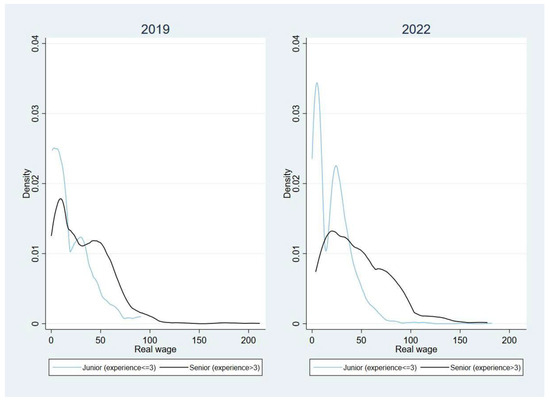
Figure 5.
Kernel Density Estimation by working experience in 2019 and 2022. Source: Authors’ calculation using data collected from online job postings.
4.4. Kernel Density Estimation Using Data from Web Scraping
Figure 6 clearly illustrates distinct trends in the log real wage of the countries under investigation. Notably, China, Hong Kong, Taiwan, and Southeast Asian countries demonstrated the most significant changes. It is important to note that, while the logistic labor cost in China remained relatively stable compared to 2019, Hong Kong and Taiwan experienced a sudden and alarming increase in labor costs. Conversely, labor costs in Southeast Asian countries decreased significantly when compared to 2019, and the highest density of the decrease was observed in the 1–3 log value range.

Figure 6.
Kernel Density Estimation of Asia Pacific in 2019 and Quarter 1/2023. Source: Authors’ calculation using data scraped from online job postings.
As illustrated in Figure 7, a similar trend occurred in the US and European countries, where the average logistic wage level in France became lower than it was in 2019. The UK saw a similar trend to Hong Kong and Taiwan, with a small increase in the average wage rate but a peak in labor costs over a 3 log scale. The US labor force appears to be highly segmented, with two different central points for the real wage at different levels.
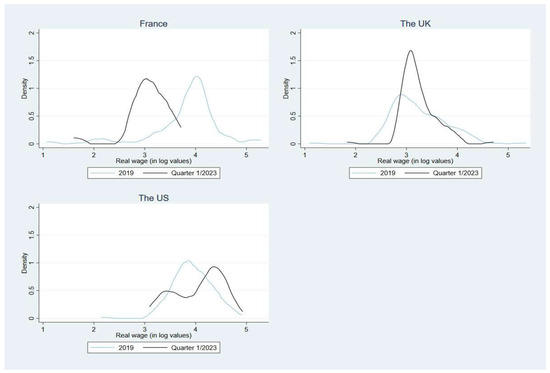
Figure 7.
Kernel Density Estimation of European countries, UK, and US in 2019 and Quarter 1/2023. Source: Authors’ calculation using data scraped from online job postings.
According to Figure 8, the wage rates in Vietnam are increasing, particularly in Hanoi and Danang, where the highest concentration of real wages rose from 1 to 2 and 1.5, respectively. In comparison, Ho Chi Minh City has two distinct central points for real wages at different levels. Still, they are much lower than the wage rates in the US.
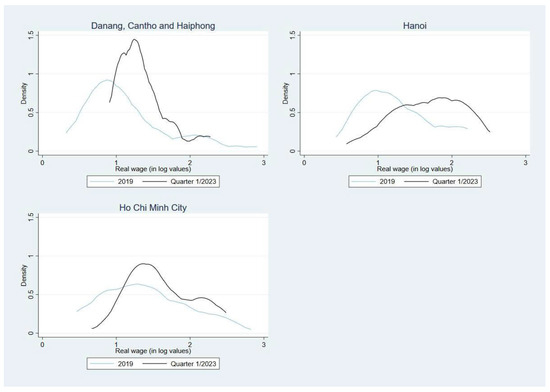
Figure 8.
Kernel Density Estimation of Vietnam in 2019 and Quarter 1/2023. Source: Authors’ calculation using data scraped from online job postings.
Figure 9 shows the effect of level of education on the actual real wage paid to the employees in logistic jobs. It clearly appears that the level of income in middle-income countries was not strongly affected by education level, while it did have certain effects on the wage in high-income countries (double in absolute value with high density).
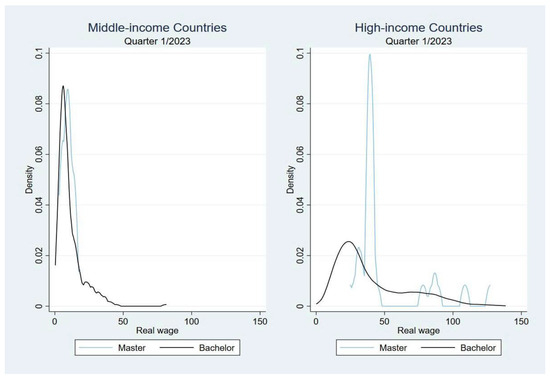
Figure 9.
Kernel Density Estimation by education levels in Quarter 1/2023. Source: Authors’ calculation using data scraped from online job postings.
Figure 10 shows that both junior and senior workers’ real wages are significantly influenced by their work experience. When compared to statistics from 2022, in the first quarter of 2023 the real wage gap between junior and senior workers is significantly higher. In particular, the average senior worker’s wage ranges from USD 2000 to 5000 (0.15 to 0.17 density), whereas junior worker wages vary from USD 5000 to 25,000 (0.2 to 0.25 density).
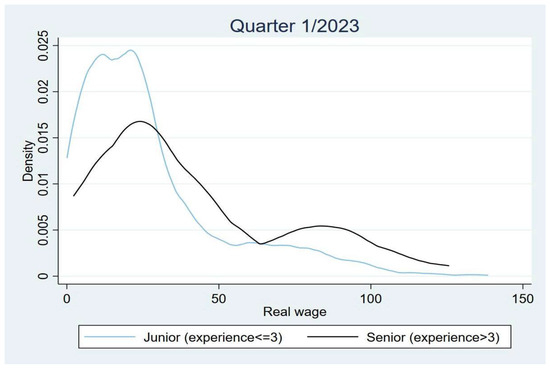
Figure 10.
Kernel Density Estimation by working experience in Quarter 1/2023. Source: Authors’ calculation using data scraped from online job postings in May of 2023.
4.5. Nowcasted Results (Linear Regression, Decision Tree, KNN)
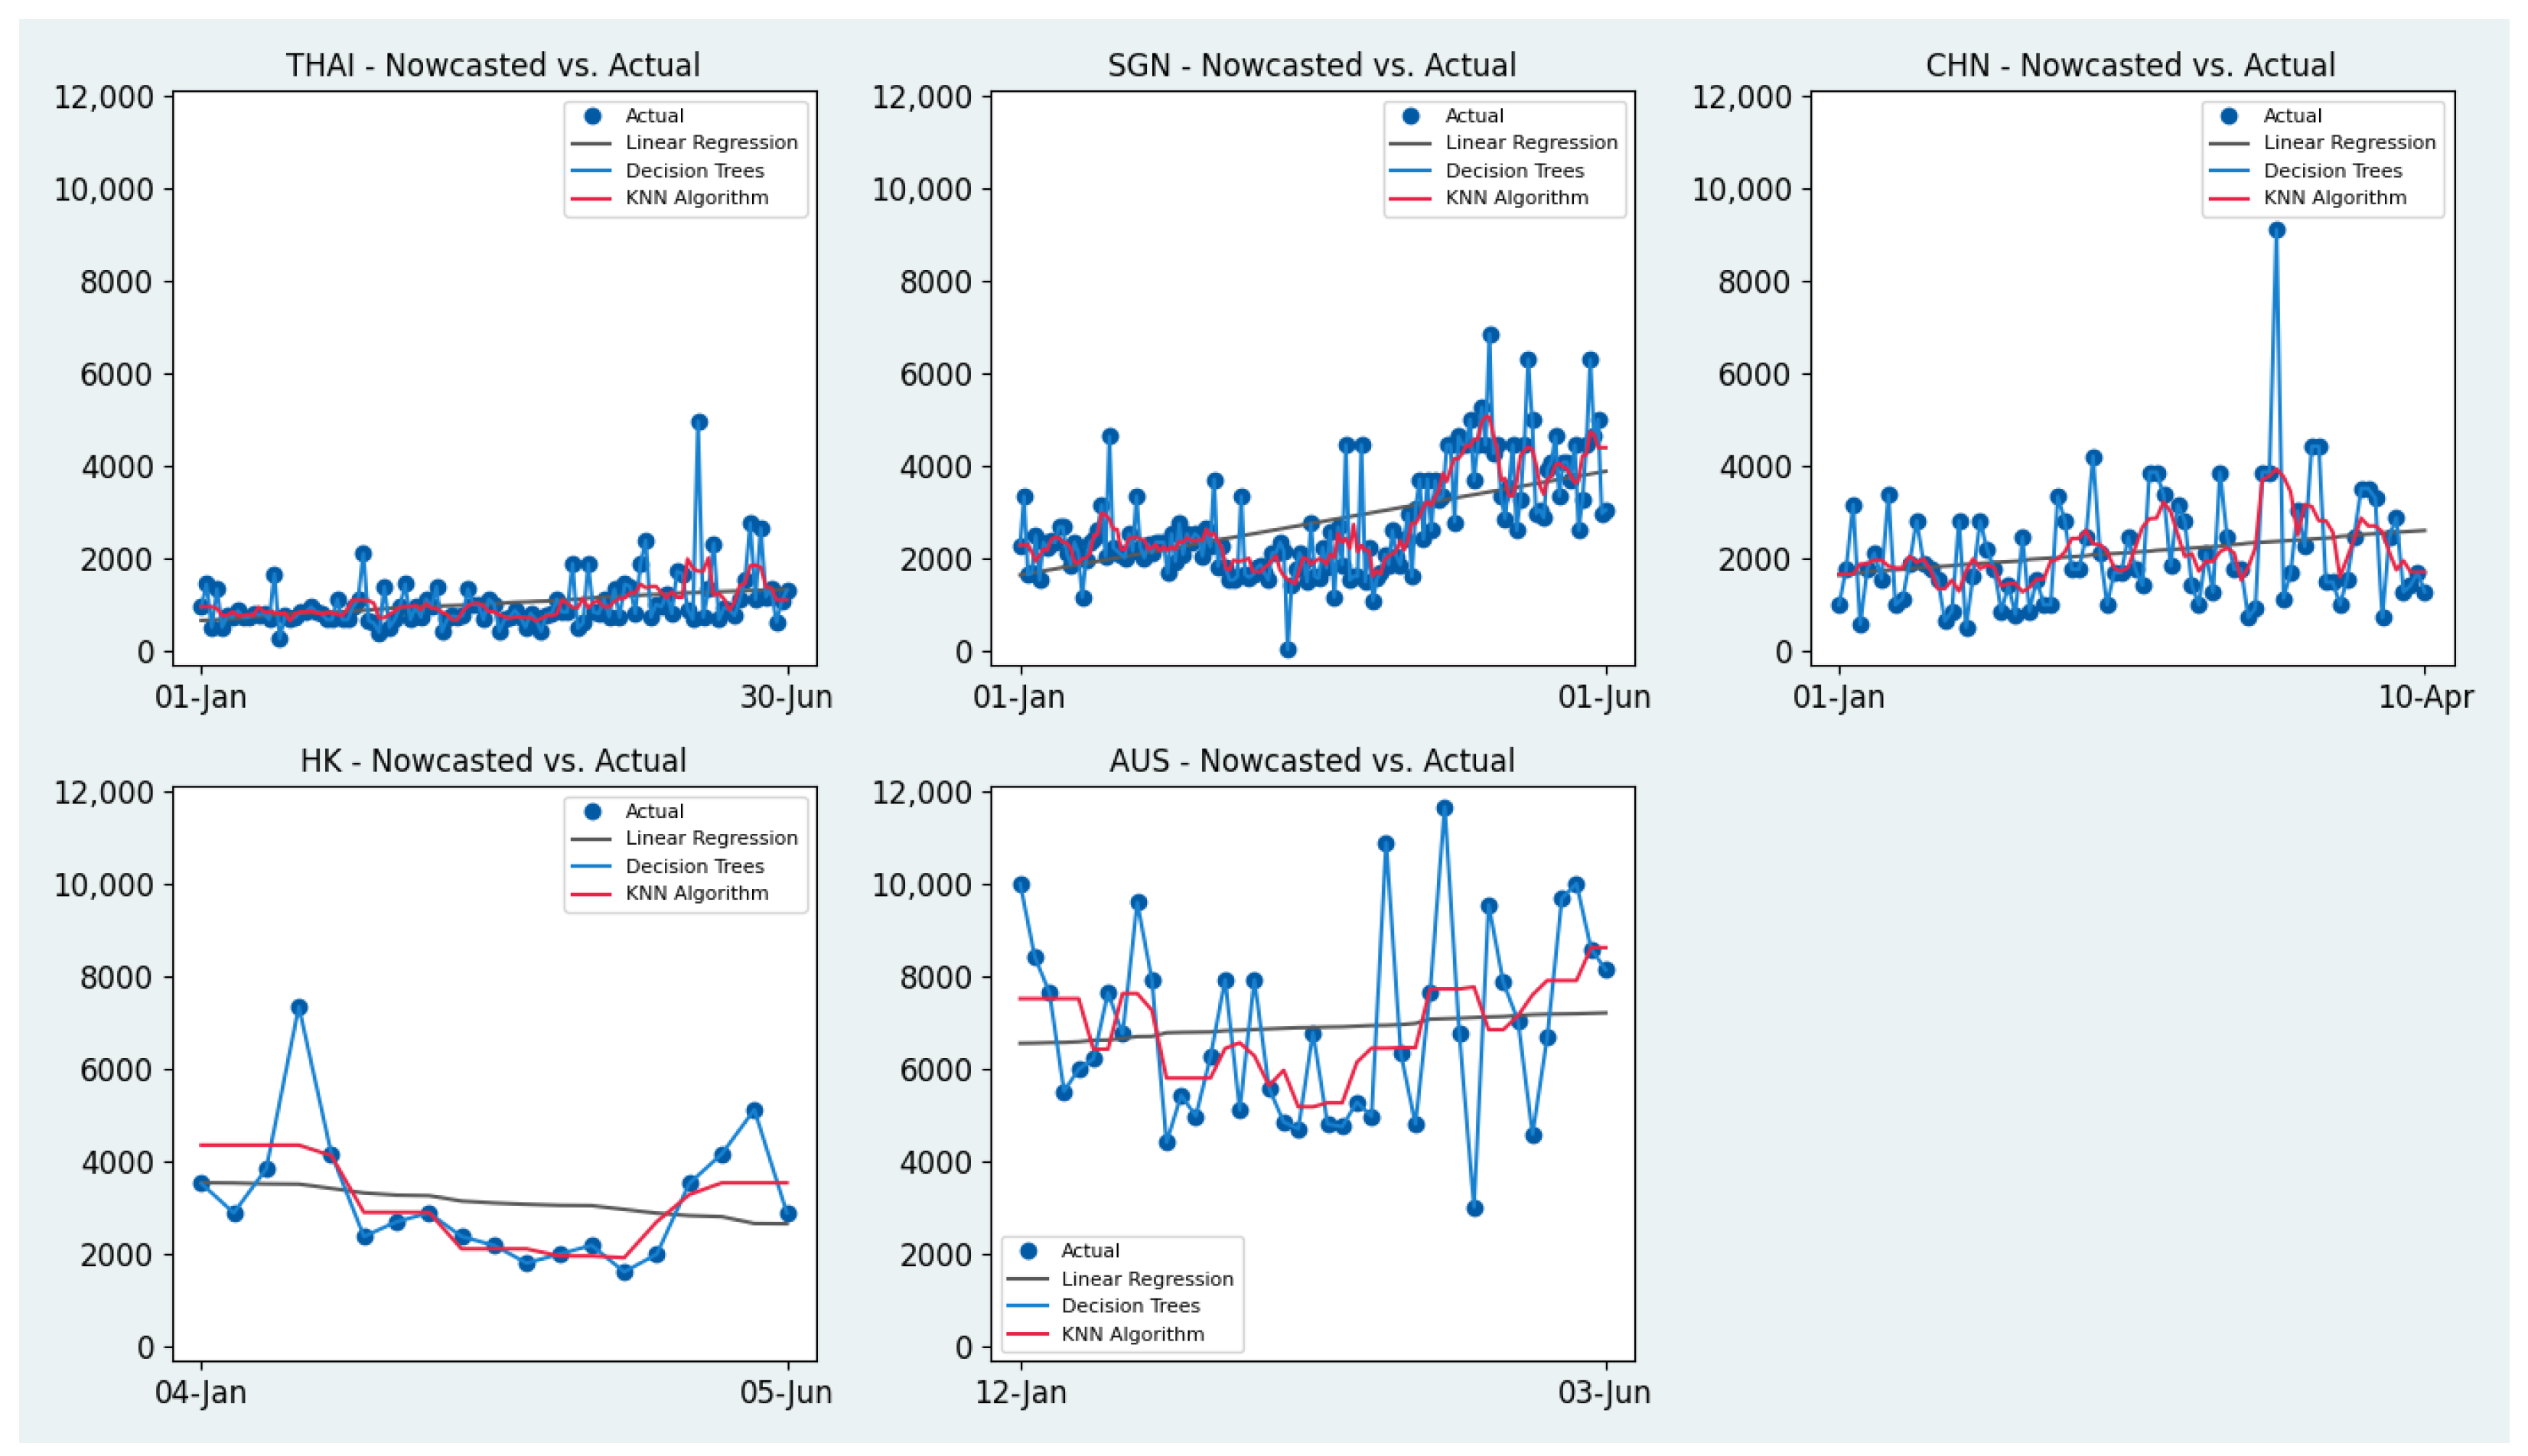
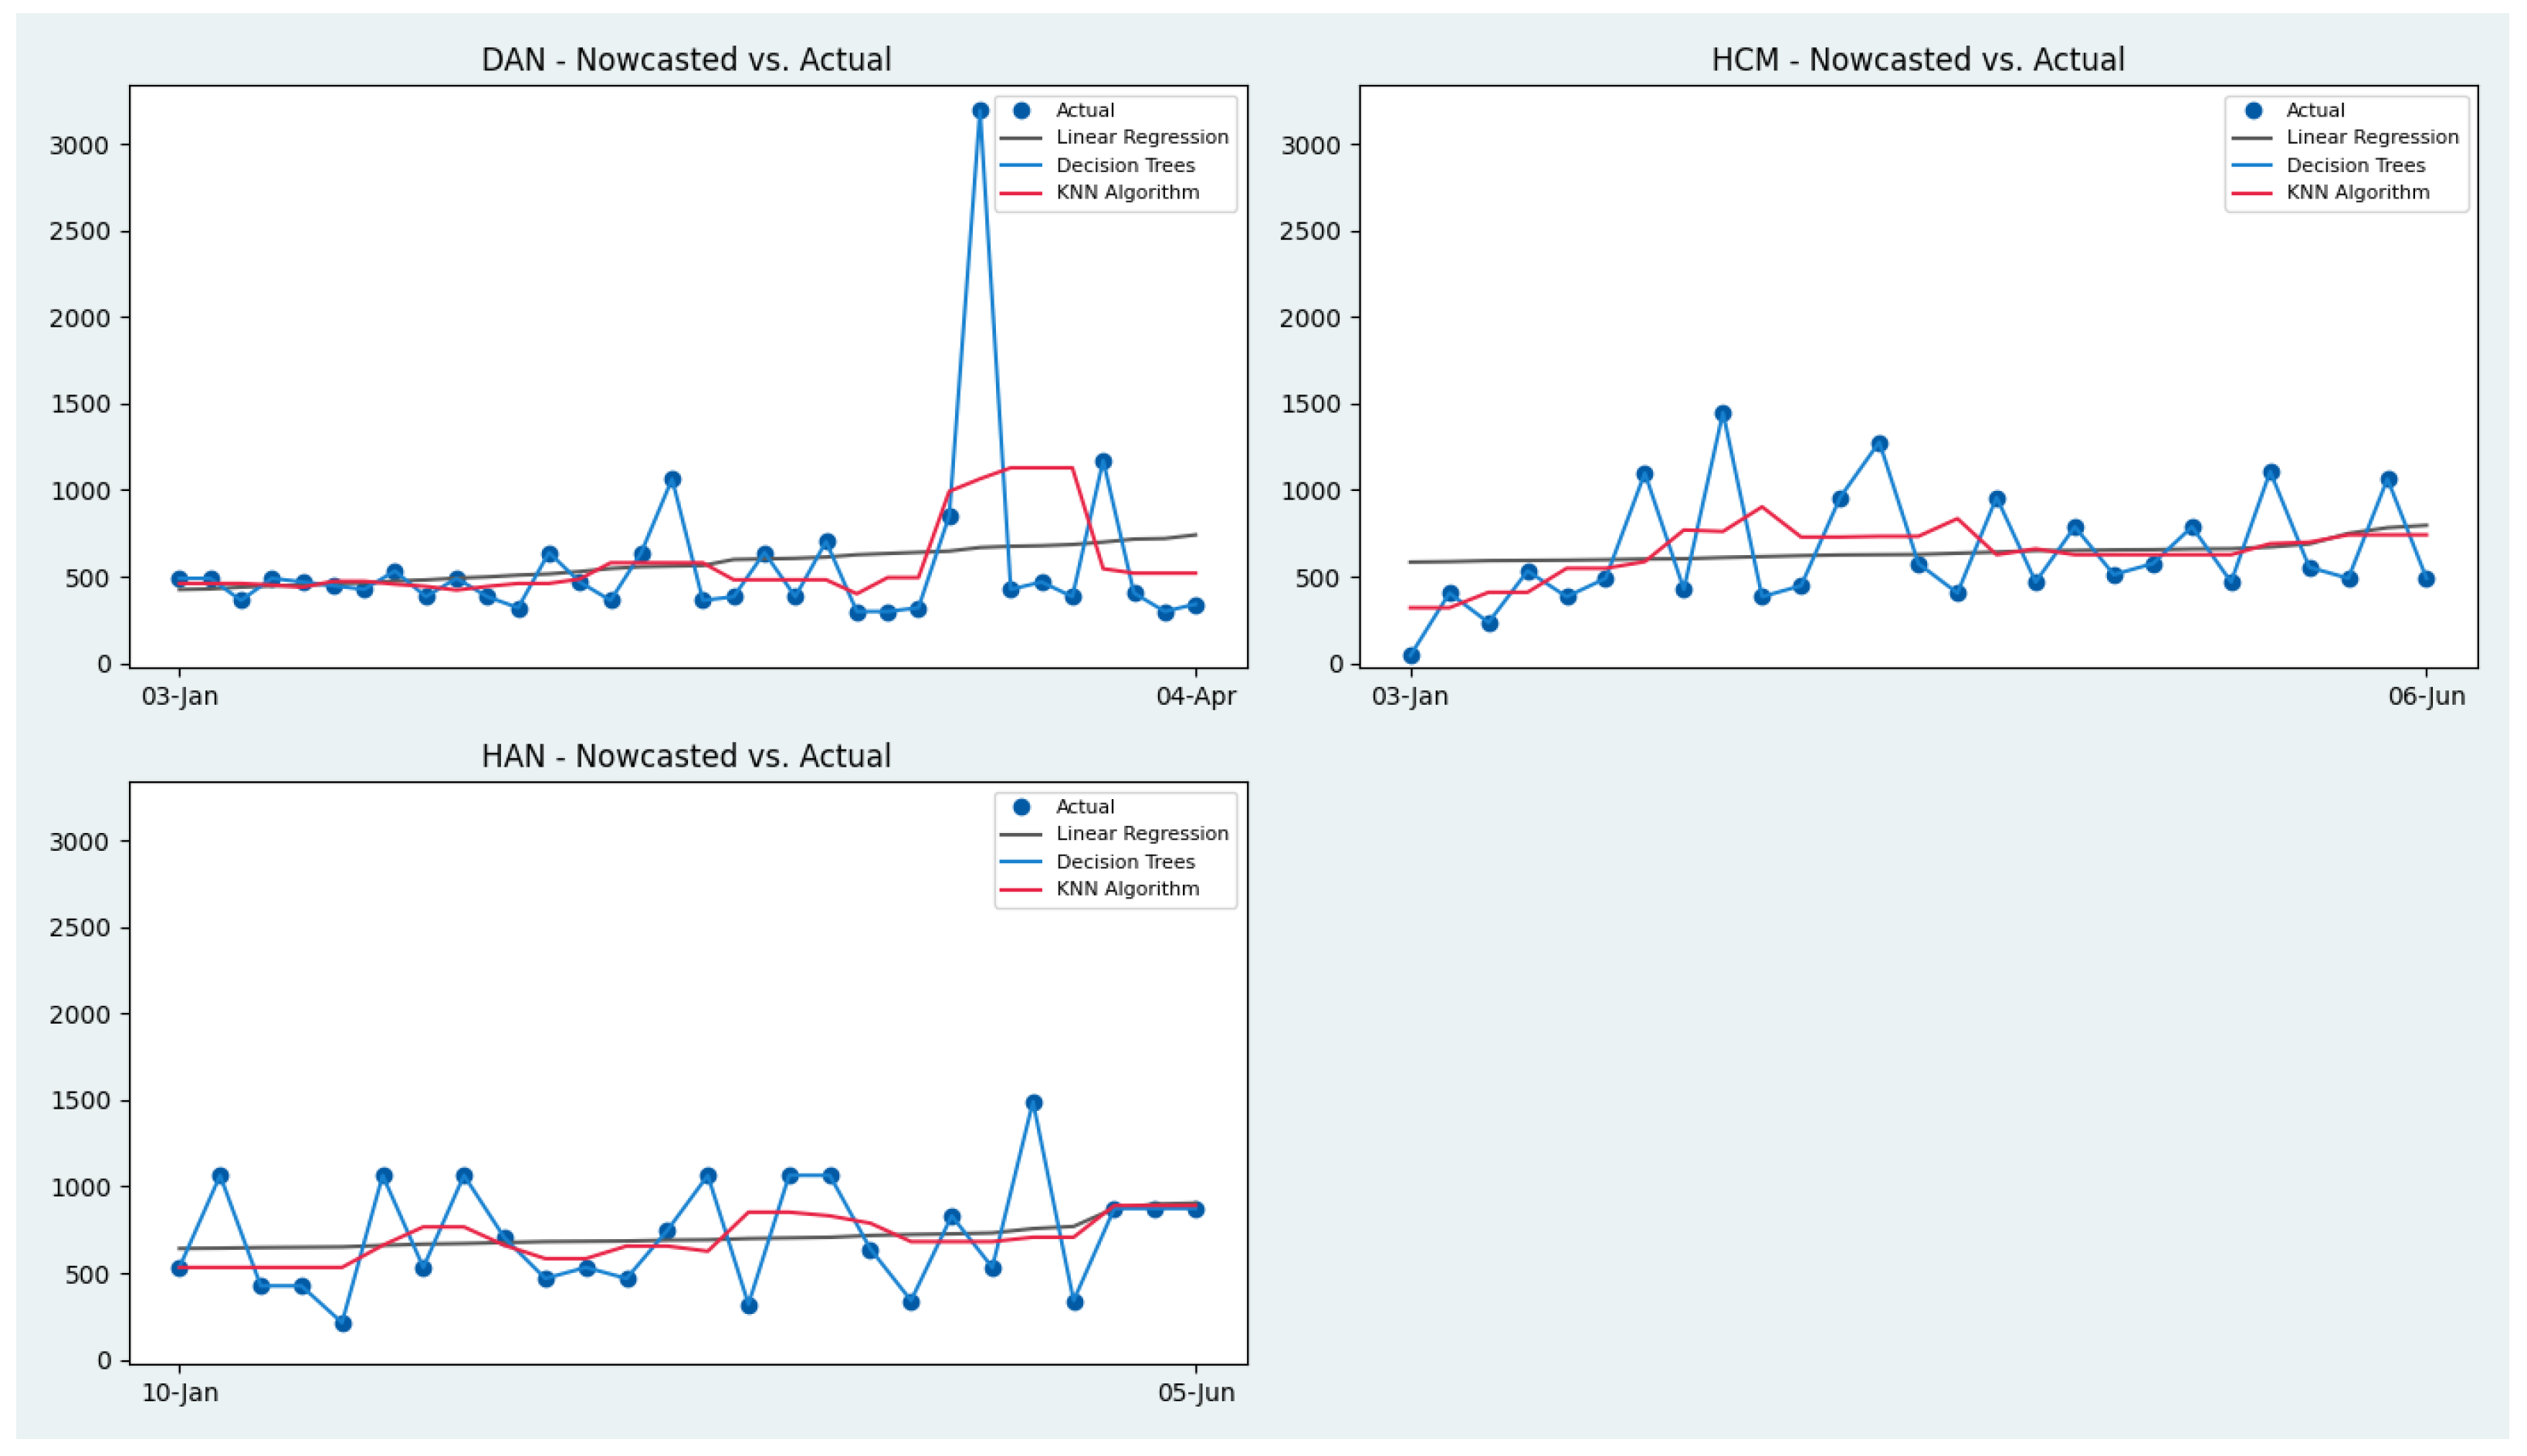
This part compares the real wages predicted from nowcasting methods (Linear regression, Decision tree, KNN) and the real wages calculated from the actual web scraped data. According to Figure 11, nowcasted real wage from web scraped data shows a similarity to the actual web scraped real wage. While real wages in Thailand, Singapore, China, and Australia followed rising patterns from January to June 2023, the real wage in Hong Kong did not. Particularly, real wages in Thailand consistently increased from USD 1000 to USD 1500, driven by market demand, economic conditions, and the evolving logistics landscape. China witnessed a consistent upward trend, with wages climbing from USD 2000 to approximately USD 2200, peaking at USD 9100. Australia displayed a gradual increase from USD 6800 to USD 7000, with wage variations between USD 3000 and USD 11,666.67. In contrast, Hong Kong saw a gradual decline in wages from USD 3500 to USD 2800.
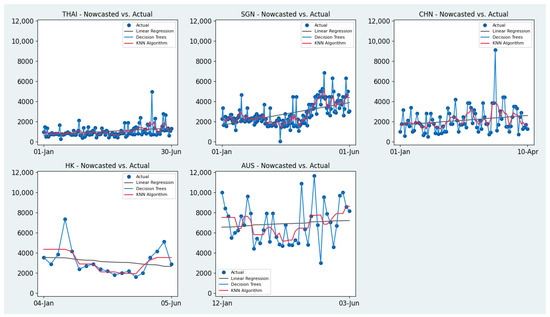
Figure 11.
Wage growth and its nowcasts in Asia Pacific (Quarter 1/2023). Source: Authors’ calculation using data scraped from online job postings collected in May of 2023.
These trends both reflect the diverse dynamics of the logistics industry across the Asia Pacific region. Thailand, Singapore, and China experienced overall positive wage growth, highlighting the significance of logistics professionals in their economies. In contrast, Hong Kong faced challenges in its logistics sector, leading to a decrease in wages.
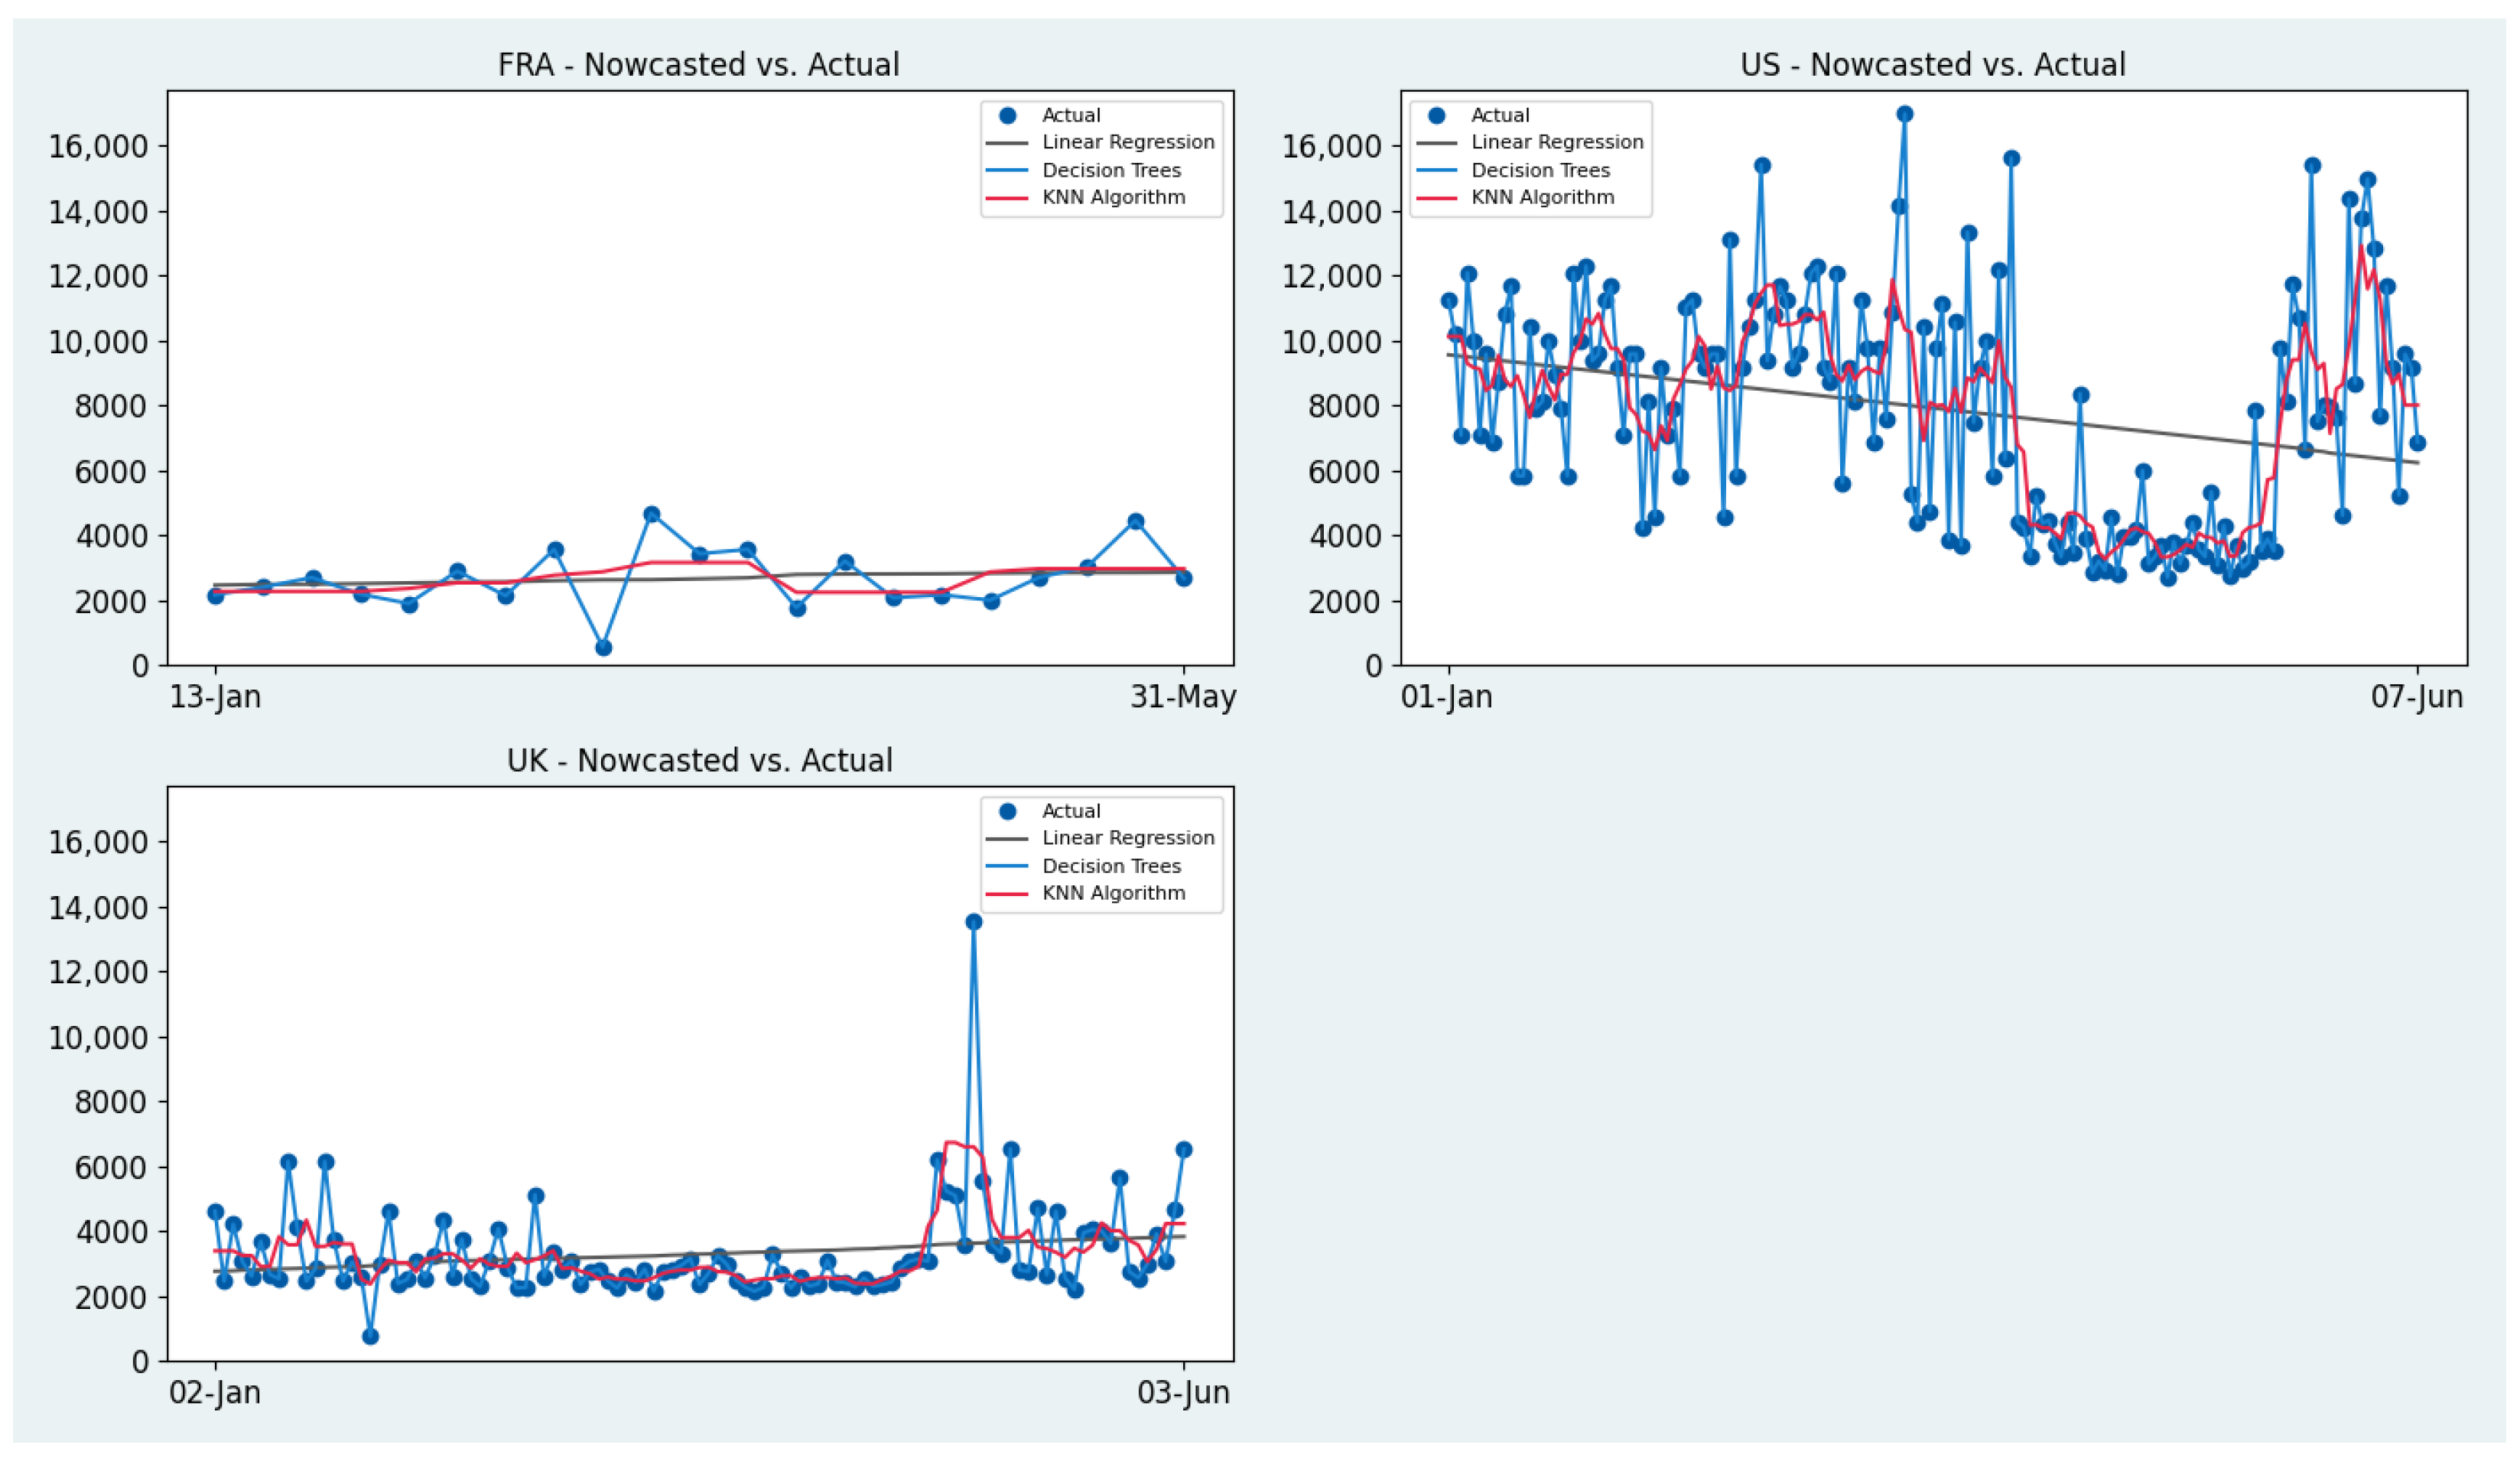
As shown in Figure 12, from January to June 2023, France’s logistics job real wages slightly increased, which is relevant to wages analyzed in linear regression, ranging from USD 2200 to USD 2300. Similarly, the actual and nowcasted real wages of the UK experienced an increasing trend of USD 2500 to USD 3500. This indicates the same pattern between nowcasted real wages and actual web scraped logistics wages.
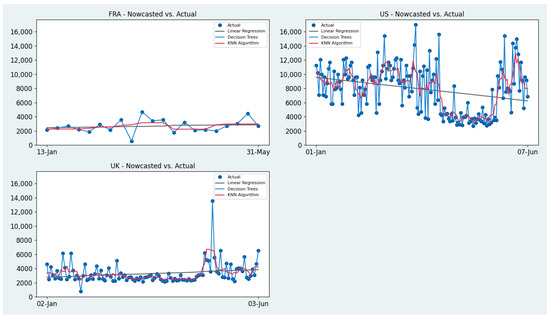
Figure 12.
Wage growth and its nowcasts in European countries, the UK, and the US (Quarter 1/2023). Source: Authors’ calculation using data scraped from online job postings collected in May of 2023.
The logistics job market in European countries including the UK exhibits similarity in real wages vs. nowcasted wage, but the US does not, indicating that market conditions, economic fluctuations, and industry dynamics play a significant role in labor demand prediction. Stakeholders and industry participants should consider these factors when analyzing and forecasting wage trends in the logistics sector.
When comparing real wages to the specified wage linear regression in Danang, Vietnam, we observe deviations from the upward trend (Figure 13). The wages fluctuate, deviating from the projected regression. The lowest recorded wage is USD 297.99, significantly lower than expected, while the peak wage reaches USD 3192.75, surpassing the projected range. These variations indicate that factors beyond the linear regression model influence logistics job wages in Danang.
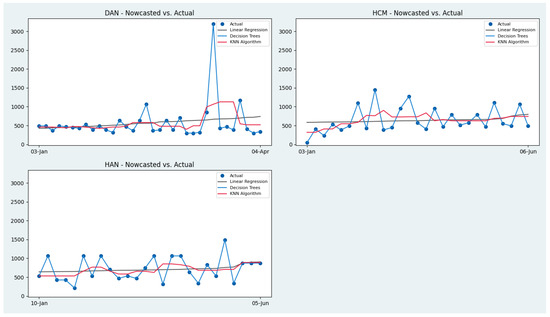
Figure 13.
Wage growth and its nowcasts in Vietnam (Quarter 1/2023). Source: Authors’ calculation using data scraped from online job postings collected in May of 2023.
In Hanoi, the real wages of logistics jobs gradually increased from USD 600 to over USD 700, but there was a significant wage jump towards the end of the period, exceeding USD 800. The lowest recorded wage is USD 212.85, which is lower than the expected trend. On the other hand, the peak wage reaches USD 1489.95, which is higher than expected. In Ho Chi Minh City, the real wages of logistics jobs experience a similar trend to that of Hanoi.
5. Research Conclusions and Recommendations
The results presented above clearly show that the logistics sector exhibits a high potential for growth in various countries, namely Singapore, Australia, the US, the UK, France, and Germany. It is worth noting that, in these countries, wages in the logistics industry are relatively high. However, the COVID-19 pandemic imposed a dramatic effect on wages in the logistics sector, leading to an increase in some countries, while others experienced a decrease in real wages across all participating regions.
It is of importance to acknowledge that various factors such as the inflation rate, government policy, and trade agreements, have a significant impact on global logistics trends. To effectively analyze and predict logistic labor wages in Vietnam and other markets, data from online job postings using kernel density estimation can be utilized. This data is highly relevant to Vietnam’s GDP per capita and quarterly GDP growth rate analysis (Appendix A). By studying such data, we can identify trends and potential growth areas, which can inform businesses and policymakers looking to invest in the logistics sector.
In addition, we should note that pay dispersion between high- and middle-income nations varies based on education level. Therefore, we recommend that businesses in Vietnam focus on developing better logistics and transportation systems to increase profitability. This could include investing in new technologies and infrastructure, as well as developing more efficient supply chain management systems.
Furthermore, potential employees should be offered adequate compensation, education, and technical skills. Candidates with a master’s degree or extensive job experience can expect to be paid generously, and this is something that businesses should consider when designing their compensation packages. Employers should develop benefit packages based on not only educational level but also working experience and proficiency in logistics tools based on corporates’ needs. Therefore, designing well-established requirements with thorough considerations from direct managers and experts will help both candidates and the talent acquisition team to truly understand job scopes and necessary technical skills customized by each vacancy.
Lastly, it is worth noting that students looking to enter the logistics industry should broaden their talents, particularly in technical skills. Expanding one’s skill set can greatly help in securing a job in the logistics industry, as businesses are increasingly looking for employees with a diverse range of skills and expertise. Thus, by developing a comprehensive understanding of the industry and its various subfields, as well as staying up to date with new technologies and trends, students can position themselves for success in the logistics sector. As job seekers in logistics, students should carefully research the market and gain a considerable understanding of wage levels to avoid underpayment.
This research involved collecting data through web scraping, which was conducted with careful consideration. We only scraped publicly available data and adhered to the terms of service of all websites accessed. Therefore, we implemented an acceptable scraping rate, avoiding placing a burden on website servers. Also, the private identifiable information was removed from job postings to protect data privacy.
Author Contributions
Conceptualization, H.Q.N. and K.H.D.T.; methodology, H.Q.N., K.H.D.T., N.T.Y.T. and L.D.T.; software, K.H.D.T. and L.D.T.; validation, H.Q.N. and H.M.H.L.; formal analysis, K.H.D.T., N.T.Y.T., L.D.T., H.Q.N. and H.M.H.L.; investigation, H.Q.N., K.H.D.T., N.T.Y.T. and L.D.T.; resources, H.Q.N. and H.M.H.L.; data curation, K.H.D.T.; writing—original draft preparation, H.Q.N., K.H.D.T., N.T.Y.T. and L.D.T.; writing—review and editing, K.H.D.T., H.Q.N., H.M.H.L. and L.D.T.; visualization, K.H.D.T. and L.D.T.; supervision, H.Q.N. and H.M.H.L.; project administration, K.H.D.T. and H.Q.N.; funding acquisition, K.H.D.T., N.T.Y.T. and L.D.T. All authors have read and agreed to the published version of the manuscript.
Funding
Khoa Huu Dang Tran, Lina Doan Tran and Nhi To Yen Tran received funding from the COS 2021 project awarded by the Foreign Trade University in Vietnam.
Institutional Review Board Statement
Not applicable.
Informed Consent Statement
Not applicable.
Data Availability Statement
Data contained in the article will be provided by the corresponding author upon request.
Acknowledgments
The authors gratefully acknowledge Huynh Phu and Vo Van Anh Khoa for their exceptional support. We are grateful to Tran Hoang Minh Khoa for the professional support in web scraping data.
Conflicts of Interest
The authors declare no conflict of interest.
Appendix A

Figure A1.
GRDP of Vietnam in Quarter 1, 2023. Source: Authors’ visualization using data from General Statistics Office of Vietnam—GSO [71].
Figure A1.
GRDP of Vietnam in Quarter 1, 2023. Source: Authors’ visualization using data from General Statistics Office of Vietnam—GSO [71].
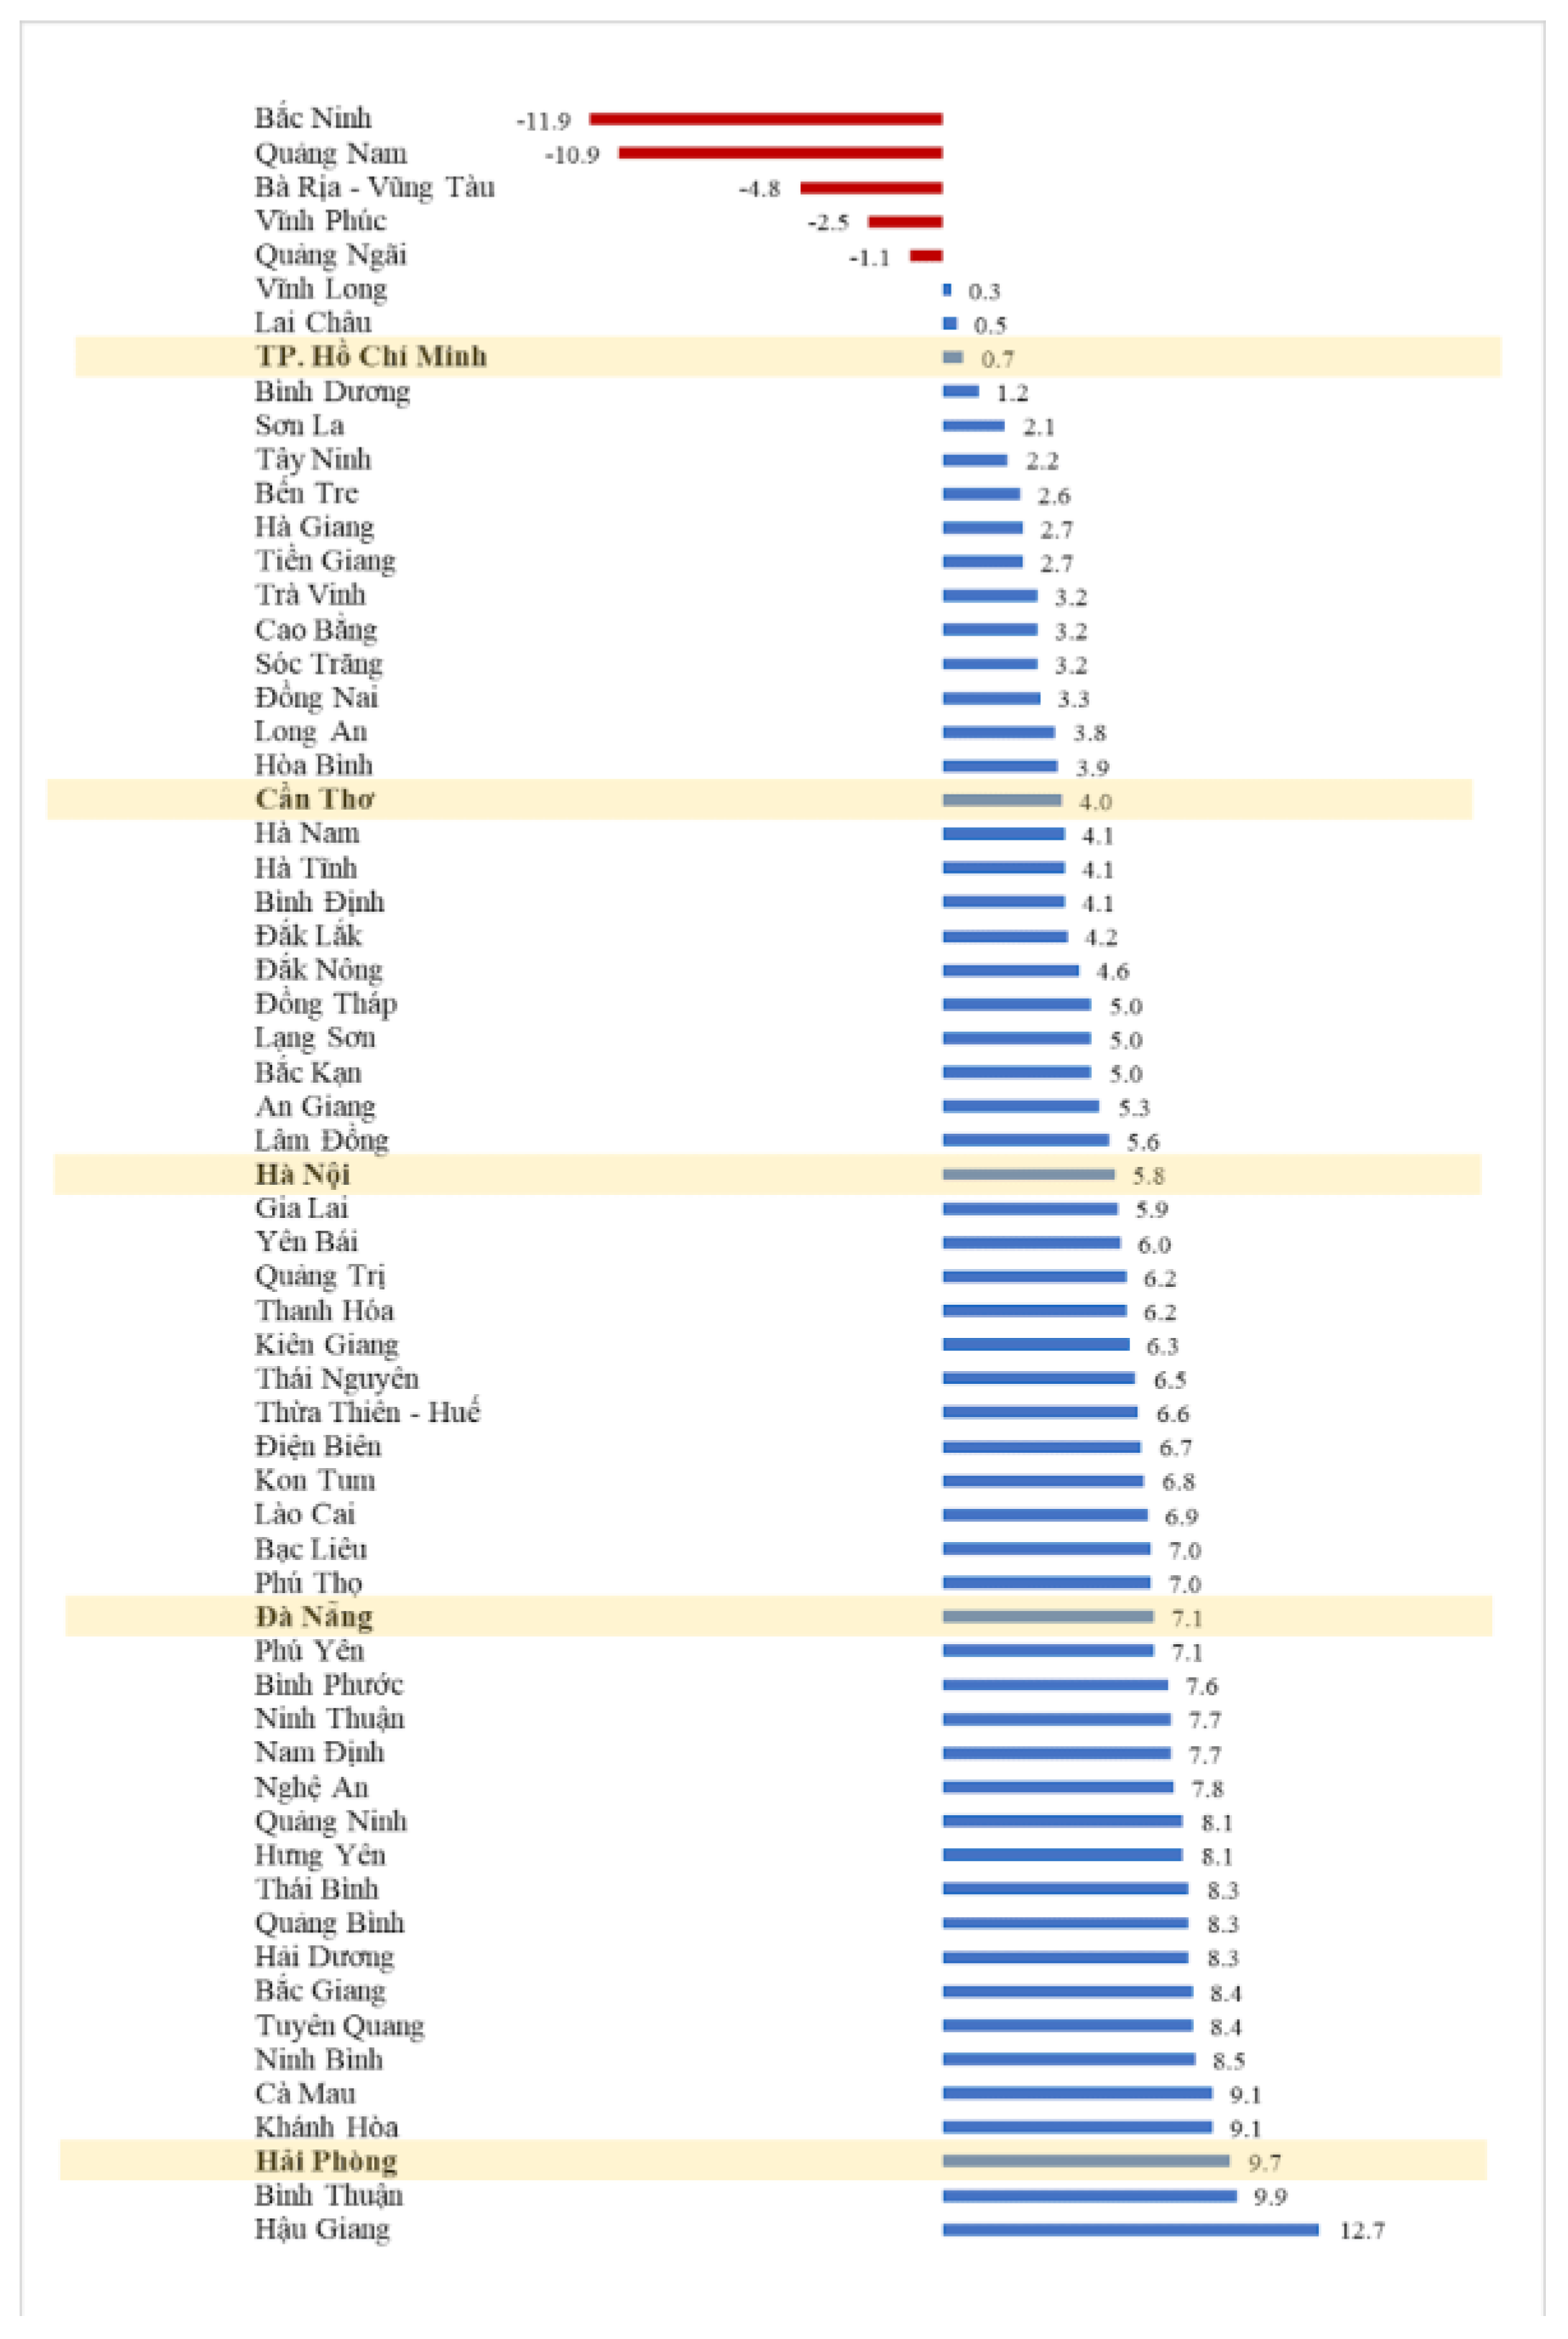
Appendix A shows the quarterly GDP growth rate of Vietnam’s provinces in Quarter 1, 2023, from which the time-series data collected from online job postings and analyzed by kernel density estimation shall show a correct and relevant prediction for the logistics market for the near future. Danang, Can Tho, Haiphong, Hanoi, and other cities in Vietnam saw an increasing density of higher wage levels from the fourth quarter of 2022 to the first quarter of 2023. Ho Chi Minh City’s lower logistics wage in the first quarter of 2023 had a GDP growth rate of just 0.7.
References
- Curtis, D.; Irvine, I. Principles of Microeconomics; Lyryx: Calgary, AB, Canada, 2017. [Google Scholar]
- Hall, R.E. Labor demand, labor supply, and employment volatility. NBER Macroecon. Annu. 1991, 6, 17–47. [Google Scholar] [CrossRef]
- Hamermesh, D.S. Labor Demand and the Structure of Adjustment Costs; National Bureau of Economic Research: Cambridge, MA, USA, 1988. [Google Scholar]
- Drazen, A.; Hamermesh, D.; Obst, N.P. The Variable Employment Elasticity Hypothesis: Theory and Evidence; Foerder Institute for Economic Research, Tel-Aviv University: Tel Aviv, Israel, 1982. [Google Scholar]
- Lawrence, C.; Lawrence, R.Z.; Solow, R.M.; Wachter, M.L. Manufacturing Wage Dispersion: An End Game Interpretation; Brookings Papers on Economic Activity; The Johns Hopkins University Press: Baltimore, MD, USA, 1985; pp. 47–116. [Google Scholar]
- Kilibarda, M.; Pajić, V.; Andrejić, M. Human resources in logistics and supply chains: Current state and trends. Int. J. Traffic Transp. Eng. 2019, 9, 270–279. [Google Scholar]
- BLS. Employment and Wages, Annual Averages. 2019. Available online: https://www.bls.gov/cew/publications/employment-and-wages-annual-averages/2019/home.htm (accessed on 23 April 2023).
- Zeytinoglu, I.U.; Yılmaz, G.; Keser, A.; Inelmen, K.; Uygur, D.; Özsoy, A. Job satisfaction, flexible employment and job security among Turkish service sector workers. Econ. Ind. Democr. 2013, 34, 123–144. [Google Scholar] [CrossRef]
- International Labour Organization. ILO-1 Moniter: COVID-19 and the World of Work, 10th ed.; International Labour Organization: Genève, Switzerland, 2022. [Google Scholar]
- TUIK. Paid Employee Statistics, January 2021. Available online: https://data.tuik.gov.tr/Bulten/Index?p=Ucretli-Calisan-Istatistikleri-Ocak-2021-37498&dil=1 (accessed on 16 April 2023).
- Lund, S.; Madgavkar, A.; Manyika, J.; Smit, S.; Ellingrud, K.; Meaney, M.; Robinson, O. The Future of Work After COVID-19; McKinsey Global Institute: Washington, DC, USA, 2021. [Google Scholar]
- International Labour Organization. ILO-1 Moniter: COVID-19 and the World of Work, 5th ed.; International Labour Organization: Genève, Switzerland, 2020. [Google Scholar]
- International Labour Organization. ILO-1 Moniter: COVID-19 and the World of Work, 4th ed.; International Labour Organization: Genève, Switzerland, 2020. [Google Scholar]
- Autor, D.H. Why are there still so many jobs? The history and future of workplace automation. J. Econ. Perspect. 2015, 29, 3–30. [Google Scholar] [CrossRef]
- D’Amuri, F.; Marcucci, J. Google it!’ Forecasting the US Unemployment Rate with a Google Job Search Index; FEEM Working Paper No. 31.2010; Fondazione Eni Enrico Mattei: Milan, Italy, 2010. [Google Scholar]
- Askitas, N.; Zimmermann, K.F. The internet as a data source for advancement in social sciences. Int. J. Manpow. 2015, 36, 2–12. [Google Scholar] [CrossRef]
- Goldfarb, A.; Taska, B.; Teodoridis, F. Could machine learning be a general purpose technology? a comparison of emerging technologies using data from online job postings. Res. Policy 2023, 52, 104653. [Google Scholar] [CrossRef]
- Chianella, D.; Latini, G.; Lucarelli, A.; Matera, E.; Sorrentino, M. Italian job vacancy rate flash estimates: Revisions and cyclical signal capturing. Riv. Ital. Di Econ. Demogr. E Stat. 2018, 72, 149–158. [Google Scholar]
- Sargent, T.J. Estimation of dynamic labor demand schedules under rational expectations. J. Political Econ. 1978, 86, 1009–1044. [Google Scholar] [CrossRef]
- Bewley, T.F. Why Wages Don’t Fall During a Recession; Harvard University Press: Cambridge, MA, USA, 1999. [Google Scholar]
- Kaur, S. Nominal wage rigidity in village labor markets. Am. Econ. Rev. 2019, 109, 3585–3616. [Google Scholar] [CrossRef]
- Prasad, M.E.; Keane, M.M.P. The Employment and Wage Effects of Oil Price Changes: A Sectoral Analysis; International Monetary Fund: Washington, DC, USA, 1995. [Google Scholar]
- Edakhlon, S.; Mohan, P.; Pillai, G.S.; Verma, L.; Honavar, S.G.; Sharma, N.; Nadaraj, A. Impact of COVID-19 pandemic on income and opportunities of ophthalmologists in India: Ophthalmologists’ Workplace Expectations and Satisfaction Survey (OWESS) Report 1. Indian J. Ophthalmol. 2021, 69, 2189–2194. [Google Scholar] [CrossRef]
- Marinescu, I.E.; Skandalis, D.; Zhao, D. Job Search, Job Posting and Unemployment Insurance During the COVID-19 Crisis. Available online: https://ssrn.com/abstract=3664265 (accessed on 30 July 2020).
- Daniya, R.; Iftikhar, H.; Mehmood, K.; Ahmad, M. Regional labor market forecasting: A skill-set approach. Appl. Econ. 2015, 47, 3009–3020. [Google Scholar]
- Deming, D.J. The growing importance of social skills in the labor market. Q. J. Econ. 2017, 132, 1593–1640. [Google Scholar] [CrossRef]
- Edin, P.; Fredriksson, P.; Nybom, M.; Öckert, B. The Rising Return to Non-Cognitive Skill; IZA DP No. 10914; IZA Institute of Labor Economics: Bonn, Germany, 2017. [Google Scholar]
- Taber, C.; Roys, N. Skill Prices, Occupations and Changes in the Wage Structure; University of Wisconsin Madison: Madison, WI, USA, 2017; Available online: https://red-files-public.s3.amazonaws.com/meetpapers/2017/paper_208.pdf (accessed on 25 May 2024).
- Cortes, G.M. Where have the middle-wage workers gone? A study of polarization using panel data. J. Labor Econ. 2016, 34, 63–105. [Google Scholar] [CrossRef]
- Böhm, M.J.; Metzger, D.; Strömberg, P. ‘Since You’re So Rich, You Must Be Really Smart’: Talent and the Finance Wage Premium. Finance Working Paper No. 553/2018. 2018. Available online: https://papers.ssrn.com/sol3/papers.cfm?abstract_id=2780367 (accessed on 10 June 2025).
- Hershbein, B.; Kahn, L.B. Is College the New High School? Evidence from Vacancy Postings. Available online: https://www.sole-jole.org/assets/docs/15553.pdf (accessed on 9 July 2023).
- Kuhn, P.; Skuterud, M. Internet job search and unemployment durations. Am. Econ. Rev. 2004, 94, 218–232. [Google Scholar] [CrossRef]
- Kuhn, P.; Mansour, H. Is internet job search still ineffective? Econ. J. 2014, 124, 1213–1233. [Google Scholar] [CrossRef]
- Perry, M.J.; Thomas, D.A. Job search channels, neighborhood effects, and wage outcomes. J. Labor Econ. 2017, 35, S267–S302. [Google Scholar]
- Dörfler, L.; Van de Werfhorst, H.G. Employers’demand for qualifications and skills: Increased merit selection in Austria, 1985–2005. Eur. Soc. 2014, 11, 697–721. [Google Scholar] [CrossRef]
- Fondeur, Y.; Karamé, F. Can Google data help predict French youth unemployment? Econ. Model. 2013, 30, 117–125. [Google Scholar] [CrossRef]
- Mytna Kurekova, L.; Beblavy, M.; Thum, A.E. Using Internet Data to Analyse the Labour Market: A Methodological Enquiry; IZA Institute of Labor Economics: Bonn, Germany, 2014. [Google Scholar]
- Sirisuriya, D.S. A Comparative Study on Web Scraping. In Proceedings of the 8th International Research Conference, Rathmalana, Sri Lanka, 27–28 August 2015; pp. 135–140. Available online: http://ir.kdu.ac.lk/bitstream/handle/345/1051/com-059.pdf?sequence=1&isAllowed=y (accessed on 17 January 2024).
- Konings, J.; Vanormelingen, S. The impact of training on productivity and wages: Firm-level evidence. Rev. Econ. Stat. 2015, 97, 485–497. [Google Scholar] [CrossRef]
- Topalova, P. Factor immobility and regional impacts of trade liberalization: Evidence on poverty from India. Am. Econ. J. Appl. Econ. 2010, 2, 1–41. [Google Scholar] [CrossRef]
- McCaig, B.; Pavcnik, N. Export markets and labor allocation in a low-income country. Am. Econ. Rev. 2018, 108, 1899–1941. [Google Scholar] [CrossRef]
- Rea, D.; Maloney, T. Nowcasting the Current Rate of Unemployment Using Administrative Data; Reserve Bank of New Zealand Analytical Note Series; Centre for Social Data Analytics: Auckland, New Zealand, 2021; pp. 8–10. [Google Scholar]
- Vietnamworks. Which Industries Have Increased Recruitment Demand in Vietnam? 2023. Available online: https://www.vietnamworks.com/hrinsider/vietnamworks-phat-hanh-bao-cao-thuc-trang-nhan-su-nganh-san-xuat-2023.html (accessed on 23 September 2023).
- ManpowerGroup. Total Workforce Index 2022 Global Analysis. 2023. Available online: https://www.manpowergroup.ie/blog/2022/12/the-total-workforce-index-2022-download-the-results?source=google.com (accessed on 25 September 2023).
- Stigum, B.P. Revealed Preference—A Proof of Houthakker’s Theorem. Econom. J. Econom. Soc. 1973, 41, 411–423. [Google Scholar] [CrossRef]
- Heckscher, E.; Ohlin, B. The effect of foreign trade on the distribution of income. Economica 1930, 1, 386–405. [Google Scholar]
- Nguyen, Q.H.; Le, H.M.H.; Tran, H.D.K.; Tran, T.Y.N.; Tran, D.L. Wage Prediction Using Simple Moving Average And Exponential Smoothing: Case of Logistics Online Job Postings. J. Int. Econ. Manag. 2024, 163, 1–18. [Google Scholar]
- Mincer, J. Investment in human capital and personal income distribution. J. Political Econ. 1958, 66, 281–302. [Google Scholar] [CrossRef]
- Latecki, L.J.; Lazarevic, A.; Pokrajac, D. Outlier Detection with Kernel Density Functions. In The International Workshop on Machine Learning and Data Mining in Pattern Recognition; Springer: Berlin/Heidelberg, Germany, 2007. [Google Scholar]
- Węglarczyk, S. Kernel Density Estimation and Its Application. In ITM Web of Conferences; EDP Sciences: Les Ulis, France, 2018. [Google Scholar]
- Bok, B.; Caratelli, D.; Giannone, D.; Sbordone, A. Nowcasting with daily data. J. Monet. Econ. 2018, 96, 105–122. [Google Scholar]
- Aastveit, K.A.; Nakajima, J.; Plazzi, A. Dynamic factor models for forecasting and nowcasting in large macroeconomic panels. J. Appl. Econom. 2014, 29, 529–553. [Google Scholar]
- Draper, N.R.; Smith, H. Applied Regression Analysis; John Wiley and Sons: New York, NY, USA, 1981; Volume 407. [Google Scholar]
- Montgomery, D.C.; Peck, E.A.; Vining, G.G. Introduction to Linear Regression Analysis; John Wiley & Sons: Hoboken, NJ, USA, 2021. [Google Scholar]
- Breiman, L.; Friedman, J.; Stone, C.J.; Olshen, R.A. Classification and Regression Trees; CRC Press: Boca Raton, FL, USA, 1984. [Google Scholar]
- Quinlan, J.R. Induction of decision trees. Mach. Learn. 1986, 1, 81–106. [Google Scholar] [CrossRef]
- Murthy, S.K. Automatic construction of decision trees from data: A multi-disciplinary survey. Data Min. Knowl. Discov. 1998, 2, 345–389. [Google Scholar] [CrossRef]
- Hastie, T.; Tibshirani, R.; Friedman, J.H.; Friedman, J.H. The Elements of Statistical Learning: Data Mining, Inference, and Prediction; Springer: Berlin/Heidelberg, Germany, 2009; Volume 2. [Google Scholar]
- Cover, T.; Hart, P. Nearest neighbor pattern classification. IEEE Trans. Inf. Theory 1967, 13, 21–27. [Google Scholar] [CrossRef]
- Witten, I.H.; Frank, E. Data mining: Practical machine learning tools and techniques with Java implementations. Acm Sigmod Record 2002, 31, 76–77. [Google Scholar] [CrossRef]
- Tran, H.D.K.; Tran, T.Y.N.; Tran, D.L.; Nguyen, Q.H.; Le, H.M.H. Logistics Job Skill Sets: Exploiting the Logistics online Job Postings. FTU Work. Pap. Ser. 2024, 1. Available online: https://fwps.ftu.edu.vn/2024/03/21/bo-ky-nang-trong-cong-viec-logistics-khai-thac-cac-tin-tuyen-dung-truc-tuyen-nganh-logistics/ (accessed on 25 April 2024).
- Štefánik, M. Internet job search data as a possible source of information on skills demand (with results for Slovak university graduates). In Building on Skills Forecasts—Comparing Methods and Applications; Publications Office of the European Union: Luxembourg, 2012; Volume 246, pp. 246–260. [Google Scholar]
- Anderson, E.T.; Simester, D.I. Reviews without a purchase: Low ratings, loyal customers, and deception. J. Mark. Res. 2014, 51, 249–269. [Google Scholar] [CrossRef]
- Krotov, V.; Tennyson, M. Research note: Scraping financial data from the web using the R language. J. Emerg. Technol. Account. 2018, 15, 169–181. [Google Scholar] [CrossRef]
- Zervas, G.; Proserpio, D.; Byers, J.W. The rise of the sharing economy: Estimating the impact of Airbnb on the hotel industry. J. Mark. Res. 2017, 54, 687–705. [Google Scholar] [CrossRef]
- Datta, H.; Knox, G.; Bronnenberg, B.J. Changing their tune: How consumers’ adoption of online streaming affects music consumption and discovery. Mark. Sci. 2018, 37, 5–21. [Google Scholar] [CrossRef]
- Trusov, M.; Ma, L.; Jamal, Z. Crumbs of the cookie: User profiling in customer-base analysis and behavioral targeting. Mark. Sci. 2016, 35, 405–426. [Google Scholar] [CrossRef]
- Becker, G.S. Human Capital: A Theoretical and Empirical Analysis, with Special Reference to Education; University of Chicago Press: Chicago, IL, USA, 1967. [Google Scholar]
- Miller, R.D. The relation of wages to age and education. Rev. Econ. Stat. 1955, 37, 72–75. [Google Scholar]
- OECD Inflation (CPI). Available online: https://data.oecd.org/price/inflation-cpi.htm (accessed on 14 June 2023).
- Socio-Economic Situation Report in the First Quarter of 2023; Ministry of Planning and Investment General Statistics Office: Hanoi, Vietnam, 2023.
Disclaimer/Publisher’s Note: The statements, opinions and data contained in all publications are solely those of the individual author(s) and contributor(s) and not of MDPI and/or the editor(s). MDPI and/or the editor(s) disclaim responsibility for any injury to people or property resulting from any ideas, methods, instructions or products referred to in the content. |
© 2025 by the authors. Licensee MDPI, Basel, Switzerland. This article is an open access article distributed under the terms and conditions of the Creative Commons Attribution (CC BY) license (https://creativecommons.org/licenses/by/4.0/).