
Leveraging Data Science for Impactful Logistics Automatons in the E-Commerce Sector †


Abstract
1. Introduction
2. Background on the Used Data Science Techniques
3. Case Study: European E-Commerce Warehouses
4. Impact of Logistics Automatons: Correlation and Regression Analyses
4.1. Dataset Description and Implementation Details
- Sector: name of the sector that gathers a specific type of handled product [string].
- Month: ID of the month during which a number of items are sent per sector [integer].
- Sent items: number of sent items in a sector within a given month [integer].
- Consumable costs: expenses related to the consumption of supplies and materials such as packaging, labels, pallets, etc. [float].
- Non-consumable costs: expenses that encompass rent, energy, automatons maintenance, human labor, etc. [float].
- “Put-to-the-light system for mono SKU sorting”; “KNAPP”; “JIVARO”; “Outbound transitic & sorting solution for parcels”; “Outbound transitic & sorting solution for bags”; “Bombay & Tilt-Tray”; “SAVOYE Loop”; “Transitic for parcel handling”; “Automated bag packing & sorting”; and “TGW Parcel Sorter”: ID of each automaton (1 = used in a given warehouse, 0 = not used) [integer].
4.2. Data Science Approach and Experimental Results
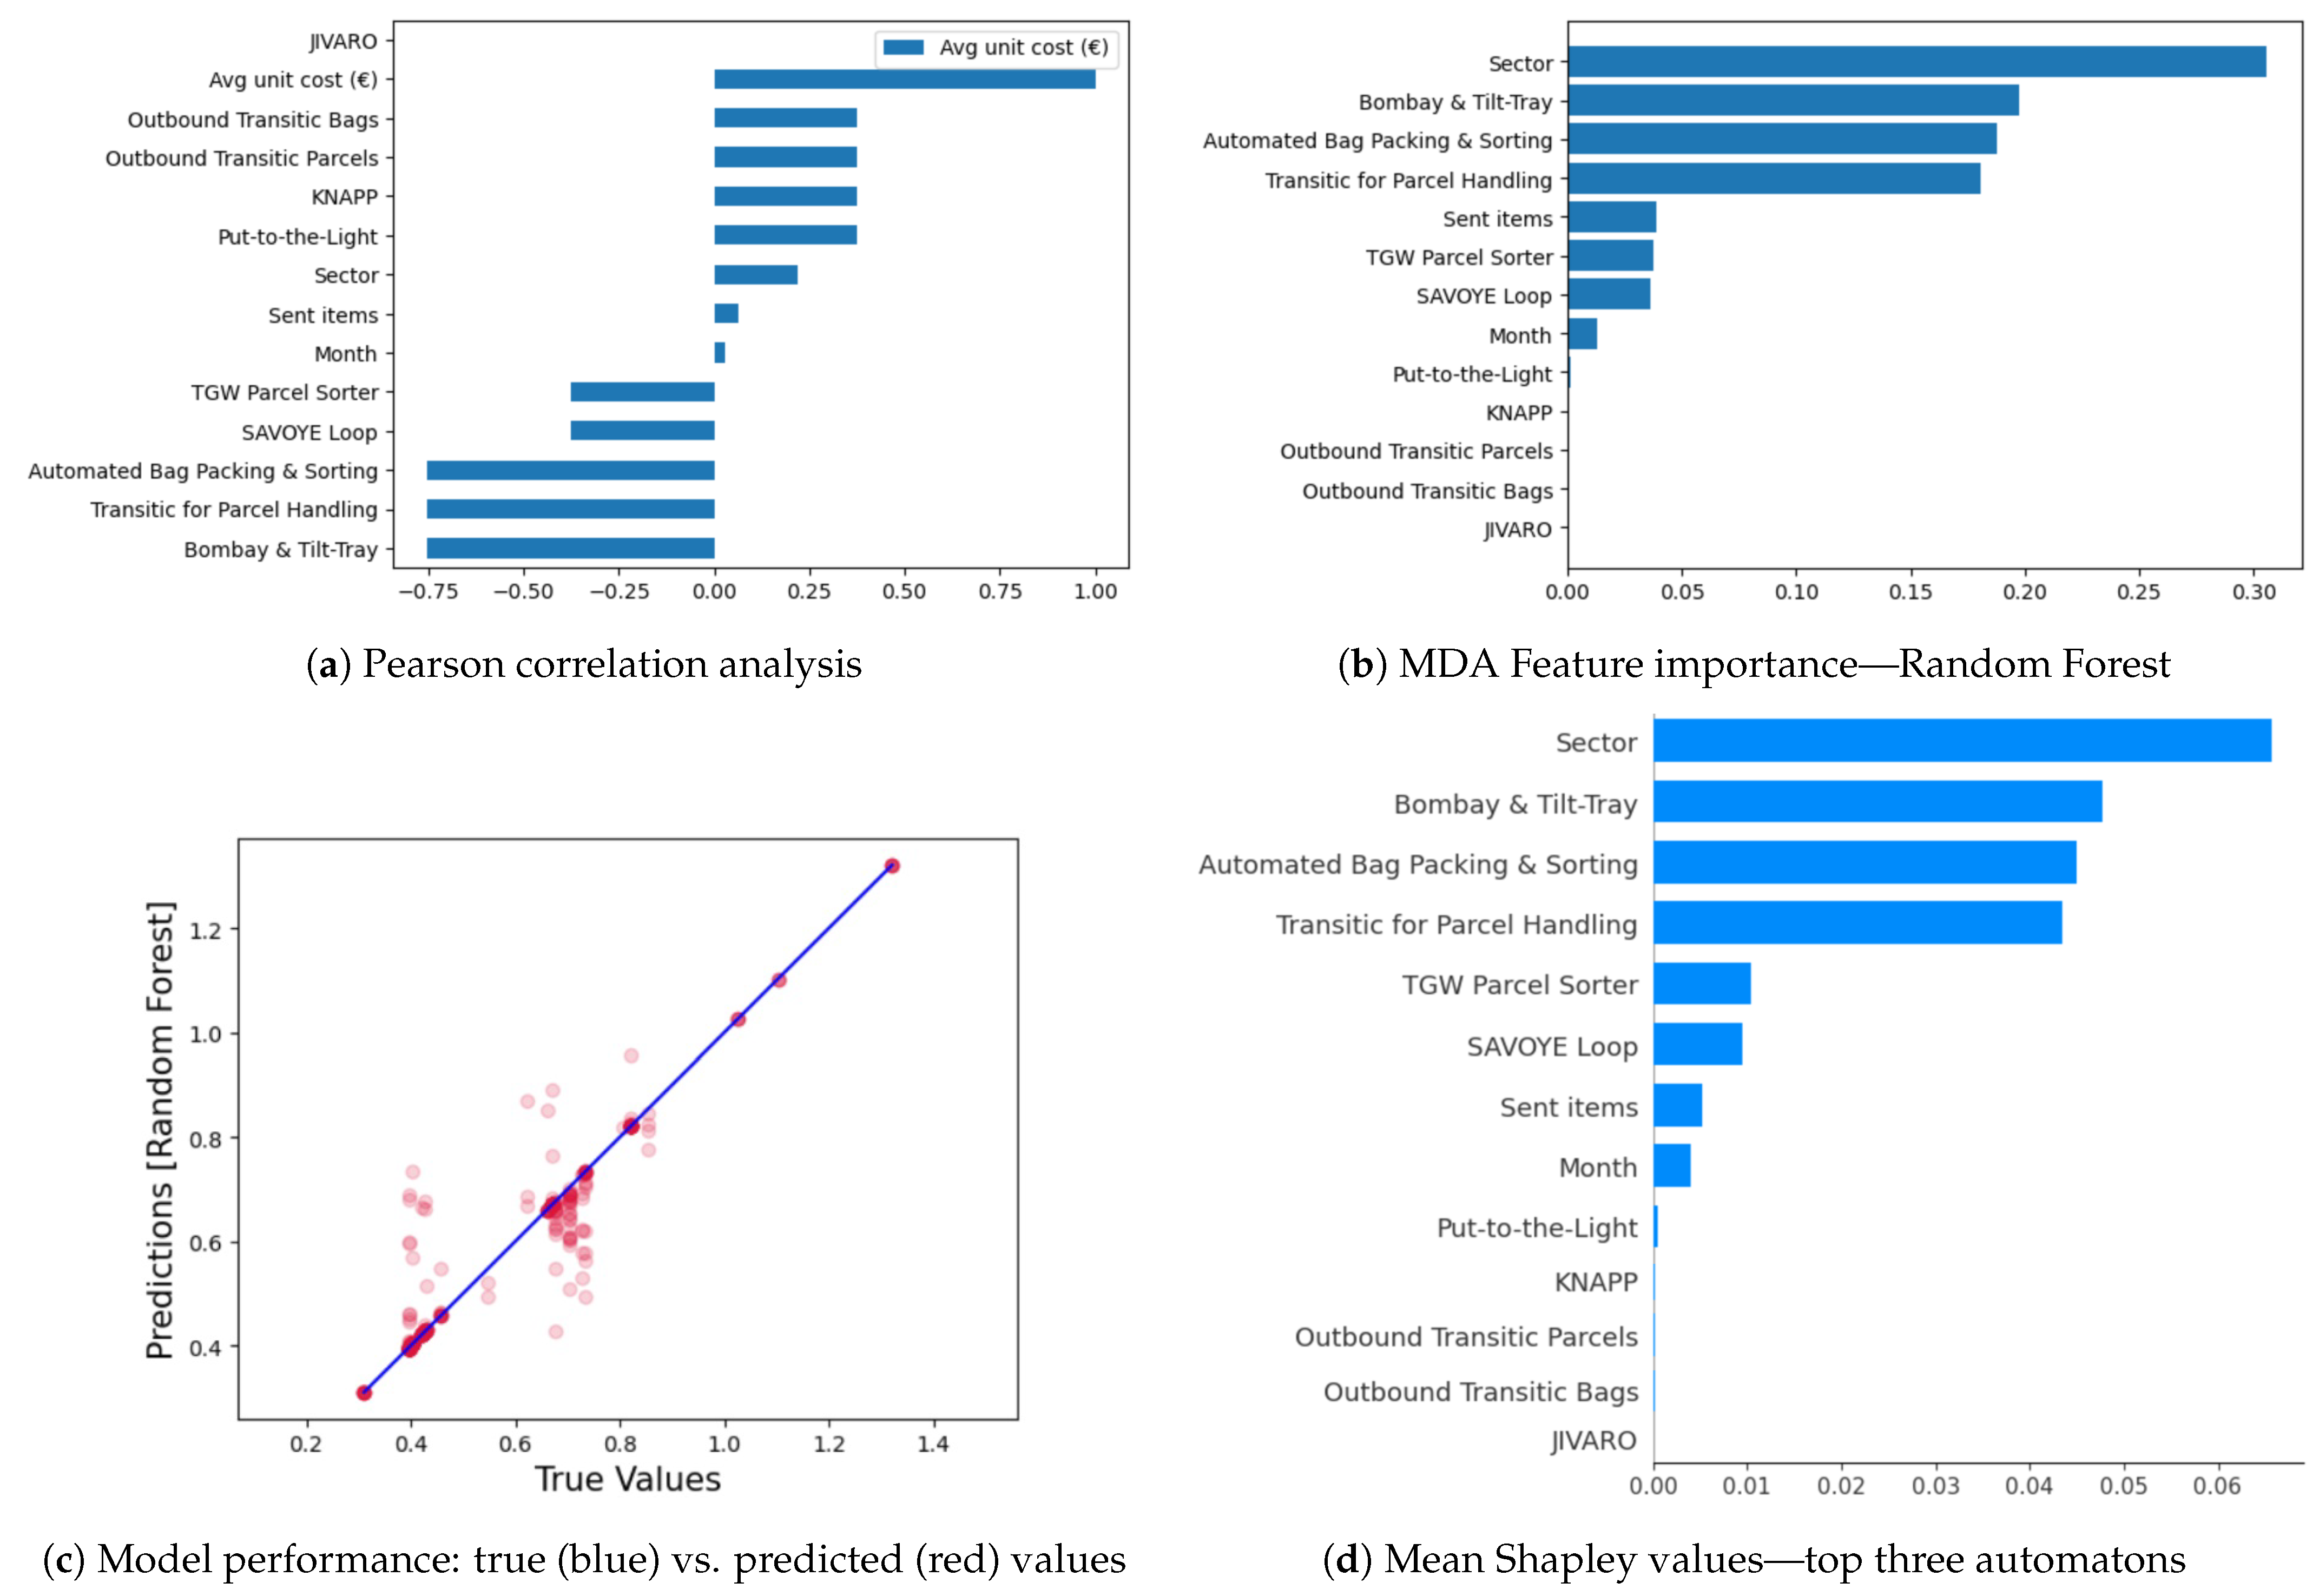
- Exploratory data analysis: we started by cleaning the dataset, structuring its features, and making sure there were no missing values, in order to make statistical summaries of the data distribution. We also performed data visualization to determine tendencies or patterns that might indicate interesting relationships or insights. We performed a Pearson correlation [15] analysis to examine relationships between variables and identify which were strongly or weakly correlated. Accordingly, we looked for the automatons that had a strong negative correlation with the average unit cost, since we sought to reduce it. Figure 3a shows that these three automatons were (n°1) Bombay & Tilt-Tray, (n°2) Transitic for Parcel Handling, and (n°3) Automated Bag Packing & Sorting, represented with a correlation coefficient of −0.75. Hence, they were the most impactful automatons on the cost reduction. Needless to say, the JIVARO machine contributes significantly to time and cost reductions. Since it is used within all the warehouses, its impact was not considered in our analysis.
- Data pre-processing: We made sure the data were completely clean for the next steps and contained solely the features that were relevant to our analysis (e.g., no irrelevant temporal data in our case, etc.). The features and the label were separated for the prediction, and then the data were split into two sets: training (80%) and test (20%) sets. We converted categorical variables into dummies with one-hot encoding for ML models, manipulating solely numerical variables, and then we normalized or standardized the data if needed.
- Model building and training: The label to predict was a continuous numerical feature, which led us to create regression models that were able to map the features to the continuous target label. Thus, we created, trained, and launched predictions with the following regression models: LinearRegression, DecisionTreeRegressor, RandomForestRegressor, XGBRegressor, AdaBoostRegressor, CatBoostRegressor, and Artificial Neural Network (ANN) [17]. Afterwards, we set up the algorithm hyperparameters and launched the learning process on the training data.
- Model evaluation: We launched the predictions on the test data and then we compared the predictions with the actual values. We selected Root Mean Squared Error (RMSE) as the performance metric to evaluate the models. We noticed that the RandomForestRegressor had the lowest RMSE and performed the best among the models, hence we selected it for our subsequent steps. As seen in Figure 3c, we illustrated the model’s performance by comparing the predicted values with the true one. The blue diagonal line represents perfect predictions, while the red dots represent the actual predictions. Dots on the diagonal indicate correct predictions and scattered dots show prediction errors. We used this model to measure the Mean Decrease in Accuracy in Figure 3b, which depicts the decrease in the model’s accuracy score whenever the related feature was removed. This demonstrates the feature’s importance regarding the decrease in the average unit cost. It is logical to expect that this cost can be greatly impacted by the type of products being handled in each sector. In each sector, we have varying products requirements, handling complexities, and storage needs, which can affect the overall operations cost. Larger or heavier products may require specialized automatons or additional handling efforts, which can increase the cost per unit compared to smaller and lighter items within each sector. Figure 3b shows that this cost was also influenced by three logistics automatons: (n°1) Bombay & Tilt-Tray, (n°2) Automated Bag Packing & Sorting, and (n°3) Transitic for Parcel Handling.
- Game theory value-based feature importance: We used the Shap [34] interpretation to grasp the importance of each feature. We computed the Shapley values to assess the predictions of the random forest model, as shown in Figure 3d. As expected, the sector feature took first place, followed by the three automatons: (n°1) Bombay & Tilt-Tray, (n°2) Automated Bag Packing & Sorting, and (n°3) Transitic for Parcel Handling. These are the exact same logistics automatons that stood out before, which consolidates the previous results.
5. Related Work: Data Science for Strategic Decision Making in Supply Chain Contexts
6. Conclusions and Future Work
Author Contributions
Funding
Institutional Review Board Statement
Informed Consent Statement
Data Availability Statement
Conflicts of Interest
References
- Kawa, A.; Swiatowiec-Szczepanska, J. Logistics as a value in e-commerce and its influence on satisfaction in industries: A multilevel analysis. J. Bus. Ind. Mark. 2021, 36, 220–235. [Google Scholar] [CrossRef]
- Cooke, J.A. Inventory velocity accelerates. Logist. Manag. 2002, 42, 8–33. [Google Scholar]
- iCepts. Optimizing Warehouse ROI: Automating Warehouse Processes for a Greater Return on Investment; Technical Report; iCepts Technology Group, Inc.: Middletown, PA, USA, 2011. [Google Scholar]
- Kumar, S.; Narkhede, B.E.; Jain, K. Revisiting the warehouse research through an evolutionary lens: A review from 1990 to 2019. Int. J. Prod. Res. 2021, 59, 3470–3492. [Google Scholar] [CrossRef]
- Kembro, J.; Norrman, A. The transformation from manual to smart warehousing: An exploratory study with Swedish retailers. Int. J. Logist. Manag. 2022, 33, 107–135. [Google Scholar] [CrossRef]
- van Geest, M.; Tekinerdogan, B.; Catal, C. Design of a reference architecture for developing smart warehouses in industry 4.0. Comput. Ind. 2021, 124, 103343. [Google Scholar] [CrossRef]
- Brzezinski, L. Robotic Process Automation in Logistics—A Case Study of a Production Company. Eur. Res. Stud. J. 2022, XXV, 307–315. [Google Scholar] [CrossRef]
- Andiyappillai, N. An Analysis of the Impact of Automation on Supply Chain Performance in Logistics Companies. IOP Conf. Ser. Mater. Sci. Eng. 2021, 1055, 012055. [Google Scholar] [CrossRef]
- Awaysheh, A. Leveraging Data Science to Enhance Your Supply Chain and Improve your Company’s Performance. 2020. Available online: https://www.ascm.org/globalassets/ascm_website_assets/docs/leveraging-data-science-to-enhance-your-supply-chain-and-improve-your-companys-performance.pdf (accessed on 12 June 2025).
- McAfee, A.; Brynjolfsson, E. Big Data: The Management Revolution. Harvard Bus. Rev. 2012, 90, 61–67. [Google Scholar]
- Bentalha, B. Big-Data and Service Supply chain management: Challenges and opportunities. Int. J. Bus. Technol. Stud. Res. 2020, 1, 1–9. [Google Scholar] [CrossRef]
- Chiaraviglio, A.; Grimaldi, S.; Zenezini, G.; Rafele, C. Overall Warehouse Effectiveness (OWE): A New Integrated Performance Indicator for Warehouse Operations. Logistics 2025, 9, 7. [Google Scholar] [CrossRef]
- Sutton, R.S. Learning to Predict by the Methods of Temporal Differences; Kluwer Academic Publishers: Dordrecht, The Netherlands, 1988; pp. 9–44. [Google Scholar]
- Biernat, E.; Lutz, M. Data Science: Fondamentaux et études de cas; EYROLLES: Paris, France, 2015. [Google Scholar]
- Benesty, J.; Chen, J.; Huang, Y.; Cohen, I. Pearson correlation coefficient. In Noise Reduction in Speech Processing; Springer: Berlin/Heidelberg, Germany, 2009; pp. 37–40. [Google Scholar]
- Sarstedt, M.; Mooi, E. Regression Analysis. In A Concise Guide to Market Research, Springer Texts in Business and Economics; Springer: Berlin/Heidelberg, Germany, 2014. [Google Scholar]
- Géron, A. Hands-on Machine Learning with Scikit-Learn, Keras & Tensorflow. Concepts, Tools, and Techniques to Build Intelligent Systems; O’REILLY: Springfield, MO, USA, 2023. [Google Scholar]
- Bénard, C.; da Veiga, S.; Scornet, E. MDA for random forests: Inconsistency, and a practical solution via the Sobol-MDA. arXiv 2022, arXiv:2102.13347. [Google Scholar]
- Shapley, L.S. A Value for n-Person Games. In Contributions to the Theory of Games II; Kuhn, H.W., Tucker, A.W., Eds.; Princeton University Press: Princeton, NJ, USA, 1953; pp. 307–317. [Google Scholar]
- Peleg, B.; Sudhölter, P. Introduction to the Theory of Cooperative Games, 2nd ed.; Theory and Decision Library C; Springer: Berlin/Heidelberg, Germany, 2007; Volume 34. [Google Scholar]
- Shapley Values—Github. 2025. Available online: https://christophm.github.io/interpretable-ml-book/shapley.html (accessed on 12 June 2025).
- Baker, P.; Halim, Z. An exploration of warehouse automation implementations: Cost, service and flexibility issues. Supply Chain Manag. Int. J. 2007, 12, 129–138. [Google Scholar] [CrossRef]
- NumPy. 2025. Available online: https://numpy.org/ (accessed on 12 June 2025).
- Pandas. 2025. Available online: https://pandas.pydata.org/ (accessed on 12 June 2025).
- Matplotlib: Visualization with Python. 2025. Available online: https://matplotlib.org/ (accessed on 12 June 2025).
- Seaborn: Statistical Data Visualization. 2025. Available online: https://seaborn.pydata.org/ (accessed on 12 June 2025).
- Scikit-Learn. 2025. Available online: https://scikit-learn.org/stable/ (accessed on 12 June 2025).
- XGBoost Documentation. 2025. Available online: https://xgboost.readthedocs.io/en/stable/ (accessed on 12 June 2025).
- CatBoost. 2025. Available online: https://catboost.ai/ (accessed on 12 June 2025).
- Rfpimp. 2025. Available online: https://pypi.org/project/rfpimp/ (accessed on 12 June 2025).
- SHAP Documentation. 2025. Available online: https://shap.readthedocs.io/en/latest/ (accessed on 12 June 2025).
- Keras. 2025. Available online: https://www.tensorflow.org/guide/keras?hl=fr (accessed on 12 June 2025).
- Tensorflow. 2025. Available online: https://www.tensorflow.org/ (accessed on 17 January 2024).
- Shap—Github. 2025. Available online: https://github.com/slundberg/shap (accessed on 12 June 2025).
- Rai, R.; Tiwari, M.K.; Ivanov, D.; Dolgui, A. Machine learning in manufacturing and industry 4.0 applications. Int. J. Prod. Res. 2021, 59, 4773–4778. [Google Scholar] [CrossRef]
- Maheshwari, S.; Gautam, P.; Jaggi, C.K. Role of Big Data Analytics in supply chain management: Current trends and future perspectives. Int. J. Prod. Res. 2021, 59, 1875–1900. [Google Scholar] [CrossRef]
- Cannas, V.G.; Ciano, M.P.; Saltalamacchia, M.; Secchi, R. Artificial intelligence in supply chain and operations management: A multiple case study research. Int. J. Prod. Res. 2024, 62, 3333–3360. [Google Scholar] [CrossRef]
- Alsheyadi, A.; Baawain, A.; Shaukat, M.R. E-supply chain coordination and performance impacts: An empirical investigation. Prod. Manuf. Res. 2024, 12, 2379942. [Google Scholar] [CrossRef]
- Nasiri, M.; Ukko, J.; Saunila, M.; Rantala, T. Managing the digital supply chain: The role of smart technologies. Technovation 2020, 96–97, 102121. [Google Scholar] [CrossRef]
- Sivarajah, U.; Kamal, M.M.; Irani, Z.; Weerakkody, V. Critical analysis of Big Data challenges and analytical methods. J. Bus. Res. 2017, 70, 263–286. [Google Scholar] [CrossRef]
- Lekic, M.; Rogic, K.; Boldizsar, A.; Zoldy, M.; Torok, A. Big Data in Logistics. Period. Polytech. Transp. Eng. 2021, 49, 60–65. [Google Scholar] [CrossRef]


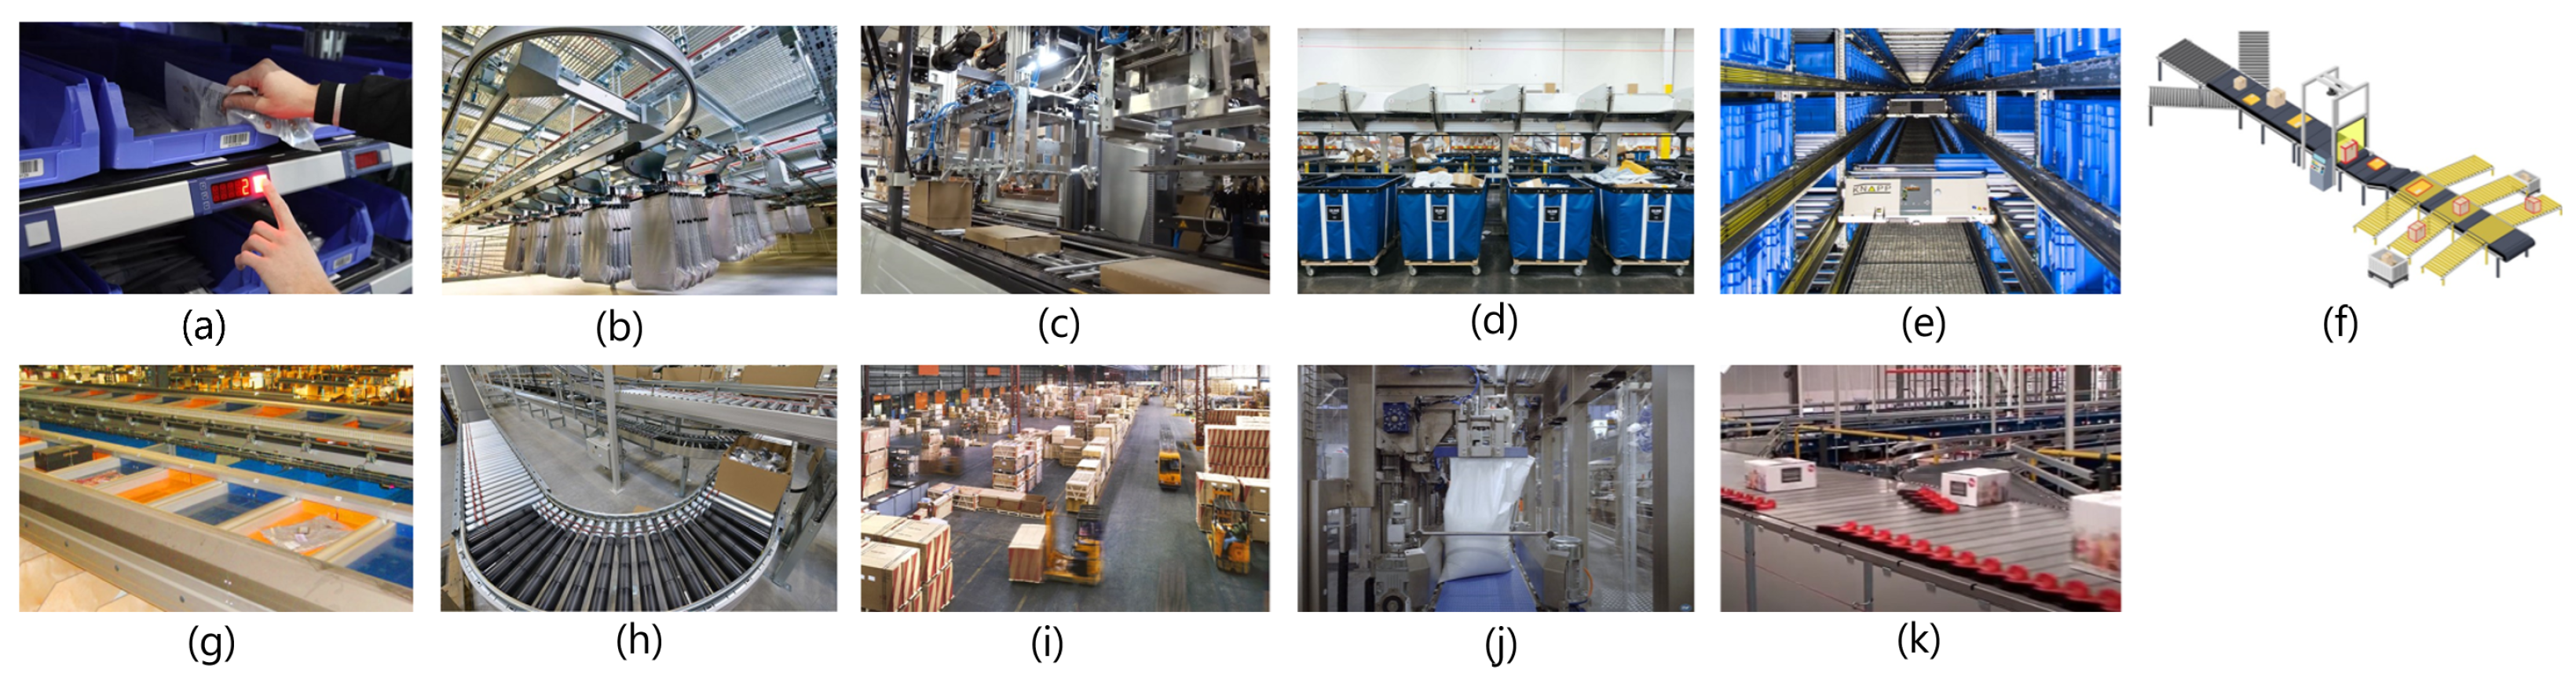
| Automatons | WH 1 | WH 2 | WH 3 |
|---|---|---|---|
| Put-to-the-light system for mono SKU sorting (Figure 1a) | ✓ | ✗ | ✗ |
| KNAPP pocket sorter system (Figure 1b) | ✓ | ✗ | ✗ |
| Automated packing with JIVARO (Figure 1c) | ✓ | ✓ | ✓ |
| Outbound transitic & sorting solution for bags (Figure 1d) | ✓ | ✗ | ✗ |
| OSR (Optical storage & Retrieval) Boxes (Figure 1e) | ✓ | ✗ | ✗ |
| Outbound transitic & sorting solution for parcels (Figure 1f) | ✓ | ✗ | ✗ |
| Bombay & Tilt-Tray item sorter (Figure 1g) | ✗ | ✓ | ✗ |
| SAVOYE Loop system for semi-automatic picking (Figure 1h) | ✗ | ✓ | ✓ |
| Transitic for parcel handling across the warehouse (Figure 1i) | ✗ | ✓ | ✗ |
| Automated bag packing & sorting machinery (Figure 1j) | ✗ | ✓ | ✗ |
| TGW parcel sorter in the shipping area (Figure 1k) | ✗ | ✓ | ✓ |
| Characteristics | |||
| Floor surface in | 30,000 | 20,000 | 30,000 |
| Storage capacity (location units) | 4 k | No limit | 4.8 k |
| Production capacity (items per week) | 285–400 k | >400 k | 200–350 k |
| Picking capacity (reference numbers) | No limit | No limit | No limit |
Disclaimer/Publisher’s Note: The statements, opinions and data contained in all publications are solely those of the individual author(s) and contributor(s) and not of MDPI and/or the editor(s). MDPI and/or the editor(s) disclaim responsibility for any injury to people or property resulting from any ideas, methods, instructions or products referred to in the content. |
© 2025 by the authors. Licensee MDPI, Basel, Switzerland. This article is an open access article distributed under the terms and conditions of the Creative Commons Attribution (CC BY) license (https://creativecommons.org/licenses/by/4.0/).
Share and Cite
Belhaj, N.; Patrix, J.; Oulmakki, O.; Verny, J. Leveraging Data Science for Impactful Logistics Automatons in the E-Commerce Sector. Eng. Proc. 2025, 97, 31. https://doi.org/10.3390/engproc2025097031
Belhaj N, Patrix J, Oulmakki O, Verny J. Leveraging Data Science for Impactful Logistics Automatons in the E-Commerce Sector. Engineering Proceedings. 2025; 97(1):31. https://doi.org/10.3390/engproc2025097031
Chicago/Turabian StyleBelhaj, Nabila, Jérémy Patrix, Ouail Oulmakki, and Jérôme Verny. 2025. "Leveraging Data Science for Impactful Logistics Automatons in the E-Commerce Sector" Engineering Proceedings 97, no. 1: 31. https://doi.org/10.3390/engproc2025097031
APA StyleBelhaj, N., Patrix, J., Oulmakki, O., & Verny, J. (2025). Leveraging Data Science for Impactful Logistics Automatons in the E-Commerce Sector. Engineering Proceedings, 97(1), 31. https://doi.org/10.3390/engproc2025097031