Abstract
This study examines the first systematic documentation of a series of small impact marks on the northern walls of Pompeii, interpreted as the result of Roman metal dart projectiles launched during the Sullan siege in 89 BC. Using high-resolution, reality-based 3D models, comparative analysis, and reverse modeling techniques, the research explores the hypothesis that a distinctive fan-shaped configuration of quadrangular indentations may have been produced by a repeating catapult, known as the polybolos. The integration of close-range photogrammetry, laser scanning, and digital reconstruction tools demonstrates how virtual casts and comparative modeling can contribute to archaeological interpretations of ancient projectile weaponry.
1. Introduction
Aware of the exceptional nature of the archaeological site of ancient Pompeii, the survey activities carried out as part of the SCORPIò-NIDI project were aimed to establish a methodology for classifying the numerous indentations visible along the stretch of the city walls between Vesuvio Gate and Ercolano Gate (Figure 1), which can reasonably be assumed to be of anthropic origin [1].
For the circular or spherical cavities, a first framework for classification was originally proposed by archaeologist Albert William Van Buren in the late 1920s [2]. Based on the diameters of the holes in the stone ashlars and their correlation to the size of the rounded stone projectiles found at the site, the archaeologist interpreted the impact marks as the result of stone balls launched during the siege led by Sulla in 89 BC—primarily causing compressive damage upon impact [2,3] (Figure 2a). A more recent study focusing on lead sling bullets of different calibers [4] has documented a concentration of small-scale elongated ovoidal impacts peppering the area near Porta Ercolano (Figure 2b).
However, when it comes to cavities attributed to metallic dart impacts (Figure 2c), there are no specific studies—only general references to indentations left by catapult projectiles. The study of this category of evidence is more complex. Firstly, the physical and chemical degradation of ferrous materials over time either prevented or severely limited the possibility of recovering arrowheads from the Sullan period left on the field or walls. Moreover, the energy transmitted during the impact with the extrados of the wall, made of Nocera tuff or Sarno limestone [5,6], resulted in splintering the stone and surrounding fragments. As a result, the shape of the ballistic mark can differ substantially from the geometric shape of the original metal arrowhead, making its location and interpretation difficult—especially when considering the cavity-rich texture of the wall’s stone.
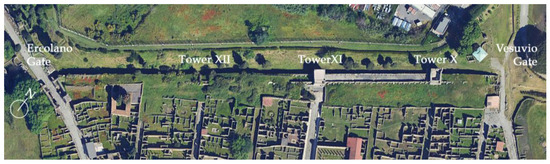
Figure 1.
Study area between Vesuvio and Ercolano Gates, Archaeological Park of Pompeii. Source: Google Earth, year 2023.
Figure 1.
Study area between Vesuvio and Ercolano Gates, Archaeological Park of Pompeii. Source: Google Earth, year 2023.

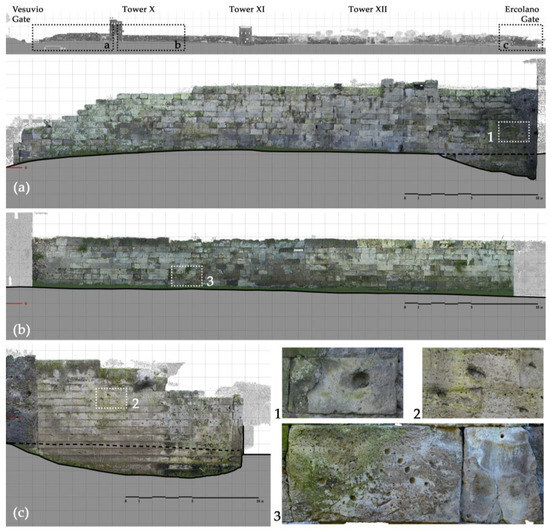
Figure 2.
Orthophotos of the north wall, corresponding enlargements of wall sections (a–c), and examples of ballistic impact marks (1–3). Highlighted areas: (a) segment between Vesuvio Gate and Tower X, (b) wall section west of Tower X, and (c) wall section east of Ercolano Gate—representing the zones most affected by ballistic impacts: (1) stone balls, (2) lead sling bullets, and (3) metal darts.

The study of possible dart impressions therefore presented a challenge to the authors—one that gradually took shape over the course of on-site campaigns. Direct observation of the walls helped to support working hypotheses based on methodologically sound reasoning and provided new elements for discussion—always bearing in mind the inherent uncertainty that characterizes impact marks made by small, pointed weapons such as the metal-tipped darts used by Republican Roman soldiers.
2. Materials and Methods
The investigation focused on examining possible ballistic traces of the Sullan siege still visible along the northern stretch of Pompeii’s city walls, with a strong emphasis on methodological accuracy. Numerous high-resolution 3D datasets were acquired using both image-based and range-based survey techniques. The post-processing phase, typically more time-consuming than on-site acquisition procedures, allowed researchers to overcome the limitations of traditional representation methods such as 2D drawings from direct survey or standard photographic documentation. The point clouds, subsequently meshed and enriched with photometric data, were used to identify, isolate, and extract the most relevant case studies. Specialized software facilitated the transition from visualization to the management of polygonal meshes, enabling the creation of models customized to the specific objectives of the research.
Digital surveying also allowed for the accurate measurement of projectile impact angles on stone surfaces, thanks to terrestrial laser scanning as a general reference for locating case studies. This offers an alternative approach to the so-called graphic error, or approximation, resulting from representations on visual outputs or paper, typically introduced by manual interpretation or by printing devices related to scale [7].
However, not all inaccuracies stem from the instruments themselves [8], and operators may introduce both random and systematic errors [9]. Beyond any holistic theories about the nature of percentage error, in this particular case the correspondence between graphical signs and the physical evidence being examined directly shapes data interpretation by what is represented—and how. Precision is not only a mathematical concept; it also reflects the ability to clearly define the specific portion of reality being analyzed [10] (p. 25).
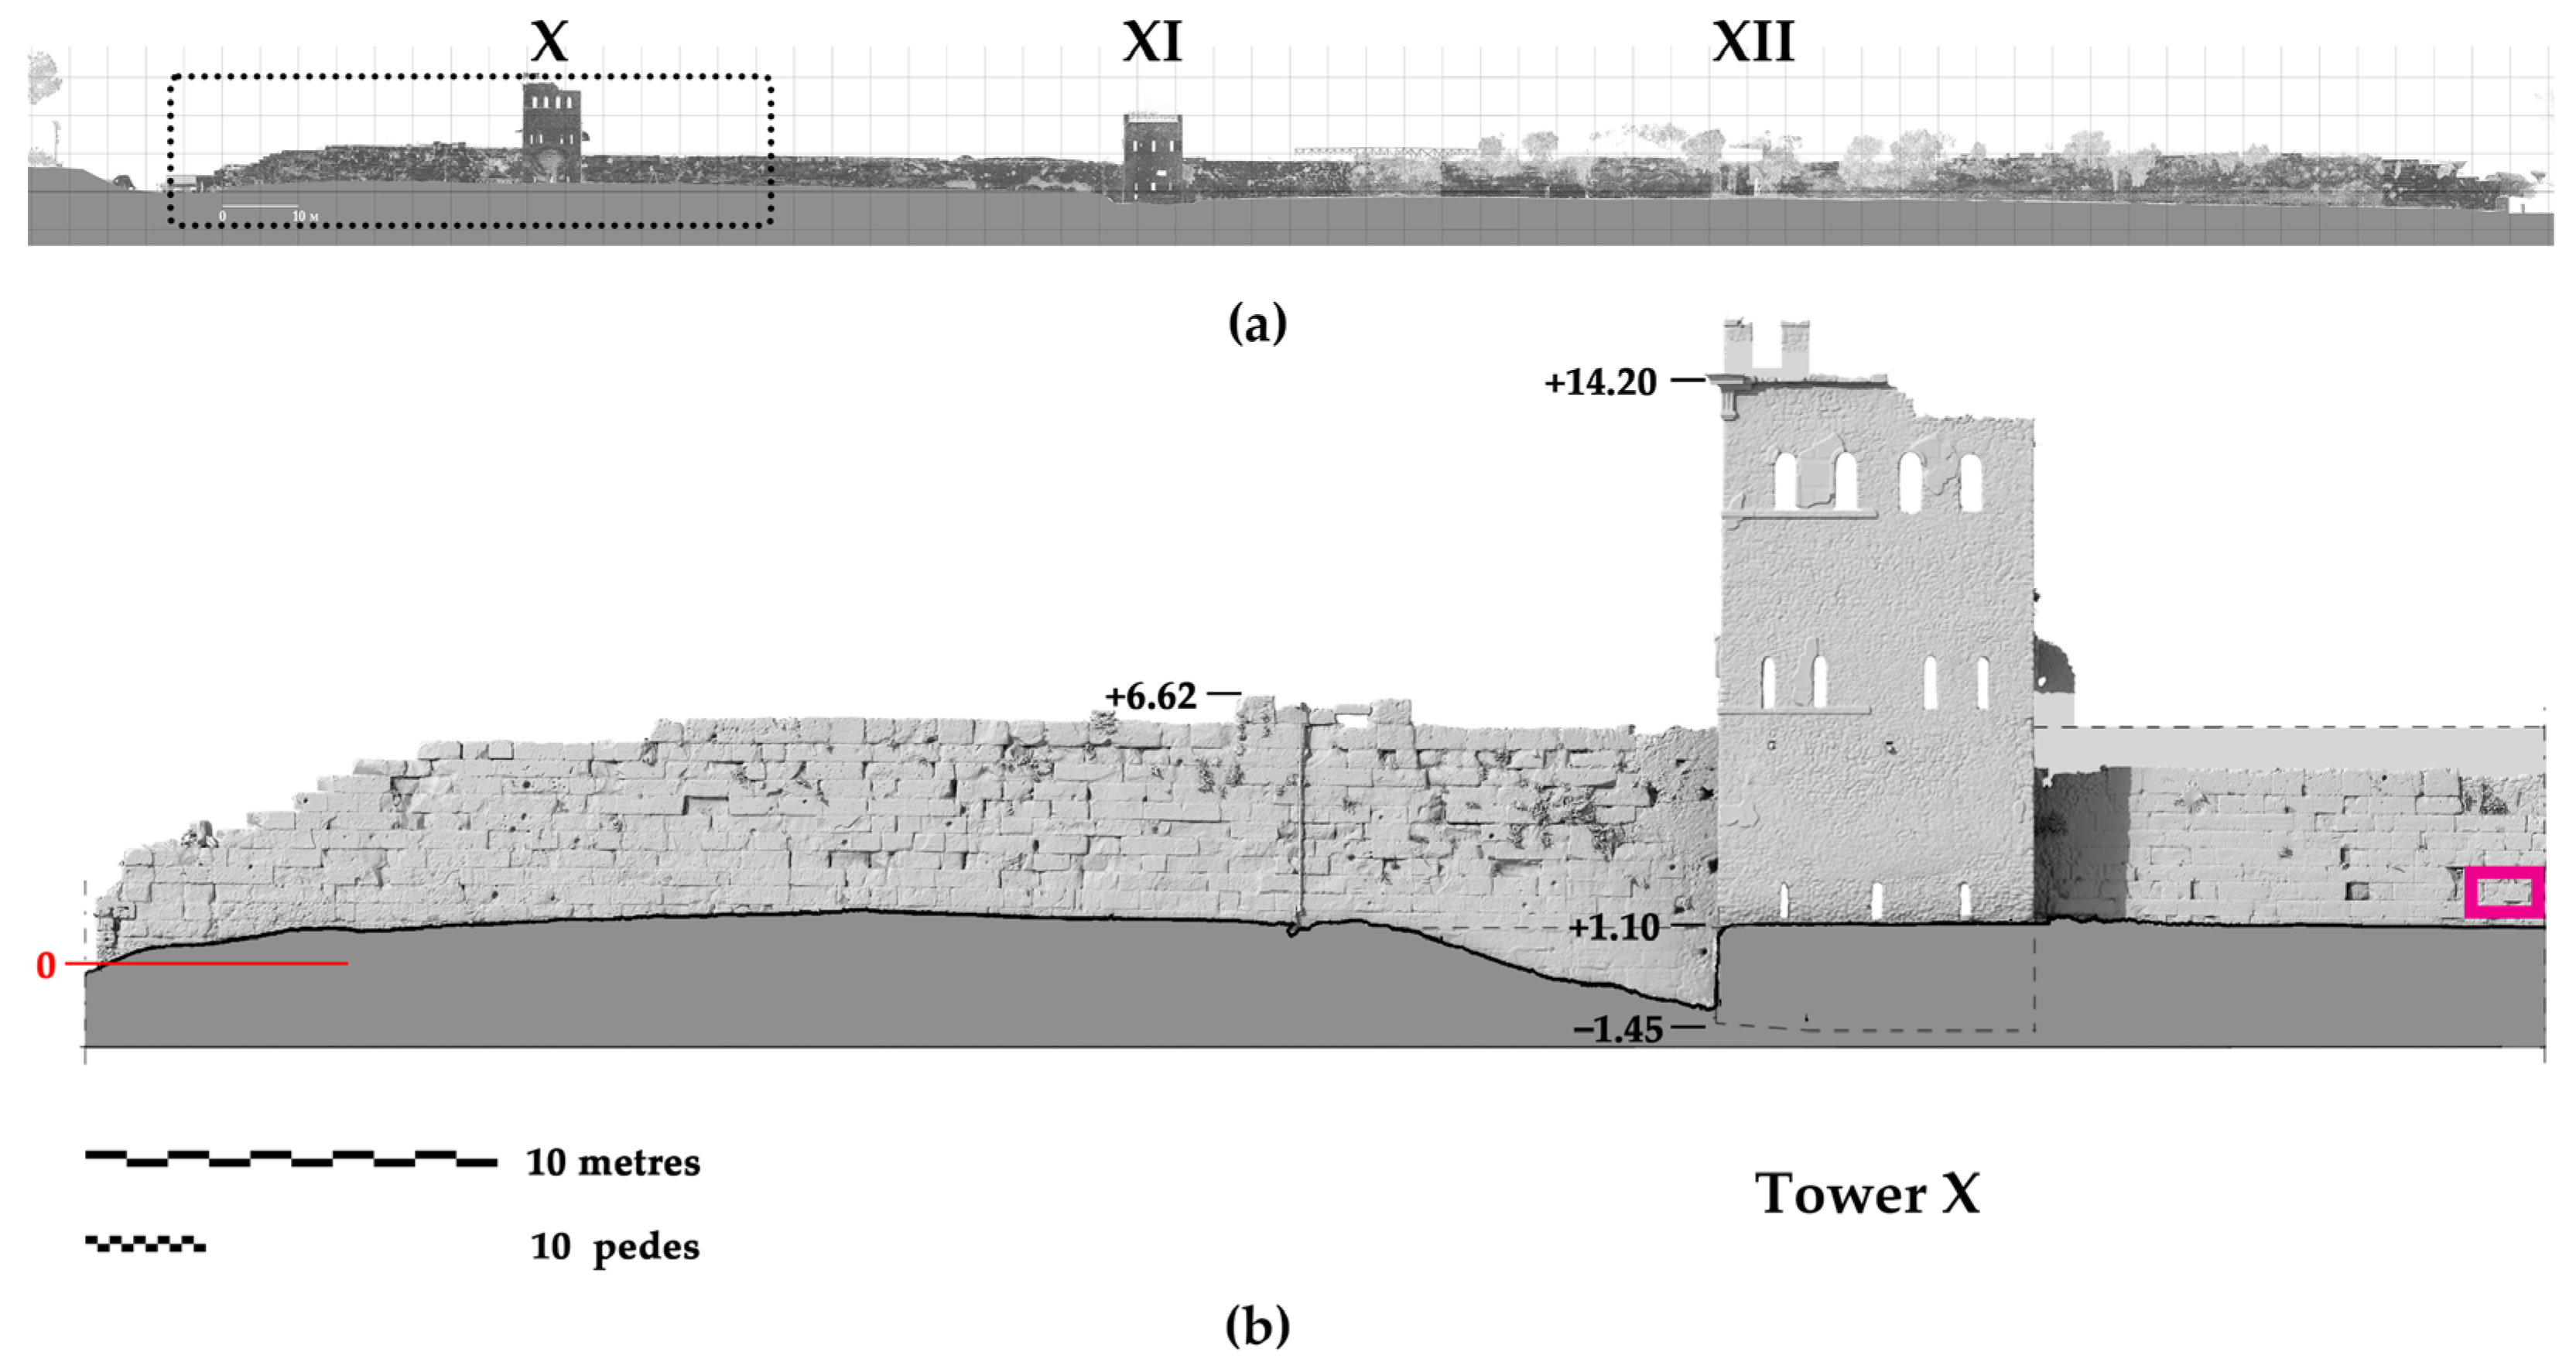
Already in the 1920s, Van Buren had recorded the presence of small traces—as small as 2 cm—alongside larger, more obvious impacts [2] (p. 110). Nearly a century later, the challenges in interpreting such marks persist, complicated not only by the porous structure of the city wall—which contains both natural and anthropic cavities—but also by fundamental concepts of poliorcetics and the intended function of the weapons involved. Dart-launching devices were, in fact, anti-personnel tools, not intended to breach thick walls but rather to wound enemies. As such, it is reasonable to assume that many of the original traces were located either high up (aimed at defenders on the wall walk behind the battlements) [11] (p. 31) or low down (targeting soldiers exiting through sally ports at the base of towers used during sorties). The former have been lost along with the merlons and the smashed wooden defensive structures mounted for defense purposes that once shielded defenders [1,12], while the latter were buried beneath volcanic deposits which, in some sectors, raised the ground level by over two meters (Figure 3).
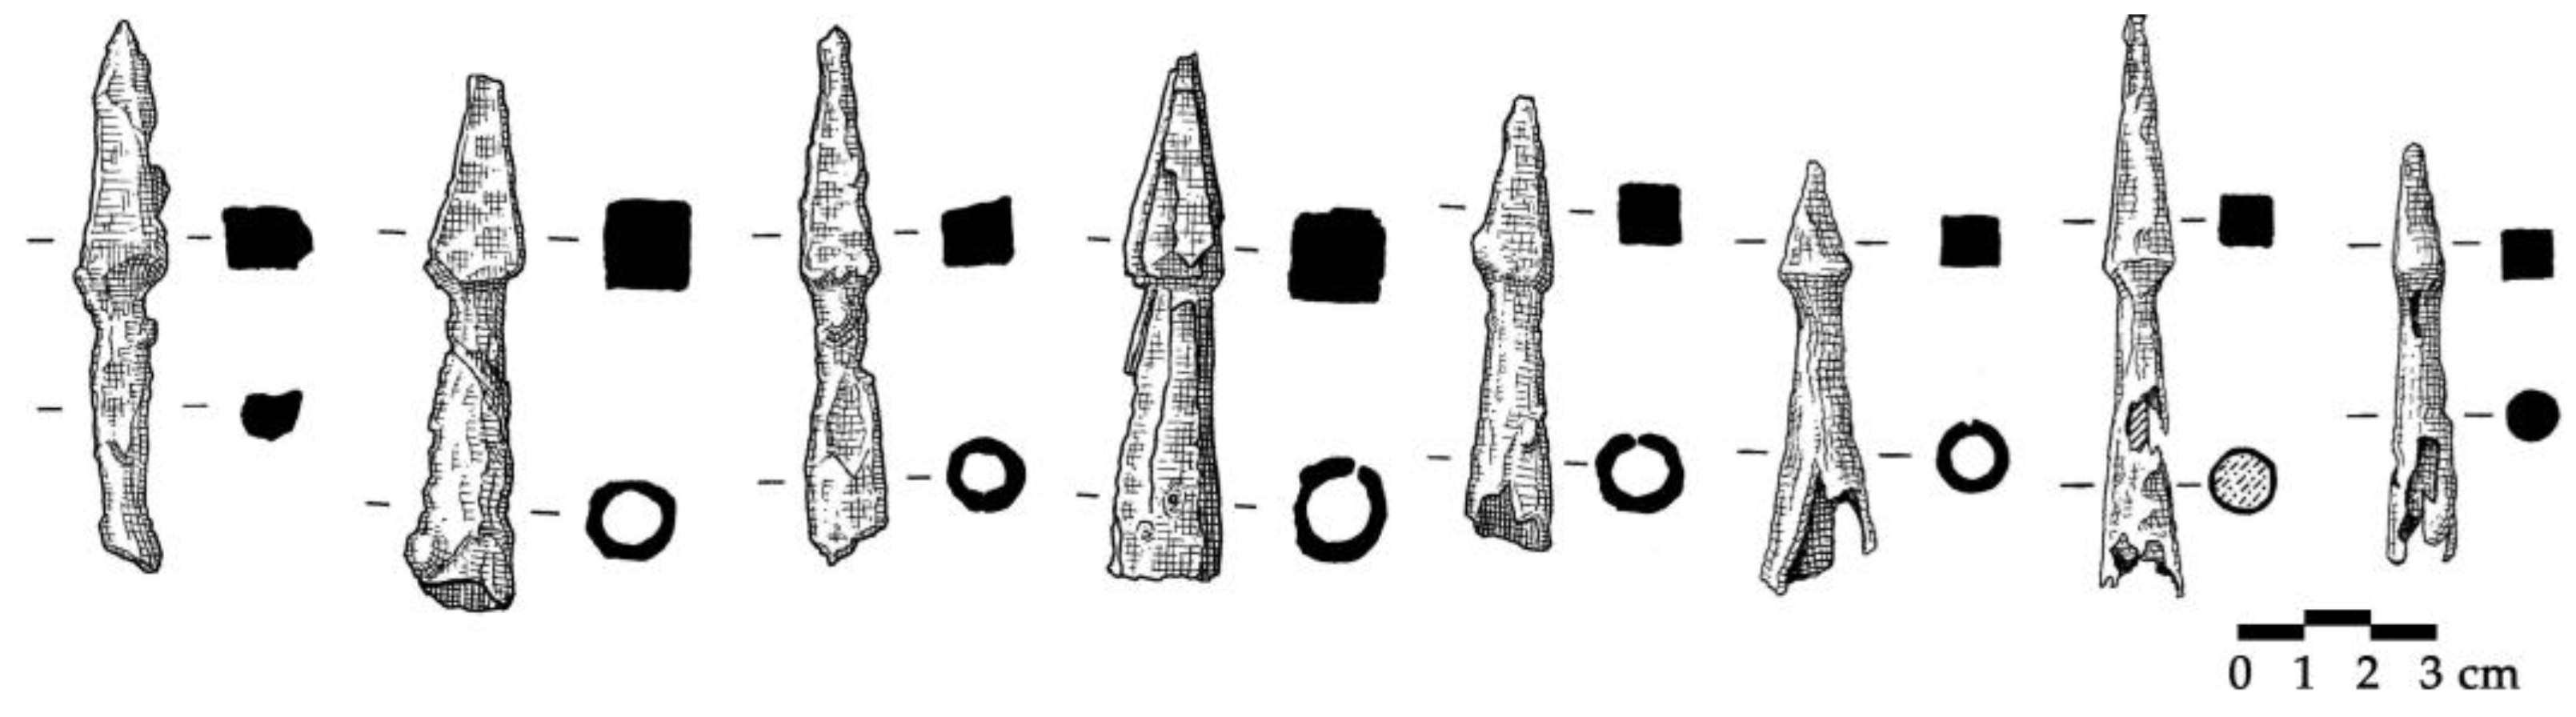
That being considered, the field inspection therefore prioritized the identification of quadrangular-shaped indentations that, to our knowledge, have never been documented before—shapes more easily distinguishable from natural porosity as well as from impact marks caused by spherical projectiles, sling bullets, or conical arrowheads. Among the various dart tip types, in fact, the most commonly used were hot-forged pyramidal iron heads, theoretically capable of inflicting severe damage comparable to that of spherical missiles, but with reduced deflection upon impact. Examples of iron (and more rarely bronze) arrowheads, mounted on wooden shafts with different tangs and conical or flanged sockets, are preserved in several European museums, including the British Museum [13,14] (Figure 4).
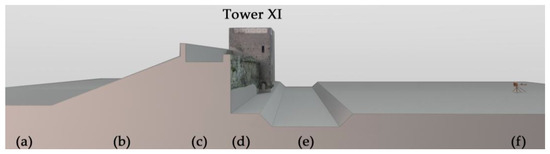
Figure 3.
Hypothetical ancient spatial configuration: (a) The ancient city of Pompeii; (b) The agger (embankment); (c) City walls with a wall-walk accessible from the towers; (d) Tower sally port; (e) The moat; (f) The besieging forces and their siege weapons.
Figure 3.
Hypothetical ancient spatial configuration: (a) The ancient city of Pompeii; (b) The agger (embankment); (c) City walls with a wall-walk accessible from the towers; (d) Tower sally port; (e) The moat; (f) The besieging forces and their siege weapons.


Figure 4.
Drawings of iron ballista bolts with pyramidal heads and different sockets, mid-1st century AD, Dorset (UK). British Museum online collection, respective registration nos. 1892,0901.1134-1136-1146-1123-1164-1181; 1960,0405.238-239. Copyright: The Trustees of the British Museum, https://www.britishmuseum.org/collection (accessed on 8 February 2025).
2.1. Impact Survey
Following the above criteria, the first visual inspection focused on square-shaped cavities, some of which were found in clusters. Among these, special attention was given to a fan-shaped, centripetal arrangement consisting of four square depressions and a fifth mark of similar size and geometry. Each cavity measured approximately 24.5 mm in width and reached a maximum depth of about 20 mm (Figure 5). The group is located approximately 89 cm above the current ground level, between Towers X and XI (Figure 6). Confident that these were not natural cavities, it was considered plausible that the impacts at this height were aimed at a moving target—perhaps soldiers moving along the defense line. A second and third similar configuration, although found at different heights, made this fan-shaped group especially worthy of detailed investigation.
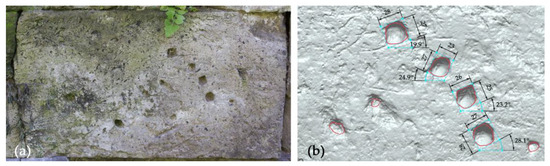
Figure 5.
(a) Photo of the fan-shaped group in the northern wall, ca. 12 m west of Tower X; (b) Close-up on the four square-shaped holes, with dimensions in mm and angles in arc degrees.

Due to restrictions that prevented placing targets directly on the city walls (see access permission), only non-contact acquisition techniques were considered adequate.
In the first instance, the digital survey was carried out using passive sensors and processed through Structure from Motion (SfM) and Image Matching (IM) techniques. The resolution was chosen according to the specific characteristics of the case, in order to create a high-quality model. The scaling of the model was ensured by using a custom-made scale bar placed within the scene, and a color balance target was also included in the setup to support chromatic balance during post-processing activities (Figure 7).
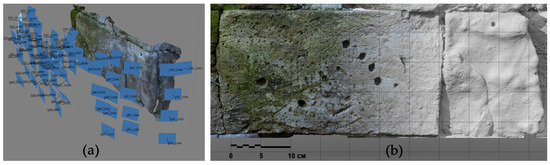
Figure 7.
(a) SfM model of stone ashlars processed in Agisoft Metashape Pro; (b) An orthoimage of the polygonal mesh with blended-map visualizations highlighting the cavities using the Diffuse Map (DM) texture (left), and no texture (right).
Figure 7.
(a) SfM model of stone ashlars processed in Agisoft Metashape Pro; (b) An orthoimage of the polygonal mesh with blended-map visualizations highlighting the cavities using the Diffuse Map (DM) texture (left), and no texture (right).

Given the favorable lighting conditions at the time of acquisition, no significant issues were encountered; all typical limitations—such as image blur, insufficient depth of field in recessed areas, or poor illumination—were carefully mitigated. In particular, artificial lighting was employed to ensure adequate exposure inside the depressions when necessary.
However, despite all precautions, photogrammetric acquisition faces certain limitations in specific contexts: (i) when the target area is located beyond the operator’s physical reach, resulting in incomplete surface coverage and potentially inaccurate reconstructed geometries in those zones; (ii) in the presence of invasive vegetation growing inside cavities, which obstructs a clear view of the occluded surfaces; and iii) in the case of deep holes where light occlusion cannot be fully resolved, even with artificial illumination.
Additionally, since passive techniques create non-metric models, the accuracy of the scaling operation becomes particularly critical, especially when dealing with extremely small or deeply recessed impact marks such as those potentially caused by arrowheads; even small scaling inaccuracies can significantly affect the geometric interpretation of these features and introduce variations in final output [15].
To address these issues, documentation can be supplemented with triangulation-based or structured-light scanners, capable of producing highly dense models with sub-millimetric resolution—within the resolution and depth-of-field limits imposed by the device and the specific logistics of the object.
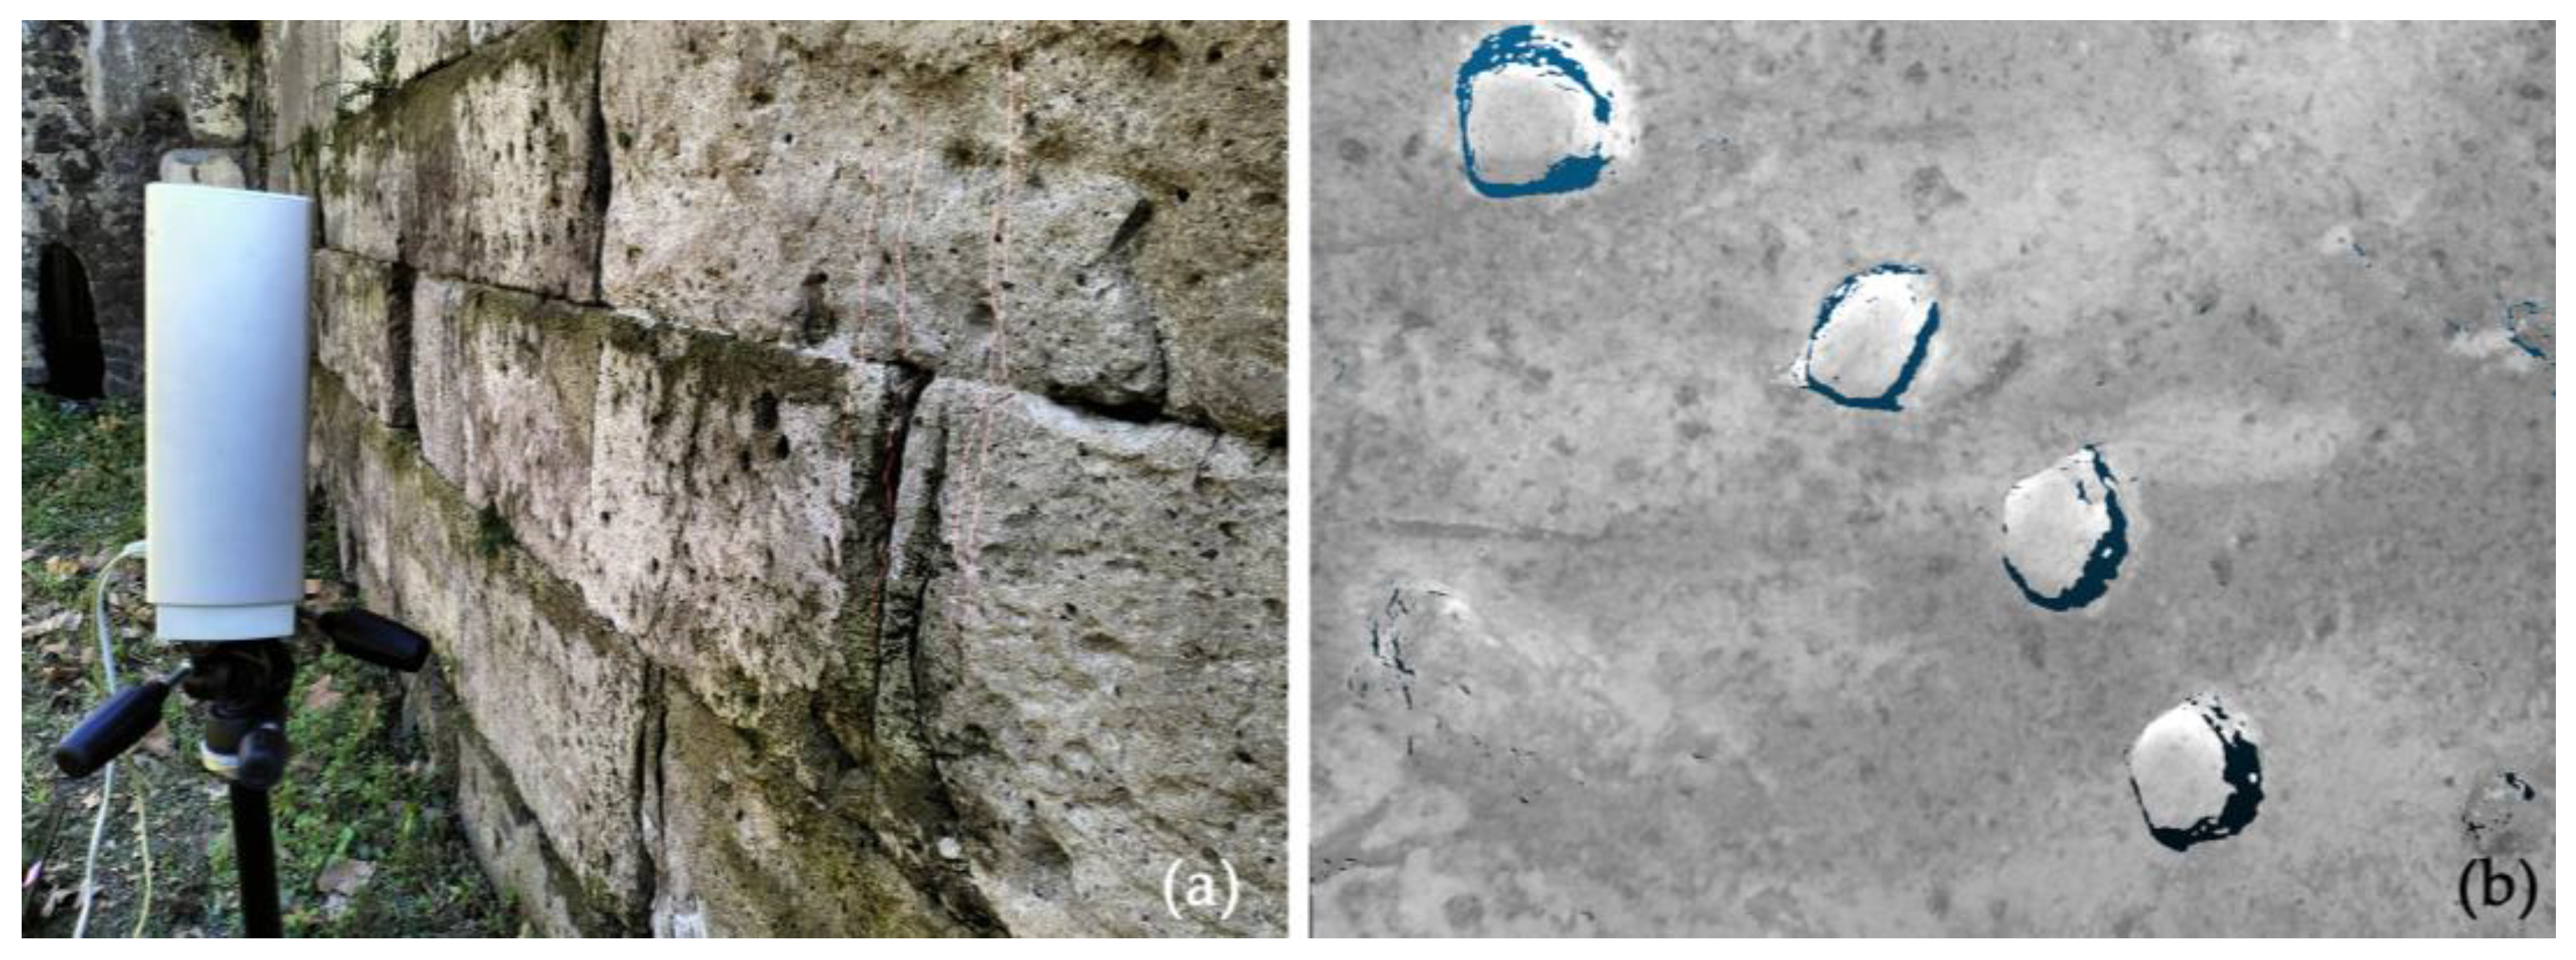
The device used was a NextEngine Desktop 3D triangulation scanner, which uses MultiStripe Laser Triangulation (MLT): multiple laser stripes are projected onto the surface while a CCD camera (twin 5.0 Megapixel CMOS image sensors) captures the point positions (Figure 8).
The first case study acquired was located at a height that was easily accessible and within the scanner’s optimal acquisition range (52–54 cm from the wall surface). During capture, several tests were conducted in the field under different lighting conditions, as ambient light diffusion can interfere with the acquisition phase (these devices are typically designed for indoor use). To fully document the four marks with sufficient overlap for proper alignment (each scan covering roughly an A4-sized area), 15 range maps were acquired (each with a scan time of approximately five minutes depending on the settings).

Figure 8.
(a) Acquisition of a range map with the NextEngine scanner; (b) Close-up of a single range map.
Figure 8.
(a) Acquisition of a range map with the NextEngine scanner; (b) Close-up of a single range map.
2.2. Creation of 3D Models
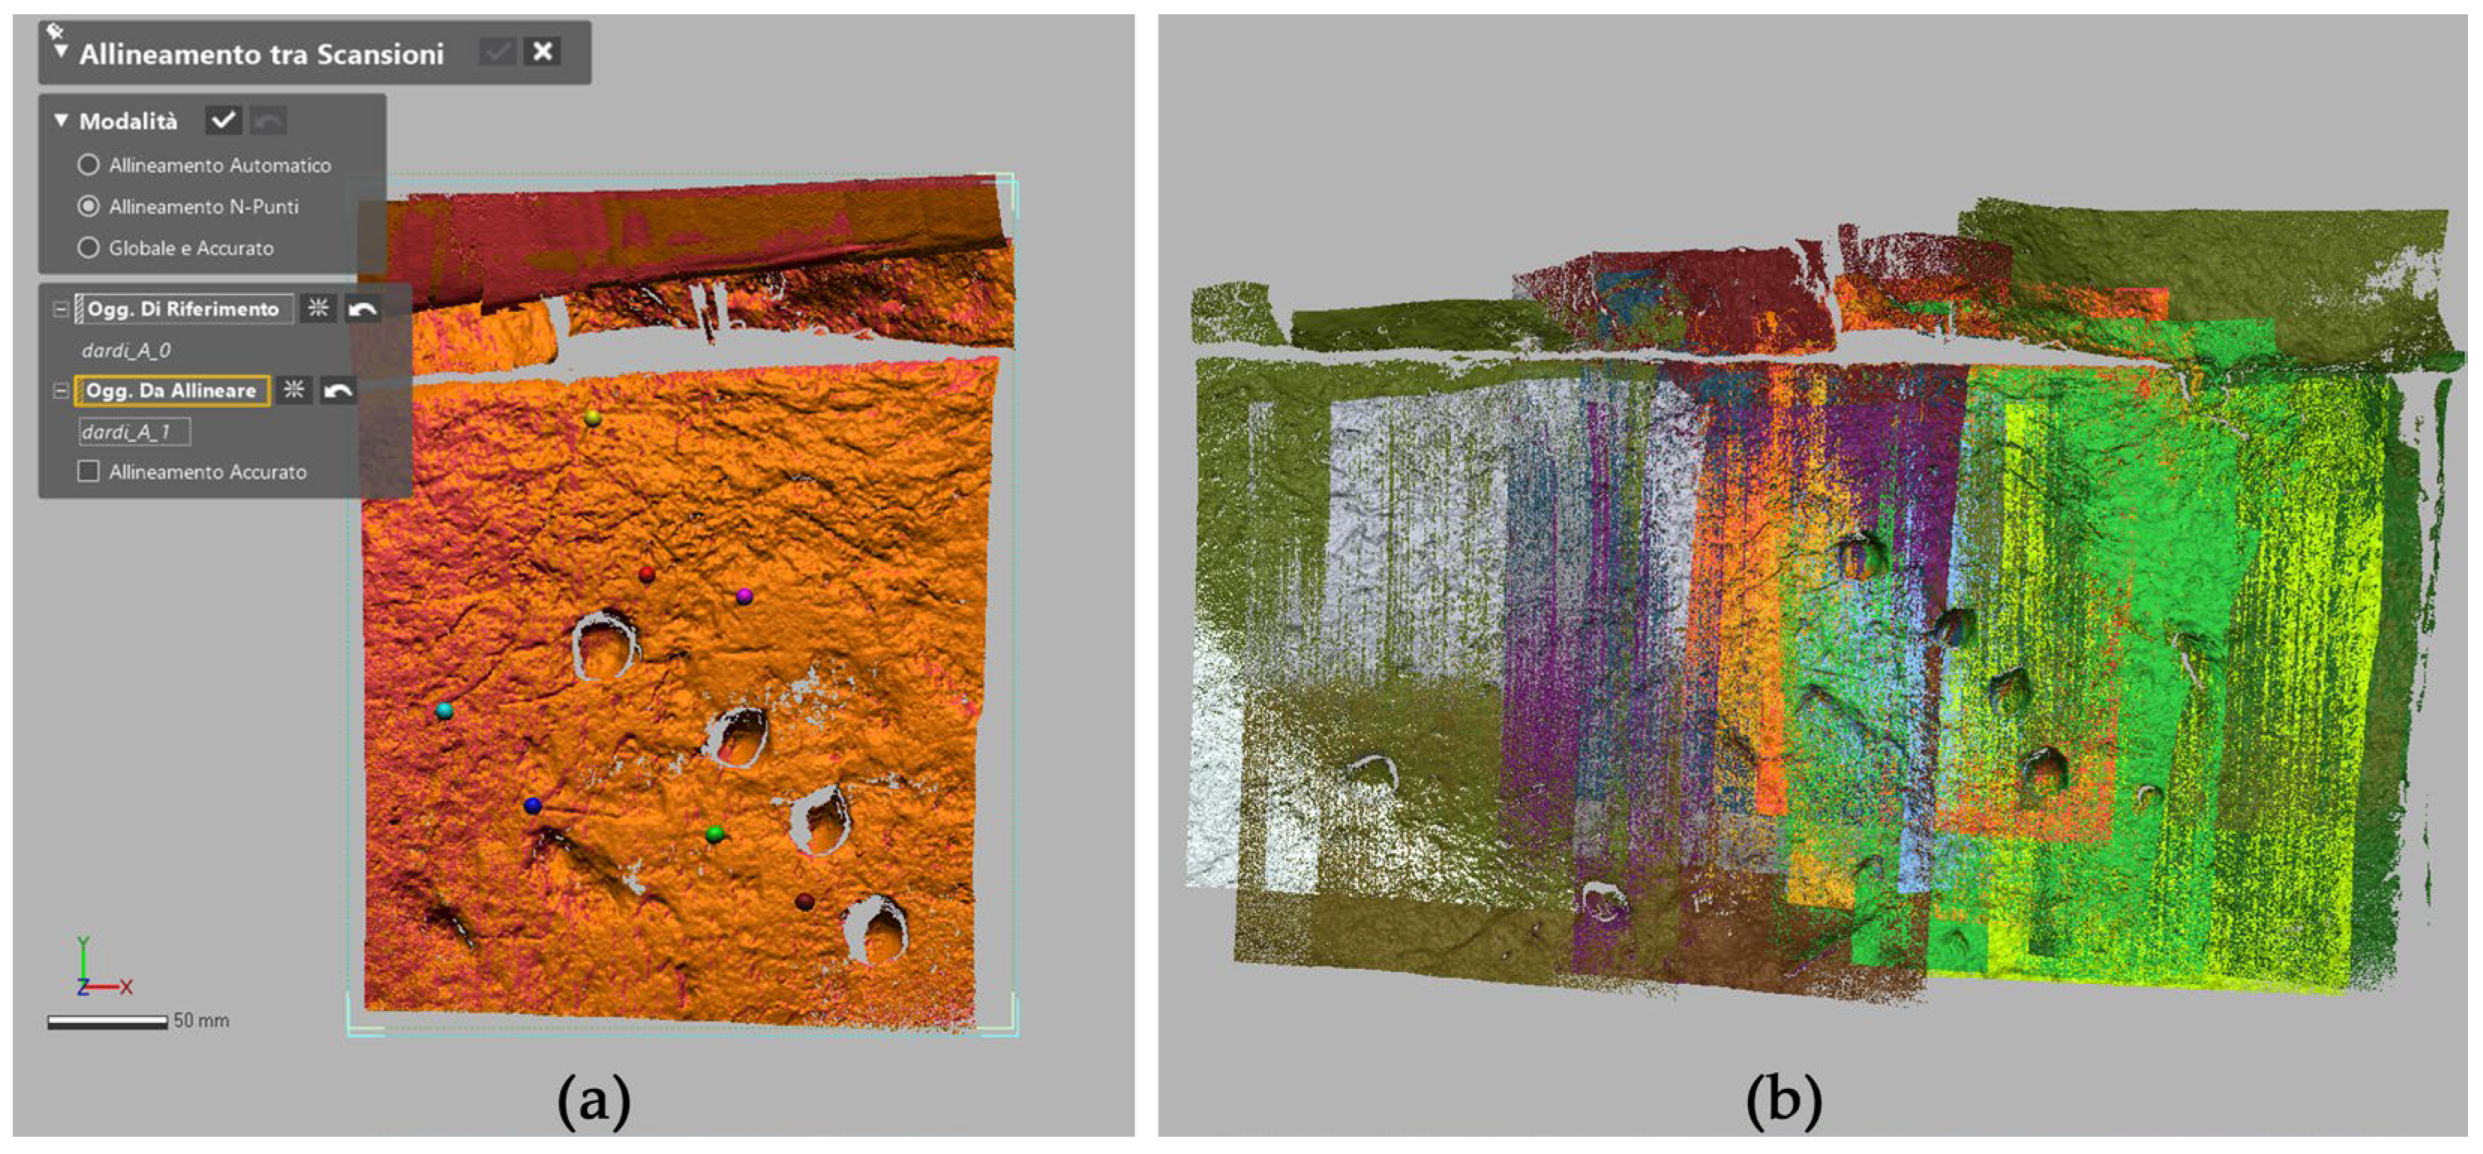
The scan alignment process was performed using Geomagic Design X software. Once all scans were imported (in mm), they were registered using the N-points method, selecting homologous points on recognizable features across two different overlapping scans. This was followed by a global fine registration process, repeated until all available range maps were properly aligned (Figure 9).
After the initial alignment, cross-sections were extracted every 10 mm to ensure that the deviation between the models remained within acceptable thresholds. This helped validate the central area containing the four features of interest and allowed for a direct deviation comparison between the two meshes: one from SfM and the other from the NextEngine scanner.
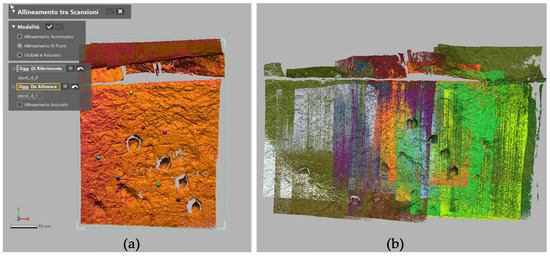
Figure 9.
(a) Step of the N-points alignment process between two scans; (b) Final result before merging of the scans: different colors represent different scans.
Figure 9.
(a) Step of the N-points alignment process between two scans; (b) Final result before merging of the scans: different colors represent different scans.
As a result of the survey campaign, for this representative case study, three distinct digital models were available (Figure 10); all models were located using the same local coordinate system established by the TLS reference model, although typically, each individual model copy has its pivot point at the barycenter to facilitate visualization:
- A general polygonal mesh derived from a portion of the terrestrial laser scanner point cloud (exported in *.ptx format). After standard editing and topological error correction, the mesh had an average edge length of 3.49 mm;
- A photogrammetric polygonal model with an average mesh edge length of 0.83 mm;
- A high-resolution model obtained by registering and merging the 15 range maps acquired with the NextEngine scanner, with an average mesh edge length of 0.41 mm.
The varying levels of detail across the models reflect differences in acquisition technique, device resolution, and optimization. Each model served a distinct purpose: the general TLS mesh provided a spatial reference framework for positioning the case studies along the city walls; the SfM mesh offered detailed surface documentation, including texture data; and the MLT scanner mesh supported high-precision analysis of very small and deeply re-entrant indentations.
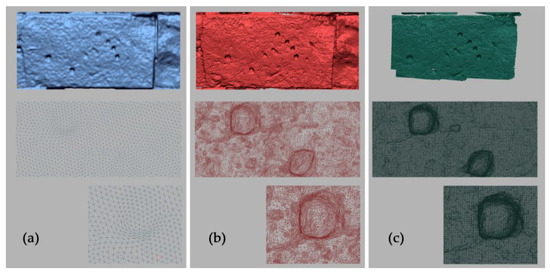
Figure 10.
Three-dimensional digital models of the case study area with polygonal mesh details: (a) TLS survey; (b) SfM survey; (c) Next Engine scanner survey.
Figure 10.
Three-dimensional digital models of the case study area with polygonal mesh details: (a) TLS survey; (b) SfM survey; (c) Next Engine scanner survey.

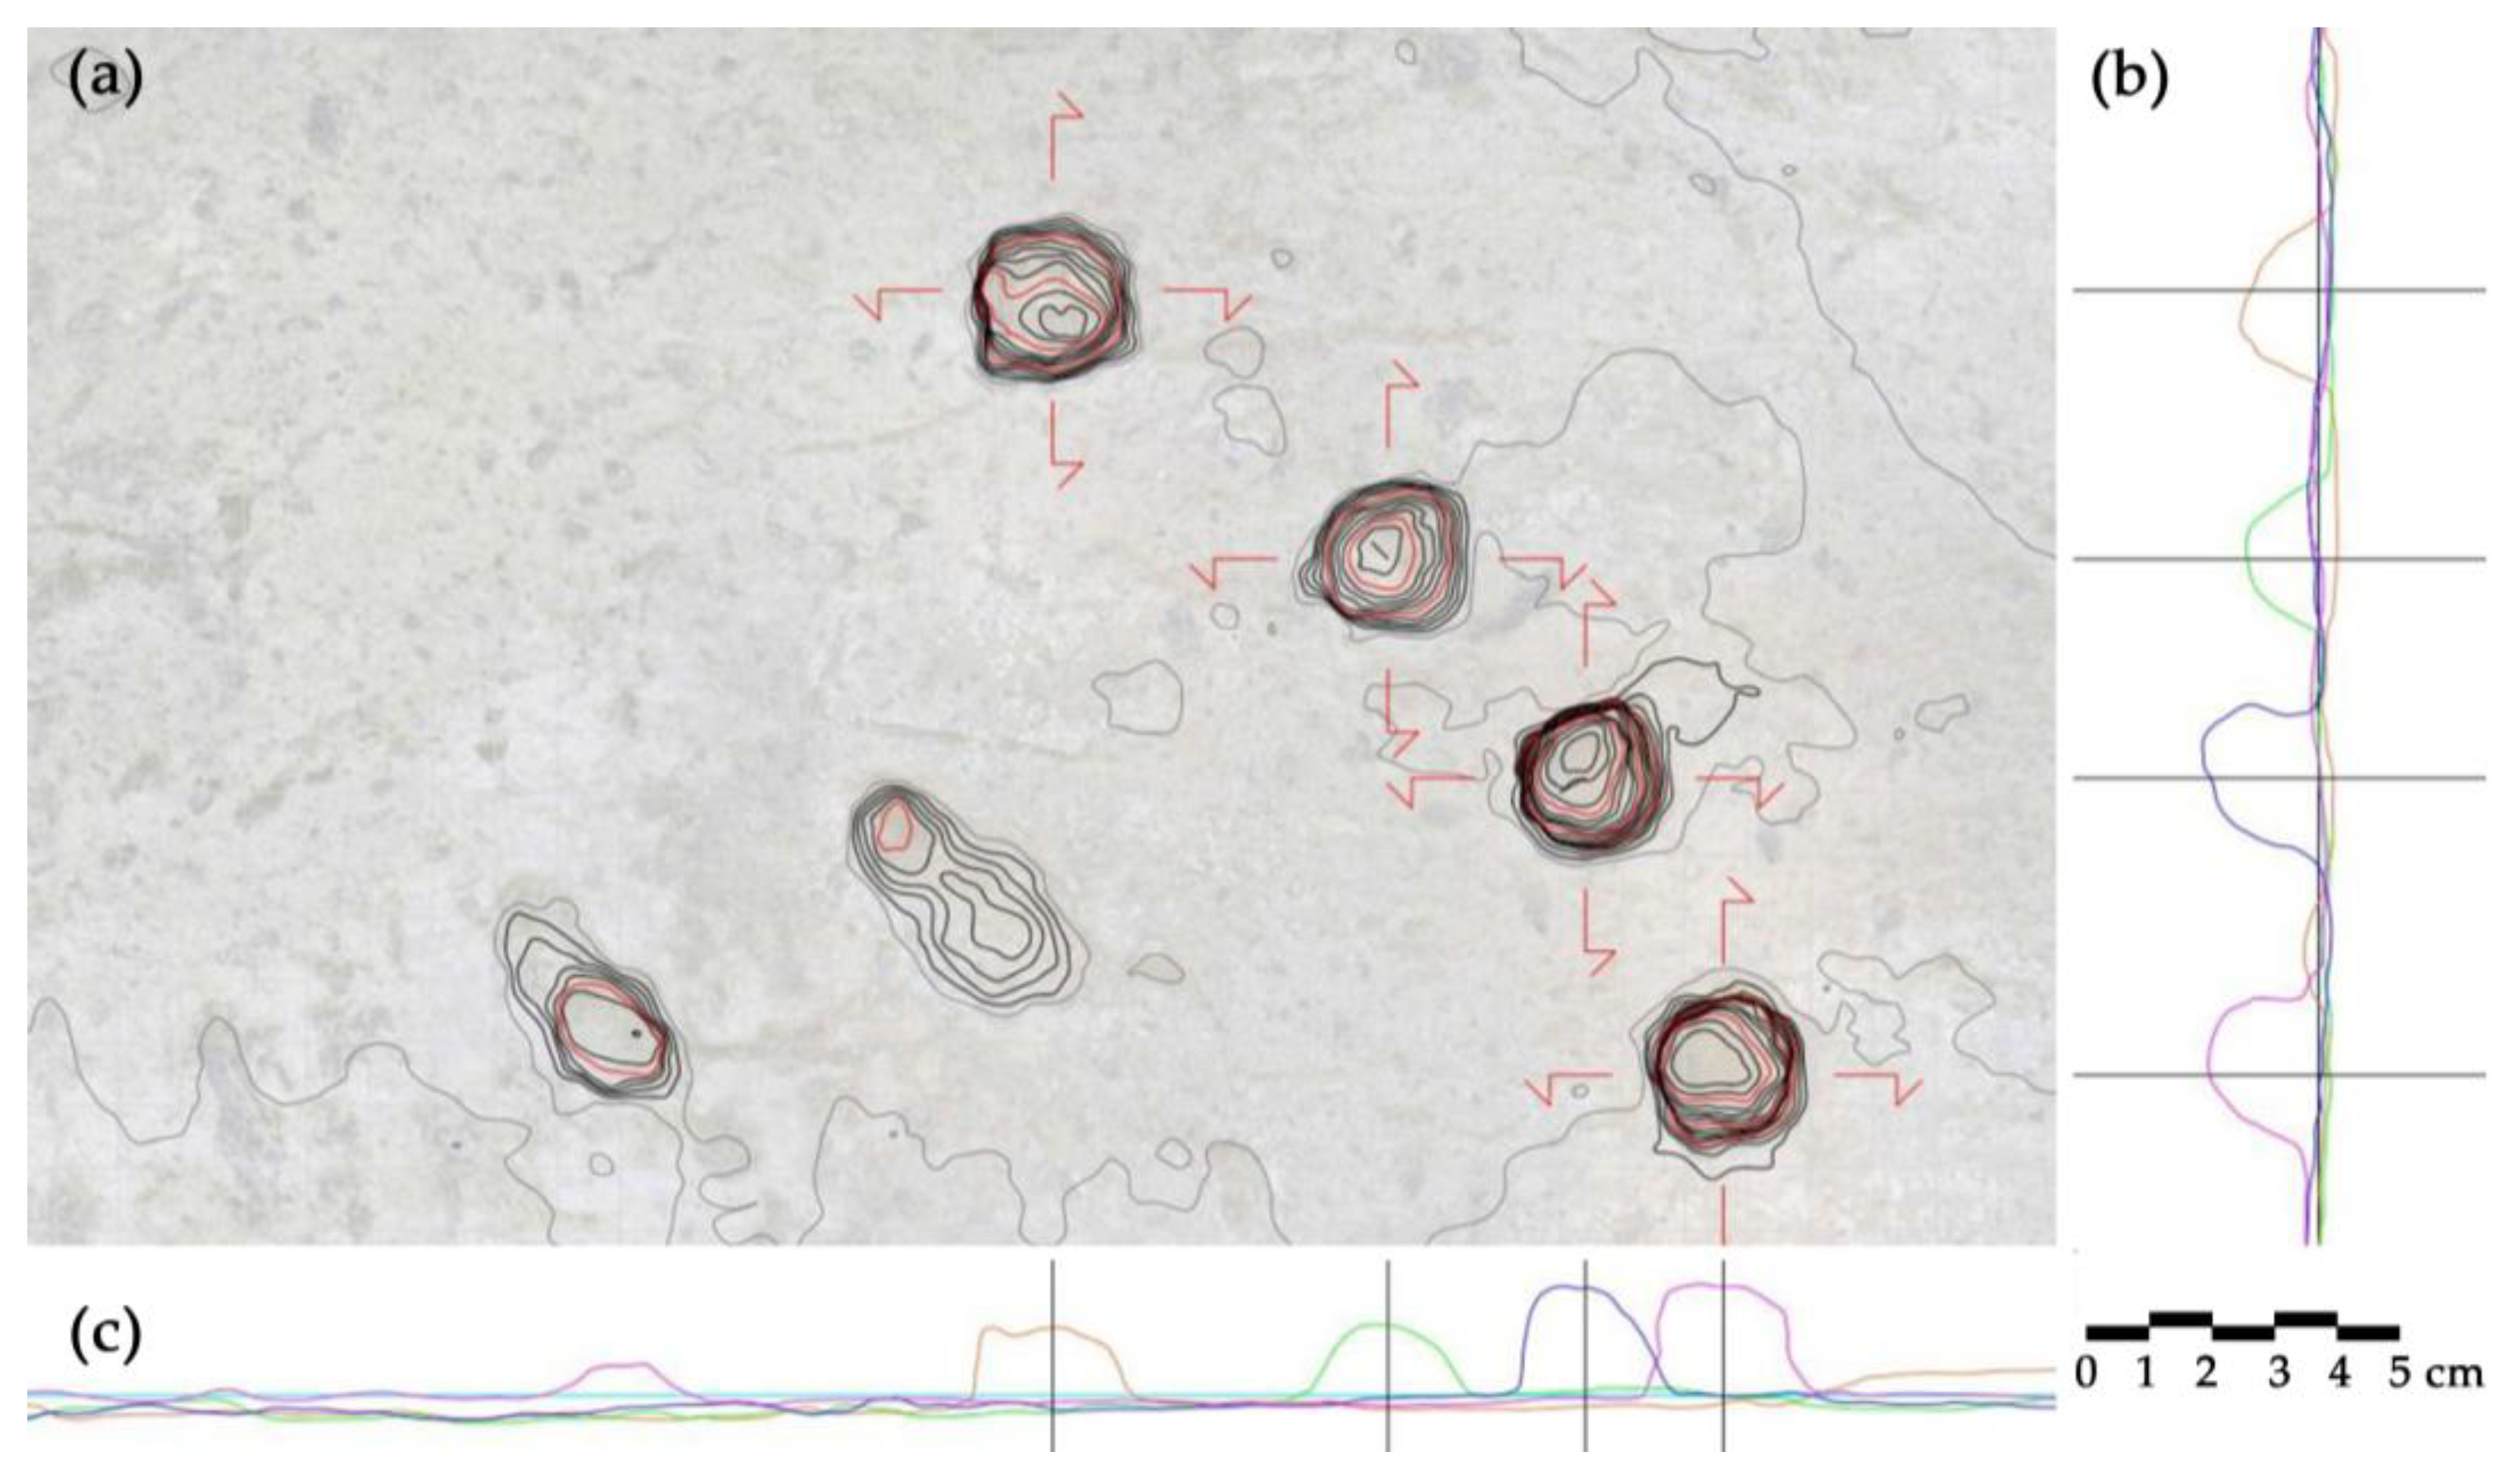
The resulting polygonal mesh was then carefully analyzed to assess both morphology and dimensional features. Multiple cross-sections were extracted using three reference planes in order to evaluate shape similarity and determine whether the marks might have been caused by the same type of projectile (Figure 11).
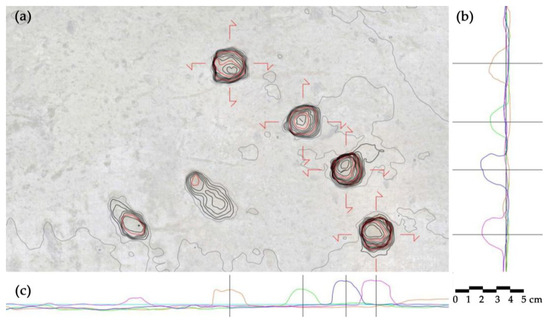
Figure 11.
(a) Elevation view, (b) vertical cross-sections, and (c) horizontal cross-sections of the mesh model with contour lines to enhance perception of hollow areas.
Figure 11.
(a) Elevation view, (b) vertical cross-sections, and (c) horizontal cross-sections of the mesh model with contour lines to enhance perception of hollow areas.
3. Results: Virtual Casts and Reverse Modeling
One of the most immediate applications of a polygonal model is the ability to generate virtual casts that replicate the scanned surface. By inverting the surface normals, it is possible to create a negative mold, from which a positive highly detailed digital replica of the original object can be derived [16].
There are, however, certain aspects to be taken into account regarding the degree of approximation inherent to such models, and that the survey captures the object only as it exists at the specific moment of documentation, i.e., the current state of preservation of the surface at a given point in time. Over time, significant alterations have definitely affected the morphology of the impacted surfaces—from the initial damage caused by the Sullan artillery strike, to the volcanic eruption of Vesuvio nearly a century later (79 AD), and the subsequent excavations of the 20th century. On the one hand, the current morphology of the hole is the result not only of the impact, but also of subsequent erosion and micro-fragmentation due to weathering; on the other hand, the presence of patinas and surface encrustations may slightly alter the reliability of the cavity’s configuration and measurements. These factors introduce a degree of uncertainty that must be considered in the interpretation of the data, although to a limited extent relative to our purposes. Yet, these surviving marks are invaluable vestiges, offering a rare glimpse into the destructive power of ancient elastic torsion artillery systems.
Dealing with the possible reconstruction of blunt objects through reverse modeling operations starting from effects on the walls, a fundamental step consists in analyzing the available mesh of the documented cavities for reconstruction purposes, as already done in the case of spheroidal cavity marks. Moreover, original shapes of the projectiles can be inferred from surviving archaeological specimens, such as pyramidal metallic arrowheads preserved in museum collections and available through online archives. These can serve as references, at least in terms of their known measurements and proportions, to guide the reconstruction of the object’s solid geometry.
In this case, direct reconstruction of their original geometry using fully automated best-fitting tools applied to the cavities was not feasible. Therefore, different approaches were tested to reconstruct a representative dart shape, either through semi-automatic tools or by manual modeling carried out by the operator to define the most plausible morphological hypothesis.
The applied workflows were as follows:
- Surface-Based Reverse Modeling (SBRM)—an automated method for finding the shape of the cavity and the most likely axis of penetration;
- Direct Geometric Modeling (DGM)—a method for geometrically reconstructing the dart from cross-sections based on known dimensions and proportions.
3.1. Surface-Based Reverse Modeling (SBRM)
The high-resolution mesh derived from the MLT scanner served as the basis for extracting significant geometric information from the cavities (Figure 12). Although the model was already metric and detailed, it still contained minor surface irregularities—such as small protrusions, localized noise, or debris—which could affect the interpretation of morphological data. For this reason, the mesh was subjected to a light defeaturing and smart smoothing process, aimed at reducing noise and irregularities, and improving the uniformity of selected polygon faces (within a specified deviation range), while preserving morphologically relevant features.
This pre-processing step is crucial before using automatic surface region detection tools, as smoother and more uniform meshes yield less fragmented segmentation results. The procedure segments the mesh based on curvature variation and geometrical continuity, assigning distinct color codes to each detected region.

Figure 12.
(a) Surface region detection; (b) Identification of best-fitting geometric primitives by selecting specific regions; (c) Axis of penetration; (d) Radial or orthogonal sections of the cavity; (e) Selection of sections; (f) Rectification into best-fitting square shapes.
Figure 12.
(a) Surface region detection; (b) Identification of best-fitting geometric primitives by selecting specific regions; (c) Axis of penetration; (d) Radial or orthogonal sections of the cavity; (e) Selection of sections; (f) Rectification into best-fitting square shapes.
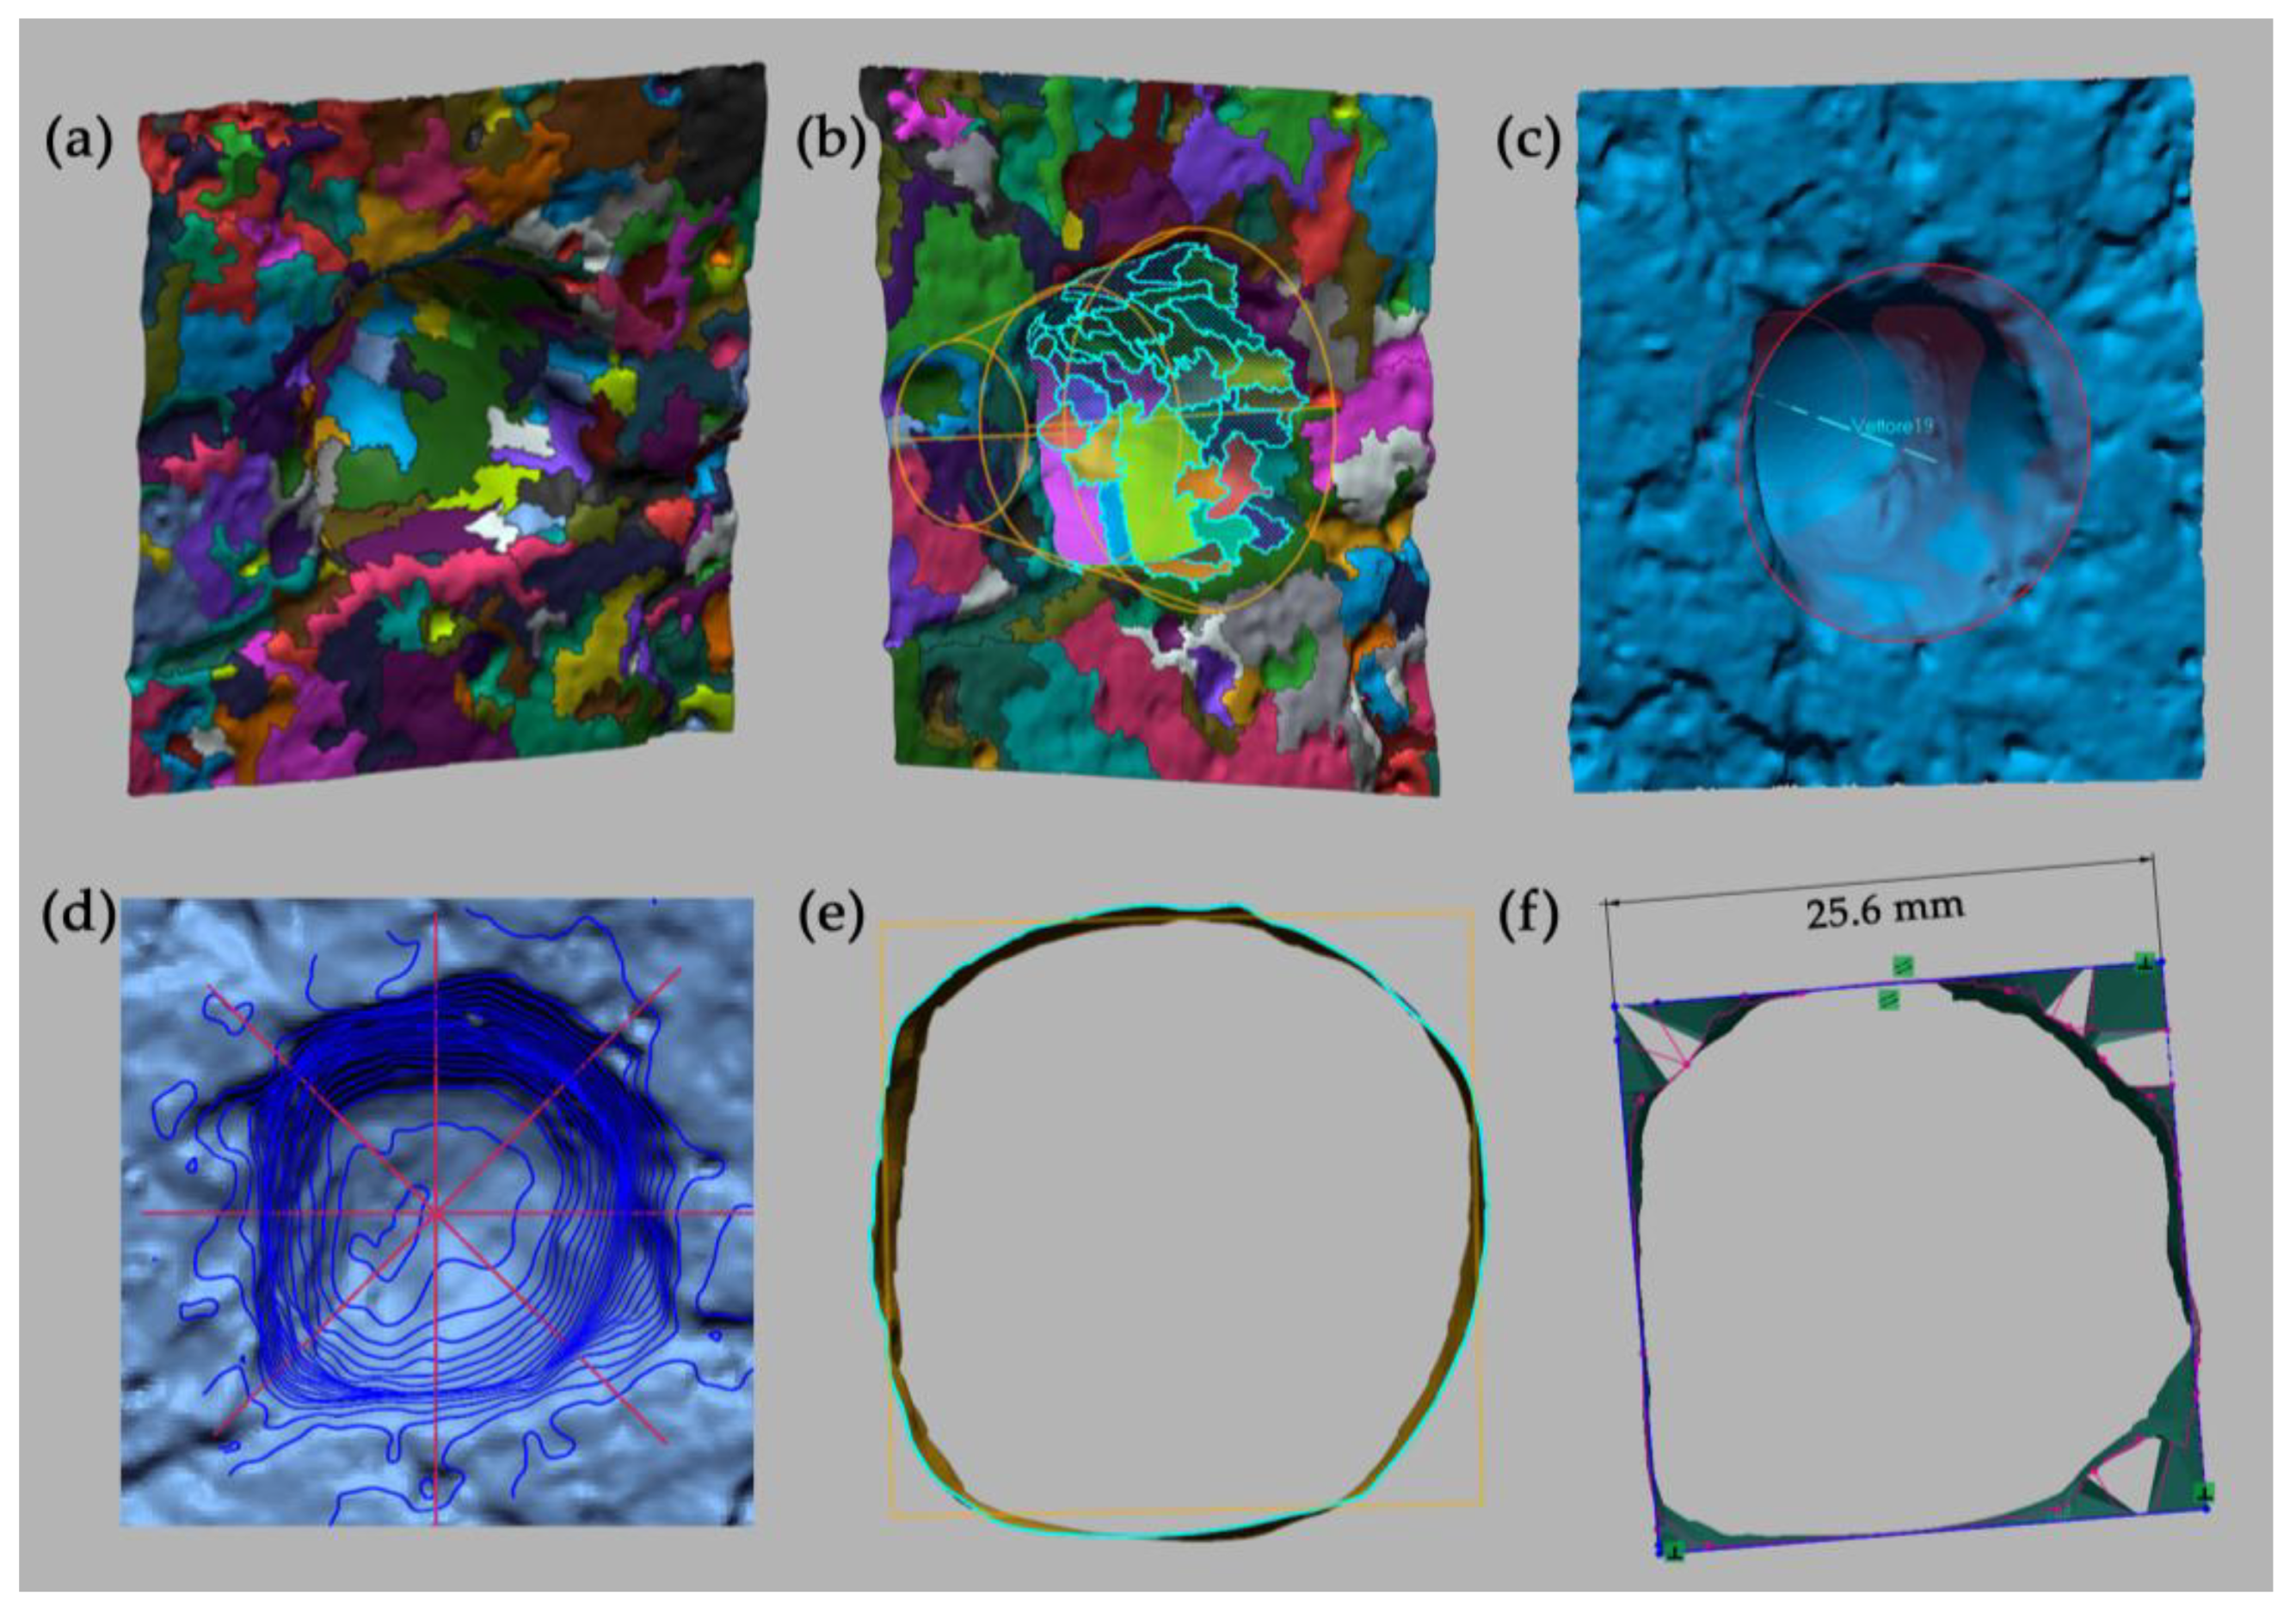
Operators can adjust sensitivity or manually re-segment key areas using cutting polylines, in order to increase or decrease the number of identified regions. This process facilitated the identification of best-fitting geometric primitives by selecting only the regions that corresponded to the impact area.
Since the outcome depends on the region selection, it is necessary to define in advance which geometric shape is to be extracted and carefully choose which regions to include in the computation. Moreover, only a limited set of simple geometric primitives is supported by the automatic extraction tool. Therefore, it may be more effective to first examine a similar shape—for instance a cone that approximates the pointed pyramidal shape of the arrowhead and conceived as enveloping the solid to be reconstructed—and then define the most probable impact axis (possibly coinciding with the axis of the automatically extrapolated cone), which is not always visible to the naked eye, especially in shallow cavities.
Once identified, the geometric regions were analyzed to determine which primitive shapes (e.g., cones) best fit the selected surfaces. In this way, a first hypothetical 3D shape could be obtained, corresponding to the best-fitting geometry of the impacting object.
The analysis also allowed for the identification of the most likely axis of penetration, often coinciding with the axis of symmetry of the best-fitting primitive. From this axis, it was then possible to extract multiple radial or orthogonal sections from the cavity and use them to better define the internal profile of the impact mark.
To improve legibility and support visual comparisons, the extracted sections can be cleaned of irregular outlines and, in some cases, manually adjusted to follow an idealized quadrangular or conical path.
With such sections, either by 3D sketches on the mesh or by switching to automatic contour editing, which aims to rectify them into a square shape, it is possible to obtain planar geometries from which surfaces or composite solids can be created to reconstruct the object.
The contour editing tool allows the adjustment of mesh boundaries to a predefined shape—for example, reshaping the contour of polygons to have equal sides (in this case, four sides to obtain the best-fitting square section) and modifying the mesh accordingly. At this point, the best fitting section can be determined through sketching.
With both methods, the side length of the square base of the reconstructed truncated pyramid in the stone ashlar was found to be approximately 2.5 cm, equal to one Roman uncia (1/12 of pes, i.e., 2.465 cm, given that 1 pes = 29.581 cm; cf. [17] (p. 89)).
3.2. Direct Geometric Modeling (DGM)
Although more time-consuming, manual modeling offers valuable control over the reconstruction process, especially when working with complex shapes or incomplete cavities where fully automated solutions are not always sufficient.
Therefore, in addition to the semi-automatic workflow, a more interpretative approach was adopted to reconstruct the dart geometry based on dimensional observations and available references (Figure 13).
Using CAD tools, the operator can draw a series of 2D sketches on various planes (lines, n-sided polygons, etc.), employing basic functions such as trimming, extending, or mirroring, and based on measurements taken from the existing specimens (e.g., arrowheads from British Museum collections), particularly those with quadrangular cross-sections. These sketches are then used to generate solid shapes through lofting, extrusion, or revolution operations of closed profiles, producing simplified yet plausible representations of the projectile.
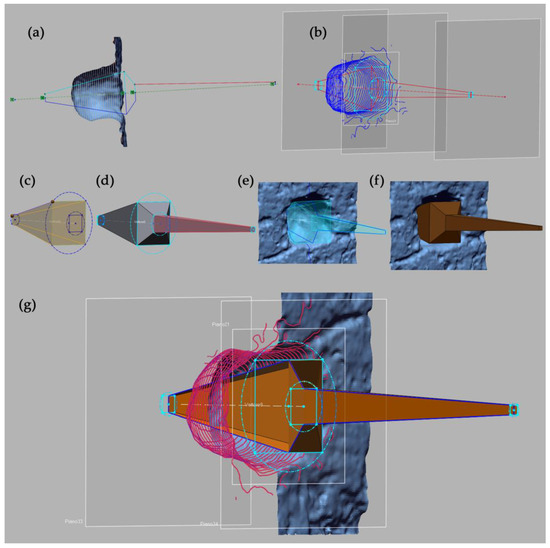
Figure 13.
(a,b) Two-dimensional sketches of the arrowhead drawn on reference planes; (c–f) Creation of the solid geometry by extruding or lofting base sketches; (g) Comparison of the modeled object with reference profiles.
Figure 13.
(a,b) Two-dimensional sketches of the arrowhead drawn on reference planes; (c–f) Creation of the solid geometry by extruding or lofting base sketches; (g) Comparison of the modeled object with reference profiles.

Where necessary, slight adjustments were made to refine the model’s fit—such as offsetting surfaces, scaling components, or reshaping sections—to better align the geometry with measured data and hypothesized impact dynamics.
This method allowed for greater flexibility, enabling real-time modifications of the model based on morphological analogies with museum specimens, and facilitating an iterative validation process comparing the reconstructed object with the recorded cavity geometry.
4. Discussion
Confirming, overall, the potential of rapidly advancing digital technologies, already in use for some time [18,19], the integration of these surveying techniques has allowed for the generation of accurate and detailed virtual reconstructions of ballistic impact marks, even in the case of small, geometrically complex craters. The integrated pipeline of advanced point cloud processing, mesh generation, and reverse modeling enables the creation of both positive and negative virtual casts, documenting the preserved morphology of the wall surface at the moment of the survey.
TLS, SfM, and IM not only support the reverse modeling stages but also facilitate the accurate registration of shape and size, depth of penetration, and incidence angle of projectile impacts (e.g., original launch trajectory or angle of strike) in relation to a horizontal reference. The spatial consistency of the dataset makes it possible to evaluate each feature in its spatial context, with georeferencing of these impacts along the northern curtain wall to reconstruct their original height and spatial distribution within the ancient defensive context, contributing to broader polemological interpretations and helping to assess tactical, strategic, or interdisciplinary aspects in the study of ancient siege warfare.
High-detail 3D reconstructions, derived from meshes with varying edge resolutions, can subsequently be converted into numerically reliable and optionally 3D-printable solid models. These reconstructions now serve as a scientifically robust and reliable record. A structured classification protocol will allow these data to be integrated into a shared, interoperable workflow for future comparative studies.
Furthermore, reverse engineering processes will allow hypotheses about projectile shape and behavior to be tested in future simulations. In this way, 3D modeling becomes both a descriptive and predictive tool, capable of informing future reconstructions of the dart-launching catapults believed to have been used during the Sullan siege.
Moreover, the geometric reconstruction of possible weapons and projectiles will benefit from advances in digital modeling, which in recent years have also been applied in the context of lost or undocumented artifacts, especially when only a few historical images survive. Advances in deep learning and artificial intelligence now allow 3D reconstruction from minimal inputs [20,21], supporting new forms of digital restitution even in the absence of complete material data (Figure 14). These methods, while experimental, demonstrate the growing potential of combining archaeological data with AI-based modeling.
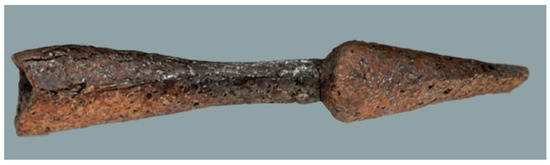
Figure 14.
AI-generated 3D model of an iron ballista bolt with a small, neatly made pyramidal head and a conical socket with a rivet near the mouth (mid 1st century AD, Dorset, UK), created from an image in the British Museum online collection (registration no. 1892,0901.1144), using the free version of Vizcom.ai (https://app.vizcom.ai/, accessed on 21 October 2024).
5. Conclusions
At the end of this initial phase of digital documentation and critical analysis, carried out during this first year, the authors propose a hypothesis that—although requiring further verification—may offer an exciting new perspective: the possible identification of impact traces left by a repeating catapult, known in ancient sources as the polybolos. This weapon, attributed to the ingenuity of Dionysius of Alexandria (an engineer active in the arsenal of Rhodes), is described in detail as the first known automatic missile launcher in history (Philo of Byzantium, Belopoeica, 73.34).
The “multi-launcher” differed from traditional elastic torsion catapults in one key aspect: it could launch multiple darts in rapid succession without the need for manual reloading. It represented the peak of ancient mechanical artillery—a sophisticated, semi-automatic system that may have been known to the Roman military elite during the period.
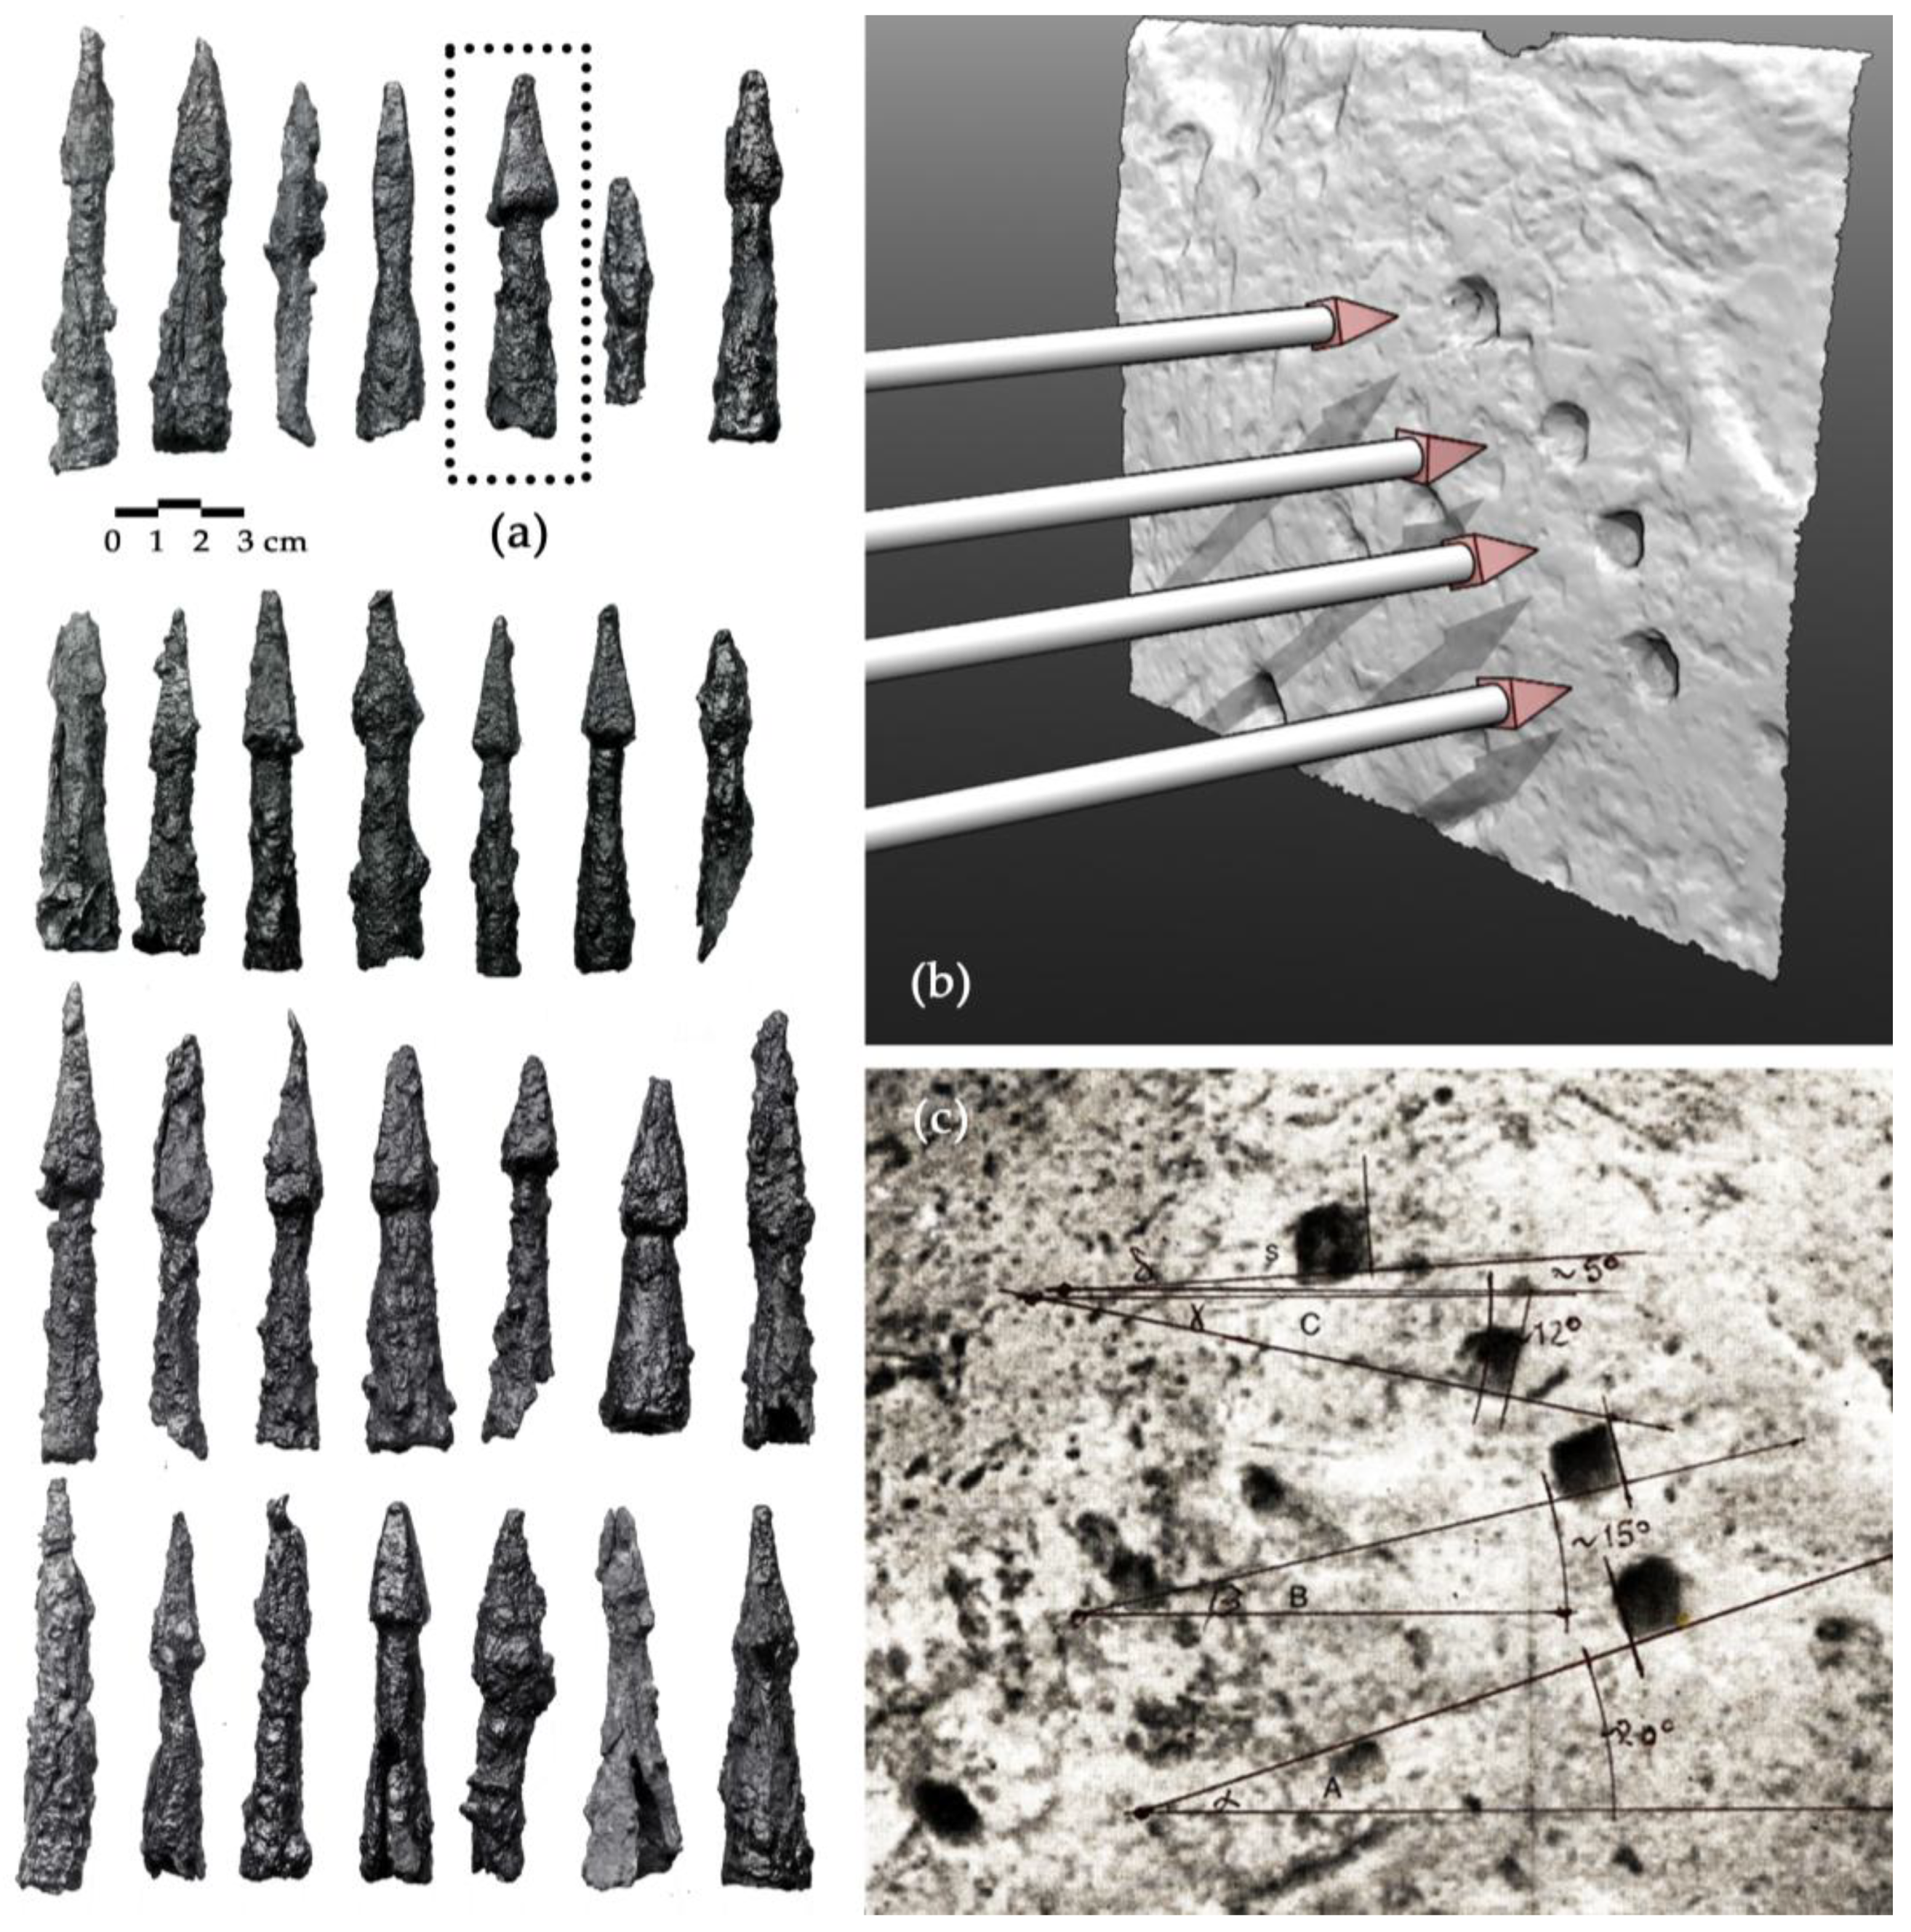
The fan-shaped arrangement of the four square-shaped impact marks—similar in size and depth and regularly spaced—could suggest a repetitive firing mechanism that the authors identified. Their slight angular rotation relative to a common reference axis, along with the presence of a fifth, slightly misaligned imprint, strengthens the hypothesis that the impacts could have been generated by a multi-shot system [22] (Figure 15), which could launch in rapid succession, i.e., the polybolos, meticulously described by Philo of Byzantium (3rd century BC).
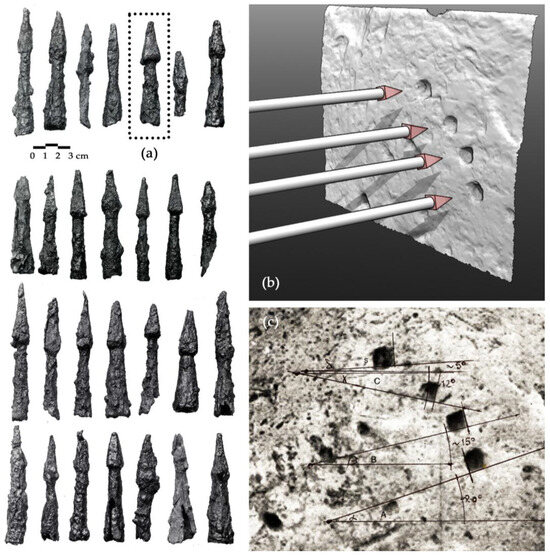
Figure 15.
(a) Photo of various iron ballista bolts with pyramidal heads and various sockets, mid-1st century AD, Dorset (UK). British Museum online collection, registration nos. 1892,0901.1138/1129. Copyright: The Trustees of the British Museum. The metal tip highlighted in the dotted rectangle was selected for 3D reconstruction. (b) Hypothetical reconstruction of multiple firings of metal-tipped darts onto the digitally surveyed surface. (c) Photograph of the fan-shaped group, with approximate identification of the inclinations that directed the digital survey.
The absence of a technical glossary makes the original treatise—in ancient Greek—unintelligible to non-specialists. Expert engineers fluent in classical language helped interpret passages deliberately vague at key points. Their critical interpretation enabled a reconstruction compatible with the materials and technologies of the time for the multi-launcher depicted in the 1:20-scale plates accompanying the German translation by Diels and Schramm [23] (chap. 51, 58, “Mehrlader nach Philon”).
The literal descriptions in some sections of the Greek text suggest that Philo—supposed disciple of Ctesibius [24]—handled or witnessed the polybolos in operation while in besieged Rhodes (305–304 BC). Later scholars, including Russo, reinterpreted the key passages to deepen our understanding of its mechanisms [25], and accounts celebrate its civilian uses in the Imperial period.
The comparison with nineteenth-century weapons such as the Gatling gun, patented in 1862, which used multiple rotating barrels to produce similar firing patterns, invites reflection on the level of mechanical engineering already achieved in antiquity.
Although uncertainties still envelop these preliminary hypotheses, the singular fan-shaped grouping of roughly square indentations defies any logic of human or natural damage. One isolated case might be fortuitous, two similar configurations coincidental—but three analogous instances compel serious consideration in hoplological science.
It is highly unlikely that multiple archers could have produced such uniformly spaced marks independently, nor does it seem plausible that different torsion catapults could have replicated such identical tension and aim under battlefield conditions. The hypothesis of a weapon capable of obtaining similar results, assuming an identical tension of the bowstring and therefore identical loading of the elastic strands, remains difficult if not nearly impossible to reconcile with the properties of conventional elastic-torsion mechanisms. Hence, the idea of a single, stable device producing such a regular dispersion is more consistent with the known characteristics of a multi-launcher: the authors reasonably assume they have detected proof of the polybolos in action, which could possibly explain the slight angular rotation of these indentations, similar for shape and dimensions, in relation to a horizontal reference. Significantly, the square marks on the stone appear at regular spacing inwards—caused by darts falling into the hopper with each release of the firing mechanism.
Despite alterations to the stone surface—including weathering, restoration, archaeological excavation, and even modern vandalism—the surviving ballistic traces retain their diagnostic potential. Their preservation, in spite of volcanic destruction, Roman repairs, and environmental degradation, marks them as rare physical evidence of the power of ancient projectile weaponry.
According to ancient sources, Sulla—who governed the province of Asia during the First Mithridatic War—would likely have had access to advanced Hellenistic artillery [26]. It is therefore not unreasonable to suggest that he may have deployed a polybolos during the siege of Pompeii. While this remains a working hypothesis, it opens new avenues for interdisciplinary investigation currently in progress [27].
Author Contributions
Conceptualization, A.R.; methodology, all authors; software, S.B.; formal analysis and investigation, A.R.; writing—original draft preparation, A.R.; writing—review and editing, S.B.; supervision, A.R.; funding acquisition, A.R.; photogrammetric survey: A.R., S.B. and other members of the UniVanvitelli Team; laser scanner survey, meshing and 3D model elaboration: S.B. Material preparation was performed with different software, in particular Agisoft Metashape elaboration: S.B.; Leica Geosystems Cyclone TLS cloud processing and registration: S.B.; 3D Systems Geomagic Design X meshing and processing of polygonal mesh: S.B.; Adobe Photoshop CC elaboration of figures: S.B. All authors have read and agreed to the published version of the manuscript.
Funding
This research was supported by the project “SCORPiò-NIDI”, CUP B53D23022100006 (DD n. 1012/2023), funded by the Italian Ministry of Research under the PRIN (call DD n. 104/2022) funding initiative.
Institutional Review Board Statement
Not applicable.
Informed Consent Statement
Not applicable.
Data Availability Statement
Research data are available upon request.
Acknowledgments
The authors would like to express their gratitude to the management and the appointed officials of the offices of the Pompeii Archaeological Park for granting authorizations for site access and survey operations.
Conflicts of Interest
The authors declare no conflicts of interest.
Abbreviations
The following abbreviations are used in this manuscript:
| 3D | Three-Dimensional |
| AI | Artificial Intelligence |
| DM | Diffuse Map |
| IM | Image Matching |
| DGM | Direct Geometric Modeling |
| MLT | MultiStripe Laser Triangulation |
| OM | Occlusion Map |
| SBRM | Surface-Based Reverse Modeling |
| SfM | Structure from Motion |
| TLS | Terrestrial Laser Scanner |
References
- Maiuri, A. Introduzione allo Studio di Pompei, a Cura di G. Oscar Onorato, Corso di Antichità Pompeiane ed Ercolanesi 1942–43; GUF: Napoli, Italy, 1943. [Google Scholar]
- Van Buren, A.W. Further Studies in Pompeian Archaeology. Mem. Am. Acad. Rome 1925, 5, 103–113. [Google Scholar] [CrossRef]
- Van Buren, A.W. Further Pompeian Studies. Mem. Am. Acad. Rome 1932, 10, 7–54. [Google Scholar] [CrossRef]
- Burns, M. Pompeii under Siege: A Missile Assemblage from the Social War. J. Rom. Mil. Equip. 2015, 14, 1–10. [Google Scholar]
- Langella, A.; Bish, D.L.; Calcaterra, D.; Cappelletti, P.; Cerri, G.; Colella, A.; Graziano, S.F.; Papa, L.; Perrotta, A.; Scarpati, C.; et al. L’Ignimbrite Campana (IC). In Le Pietre Storiche della Campania dall’oblio alla Riscoperta; de Gennaro, M., Calcaterra, D., Langella, A., Eds.; Luciano Editore: Napoli, Italy, 2013; pp. 155–177. ISBN 88-6026-182-3. [Google Scholar]
- Kastenmeier, P.; Di Maio, G.; Balassone, G.; Boni, M.; Joachimski, M.; Mondillo, N. The Source of Stone Building Materials from the Pompeii Archaeological Area and Its Surroundings. Period. Di Mineralogia 2010, 87, 38–58. [Google Scholar] [CrossRef]
- ISO/IEC Guide 98-3; 2008 Uncertainty of Measurement—Part 3: Guide to the Expression of Uncertainty in Measurement (GUM:1995). International Organization for Standardization: Geneva, Switzerland, 2008.
- Taylor, J.R. Introduzione all’Analisi Degli Errori. Lo Studio Delle Incertezze Nelle Misure Fisiche, 3rd ed.; Zanichelli: Bologna, Italy, 2023; ISBN 978-88-08-39966-3. [Google Scholar]
- Heisenberg, W. Fisica e Oltre. Incontri Con i Protagonisti 1920–1965, 6th ed.; Bollati Boringhieri: Torino, Italy, 2013; ISBN 978-88-339-2416-8. [Google Scholar]
- De Rubertis, R. Il Disegno dell’Architettura; NIS: Rome, Italy, 1994; ISBN 978-88-430-0272-6. [Google Scholar]
- Russo, F.; Russo, F. 89 a.C. Assedio a Pompei: La Dinamica e Le Tecnologie Belliche della Conquista Sillana di Pompei; edizioni Flavius: Pompei, Italy, 2005; ISBN 88-88419-32-2. [Google Scholar]
- Vitucci, G. (Ed.) La Guerra Giudaica di Giuseppe Flavio; Mondadori: Milano, Italy, 1989; ISBN 88-04-32627-1. [Google Scholar]
- Payne, G. (Ed.) Catalogue of the Museum of Local Antiquities Collected by Mr Henry Durden of Blandford, Dorsetshire; South Counties Press: Lewes, DE, USA, 1892. [Google Scholar]
- Manning, W.H. Catalogue of the Romano-British Iron Tools, Fittings and Weapons in the British Museum; Published for the Trustees of the British Museum by British Museum Publications: London, UK, 1985; ISBN 0-7141-1370-0. [Google Scholar]
- Guidi, G.; Micoli, L.L.; Gonizzi Barsanti, S.; Brennan, M.; Frischer, B. Image-Based 3D Capture of Cultural Heritage Artifacts an Experimental Study about 3D Data Quality. In Proceedings of the 2015 Digital Heritage, Granada, Spain, 28 September–2 October 2015; Volume 2, pp. 321–324. [Google Scholar]
- Helle, R.H.; Lemu, H.G. A Case Study on Use of 3D Scanning for Reverse Engineering and Quality Control. Mater. Today Proc. 2021, 45, 5255–5262. [Google Scholar] [CrossRef]
- Lazzarini, M. Metrologia romana. In Conimbriga; Universidade de Coimbra: Coimbra, Portugal, 1965; Volume IV. [Google Scholar]
- Remondino, F.; El-Hakim, S. Image-Based 3D Modelling: A Review. Photogramm. Rec. 2006, 21, 269–291. [Google Scholar] [CrossRef]
- Guidi, G.; Russo, M.; Beraldin, J.-A. Acquisizione 3D e Modellazione Poligonale; McGraw-Hill Education: New York, NY, USA, 2010. [Google Scholar]
- Kniaz, V.V.; Remondino, F.; Knyaz, V.A. Generative Adversarial Networks for Single Photo 3D Reconstruction. Int. Arch. Photogramm. Remote Sens. Spat. Inf. Sci. 2019, XLII-2-W9, 403–408. [Google Scholar] [CrossRef]
- Fu, K.; Peng, J.; He, Q.; Zhang, H. Single Image 3D Object Reconstruction Based on Deep Learning: A Review. Multimed. Tools Appl. 2021, 80, 463–498. [Google Scholar] [CrossRef]
- Rossi, A.; Gonizzi Barsanti, S.; Bertacchi, S. Use of Polybolos on the City Walls of Ancient Pompeii: Assessment on the Anthropic Cavities. Nexus Netw. J. 2024, 27, 1–30. [Google Scholar] [CrossRef]
- Diels, H.; Schramm, E.A. Philons Belopoiika, viertes Buch der Mechanik; Akademie der Wissenschaften in Kommission bei G. Reimer: Berlin, Germany, 1919. [Google Scholar]
- Drachmann, A.G. Ktesibios, Philon and Heron: A Study in Ancient Pneumatics; Ejnar Munksgaard: Copenaghen, Denmark, 1948. [Google Scholar]
- Rossi, C.; Russo, F. Ancient Engineers’ Inventions; History of Mechanism and Machine Science; Springer International Publishing: Cham, Switzerland, 2017; Volume 33, ISBN 978-3-319-44475-8. [Google Scholar]
- Piganiol, A. Le Conquiste Dei Romani. Fondazione e Ascesa di Una Grande Civiltà; Il Saggiatore: Milano, Italy, 2010; ISBN 978-88-565-0162-9. [Google Scholar]
- Rossi, A.; Formicola, C.; Gonizzi Barsanti, S. Ingegna Romana. Dalle fonti ai modelli, dai reperti alle ricostruzioni. Diségno 2024, 14, 229–238. [Google Scholar] [CrossRef]


Disclaimer/Publisher’s Note: The statements, opinions and data contained in all publications are solely those of the individual author(s) and contributor(s) and not of MDPI and/or the editor(s). MDPI and/or the editor(s) disclaim responsibility for any injury to people or property resulting from any ideas, methods, instructions or products referred to in the content. |
© 2025 by the authors. Licensee MDPI, Basel, Switzerland. This article is an open access article distributed under the terms and conditions of the Creative Commons Attribution (CC BY) license (https://creativecommons.org/licenses/by/4.0/).