Proceeding Paper

Breakdown Characteristics of Unequal Sphere–Sphere Electrode Configuration Under DC Stress †

by
Indhulekha Jayachandran
and
Gowrishankar Shanmugam
*
Department of Electrical and Electronics Engineering, National Institute of Technology Puducherry, Karaikal 609609, India
*
Author to whom correspondence should be addressed.
Presented at the 4th International Conference on Future Technologies in Manufacturing, Automation, Design and Energy 2024 (ICOFT 2024), Karaikal, India, 12–13 November 2024.
Eng. Proc. 2025, 95(1), 12; https://doi.org/10.3390/engproc2025095012
Published: 13 June 2025

Abstract

:
Failure of air gap insulation is one of the prominent issues in insulation coordination for outdoor applications. Though uniform electric field distribution is desirable, the difficulty in achieving it often makes insulation engineers settle for weakly non-uniform fields. One of the electrode systems known for its weakly non-uniform field is sphere gap, which is reliable due to its standardized breakdown characteristics. Though the breakdown characteristics of spheres with the same diameter are widely studied and standardized, spheres with unequal diameters have received minimal attention. In this paper, an attempt is made to study the breakdown characteristics of unequal spheres under DC stress in atmospheric air. The experimental breakdown studies were conducted for different spacings of spheres with unequal diameters of 100 mm, 50 mm, and 20 mm. The electric field variation for the experimental combination of sphere gaps and their corresponding utilization factors were computed using ANSYS 2024 R1. The results obtained were compared with the standard sphere gap. An unequal sphere gap has a non-uniform electric field distribution and a lower utilization factor compared to the standard sphere gap. It appears that the larger sphere experiences the maximum electric field, regardless of whether it is high-voltage or ground electrode. However, its breakdown characteristics are found to be comparable with standard sphere gap up to certain gap spacing under DC voltage.

1. Introduction

The breakdown characteristics of atmospheric air under different electrode configurations have been discussed for a long time. Throughout, the standard sphere gap method has remained prevalent, as it is a reliable method for calibration and measuring purposes. Diverse studies have been conducted on sphere gaps, showing the variation of breakdown voltage with environmental conditions as well as electrode geometry. Various simulation and experimental studies have been performed under AC, DC, and impulse conditions for spheres of equal diameter and varying gap distances [1,2,3,4,5,6]. The breakdown voltage variation with atmospheric pressure, temperature, sphere diameter, and gap length have already been discussed [3,4,5,6]. Though the maximum electric field is inversely proportional to the gap distance, sphere–sphere electrode arrangements have non-uniform electric field configurations. As the gap distance becomes less than twice the radius of the sphere, the field becomes weakly uniform [7]. In a study on the effect of polymeric and cellulose dielectric barrier presence on the sphere gap, it was observed that the maximum electric field occurred when the non-uniformity factor reached unity [3]. Simulations of the standard sphere–sphere electrode configuration using the finite element method (FEM) disclose the presence of the maximum electric field at the sparking point of the sphere due to the high concentration of flux. Symmetrical equipotential lines are observed, and both the electric field and the flux density decrease with increases in gap distance [4].
Breakdown voltage varies linearly with the sphere gap and non-linearly with the sphere radius. With the rise in temperature, the maximum field and relative air density factor decline, while with the increase in pressure, the maximum field and relative air density factor increase [6]. However, for unequal spheres, only a few studies have been conducted [8,9,10,11]. In these works, only the variation of breakdown voltage with sphere diameter, gap length, and pressure is discussed. The electric field and potential distribution of unequal spheres were studied, and it was found that for unequal spheres, the electrical field is stronger in the pair where DC is applied to one sphere and the other sphere grounded than in the case where DC is applied to both spheres [9]. In [10], an attempt was made to estimate the interaction between two unequal conducting spheres in a uniform field using the image dipole method. It was ultimately concluded that the plane ground had no influence on polarization. From [11], it is evident that the sphere radius has an effect on the maximum electric field for equal and unequal spheres with various gap distances.
Very few works have focused on the breakdown characteristics of unequal spheres, and none have addressed the degree of uniformity in the electric field or the variation of breakdown voltage for unequal sphere gaps compared to equal sphere gaps. This work establishes a relationship between the utilization factor and breakdown characteristics of unequal spheres, and also compares the results for equal spheres to the breakdown characteristics of standard sphere gaps under DC voltage. The present study aims to explore the impact of geometric non-uniformity in spheres on field enhancement and potential distribution, focusing on scenarios with both small- and large-diameter ratios. Additionally, the study investigates various breakdown mechanisms in unequal spheres, contributing to a better understanding of electrical performance in high-voltage applications. The application of unequal spheres in high-voltage engineering is crucial for understanding and controlling electric field distribution, corona discharge behavior, and electrical breakdown in various systems. By carefully managing these factors, engineers can design safer, more efficient, and more reliable high-voltage equipment. The breakdown voltage of sphere gaps with unequal diameters was determined experimentally, and the electric field distribution and utilization factor were computed using ANSYS. The results obtained are compared with those of the standard sphere to scrutinize the variation in breakdown characteristics between equal and unequal spheres. Section II details the methodology, which is divided into three subsections: electrode arrangement, computation, and experimentation.

2. Methodology

The breakdown voltage (BDV) of different gaps (d) is determined experimentally, and the utilization factor is calculated from electric field computations. The experimental procedure and electric field computation methodology are explained in the subsequent subsections.

2.1. Electric Field Computation

The electric field computation is performed using ANSYS Maxwell software. ANSYS Maxwell uses the finite element method (FEM) to solve statistical, frequency-domain, and time-varying calculations by applying the Poisson’s and Laplace’s equations. The sphere gap arrangement is modeled in 3D, as shown in Figure 1, with the appropriate diameter and spacing.
The electric field distribution is governed by Poisson’s equation:
2 V = ρ ε
where V is the applied voltage, ρ is the space charge density in the region, ∇ is the del operator, and ε is the electric permittivity of free space (vacuum). In actual cases, space charge is not present in the high-voltage apparatus ( ρ = 0 ) and the Laplace’s equation is used to calculate the potential distribution.
2 V = 0
The electric stress of an insulating material is equal to the electric field intensity. From Equations (1) and (2), the electric stress can be written as:
E = V
The electric field computation is performed by applying a unity voltage to each case from A to F. From the resulting electric field graph, the maximum electric field (Emax), average electric field (Eavg), and utilization factor are calculated.
U t i l i z a t i o n   F a c t o r = A v e r a g e   E l e c t r i c   F i e l d M a x i m u m   E l e c t r i c   F i e l d

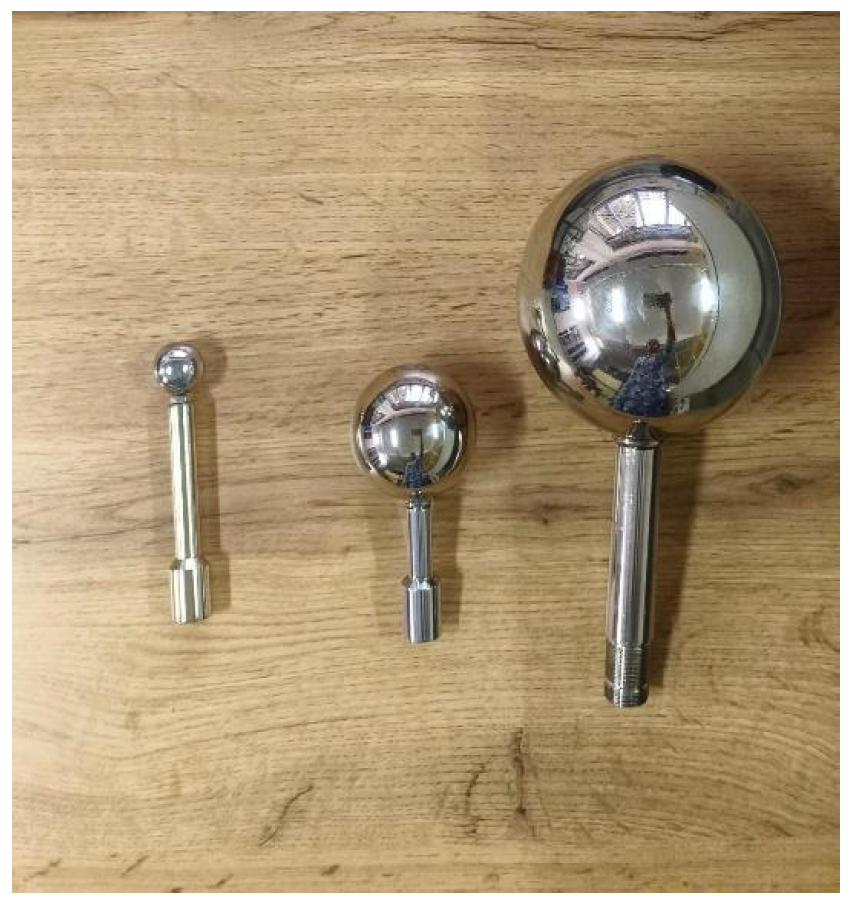
2.2. Electrode Arrangement

Three spheres of 20 mm, 50 mm, and 100 mm diameters, as shown in Figure 2, are considered in this study. The breakdown voltage is determined for an arrangement of six different combinations of spheres labeled A to F, as shown in Table 1. The spacing varies from 5 mm to 50 mm. The arrangement of electrodes for experimentation is shown in Figure 3, in which the upper sphere is energized and the lower one is grounded.

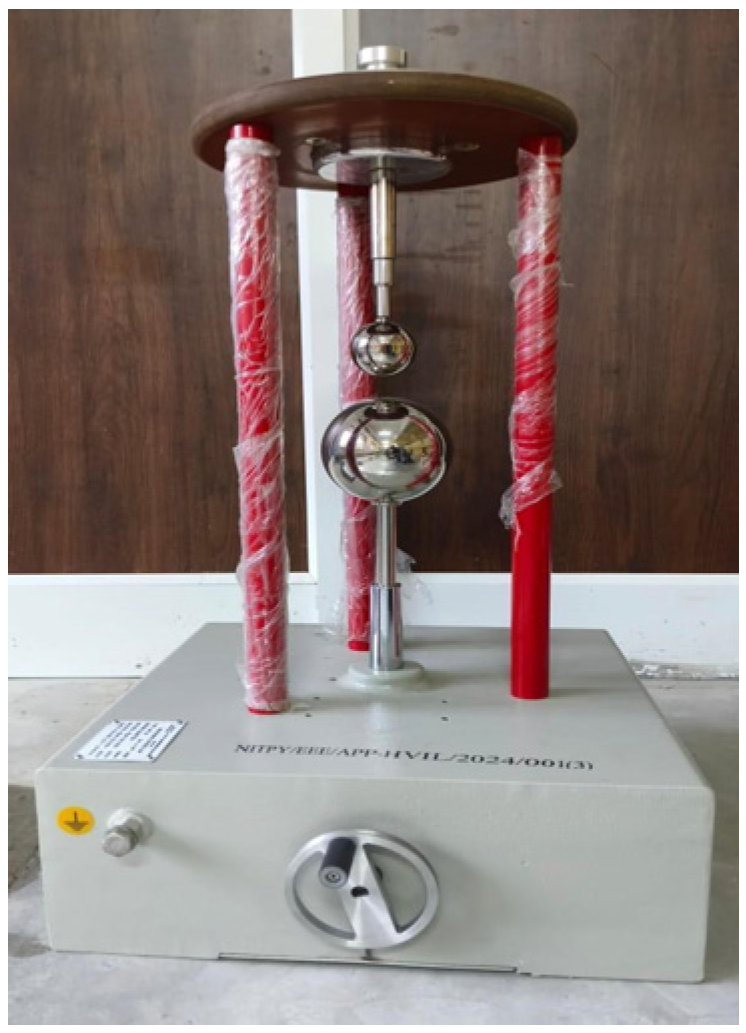
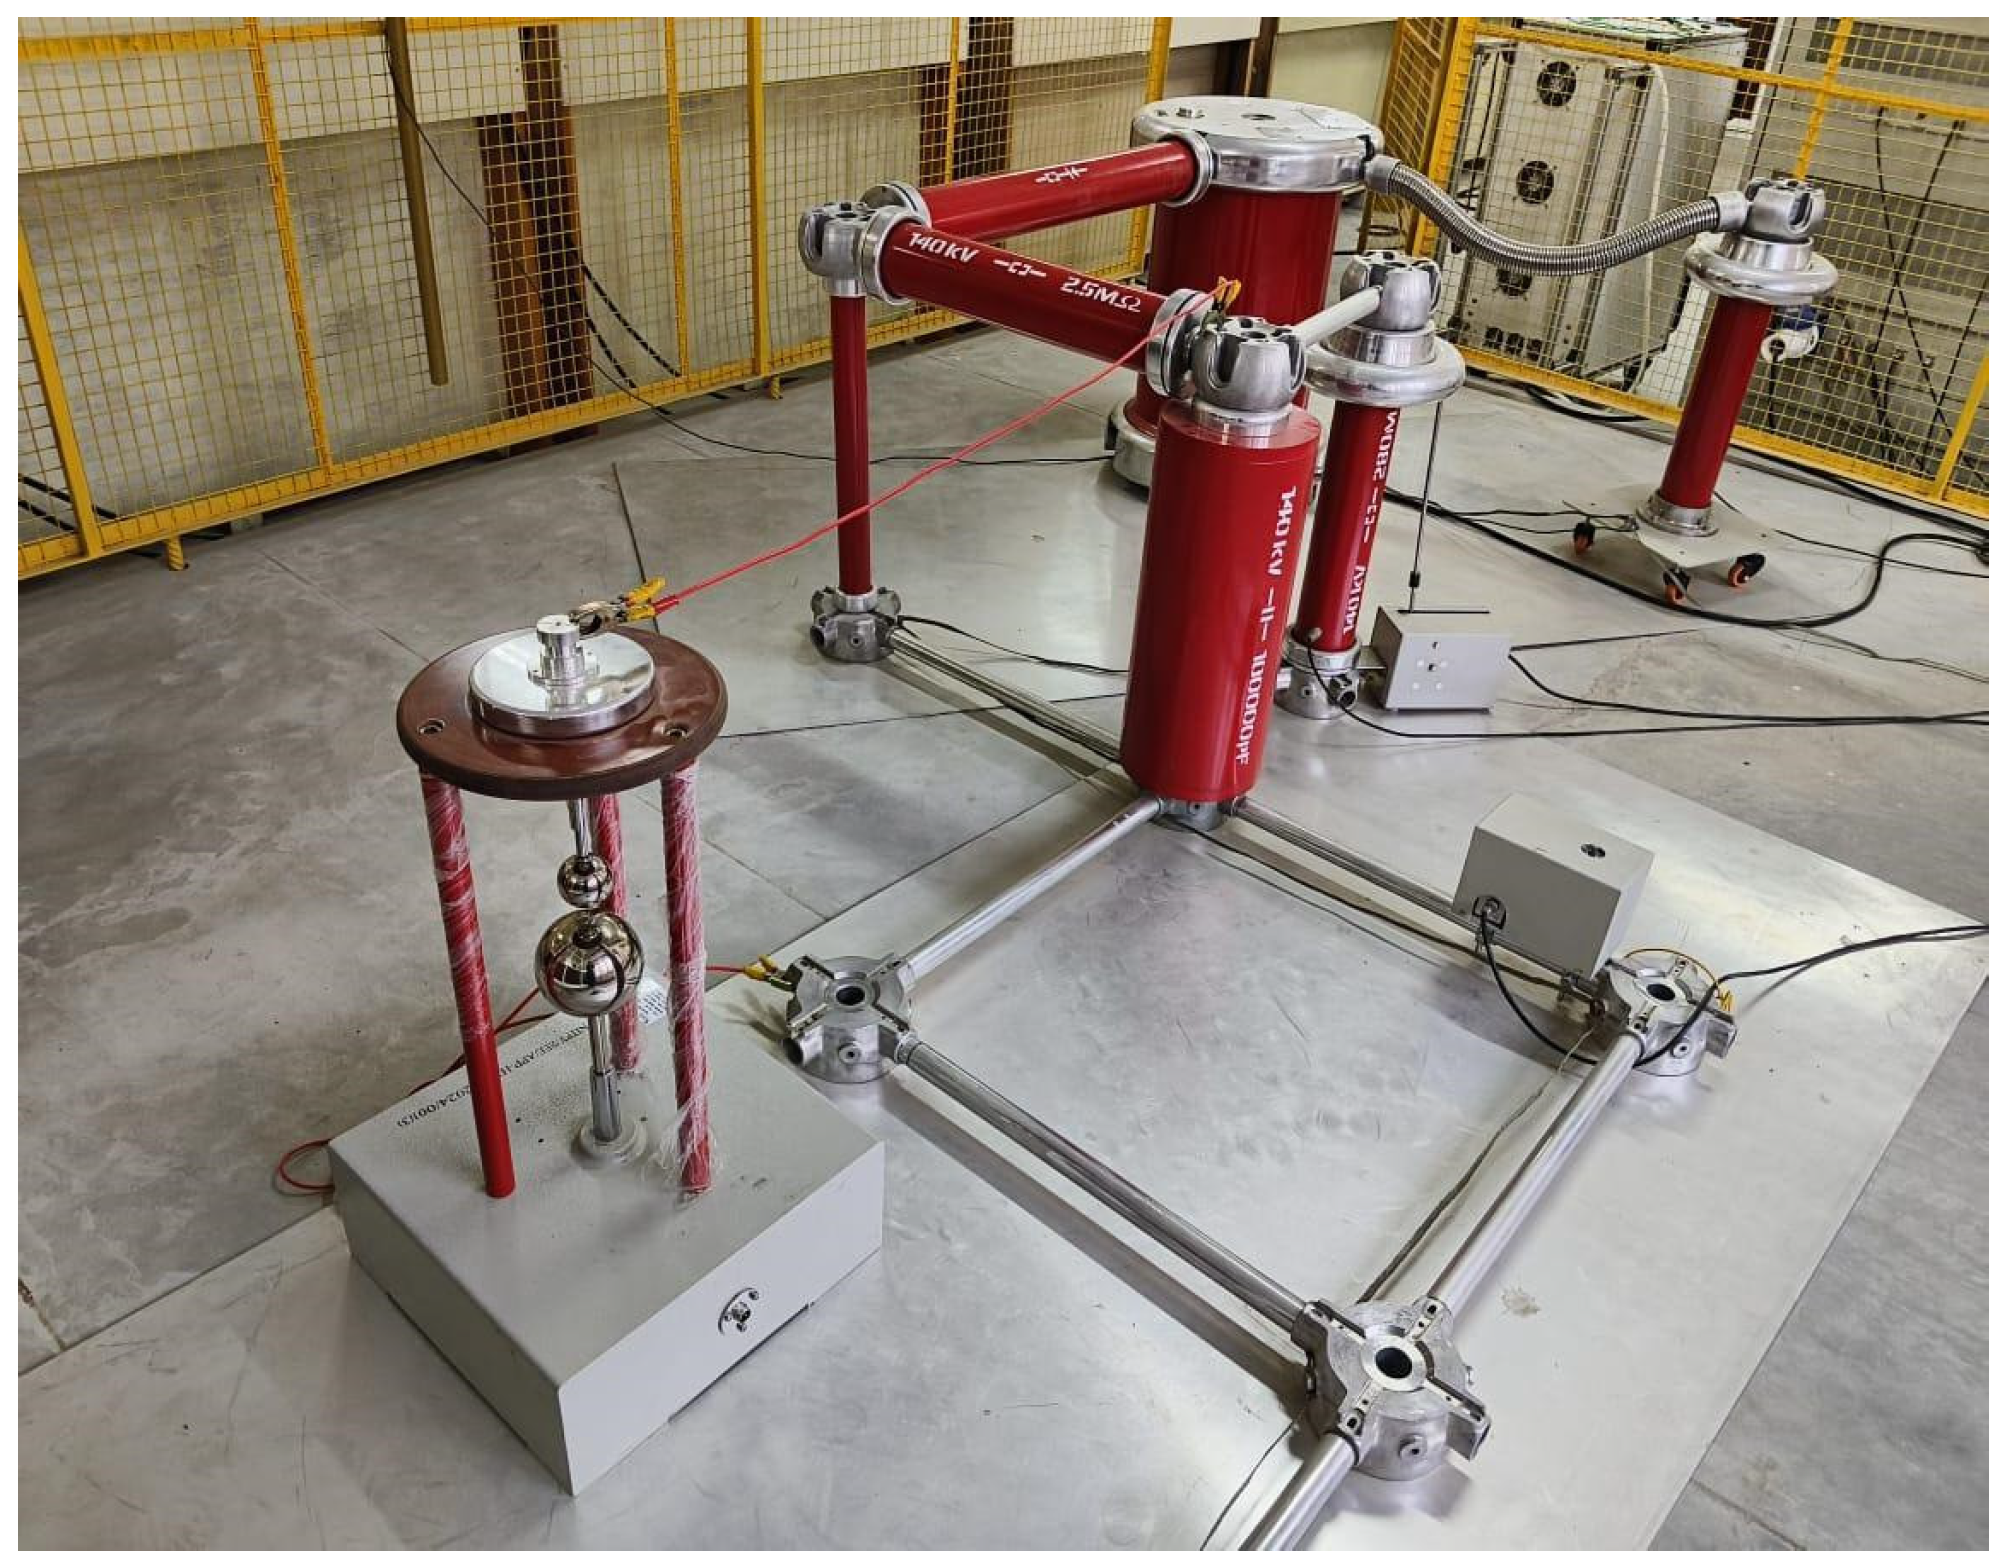
2.3. Experimental Setup

The breakdown voltage is experimentally determined using a 100 kV AC/DC/Impulse modular setup, as shown in Figure 4. The experimental procedure is based on IEC 60052 and IS 1876. The DC voltage is applied to the upper sphere at a rate of 2 kV/s until breakdown of the gap occurs, while the lower sphere is grounded [12]. The breakdown voltages obtained from the experiments are adjusted to the standard temperature and pressure using the air density correction factor provided by Equation (5). For the sphere–sphere electrode configuration, the humidity correction factor can be neglected [13].
The air density correction factor is given by
k 1 = p 760 293 ( 273 + t )
where p is the pressure in torr and t is the temperature in ℃.

3. Results and Discussion

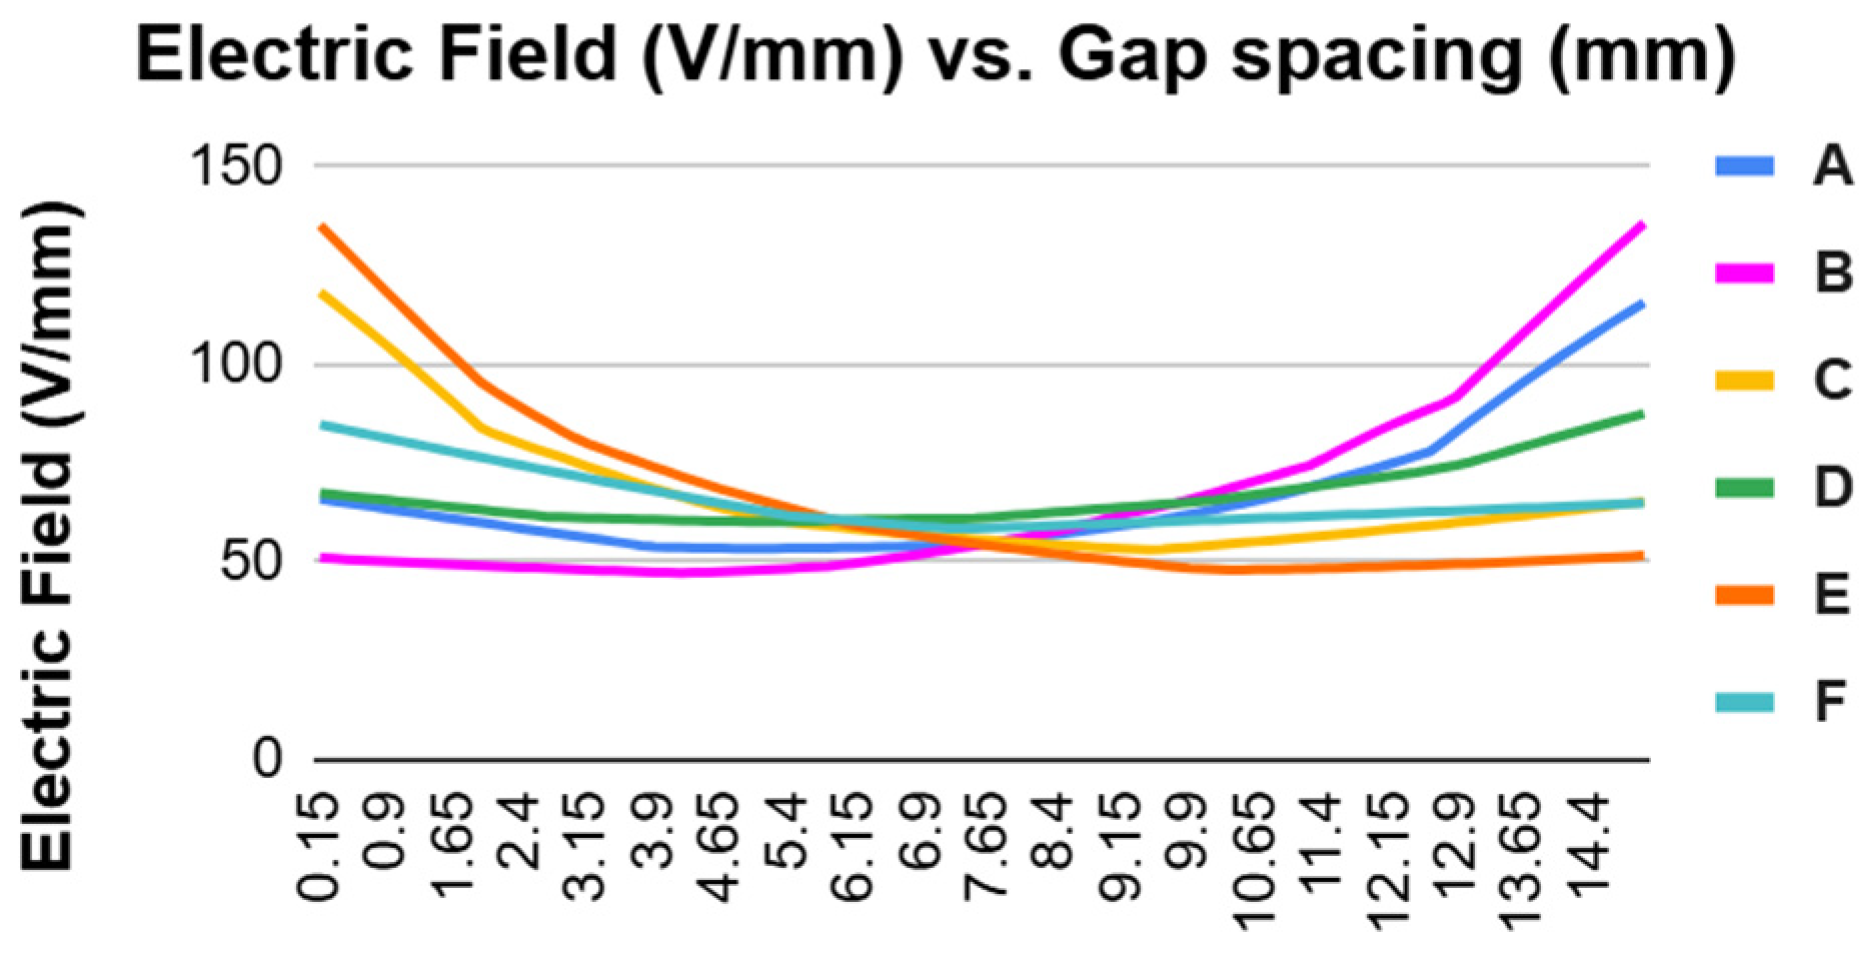
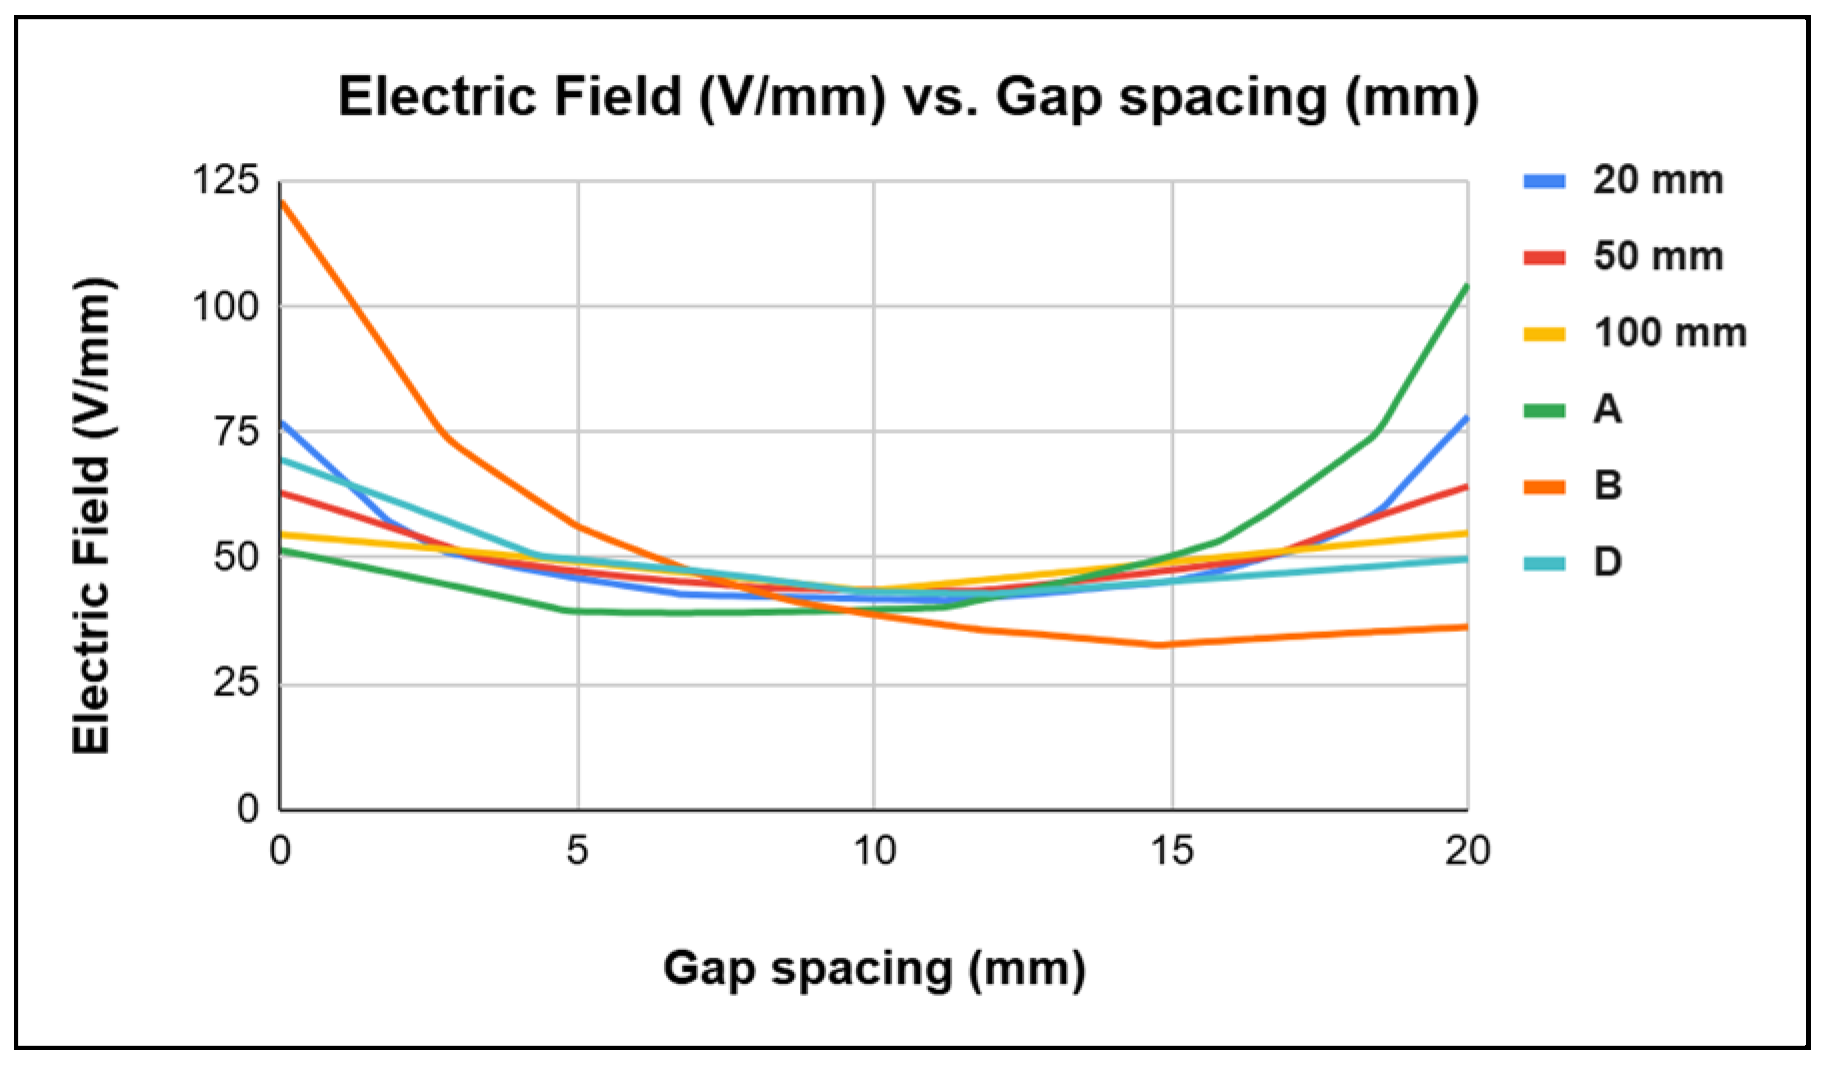
3.1. Electric Field Variation

A comparison of the electric field distributions for all sphere combinations is shown in Figure 5. It is evident that the magnitude of the electric field is lower near the high-voltage (HV) electrode and increases towards the ground electrode in cases A, B, and D. Conversely, the magnitude of the electric field is higher near the HV electrode and decreases towards the ground electrode in cases C, E, and F. This shows that the maximum value of the electric field occurs closer to the larger sphere regardless of whether it serves as the HV or ground electrode. It can also be observed that the magnitude of the maximum electric field remains nearly the same even if the HV and ground electrodes are interchanged.

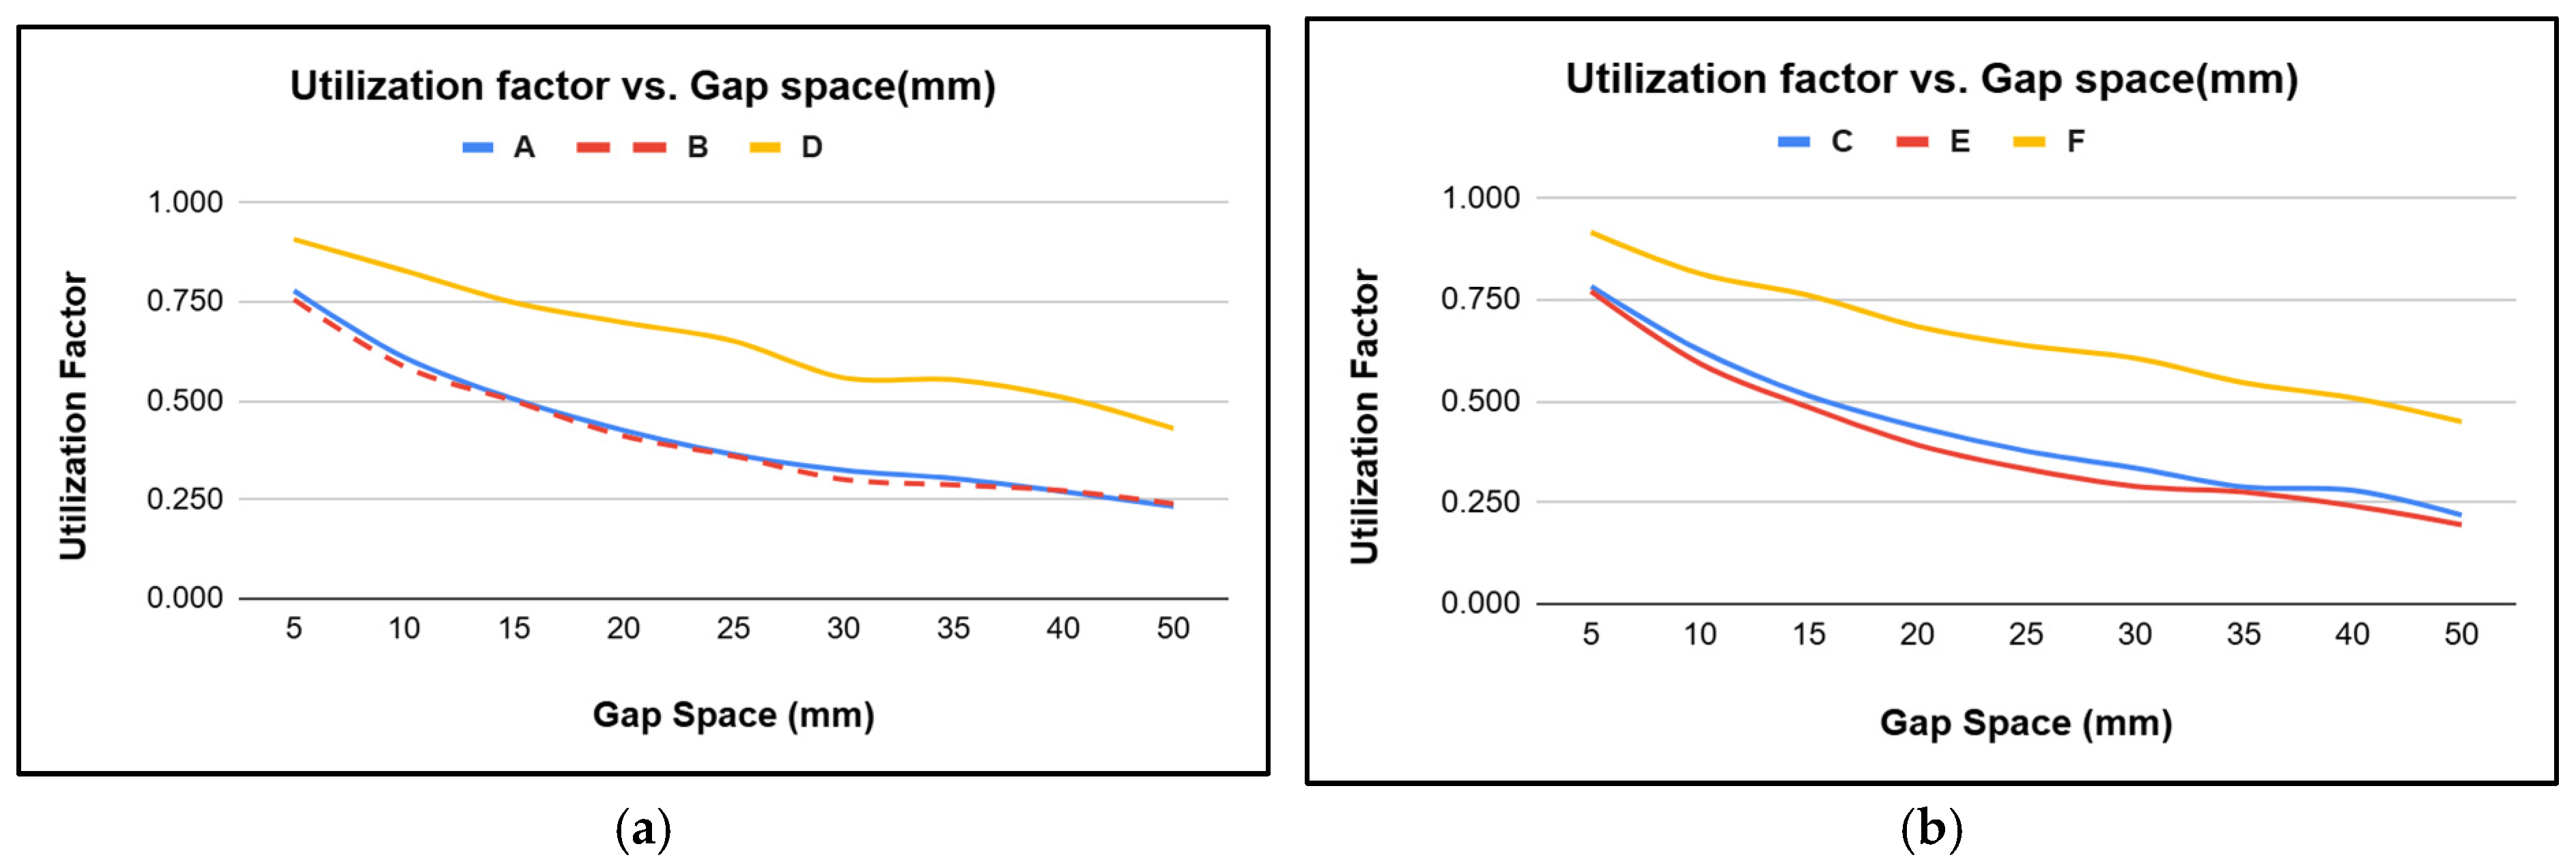
3.2. Utilization Factor

The utilization factor indicates the degree of electric field uniformity; higher the value of utilization factor, greater the uniformity of electric field distribution. The utilization factor varies inversely with gap spacing for all combinations of unequal spheres as shown in Figure 6a,b. The utilization factor even remains unchanged when the HV and ground electrodes are interchanged. It is evident that among the six combinations, cases F and D have the highest utilization factors, and cases E and B have the lowest. When the HV is applied to smaller spheres, i.e., in cases A, B, and D, the utilization factors are slightly higher compared to those in cases C, E, and F. Comparing the utilization factors across all cases, the trend increases in the order (B,E) < (A,C) < (D,F). It can be inferred that the utilization factor is higher for spheres with larger diameters, resulting in greater uniformity in electric field distribution. It is also observed that the utilization factor becomes very small at larger gap spacings when the difference between unequal sphere diameters increases.

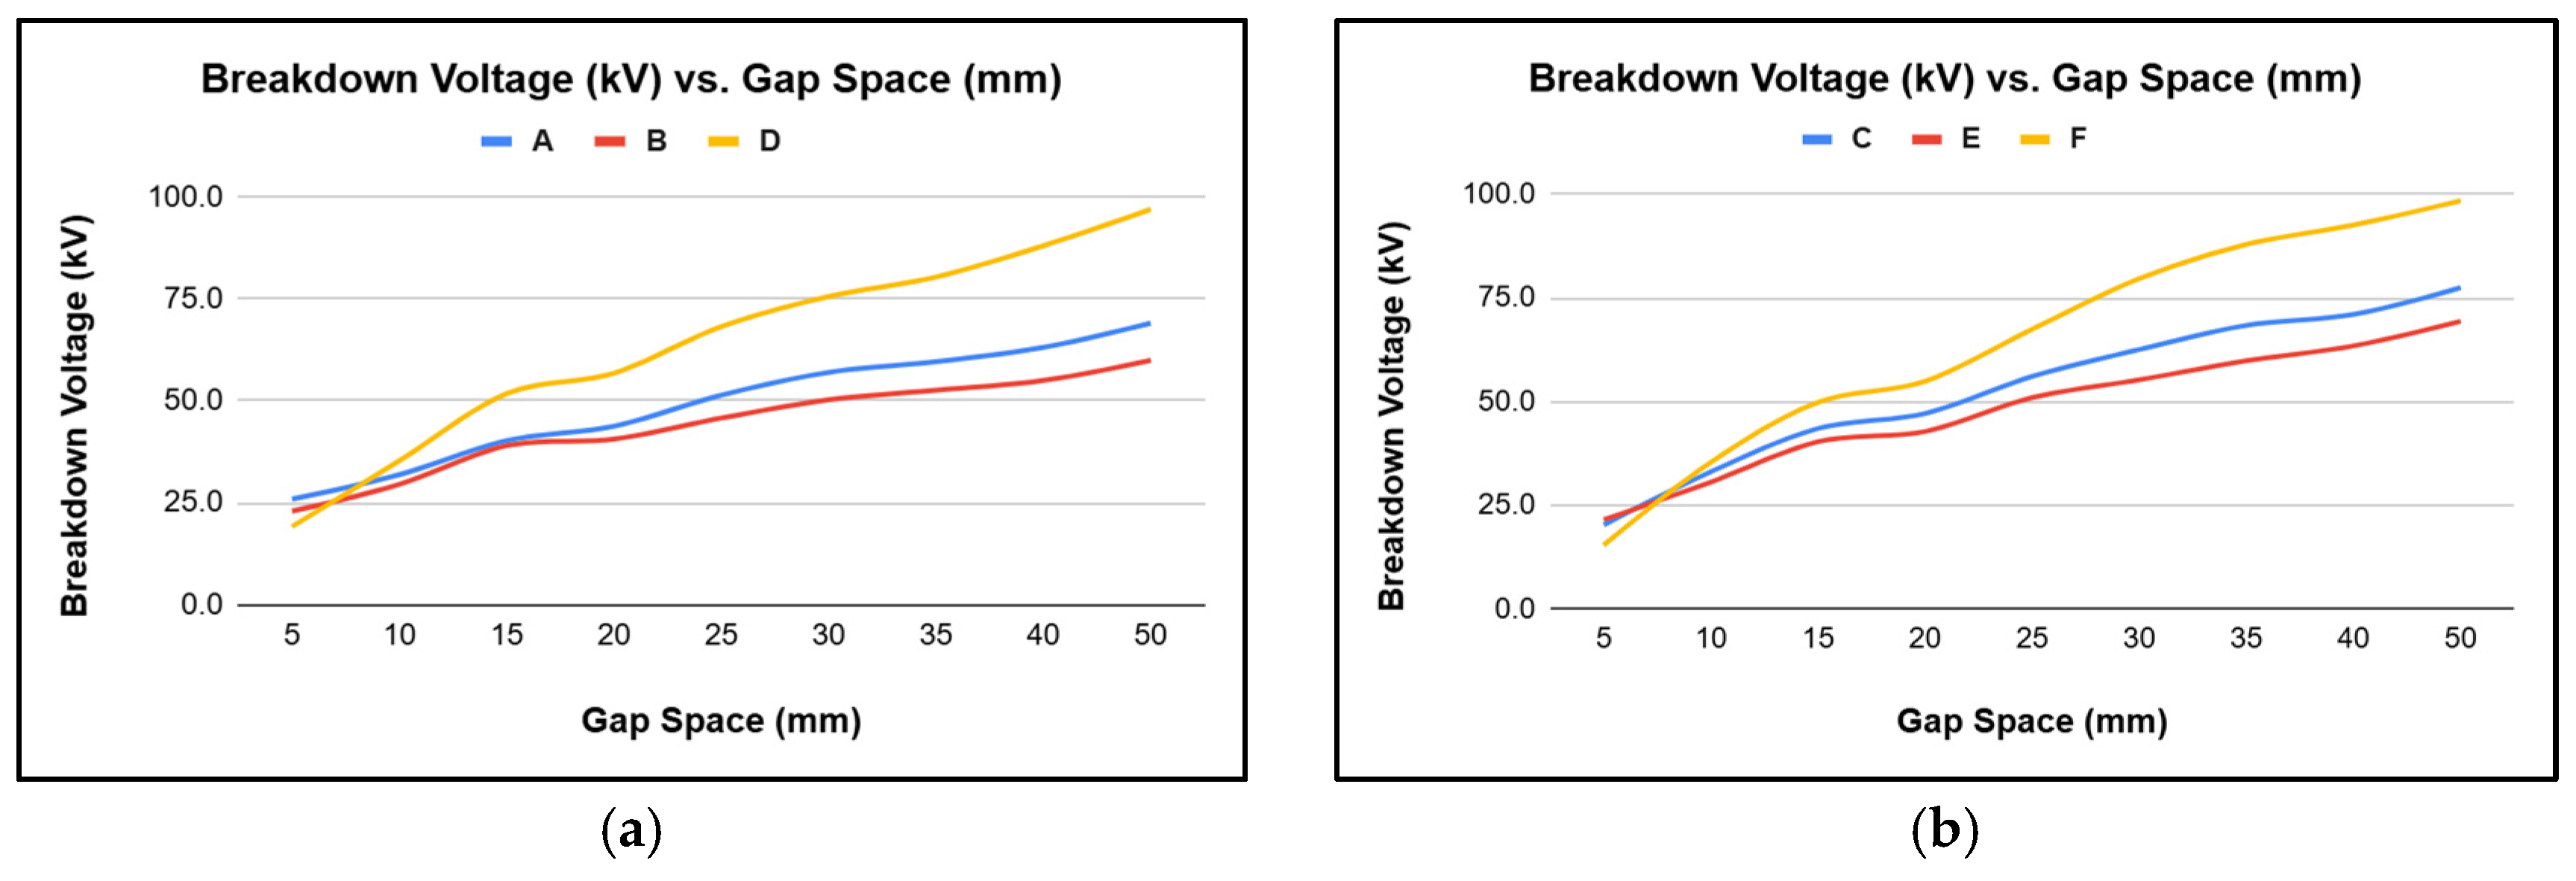
3.3. Breakdown Voltage

The variation of breakdown voltage with respect to gap spacing is shown in Figure 7a,b. The breakdown voltage increases linearly with gap spacing for all sphere combinations. For a given gap spacing, the breakdown voltage is higher for larger spheres compared to smaller spheres. This is because the presence of larger spheres reduces the maximum electric field. However, the breakdown voltage at shorter gap spacings remains unchanged regardless of sphere diameter. The breakdown voltage also remains unchanged when the HV and ground electrodes are interchanged, consistent with the electric field distribution and utilization factor.

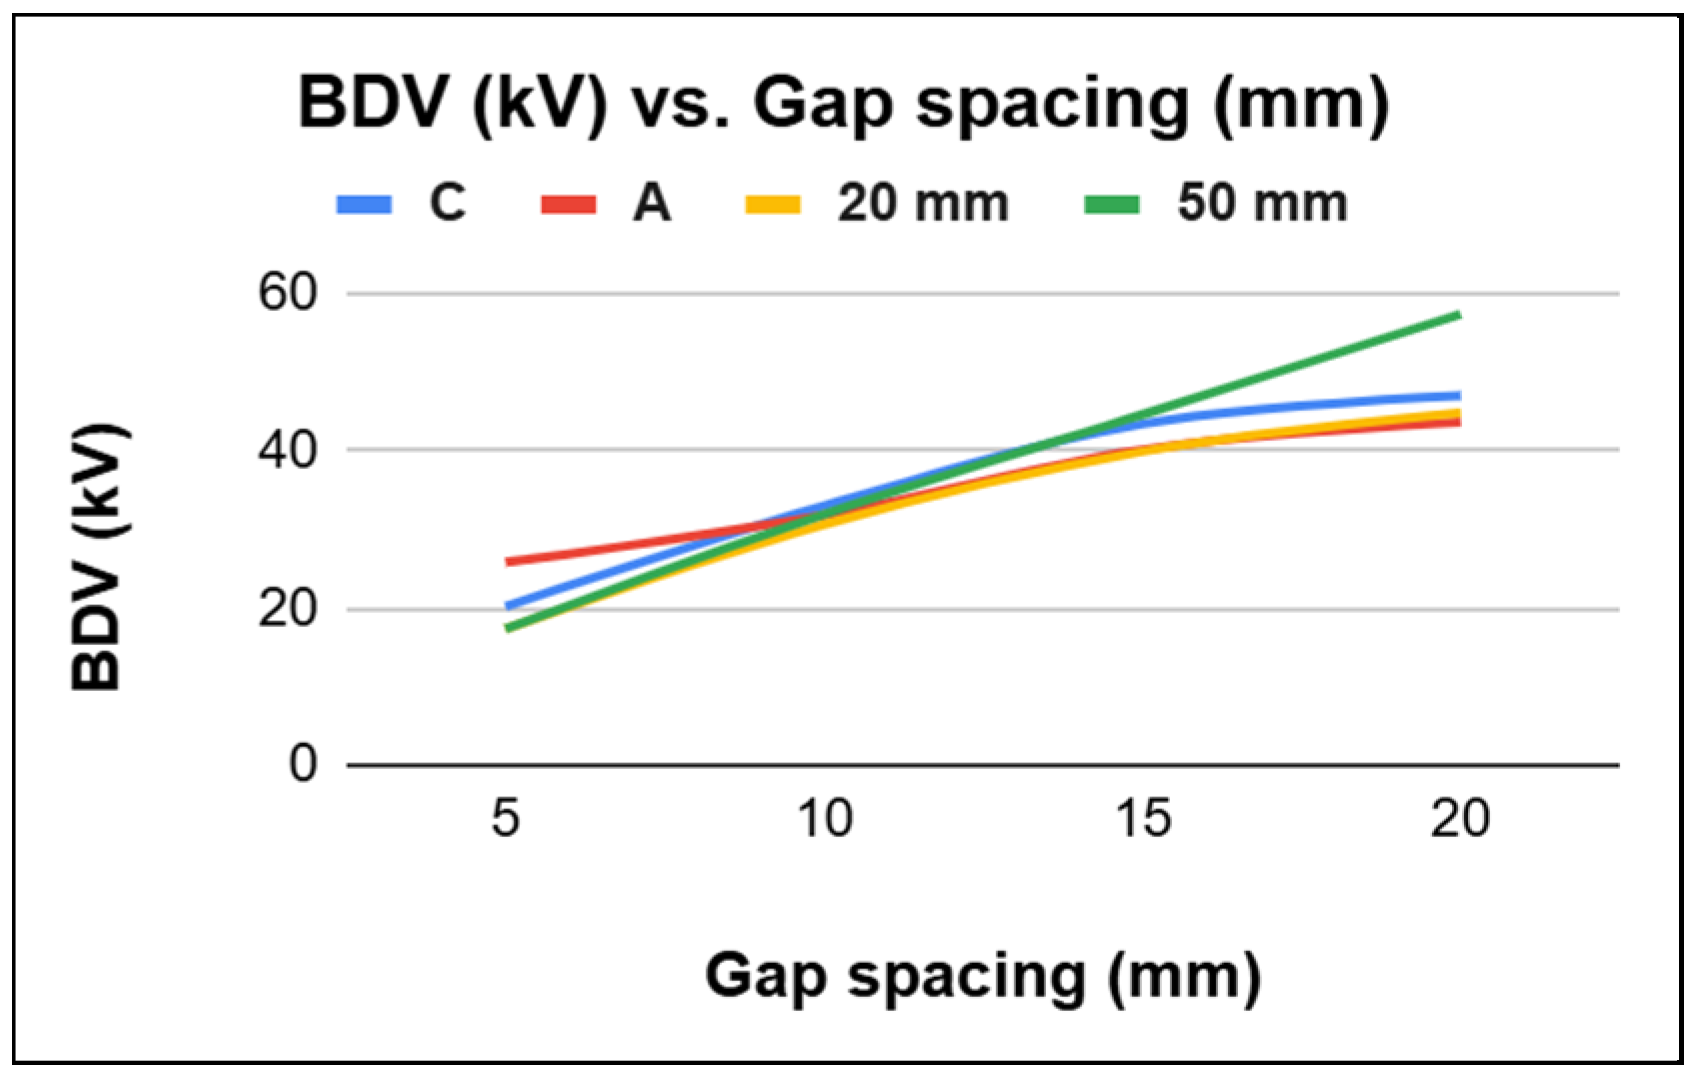
3.4. Comparison of Gaps with Equal and Unequal Spheres

The electric field distribution for standard spheres and unequal spheres with a gap spacing of 20 mm is shown in Figure 8. The standard spheres are considered based on the diameters of the unequal spheres to allow for better comparison. The standard sphere gap has a symmetrical electric field distribution, whereas no symmetry is found for unequal spheres. The magnitude of the maximum electric field is also higher for unequal spheres compared to standard spheres at a given gap spacing. A similarity observed in both standard and unequal spheres is that the magnitude of the maximum electric field decreases as the sphere diameter increases.
Figure 9 represents the variation of the utilization factor with gap spacing for standard and unequal spheres. It is clear that the utilization factor for unequal spheres is lower than that of standard spheres. The utilization factor increases with sphere diameter for a given gap spacing and decreases with increasing gap spacing. However, the rate of decrease in the utilization factor is higher for unequal spheres compared to that of standard spheres. The greater degree of non-uniformity in the electric field distribution results in higher rate of utilization factor reduction for unequal spheres.
The variation of breakdown voltage with gap spacing for standard and unequal spheres is plotted in Figure 10. Though the breakdown voltage increases with gap spacing for both standard and unequal spheres, different trends are observed in each case. At shorter gaps (less than 10 mm), the breakdown voltage of unequal spheres is higher than that of standard sphere gaps. Interestingly, the 20 mm standard sphere gap and combination A (20–50 mm) have almost comparable breakdown voltages for gap spacings greater than 10 mm. However, the breakdown characteristics of the 50 mm standard sphere and combination C (50–20 mm) show higher breakdown voltages as gap spacing increases, compared to those of other unequal spheres. This shows that unequal spheres have higher breakdown voltage for shorter gap spacings, comparable breakdown voltage up to a certain gap spacing, and lower breakdown voltage for larger gap spacings compared to standard sphere gaps.

4. Conclusions

The breakdown characteristics of unequal spheres with diameters of 20 mm, 50 mm, and 100 mm under DC voltage were studied. ANASYS Maxwell was utilized to compute the electric field and utilization factor by modeling the sphere gap in 3D. The results for unequal sphere gaps were compared with those of standard sphere gaps, and the following conclusions are drawn.
  • Unequal sphere gaps have a non-uniform electric field distribution compared to standard sphere gaps, which results in lower utilization factors for unequal spheres;
  • The maximum electric field is found to occur on larger spheres irrespective of its position as the HV or ground electrode in unequal spheres;
  • As the sphere diameter increases, the utilization factor also increases for a given gap;
  • The utilization factor decreases with increasing gap spacing for a given sphere dimension, and the decrement is greater for unequal spheres compared to standard spheres;
  • Though the standard sphere gap has superior breakdown characteristics at higher gap spacings, unequal sphere gaps have comparable breakdown characteristics at short gap spacings.

Author Contributions

Conceptualization, I.J. and G.S.; methodology, G.S.; software, I.J.; formal analysis, I.J. and G.S.; investigation, I.J.; data curation, I.J. and G.S.; writing—original draft preparation, I.J.; writing—review and editing, G.S.; visualization, I.J.; supervision, G.S.; project administration, G.S. All authors have read and agreed to the published version of the manuscript.

Funding

This research received no external funding.

Institutional Review Board Statement

Not applicable.

Informed Consent Statement

Not applicable.

Data Availability Statement

All data sets are presented within the article.

Conflicts of Interest

The authors declare no conflicts of interest.

References

  1. Haque, M.N.; Shanmugam, G.; Joseph, J.; Karakkad, S. Numerical Modeling of the DC Breakdown of a Sphere Gap due to a Weakly Nonuniform Electric Field. In Proceedings of the 2024 IEEE 5th International Conference on Dielectrics (ICD), Toulouse, France, 30 June–4 July 2024; pp. 1–4. [Google Scholar]
  2. De La Hoz, M.; Pieterse, P.J.; Etxegarai, A.; Gonzalez, D.; Mazon, Á.J.; Uhrlandt, D. Comparison of corona effect prediction criteria on sphere-plane configuration. High Volt. 2024, 9, 957–969. [Google Scholar] [CrossRef]
  3. Foruzan, E.; Akmal, A.A.; Niayesh, K.; Lin, J.; Sharma, D.D. Comparative study on various dielectric barriers and their effect on breakdown voltage. High Volt. 2018, 3, 51–59. [Google Scholar] [CrossRef]
  4. Qiu, Z.; Ruan, J.; Wang, X.; Jin, Q. Electric Field Feature Extraction and Breakdown Voltage Prediction of Sphere Gaps with Quasi-uniform Field. In Proceedings of the 2018 IEEE International Conference on High Voltage Engineering and Application (ICHVE), Athens, Greece, 10–13 September 2018; pp. 1–4. [Google Scholar]
  5. CIGRE Working Group 33.07. Guidelines for the Evaluation of the Dielectric Strength of External Insulation. Available online: https://www.e-cigre.org/publications/detail/72-guidelines-for-the-evaluation-of-the-dielectric-strength-of-external-insulation.html (accessed on 31 May 2025).
  6. Sunthrasakaran, N.; Jamail, N.A.M.; Kamarudin, Q.E.; Gunabalan, S. Analysis of Electric Field and Current Density for Different Electrode Configuration of XLPE Insulation. Int. J. Eng. Technol. 2018, 7, 127–133. [Google Scholar] [CrossRef]
  7. Arora, R.; Mosch, W. High Voltage and Electrical Insulation Engineering; Wiley: Hoboken, NJ, USA, 2022. [Google Scholar]
  8. Pokryvailo, A. Calculation of Breakdown Voltage of Gas Gaps with Weakly Nonuniform Field: Sphere and Donut Gaps. IEEE Trans. Plasma Sci. 2020, 48, 3358–3366. [Google Scholar] [CrossRef]
  9. Pillai, A.S.; Hackam, R. Electric Field and Potential Distributions for Unequal Spheres Using Symmetric and Asymmetric Applied Voltages. IEEE Trans. Electr. Insul. 1983, EI-18, 477–484. [Google Scholar] [CrossRef]
  10. Jiang, Z. Electrostatic interaction of two unequal conducting spheres in uniform electric field. J. Electrost. 2003, 58, 247–264. [Google Scholar] [CrossRef]
  11. Russell, A. The Maximum Value of the Electric Stress Between Two Unequal Spherical Electrodes. Proc. Phys. Soc. Lond. 1911, 24, 22–29. [Google Scholar] [CrossRef]
  12. IEEE Std 4-2013; IEEE Standard for High-Voltage Testing Techniques. Revision of IEEE Std 4-1995; IEEE: Piscataway, NJ, USA, 10 May 2013; pp. 1–213. [Google Scholar]
  13. Naidu, M.S.; Kamaraju, V. High Voltage Engineering, 6th ed.; Tata McGraw Hill: New York, NY, USA, 2020. [Google Scholar]
Figure 1. A 3D model of the sphere gap.
Engproc 95 00012 g001
Figure 2. Spheres of different diameters.
Engproc 95 00012 g002
Figure 3. Electrode arrangement.
Engproc 95 00012 g003
Figure 4. Experimental setups.
Engproc 95 00012 g004
Figure 5. Electric field variations across the sphere gap.
Engproc 95 00012 g005
Figure 6. (a,b) show the variation of the utilization factor with gap spacing.
Engproc 95 00012 g006
Figure 7. (a,b) show the variation of BDV with gap spacing.
Engproc 95 00012 g007
Figure 8. Electric field variation with gap spacing.
Engproc 95 00012 g008
Figure 9. Utilization factor vs. gap space.
Engproc 95 00012 g009
Figure 10. Breakdown voltage vs. gap space.
Engproc 95 00012 g010
Table 1. Arrangement of the electrode configuration.
CaseABCDEF
HV electrode diameter (mm)20205050100100
Ground electrode diameter (mm)50100201002050
Disclaimer/Publisher’s Note: The statements, opinions and data contained in all publications are solely those of the individual author(s) and contributor(s) and not of MDPI and/or the editor(s). MDPI and/or the editor(s) disclaim responsibility for any injury to people or property resulting from any ideas, methods, instructions or products referred to in the content.

