1. Introduction
Topography plays a decisive role in the spatial configuration of vegetation by influencing key variables such as solar radiation, water availability, and microclimatic conditions [
1]. In mountain ecosystems, these variables generate environmental gradients that determine the structure, composition, and phenological dynamics of plant communities. Topographic heterogeneity is manifested through variations in altitude, slope, relative landscape position, and aspect, which modulate fundamental ecological processes at local spatial scales [
2].
Phenology, defined as seasonal periodic events in the life cycle of plants, is a sensitive indicator of environmental variability. In this context, remote sensing enables continuous and spatially explicit phenological characterization, facilitating the analysis of vegetation dynamics in relation to topographic and climatic gradients [
3]. The use of spectral and topographic indices derived from remote sensing and digital elevation models is a powerful strategy to evaluate the relationship between vegetation and environmental conditions. The NDVI (Normalized Difference Vegetation Index), Topographic Position Index (TPI), and Diurnal Anisotropic Heat (DAH) are widely used metrics for analyzing the seasonal and spatial dynamics of vegetation cover, assessing landforms, and quantifying temperature heterogeneity associated with slope aspect and its influence on surface temperature [
3,
4].
Recent research has reinforced the value of combining remote sensing and topographic analysis to study vegetation phenology at multiple spatial scales. Ref. [
5] highlighted the widespread use of NDVI in ecological applications, particularly for monitoring seasonal vegetation patterns across diverse ecosystems. Ref. [
6] reviewed current challenges in remote phenological monitoring, emphasizing how terrain complexity, spatial resolution, and cloud contamination can affect the reliability of satellite-derived indices. In mountainous regions, ref. [
7] demonstrated that extreme drought significantly impacts canopy greenness above the treeline, showing how topography and climate interact to shape vegetation dynamics. Similarly, ref. [
8] found that elevation and slope are major drivers of NDVI variability in Central Asian arid and semi-arid landscapes. These studies provide a robust foundation for exploring terrain-driven phenological processes in understudied Mediterranean ecosystems such as those in central Chile.
This study aims to evaluate the effect of terrain on the phenological dynamics of native vegetation in ravines of the Mediterranean Andes in central Chile through the integration of terrain-derived indices (TPI and DAH) and phenological analyses obtained from NDVI time series. Our research seeks to provide evidence on the relationship between topographic variables and the phenology of different plant life forms (herbaceous, shrubs, and trees) within an understudied heterogeneous ecosystem using multitemporal remote sensing approaches.
2. Materials and Methods
2.1. Study Area
This study was conducted in Hijuela A of the Los Nogales Nature Sanctuary (SN Los Nogales) (
Figure 1), located in the foothills of the Mediterreanean Andes in the Metropolitan Region of Chile, within the Lo Barnechea municipality (33°37′ S, 70°33′ W). This area is part of the Mediterranean climatic zone of central Chile, characterized by a marked seasonality in temperature and precipitation. Annual rainfall averages between 300 and 400 mm, concentrated mainly in the austral winter months (May to August), with a prolonged dry season extending from late spring through early autumn [
1,
2]. The mean annual temperature ranges from 12 to 14 °C, with significant diurnal and altitudinal variation, especially in ravine areas [
3].
The site is dominated by Mediterranean sclerophyllous shrubland, with vegetation formations that include native species such as
Lithraea caustica,
Peumus boldus,
Quillaja saponaria, and
Cryptocarya alba. The local flora is adapted to summer drought conditions and occupies a rugged terrain marked by steep slopes, dissected landforms, and strong gradients in elevation, aspect, and slope. This pronounced topographic heterogeneity creates localized microclimates that influence vegetation structure and phenological responses. Ravine areas in particular can act as refugia for moisture-sensitive species and exhibit distinct phenological behavior compared to adjacent slopes and ridges [
4].
2.2. Spatial Data
Sentinel-2 images from the period 2019–2024 were used, acquired through the Copernicus Open Access Hub. Only scenes with less than 5% cloud cover were selected to ensure the quality of spectral analysis over the area corresponding to the Los Nogales Nature Sanctuary. In addition, a Digital Elevation Model (DEM) with 12.5 m spatial resolution, corresponding to the Metropolitan Region of Chile, was obtained from the Geoportal of the Chilean Spatial Data Infrastructure (IDE Chile). Vegetation cover reference information from CONAF’s Vegetation Resources Inventory (2001, 2013, and 2019) was also incorporated to classify vegetation into herbaceous, shrub, and tree life forms.
2.3. Topographic Processing
The Digital Elevation Model was used to calculate the Topographic Position Index (TPI) and the Diurnal Anisotropic Heat (DAH) using SAGA GIS software (version 2.3.2) [
2,
4]. The TPI was used to identify landform types, such as valleys, slopes, and ridges, while the DAH indicated daily thermal heterogeneity associated with solar exposure. To facilitate the ecological interpretation of topographic and thermal gradients and reduce the influence of extreme values inherent in continuous data, both indices were reclassified into ordinal classes.
TPI was divided into six categories: deep valleys, gentle valleys, low slopes, moderate slopes, gentle ridges, and steep ridges. DAH was divided into five categories: very low, low, moderate, high, and very high thermal anisotropy [
2,
4]. These categories allowed for the segmentation of the landscape into comparable units related to the distribution of vegetation.
2.4. Phenological Analysis
For the phenological analysis, mean NDVI values per pixel at 10 m spatial resolution were extracted, corresponding to the bands used from Sentinel-2. Observations were classified by plant life form (trees, shrubs, and herbaceous plants), and Generalized Additive Models (GAM) [
9] were fitted to describe seasonal NDVI trajectories and to assess the influence of topographic classes (TPI and DAH) on vegetation temporal response [
3]. The following formula was used:
where
is the vegetation index (NDVI) at time
;
is the intercept;
is a smooth function describing the seasonal NDVI response; and
is the error term.
Analyses were conducted in R (version 4.3.1) [
10,
11,
12,
13] using the mgcv [
14] package for GAM modeling and the raster [
15] and terra packages [
16] for geospatial data handling. Spatialization of the analysis was performed by linking the phenological curves generated for each plant life form with the topographic classes derived from TPI and DAH. This enabled comparisons of NDVI temporal responses according to terrain position.
Differences in the shape, amplitude, and stability of phenological trajectories were evaluated by visually inspecting confidence intervals (80% and 95%).
Finally, the spatial distribution of plant species in relation to topographic units was analyzed, identifying their distribution patterns as a function of TPI and DAH.
3. Results
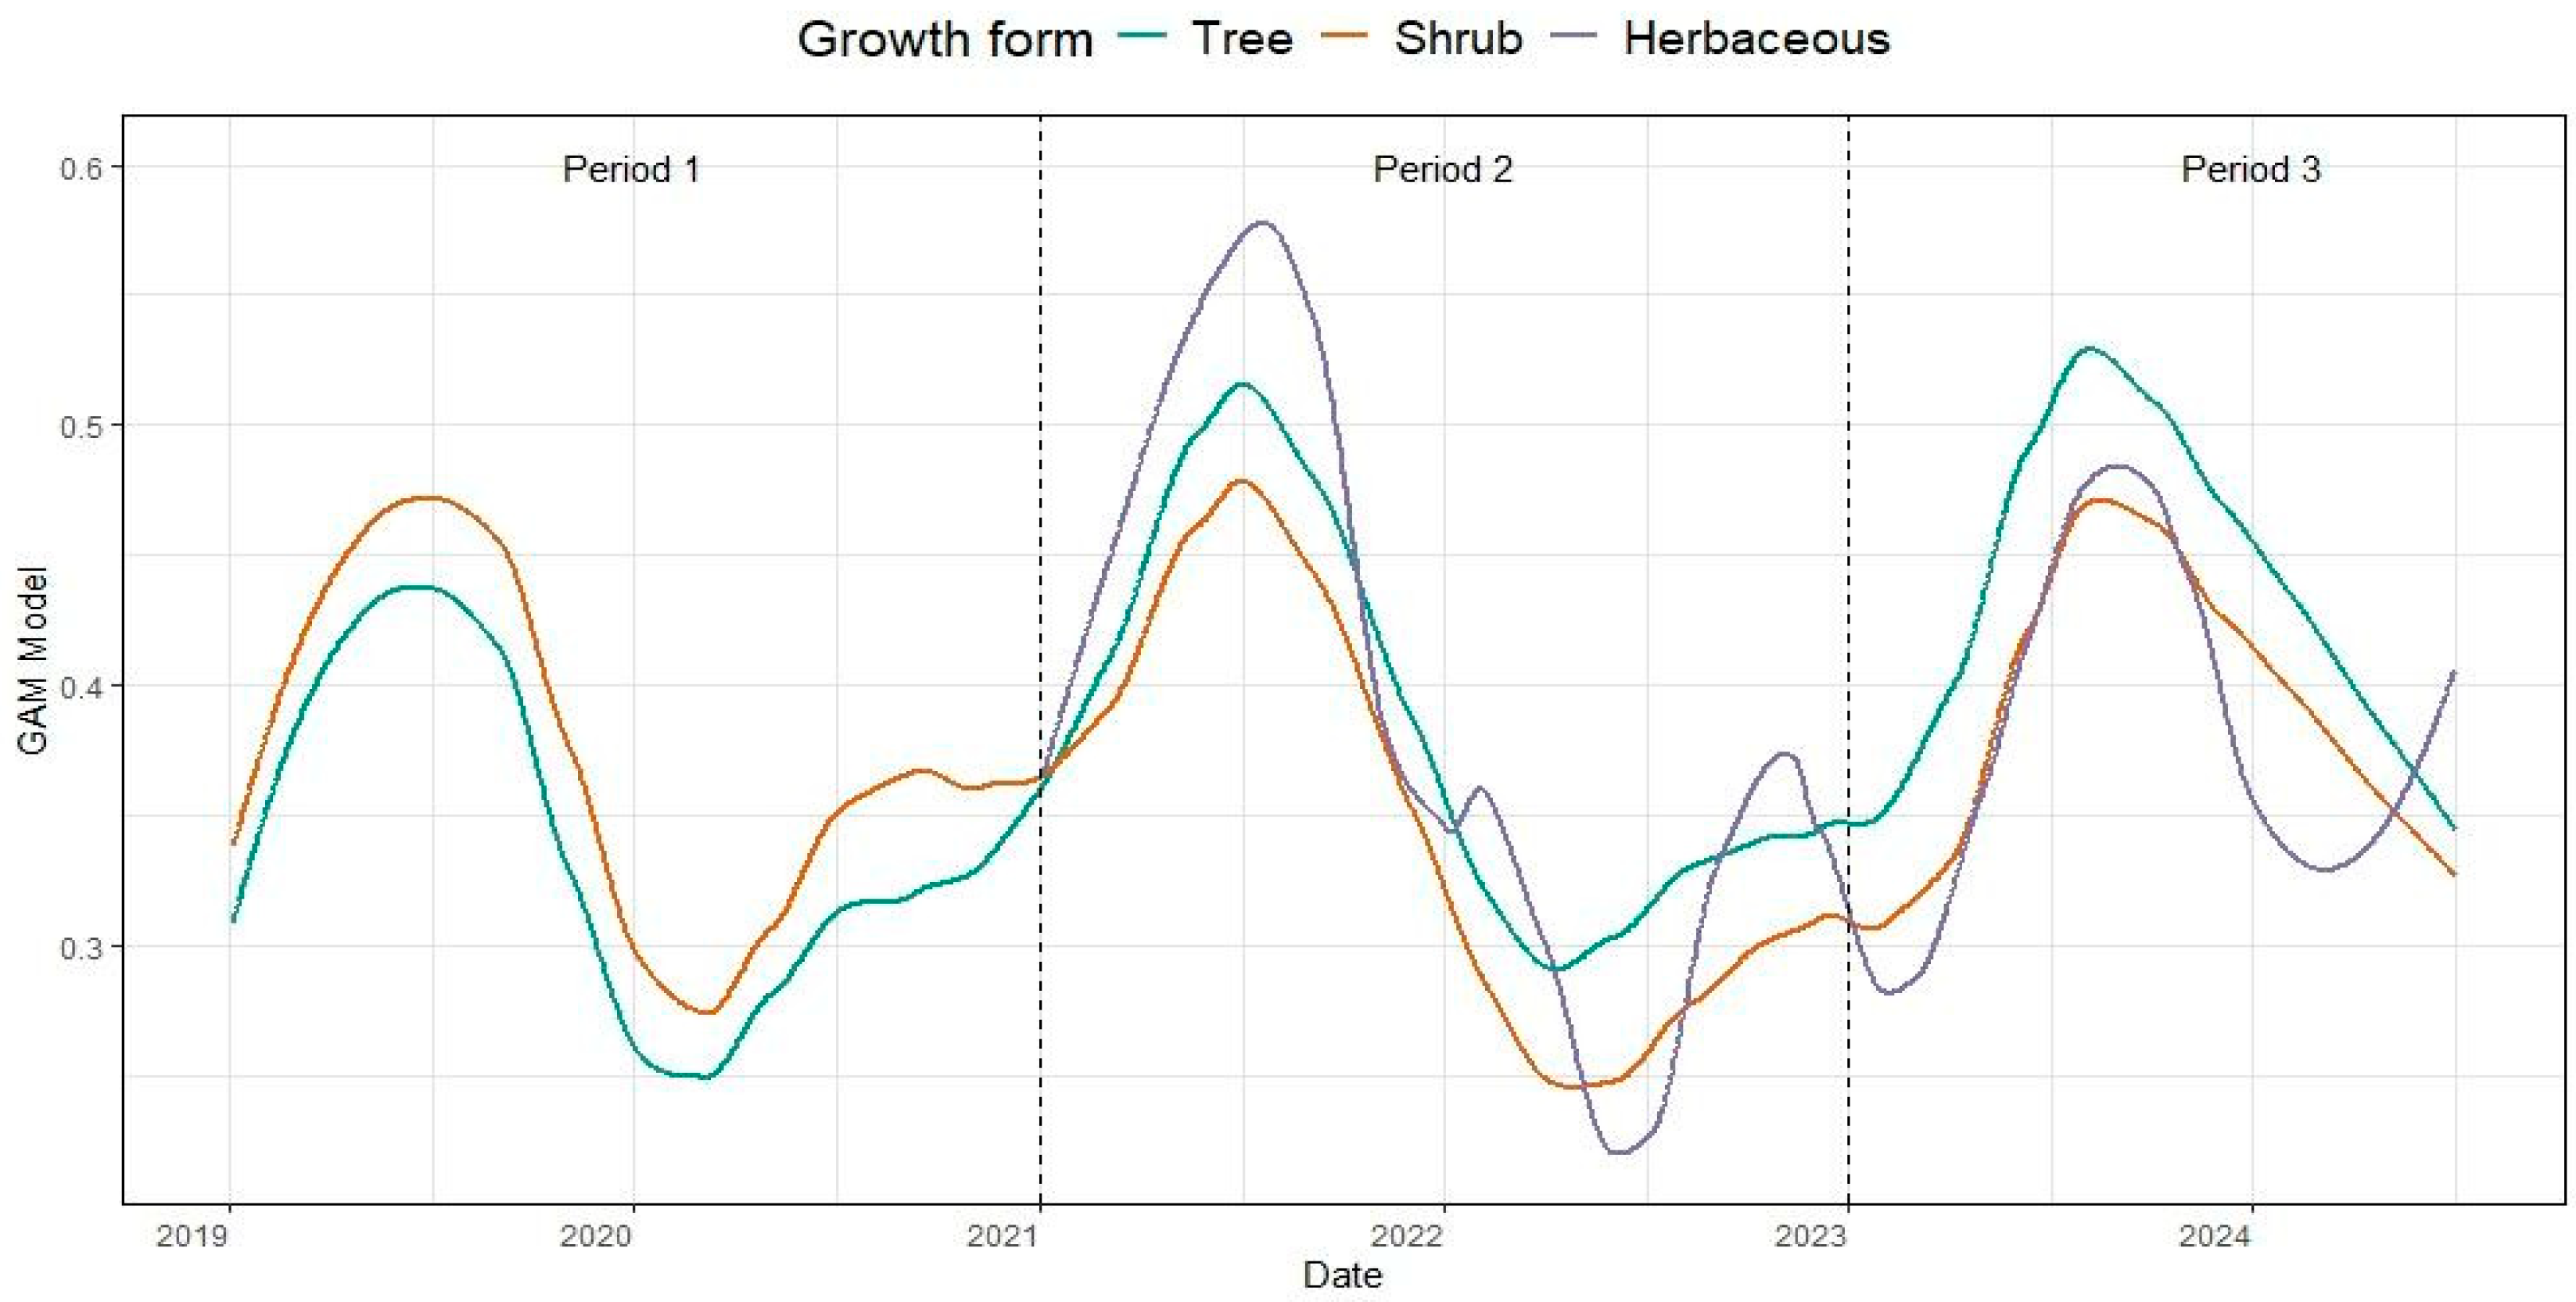
The phenological dynamics obtained from NDVI multitemporal analysis showed clear differences among plant life forms in the ravine forests of the Los Nogales Nature Sanctuary.
Tree species exhibited regular seasonal trajectories with well-defined annual cycles and minimal interannual variation. In contrast, shrubs showed greater seasonal NDVI fluctuations, while herbaceous species displayed high interannual variability.
These differences were visible in the shape and stability of the phenological curves fitted using GAM models (
Figure 2).
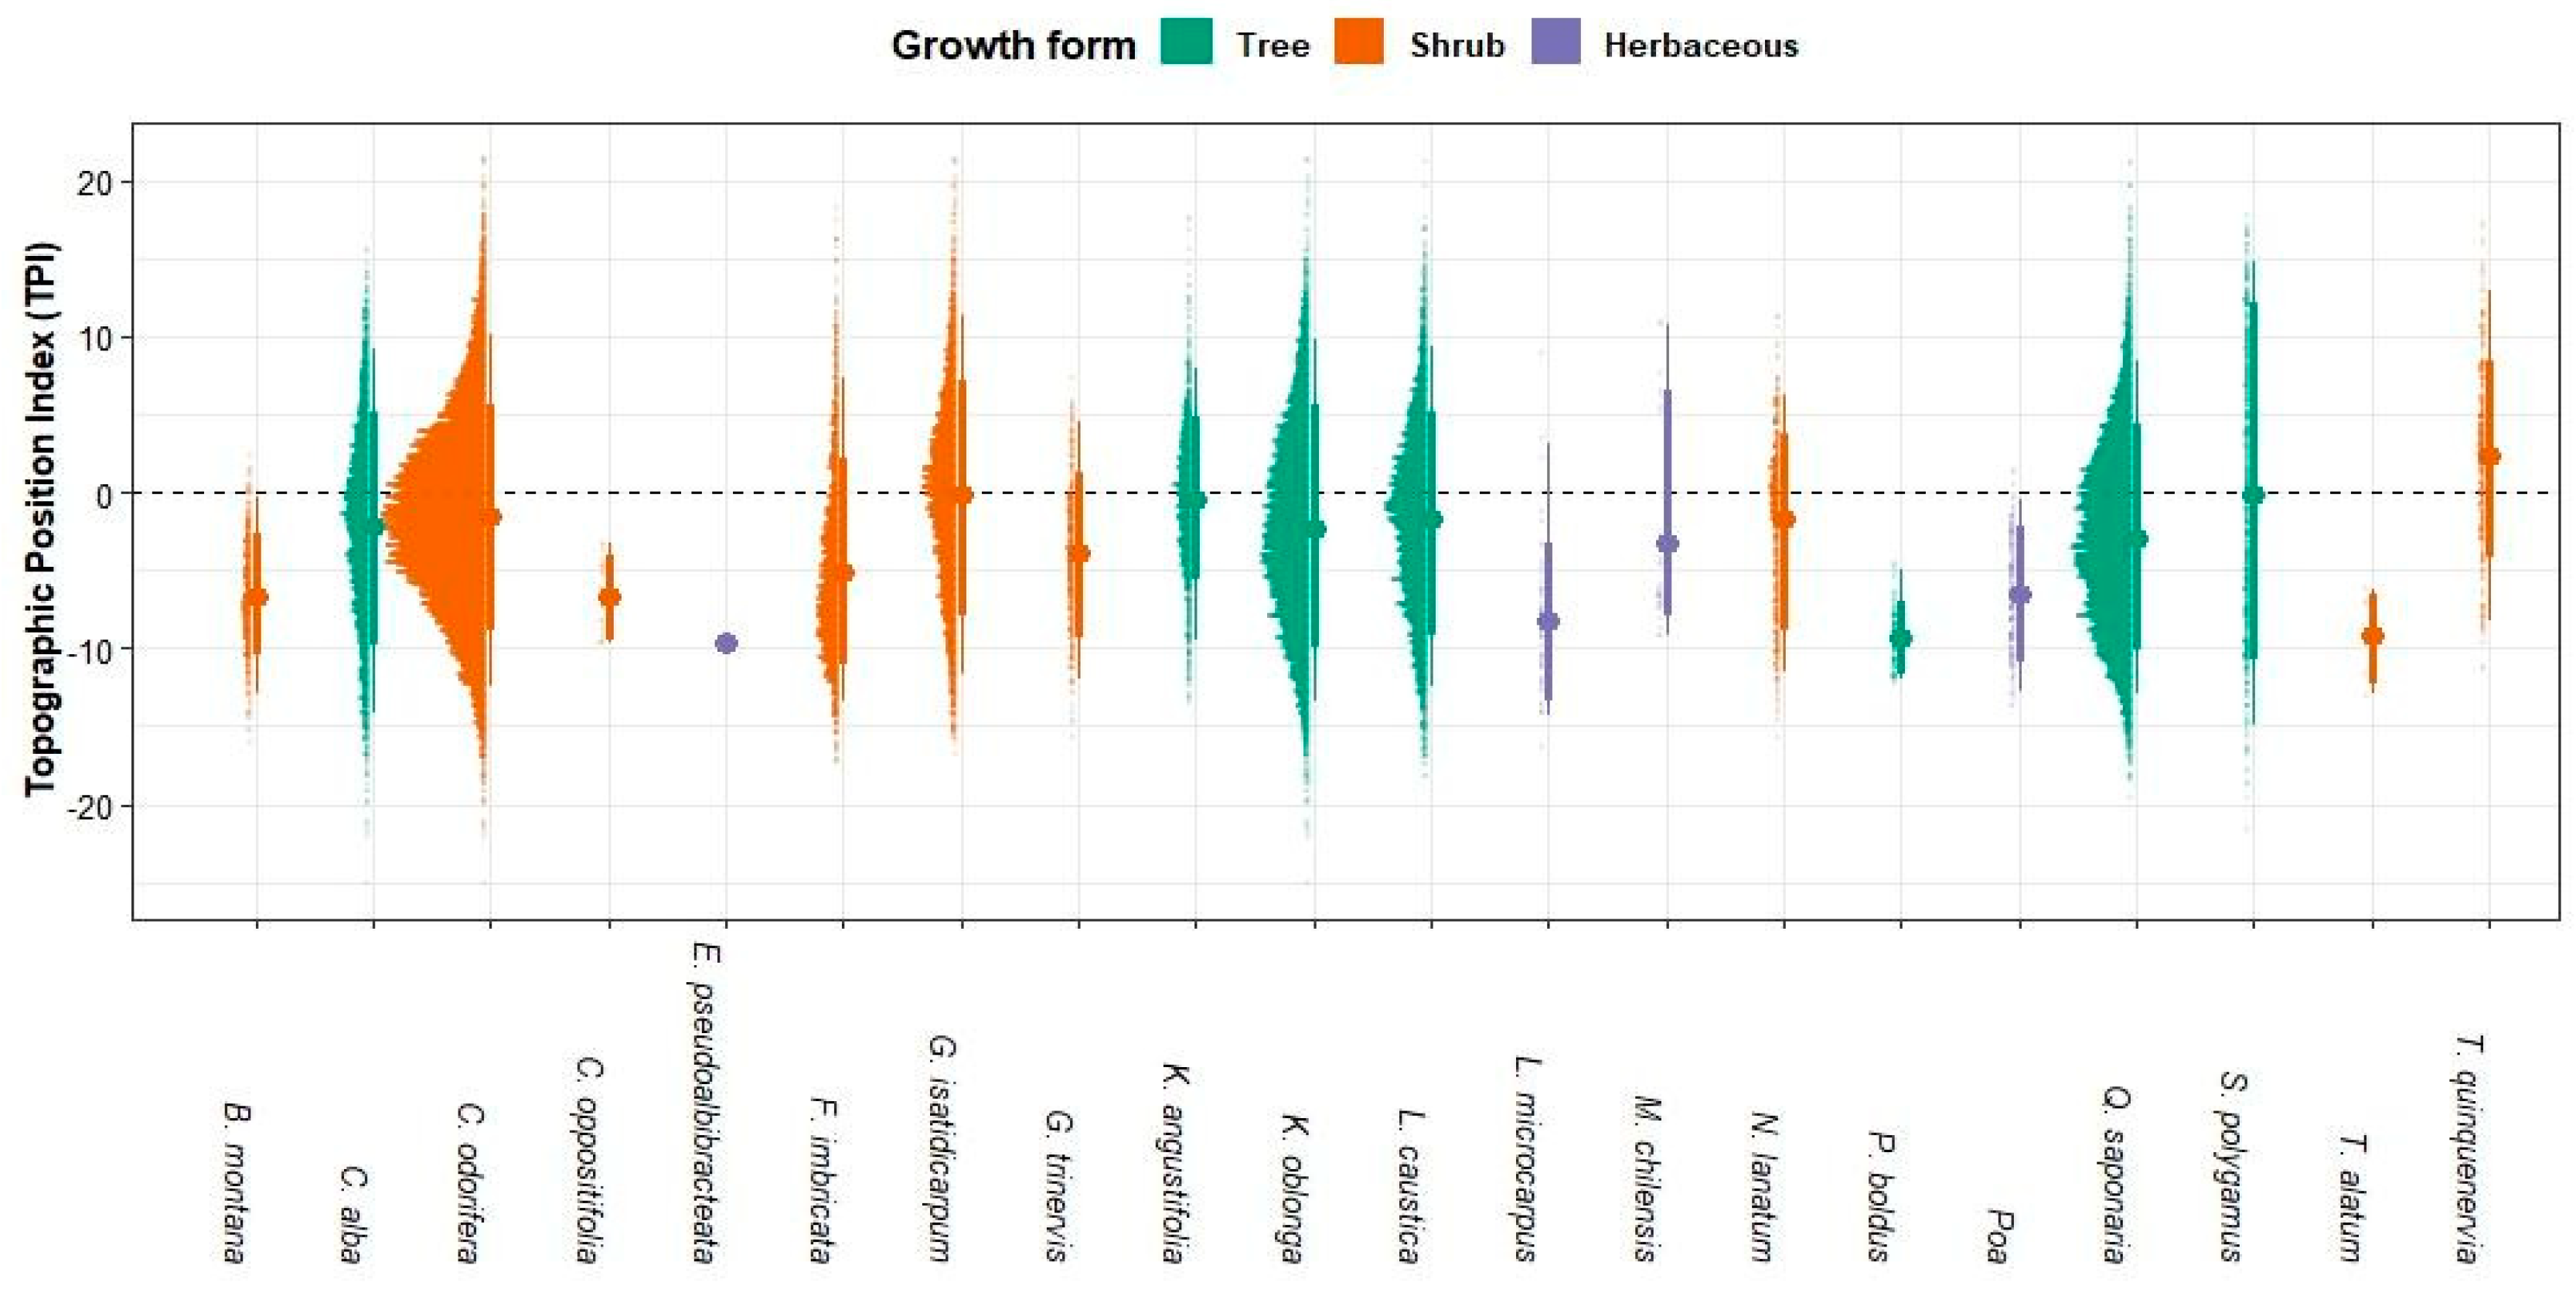
The spatial distribution of plant species was consistently associated with terrain morphology, as determined by the TPI (
Figure 3). Tree species such as
Lithraea caustica and
Cryptocarya alba tended to occur at higher elevations, while herbaceous species such as
Poa spp. were concentrated in lower parts of the landscape (
Figure 4).
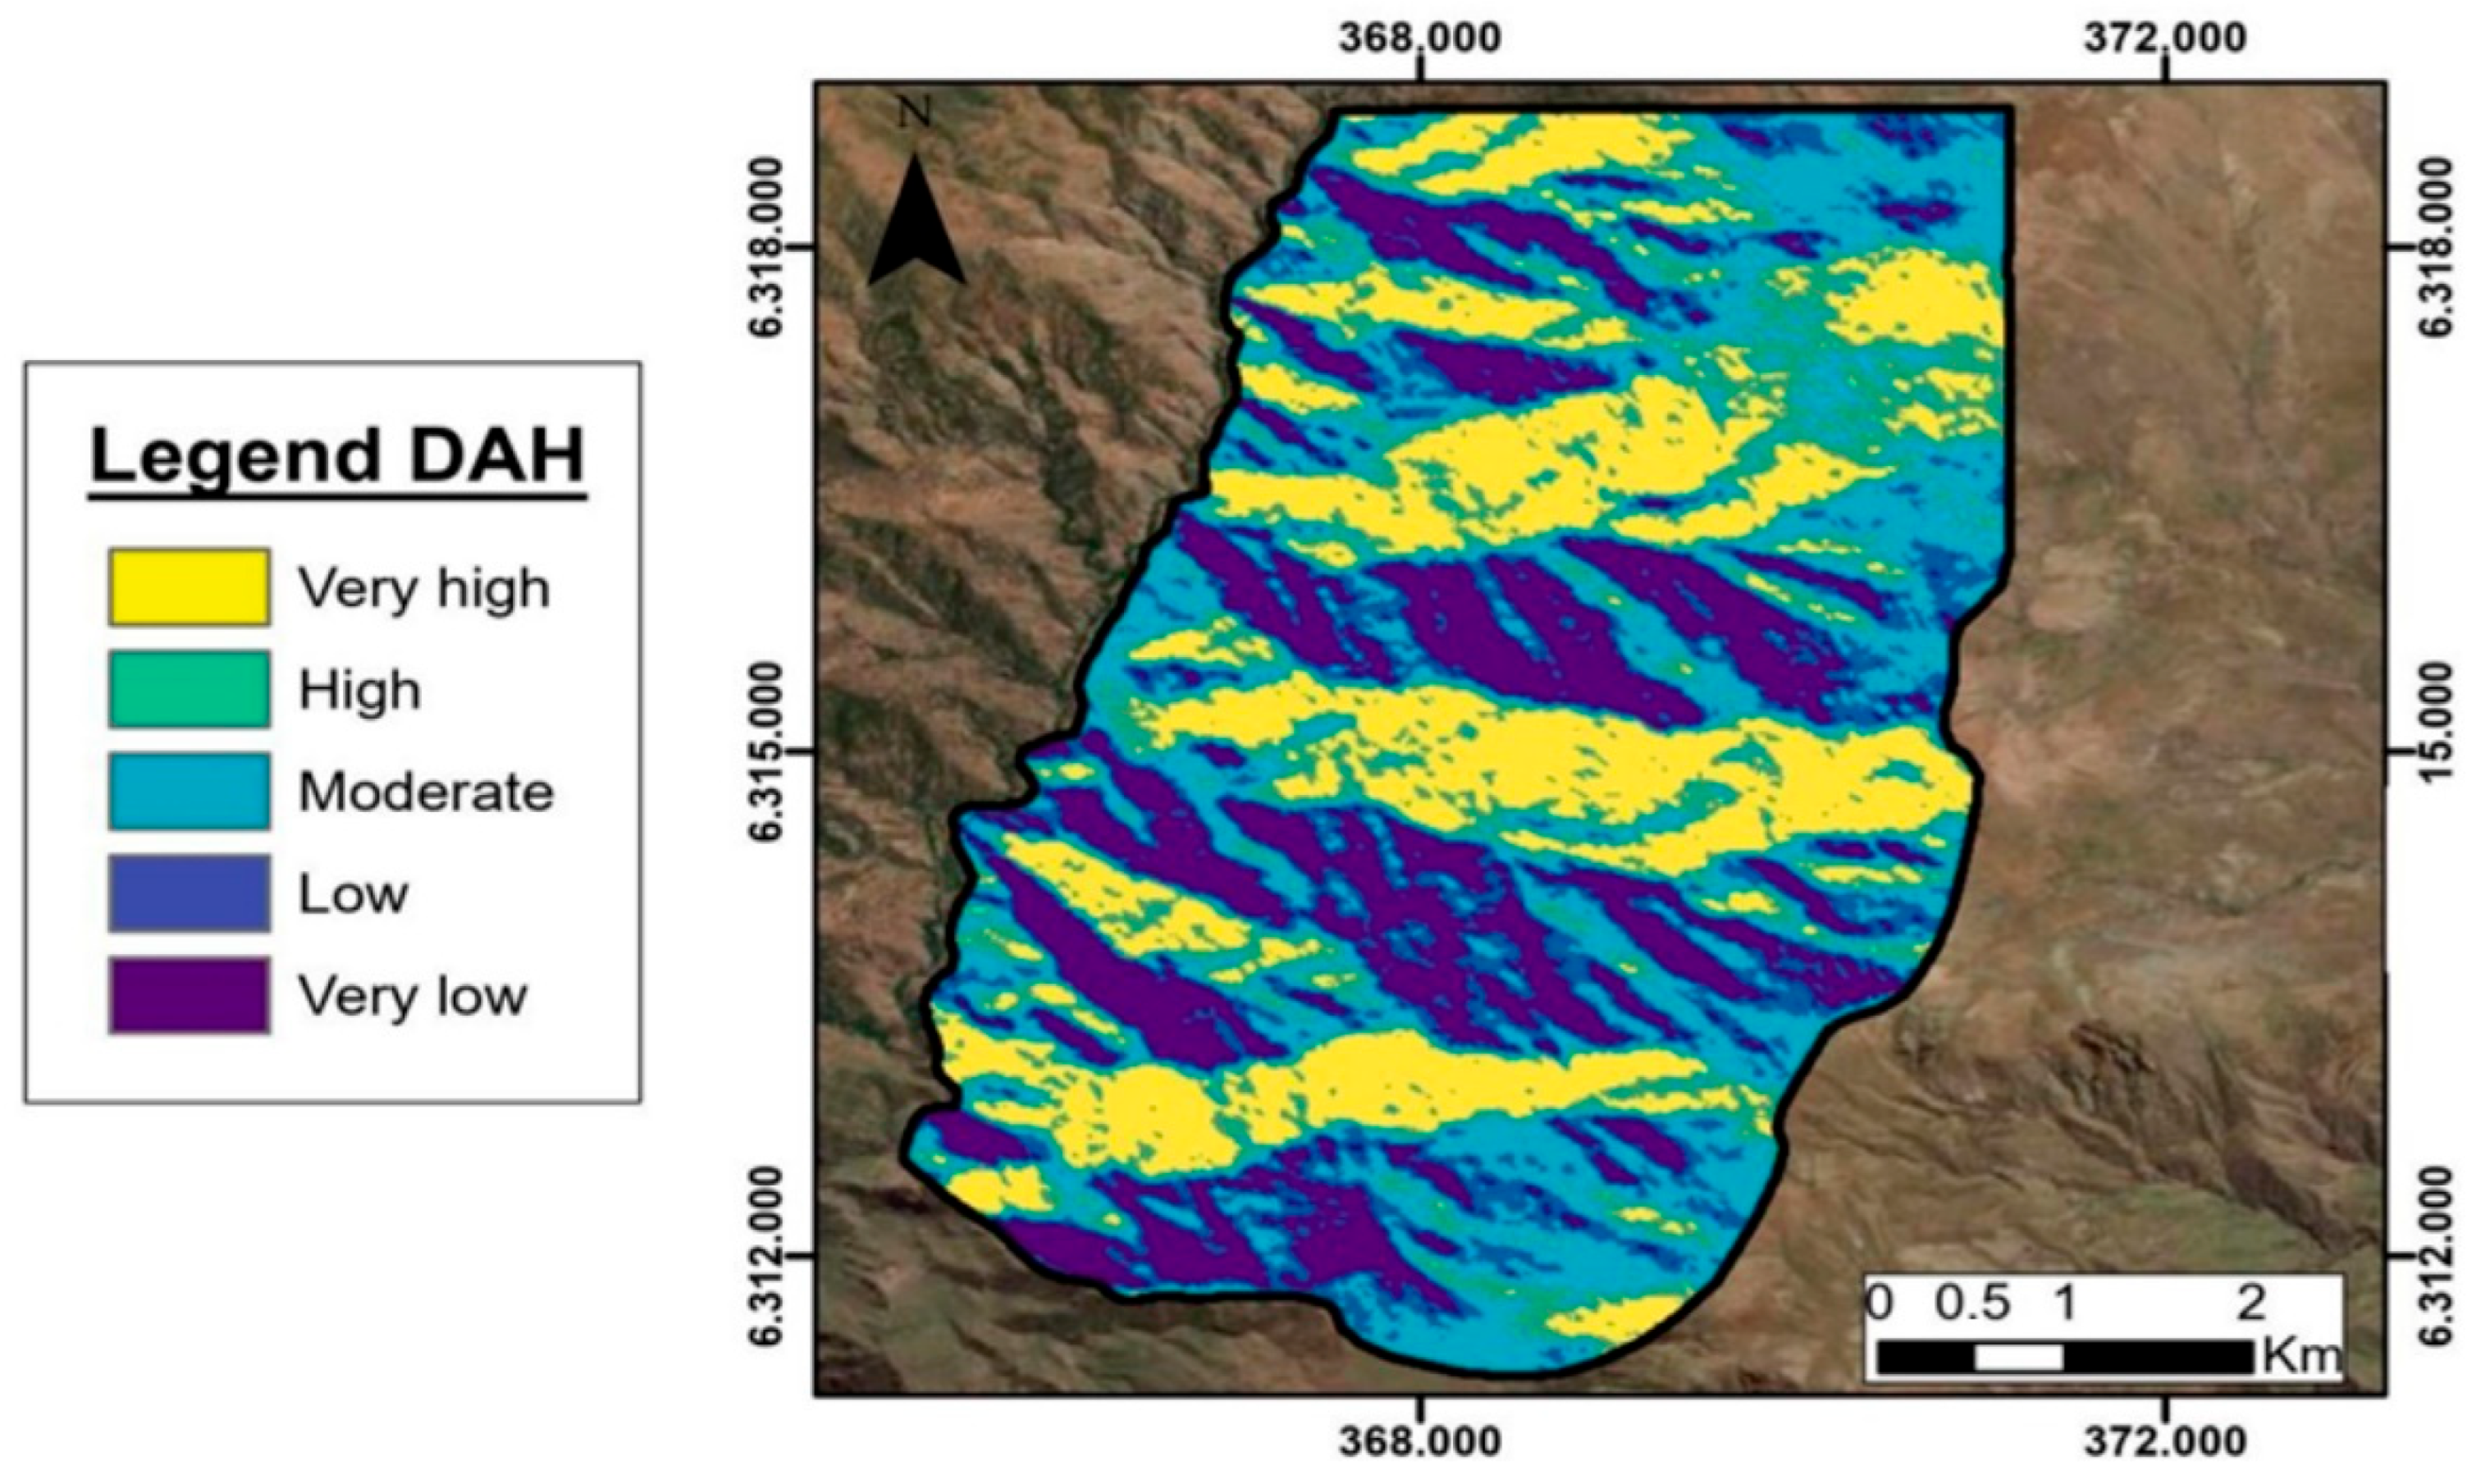
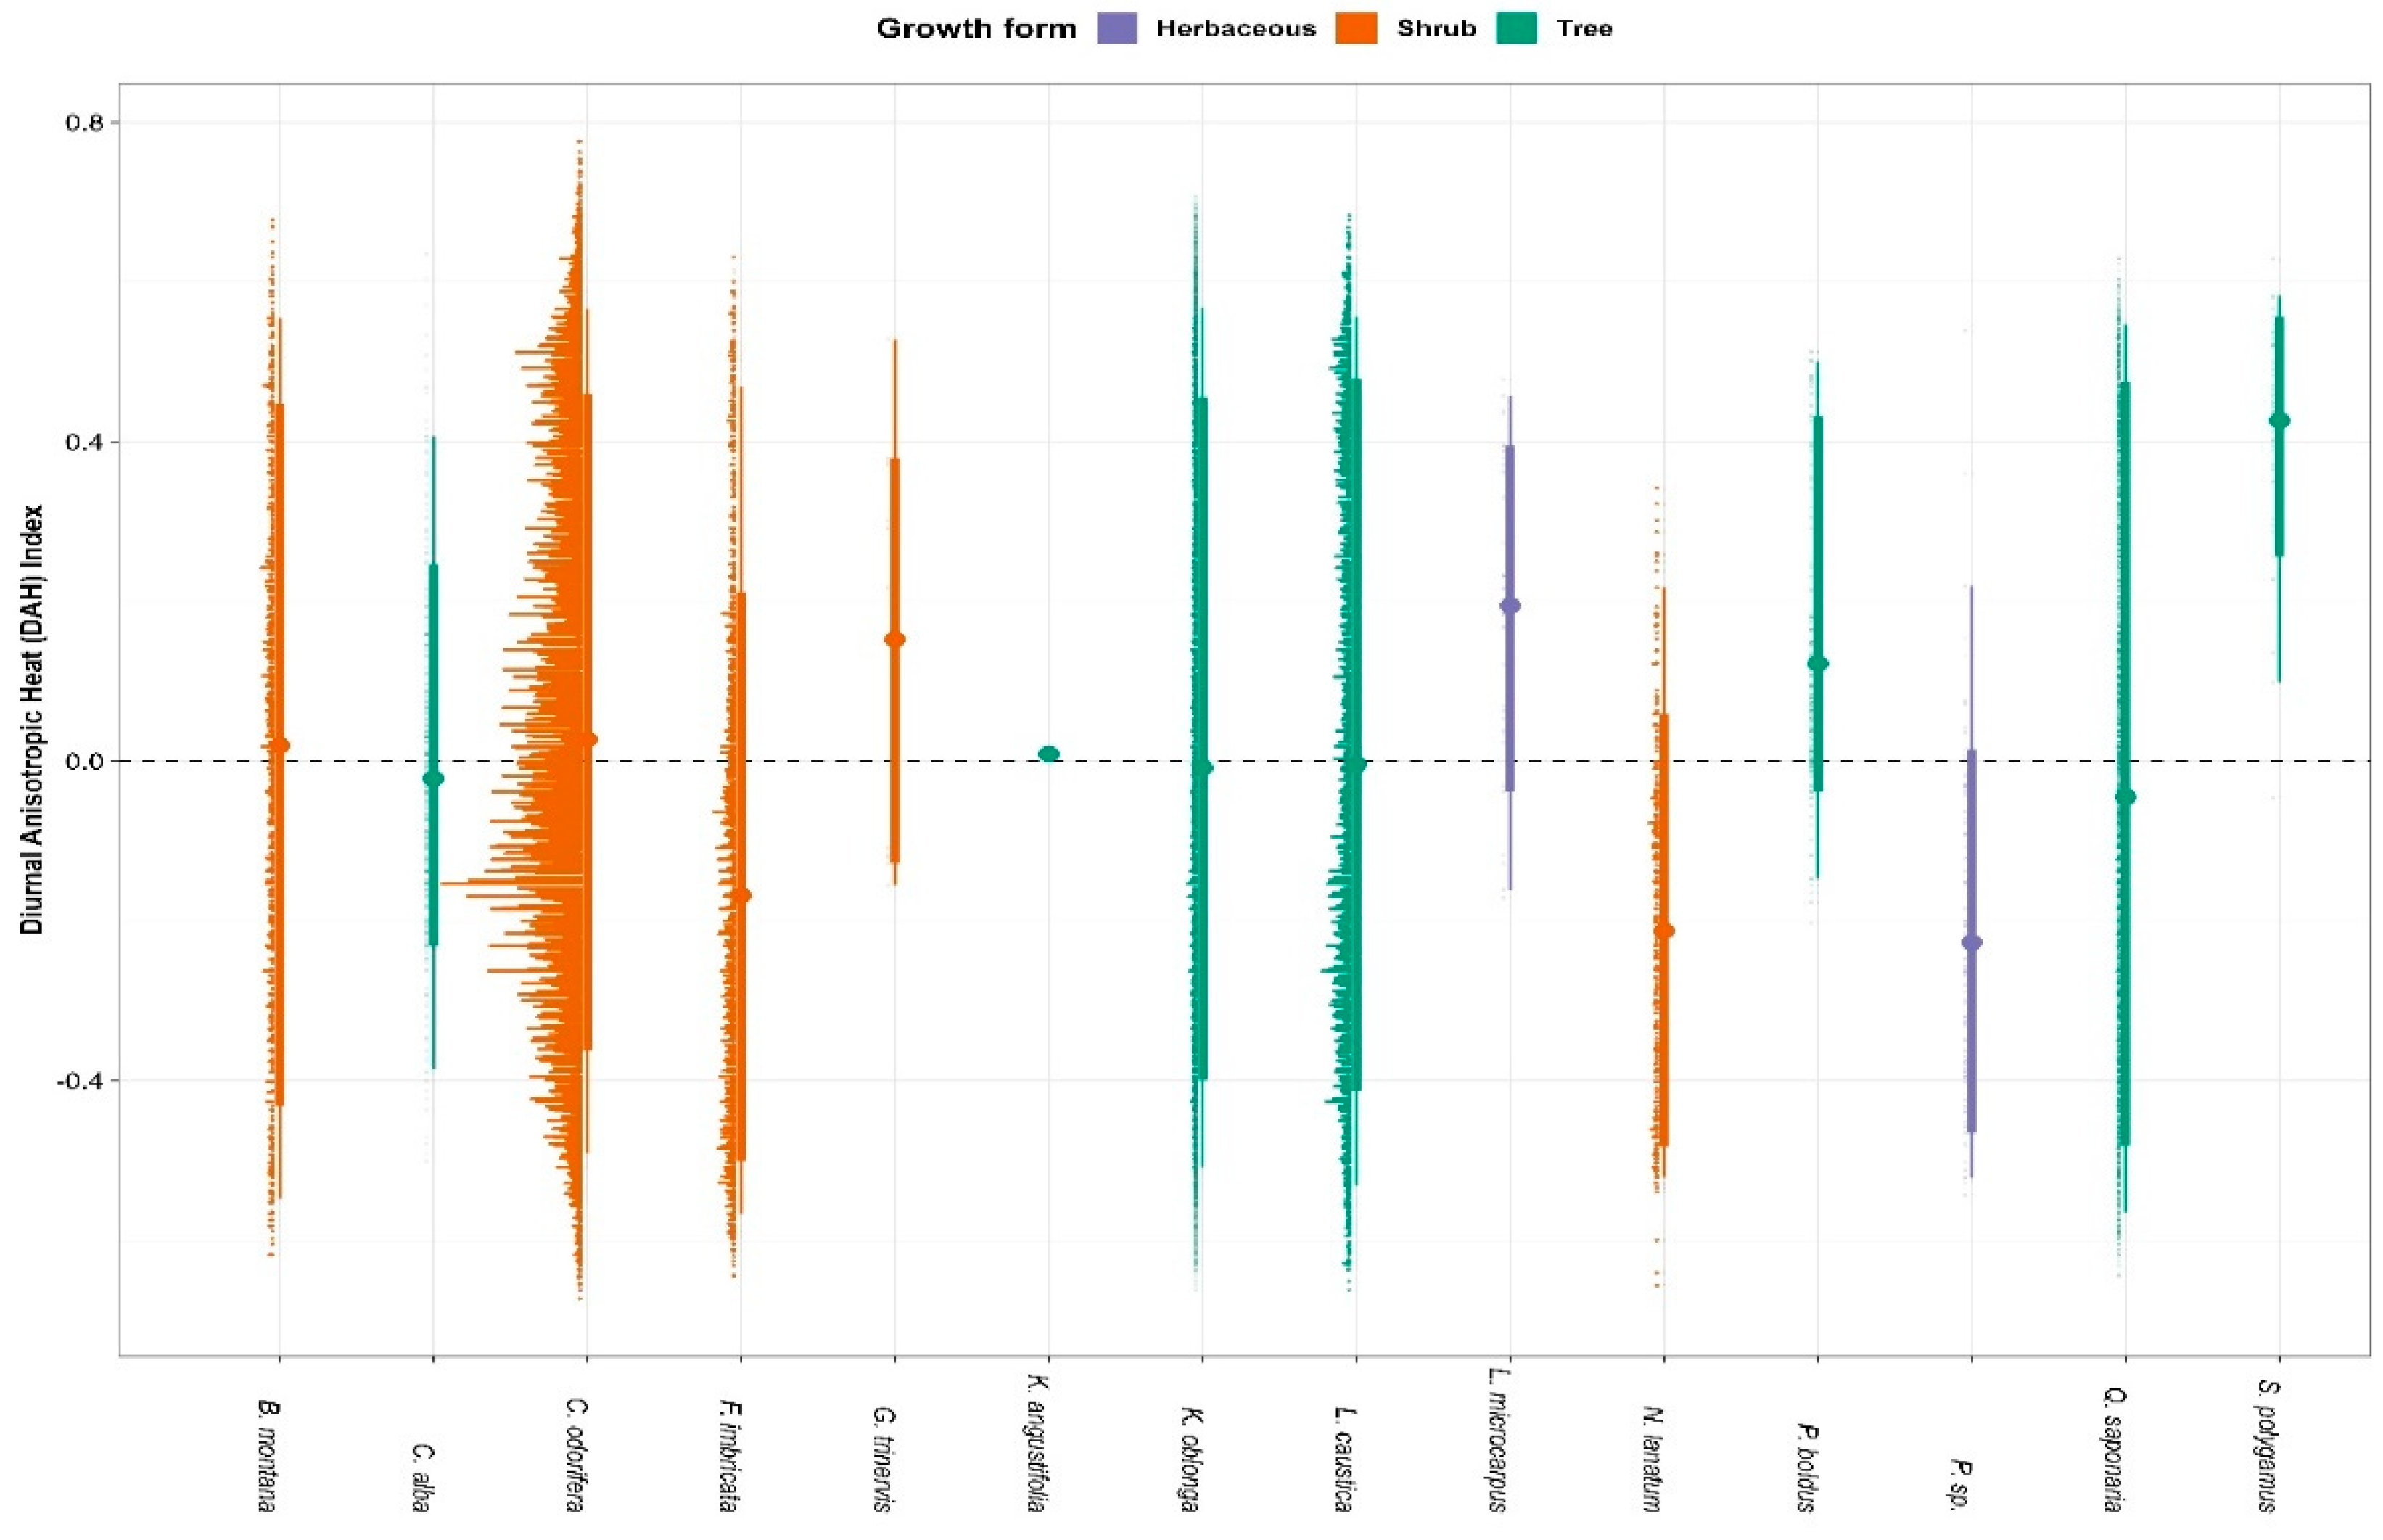
The analysis of the thermal load index (DAH) revealed the concentration of areas with higher thermal load in areas with higher solar radiation, confirming the effect of topography on the spatial distribution of DAH (
Figure 5). To establish the relationship between DAH and vegetation, we evaluated the occurrence of plant life forms (trees, shrubs, and herbs) in relation to DAH (
Figure 6). We found that shrubs generally exhibit higher thermal load values, while trees and herbs tend to occur in areas with lower values of DAH. These patterns suggest that thermal load, associated with topographic characteristics, may modulate the distribution and adaptive strategies of the different plant life forms in the studied ecosystem.
4. Discussion
This study provides empirical evidence for the influence of terrain on phenological patterns and the spatial distribution of plant life forms in a Mediterranean ravine forest ecosystem. The integration of topographic (TPI) and thermal (DAH) variables with NDVI multitemporal series enabled the identification of differential responses among trees, shrubs, and herbaceous plants based on their position in the landscape. These results highlight the capacity of remote sensing to interpret vegetation processes at fine spatial scales, particularly in areas that are difficult to access with high environmental heterogeneity.
4.1. Phenology and Specific Responses of Vegetation Formations
The greater phenological stability observed for tree species suggests adaptation to local environmental conditions, which maintain consistent growth cycles over time. This pattern has been documented in studies conducted in environments with stable water availability, where tree species with continuous access to groundwater exhibit more stable phenological cycles [
17].
In contrast, the lower phenological stability of herbaceous species indicates a more immediate response to climatic variations, especially drought events [
18]. This characteristic has been reported in research indicating that herbaceous vegetation in Mediterranean ecosystems responds rapidly to changes in water availability, reflecting its adaptive capacity to highly seasonal environments [
19].
4.2. Influence of Topography and Thermal Load
The spatial distribution of species in relation to topographic and thermal terrain features highlights the importance of these factors in shaping ravine ecosystems [
20]. The predominance of trees in elevated areas with steep slopes [
21] may be related to their greater capacity to access deep water resources [
22] and tolerate higher solar radiation [
17]. Similar studies have found that tree species in ravine forests tend to occupy elevated topographic positions where competition for light is lower and drainage is higher [
23].
4.3. Application of Remote Sensing in Ravine Ecosystem Monitoring
The integrated use of multitemporal remote sensing (NDVI) and topographic analysis derived from digital elevation models (TPI and DAH) [
24] enabled the precise characterization of phenological dynamics and the spatial distribution patterns of plant species in the ravine ecosystems of the Los Nogales Nature Sanctuary. This approach, combining remote sensing and statistical modeling, facilitated a continuous and spatially explicit assessment of phenological trajectories, even in hard-to-access areas such as our study area. Furthermore, it enabled the identification of differences among plant life forms and their association with topographic position and thermal load [
25].
5. Conclusions
This study reveals how the phenology of plant life forms in a Mediterranean ravine forest ecosystem is modulated by topographic and thermal gradients. Tree species exhibited greater phenological stability, likely due to deeper root systems and access to stable water sources, while shrubs showed pronounced seasonal responses, and herbaceous species displayed marked interannual variability associated with climatic fluctuations. These patterns reflect distinct adaptive strategies to local environmental conditions and highlight the vulnerability of shallow-rooted vegetation to climate variability.
By integrating multitemporal NDVI analyses with terrain-derived indices such as the Topographic Position Index (TPI) and Diurnal Anisotropic Heat (DAH), we achieved a high-resolution spatial and temporal characterization of vegetation dynamics. This approach proved effective in identifying how terrain and microclimate shape plant phenology, particularly in steep and heterogeneous landscapes where field-based monitoring is logistically complex.
Our findings underscore the value of combining remote sensing and topographic modeling for ecosystem monitoring, especially in Mediterranean ecosystems facing increased drought frequency and temperature extremes due to climate change. This methodology provides a scalable and replicable framework for prioritizing conservation actions, identifying climate-sensitive zones, and supporting adaptive management in ravine and mountainous ecosystems.
Future research should explore interannual trends over longer time series, integrate additional climatic variables (e.g., soil moisture, solar radiation), and evaluate phenological responses at the species level. Expanding this approach to other semi-arid and arid ecosystems in South America could help generalize these patterns and inform regional biodiversity conservation strategies.
Author Contributions
Conceptualization, J.G.-L., W.P.-M. and L.D.-G.; methodology, J.G.-L., L.D.-G. and D.C.; software, J.G.-L. and D.C.; validation, D.C. and L.D.-G.; formal analysis, J.G.-L.; investigation, J.G.-L. and D.C.; resources, W.P.-M.; data curation, J.G.-L.; writing—original draft preparation, J.G.-L.; writing—review and editing, L.D.-G., D.C. and W.P.-M.; visualization, J.G.-L.; supervision, D.C.; project administration, L.D.-G. and W.P.-M.; funding acquisition, L.D.-G. and W.P.-M. All authors have read and agreed to the published version of the manuscript.
Funding
This research was funded by Anglo American Chile, contract number 5.23.0022.1 “Servicio de Estudios de Conservación de Humedales Altoandinos Hijuela C en Santuario de la Naturaleza Los Nogales”.
Institutional Review Board Statement
Not applicable.
Informed Consent Statement
Not applicable.
Data Availability Statement
Restrictions apply to the availability of these data. The datasets were obtained from Anglo American Chile under a service contract and are therefore not publicly available. Data may be requested from the corresponding author with the permission of Anglo American Chile.
Conflicts of Interest
The authors declare no conflicts of interest.
References
- Cristea, N.C.; Breckheimer, I.; Raleigh, M.S.; HilleRisLambers, J.; Lundquist, J.D. An evaluation of terrain-based downscaling of fractional snow covered area data sets based on LiDAR-derived snow data and orthoimagery. Water Resour. Res. 2017, 53, 6802–6820. [Google Scholar] [CrossRef]
- Kvitek, R.; Lampietro, P.; Summers-Morris, E. NOAA Technical Report: Integrated Spatial Data Modeling Tools for Auto-Classification and Delineation of Species-Specific Habitat Maps from High-Resolution, Digital Hydrographic Data. 2003. Available online: http://seafloor.otterlabs.org/publications/Kvitek_NA17OC2586_Rpt.pdf (accessed on 5 August 2024).
- Muddarisna, N.; Yuniwati, E.D.; Masruroh, H.; Oktaviansyah, A.R. An automated approach using Topographic Position Index (TPI) for landform mapping (case study: Gede Watershed, Malang Regency, East Java, Indonesia). IOP Conf. Ser. Earth Environ. Sci. 2020, 412, 012027. [Google Scholar] [CrossRef]
- Adeyeri, O.E.; Folorunsho, A.H.; Ayegbusi, K.I.; Bobde, V.; Adeliyi, T.E.; Ndehedehe, C.E.; Akinsanola, A.A. Land surface dynamics and meteorological forcings modulate land surface temperature characteristics. Sustain. Cities Soc. 2024, 101, 105072. [Google Scholar] [CrossRef]
- Pettorelli, N. The Normalized Difference Vegetation Index (NDVI): Unforeseen successes in animal ecology. Clim. Res. 2011, 46, 15–27. [Google Scholar] [CrossRef]
- Shen, M.; Zhao, W.; Jiang, N.; Liu, L.; Cao, R.; Yang, W.; Zhu, X.; Wang, C.; Chen, X.; Zhang, X. Challenges in remote sensing of vegetation phenology: Spatial heterogeneity, clouds, and topographic effects. Innov. Geosci. 2024, 2, 100070. [Google Scholar] [CrossRef]
- Zhang, X.; Friedl, M.A.; Schaaf, C.B.; Strahler, A.H. Monitoring vegetation phenology using MODIS. Remote Sens. Environ. 2011, 84, 471–475. [Google Scholar] [CrossRef]
- Kowalski, K.; Senf, C.; Hostert, P.; Pflugmacher, D. Characterizing spring phenology of temperate broadleaf forests using Landsat and Sentinel-2 time series. Int. J. Appl. Earth Obs. Geoinf. 2020, 92, 102172. [Google Scholar] [CrossRef]
- R Core Team. R: A Language and Environment for Statistical Computing; R Foundation for Statistical Computing: Vienna, Austria, 2024; Available online: https://www.R-project.org/ (accessed on 25 April 2025).
- Chen, X.; Huang, Y.; Nie, C.; Zhang, S.; Wang, G.; Chen, S.; Chen, Z. A long-term reconstructed TROPOMI solar-induced fluorescence dataset using machine learning algorithms. Sci. Data 2022, 9, 427. [Google Scholar] [CrossRef] [PubMed]
- Grabska-Szwagrzyk, E.; Tymińska-Czabańska, L. Sentinel-2 time series: A promising tool in monitoring temperate species spring phenology. Forestry 2024, 97, 267–281. [Google Scholar] [CrossRef]
- Wood, S.N. Generalized Additive Models: An Introduction with R; Chapman and Hall/CRC: Boca Raton, FL, USA, 2017. [Google Scholar]
- Wood, S. Mixed GAM Computation Vehicle with Automatic Smoothness Estimation [R Package Mgcv Version 1.9-3]. 2025. Available online: https://cran.r-project.org/web/packages/mgcv/index.html (accessed on 11 April 2025).
- Hijmans, R.J. Geographic Data Analysis and Modeling [R Package Raster Version 3.6-32]. 2025. Available online: https://cran.r-project.org/web/packages/raster/index.html (accessed on 5 April 2025).
- Hijmans, R.J. Spatial Data Analysis [R Package Terra Version 1.8-50]. 2025. Available online: https://cran.r-project.org/web/packages/terra/index.html (accessed on 2 June 2025).
- Warter, M.M.; Singer, M.B.; Cuthbert, M.O.; Roberts, D.; Caylor, K.K.; Sabathier, R.; Stella, J. Modeling seasonal vegetation phenology from hydroclimatic drivers for contrasting plant functional groups within drylands of the Southwestern USA. Environ. Res. Ecol. 2023, 2, 025001. [Google Scholar] [CrossRef]
- Garreaud, R.D.; Boisier, J.P.; Rondanelli, R.; Montecinos, A.; Sepúlveda, H.H.; VelosoAguila, D. The Central Chile Mega Drought (2010–2018): A climate dynamics perspective. Int. J. Climatol. 2019, 40, 421–439. [Google Scholar] [CrossRef]
- Funk, J.L.; Larson, J.E.; Blair, M.D.; Nguyen, M.A.; Rivera, B.J. Drought response in herbaceous plants: A test of the integrated framework of plant form and function. Funct. Ecol. 2024, 38, 679–691. [Google Scholar] [CrossRef]
- Dyderski, M.K.; Pawlik, Ł. Spatial distribution of tree species in mountain national parks depends on geomorphology and climate. For. Ecol. Manag. 2020, 474, 118366. [Google Scholar] [CrossRef]
- Usta, A. Altitudinal Topographic Controls on Tree Species Distributions at Timberline and Treeline Ecotones of Zigana Mountains in Northeast Turkey. Austrian J. For. Sci. 2022, 139, 169–196. [Google Scholar]
- Pierick, K.; Leuschner, C.; Homeier, J. Topography as a factor driving small-scale variation in tree fine root traits and root functional diversity in a species-rich tropical montane forest. New Phytol. 2021, 230, 129–138. [Google Scholar] [CrossRef] [PubMed]
- Pausas, J.G.; Austin, M.P. Patterns of plant species richness in relation to different environments: An appraisal. J. Veg. Sci. 2001, 12, 153–166. [Google Scholar] [CrossRef]
- Choler, P.; Michalet, R.; Ghosn, D. Above-treeline ecosystems facing drought in the European Alps. Biogeosciences 2023, 20, 4259–4277. [Google Scholar] [CrossRef]
- Al-Sababhah, N. Topographic position index to landform classification and spatial planning, using GIS, for Wadi Araba, South West Jordan. Environ. Ecol. Res. 2023, 11, 79–101. [Google Scholar] [CrossRef]
- Miranda, A.; Syphard, A.D.; Berdugo, M.; Carrasco, J.; Gómez-González, S.; Ovalle, J.F.; Delpiano, C.A.; Vargas, S.; Squeo, F.A.; Miranda, M.D.; et al. Widespread synchronous decline of Mediterranean-type forest driven by accelerated aridity. Nat. Plants 2023, 9, 1810–1817. [Google Scholar] [CrossRef] [PubMed]
| Disclaimer/Publisher’s Note: The statements, opinions and data contained in all publications are solely those of the individual author(s) and contributor(s) and not of MDPI and/or the editor(s). MDPI and/or the editor(s) disclaim responsibility for any injury to people or property resulting from any ideas, methods, instructions or products referred to in the content. |
© 2025 by the authors. Licensee MDPI, Basel, Switzerland. This article is an open access article distributed under the terms and conditions of the Creative Commons Attribution (CC BY) license (https://creativecommons.org/licenses/by/4.0/).


 ,
, 