Abstract
Cities are the growth engines responsible for shaping the global economy, major contributors to climate change, and are significantly affected by it. However, the United Nations adopted the Sustainable Development Goals (SDGs) to make these cities and human settlements inclusive, safe, resilient, and sustainable. Yet, the rapid and unplanned urban expansion exacerbates various environmental challenges and reduces green cover in urban areas. To address these issues and meet the SDGs, stakeholders need to emphasise and optimise urban spaces. This study investigates the borough-level analysis of green spaces and human exposure to green spaces across London using satellite-derived datasets on vegetation and socio-economic factors to examine the variations in urban vegetation cover and urban population exposure to vegetation cover between 2017 and 2024. This study highlights the spatial disparity in green space coverage and exposure to green space between the inner and outer boroughs of London. The methodology used here suggests an average loss of approximately 11 and 9 percent in green space coverage and green space exposure to population, respectively, between 2017 and 2024 across London boroughs.
1. Introduction
In 2015, the General Assembly of the United Nations (UN) adopted the resolution ‘Transforming our world: the 2030 Agenda for Sustainable Development’. Under SDG 11, that aims to ‘Make cities and human settlements inclusive, safe, resilient and sustainable’, the indicator emphasises providing universal access to safe, inclusive, and accessible green and public spaces by 2030, particularly for women and children, older persons, and persons with disabilities [1]. However, in 2023, a UN report on the Sustainable Development Goals stated that 70 percent of people are expected to live in cities, which occupy almost 3 percent of global land area and are responsible for 60–80 percent of energy consumption [2]. Rapid urbanisation has an unprecedented impact on the environment and climate change, and urban areas collectively contribute to three-quarters of carbon dioxide equivalent emissions [3]. Simultaneously, cities have also shown potential to reduce emissions by adopting sustainable development strategies that prioritise green infrastructure (GI) [4]. Green space is a vital and multifunctional component of the urban ecosystem, and exposure to green spaces has always been associated with positive impacts on physical and mental health [5,6].
Due to its multi-functionality, GI generally refers to a system of natural and engineered green spaces that contribute to ecological and social functions in urban areas [7,8]. Various national and international authorities define GI differently. According to the European Commission, GI is a strategically planned network of natural and semi-natural areas with other environmental features strategically designed and managed to deliver a wide range of ecosystem services (ESs) [9,10]. And the Greater London Authority (GLA) defines GI in an urban setting as a network of parks, green spaces, gardens, woodlands, rivers and wetlands, as well as urban greening features such as street trees and green roofs [11,12]. Urban green spaces are considered one of the key environmental components for a healthy city and serve as areas for recreational and social activities, improving physical and mental health, fostering social cohesion, reducing the urban heat island effect, and improving air quality [5,13,14]. Nevertheless, urbanisation has reshaped the land-cover pattern, substantially altering the available green spaces in an urban environment and human exposure to urban green spaces [15]. Satellite-based technology and data products have been recognised as an optimised way to monitor these changes and map them efficiently [16,17,18,19]. Several studies have utilised multiple satellite datasets on vegetation, climate, and socio-economic factors to explore the differences in urban vegetation cover, drivers of change, and impact in cities across the global North and global South at different spatial scales [20,21]. A further study discusses the influence of GI on urban microclimate using other remote sensing-based techniques to measure canopy cover and vegetation structure [22].
This study investigates the variability in green spaces across the boroughs of London and explores human exposure to green spaces at the borough scale using satellite data. This will serve to provide critical insights into the spatial distribution of GI and to emphasise the need for sustainable management practices to strengthen urban resilience. This study has been divided into three objectives to achieve the desired outputs:
- Delineate green space coverage using satellite data;
- Map the spatially explicit distribution of populations;
- Quantify the spatial interaction between population and green space.
2. Materials and Methods
2.1. Study Area and Datasets
The study was conducted in the Greater London area, which is divided into local authority districts (LADs), comprising 32 boroughs and the City of London [23] (Table A1). As estimated by the GLA, London’s population was 8.9 million by mid-2023 [24].
The surface reflectance products of Sentinel-2, provided by the European Space Agency [25], were utilised. The red (10 m), blue (10 m), and SWIR (20 m) bands were used to calculate the Enhanced Vegetation Index (EVI) (Equation (1)) and to map greenness coverage between 2017 and 2024. The EVI uses the blue band and other aerosol reduction coefficients, which effectively reduce the influence of background soil signals and atmospheric influences [26,27]. The range of values lies between −1 and 1, with healthy vegetation generally around 0.20 to 0.80 [26].
Furthermore, the WorldPop dataset [28], available since 2015, was utilised to quantify the spatially explicit distribution of the population. The data provides the estimated number of people residing in each ~100 × 100 m grid cell based on a random forest model and a global database of administrative unit-based census information. The global datasets were used to develop contemporary data on human population distribution for the inner and outer boroughs of London, including the City of London (Table A1) (Appendix A).
2.2. Methodology
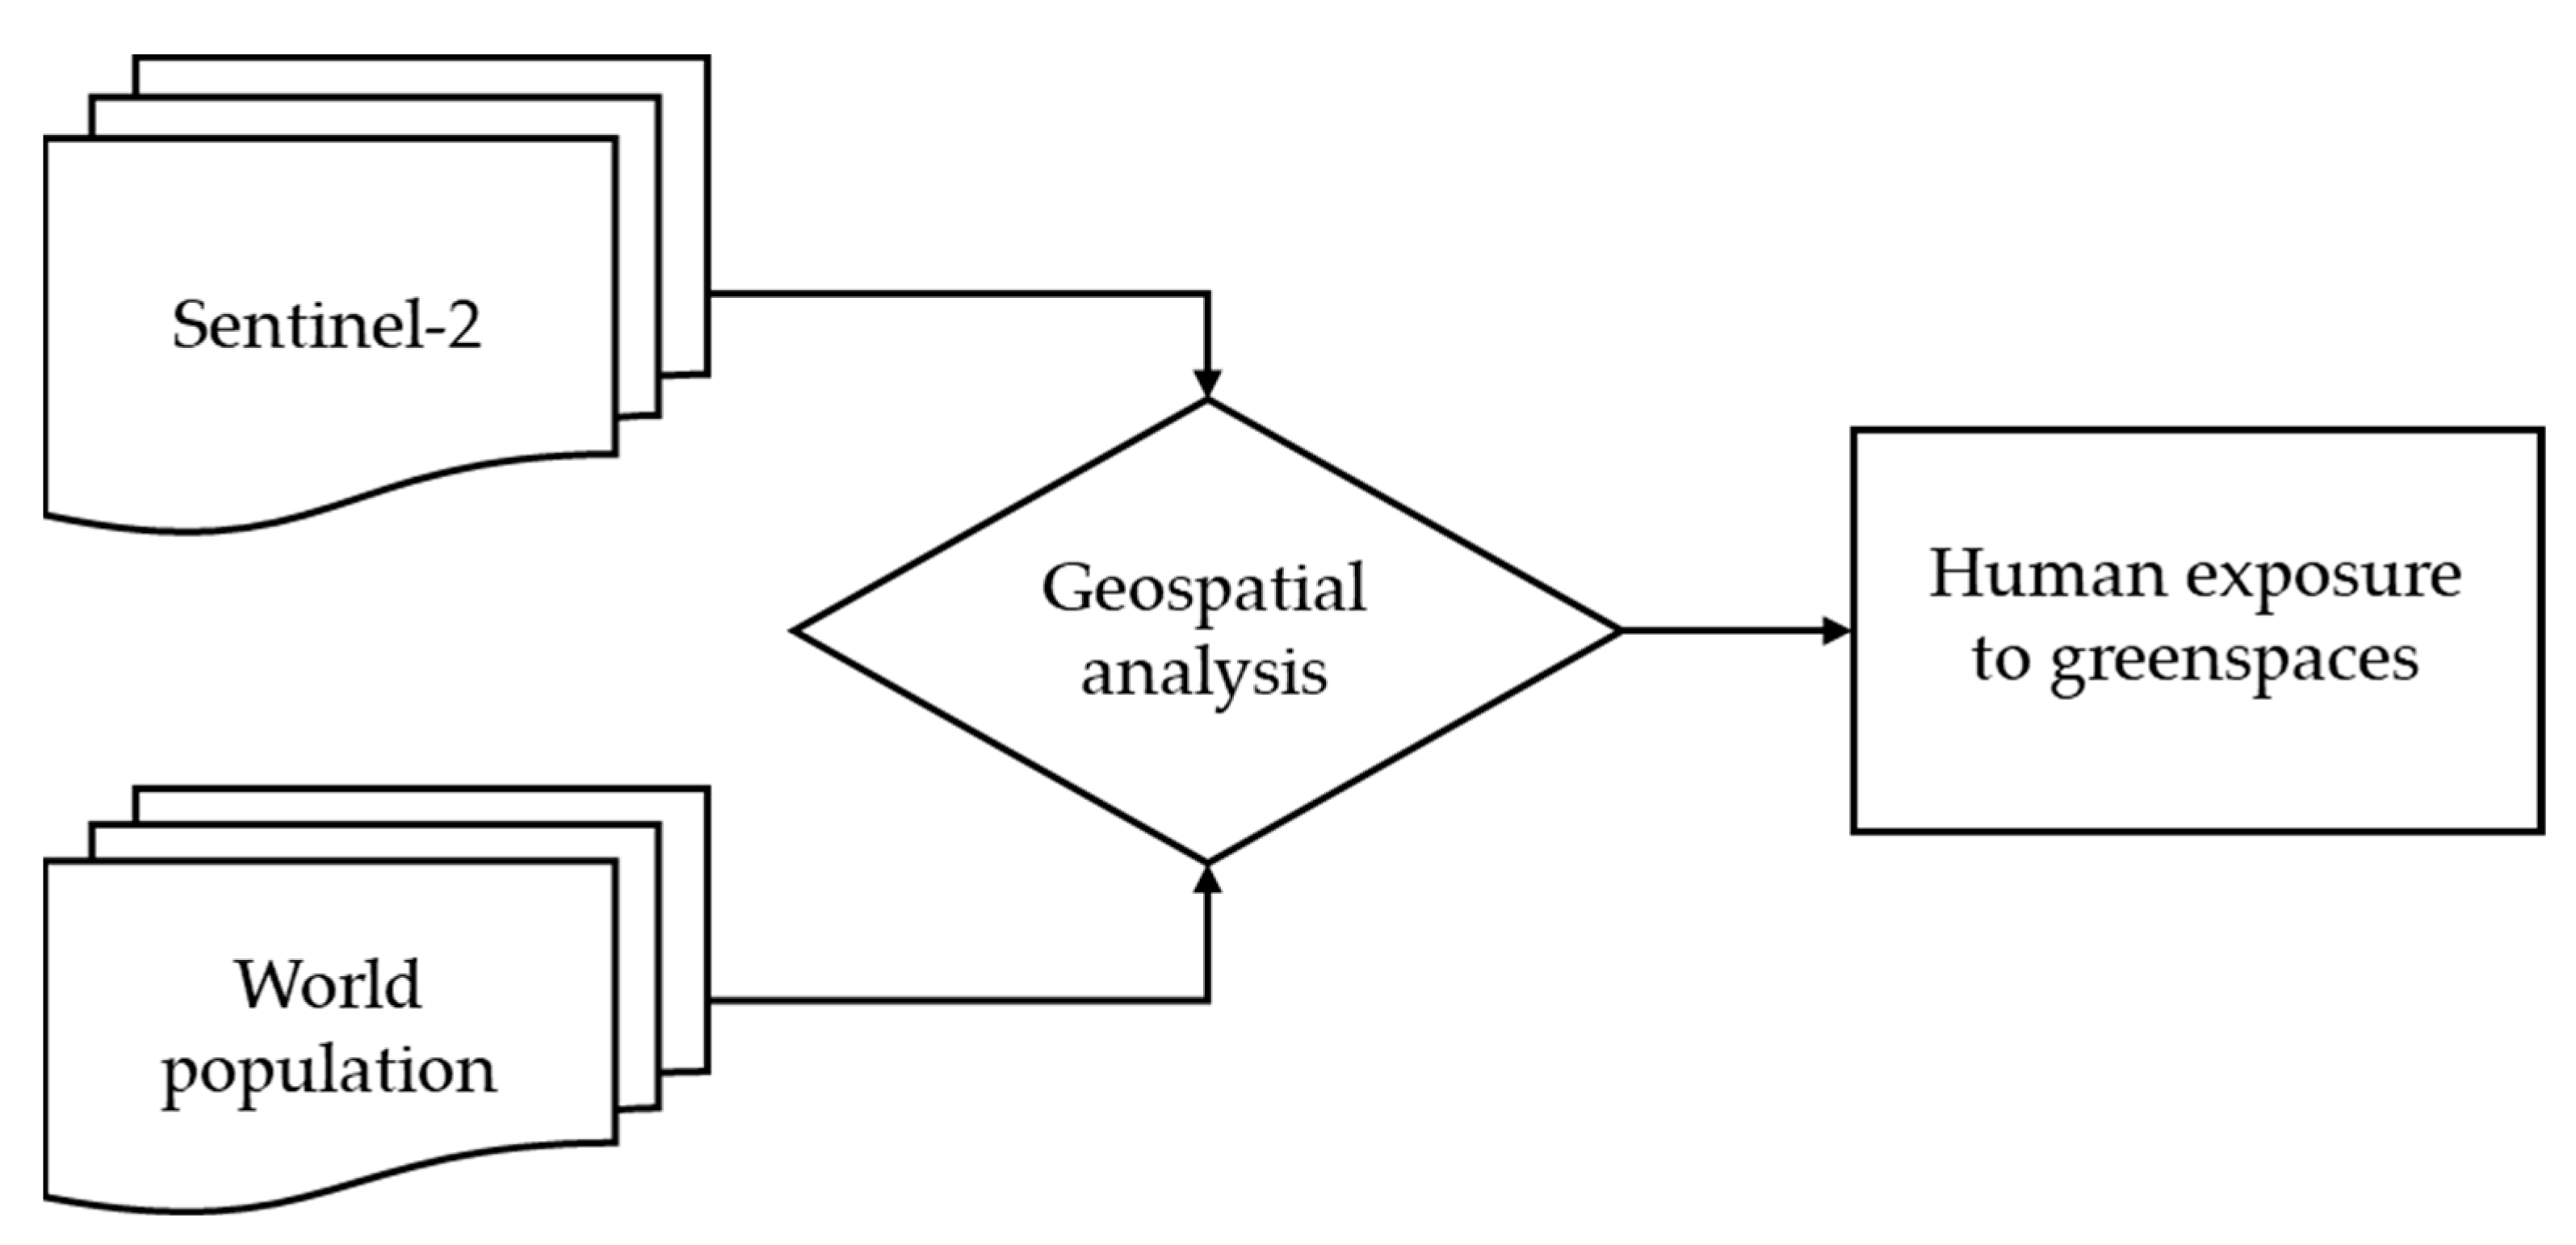
In this study, population distribution and geospatial data were analysed to map green space coverage and then quantify green space exposure in the neighbourhood (Figure 1) using a GIS-based environment [29].
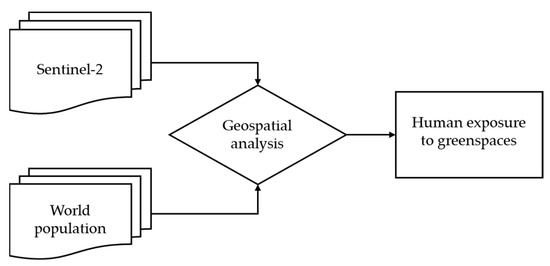
Figure 1.
Schematic representation of the methodological flowchart for calculating human exposure to green spaces.
2.2.1. Green Space Coverage
The Sentinel-2 data was utilised to derive EVI (Equation (1)) and to minimise radiometric noise and uncertainties; the images were selected with minimal cloud cover.
where C1 and C2 are the coefficients of the aerosol resistance term and use the blue band to correct for aerosol influences in the red band. L = 1, C1 = 6, C2 = 7.5, and G (gain factor) = 2.5 [26,27]. Additionally, the cloud cover was mitigated by using cloud masks and quality assurance flags provided in the original datasets. The EVI was calculated for all the images with less than 2 percent cloud cover captured between 2017 and 2024 at a 10 m spatial resolution for images covering the London area.
For green space coverage, EVI maps were aggregated into yearly medians and converted into binary components using a threshold value of 0.2 to discriminate between vegetation and non-vegetation features in an urban environment. Furthermore, EVI maps were resampled at 100 m to ensure that the data were spatially consistent with the 100 m population data.
2.2.2. Human Exposure to Green Spaces
For human exposure to green spaces, the quantification of the spatial interaction between population and green space was carried out using the methodology proposed by Song et al. [30]. The approach considers the distribution of population and green spaces in each grid cell, which provides quantitative measures of the extent to which people are exposed to green areas in urban environments (Equation (2)).
where human exposure to green spaces is defined as a function of population and green spaces for each year. denotes the estimated population residing within the k-th grid of borough b, is the fractional green space coverage of the grid-k in each borough of London, and n is the total number of grids covering London.
3. Results and Discussion
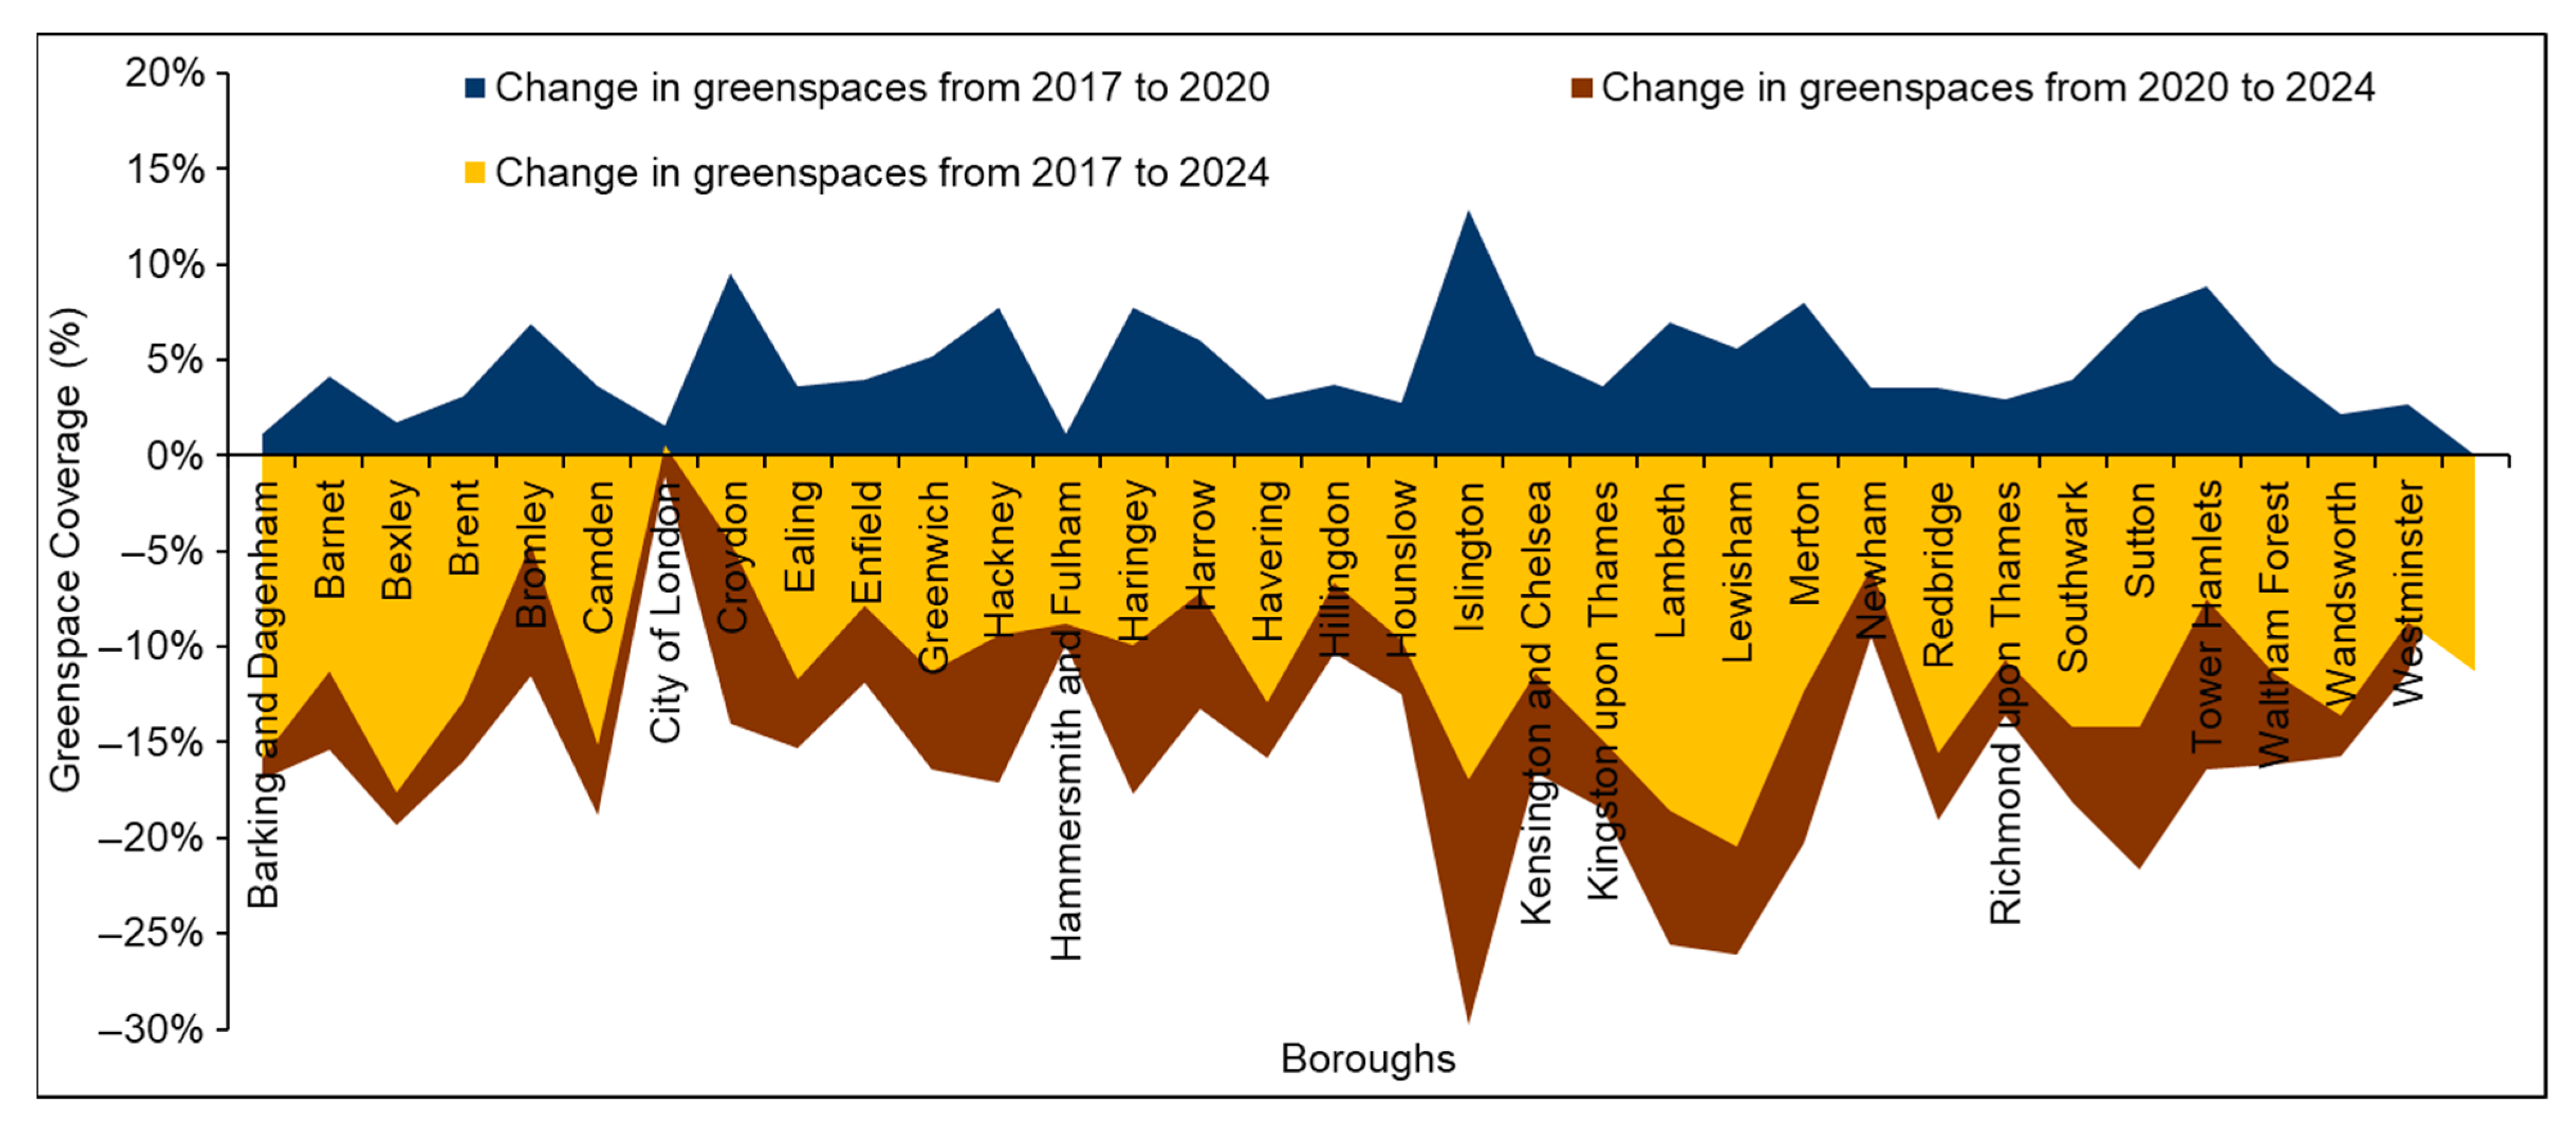
The assessment of green spaces shown in Figure 2 reveal a prominent decline between 2017 and 2024. The methodology adopted here suggests that more than 50 percent of boroughs have seen a decline of approximately 10–20 percent in green space during these years, and the average decline in green space for all the boroughs of London and the City of London is approximately 11 percent.

Figure 2.
The changing pattern in green space coverage across all boroughs of London between 2017 and 2024.
The EVI products derived from Sentinel-2 data between 2017 and 2024 were leveraged to quantify the green spaces. Furthermore, the EVI and population density image (Figure 3) products were separately analysed for the boroughs of London for the selected period for this study. The results showed that the inner boroughs of London have fewer green spaces, and a higher population density as compared to those of outer boroughs.
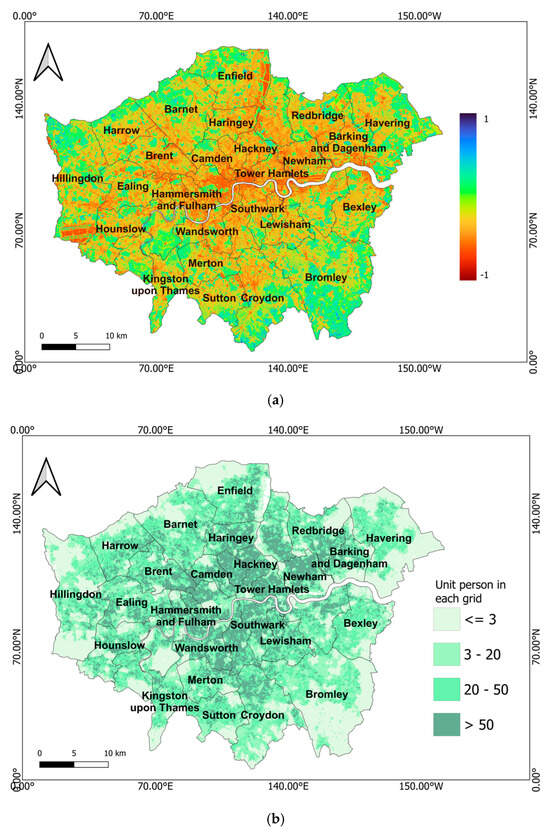
Figure 3.
Spatial distribution of EVI and population across London. (a) Borough-level assessment of Enhanced Vegetation Index for 2018. (b) Borough-level annual mean population across London for 2018.
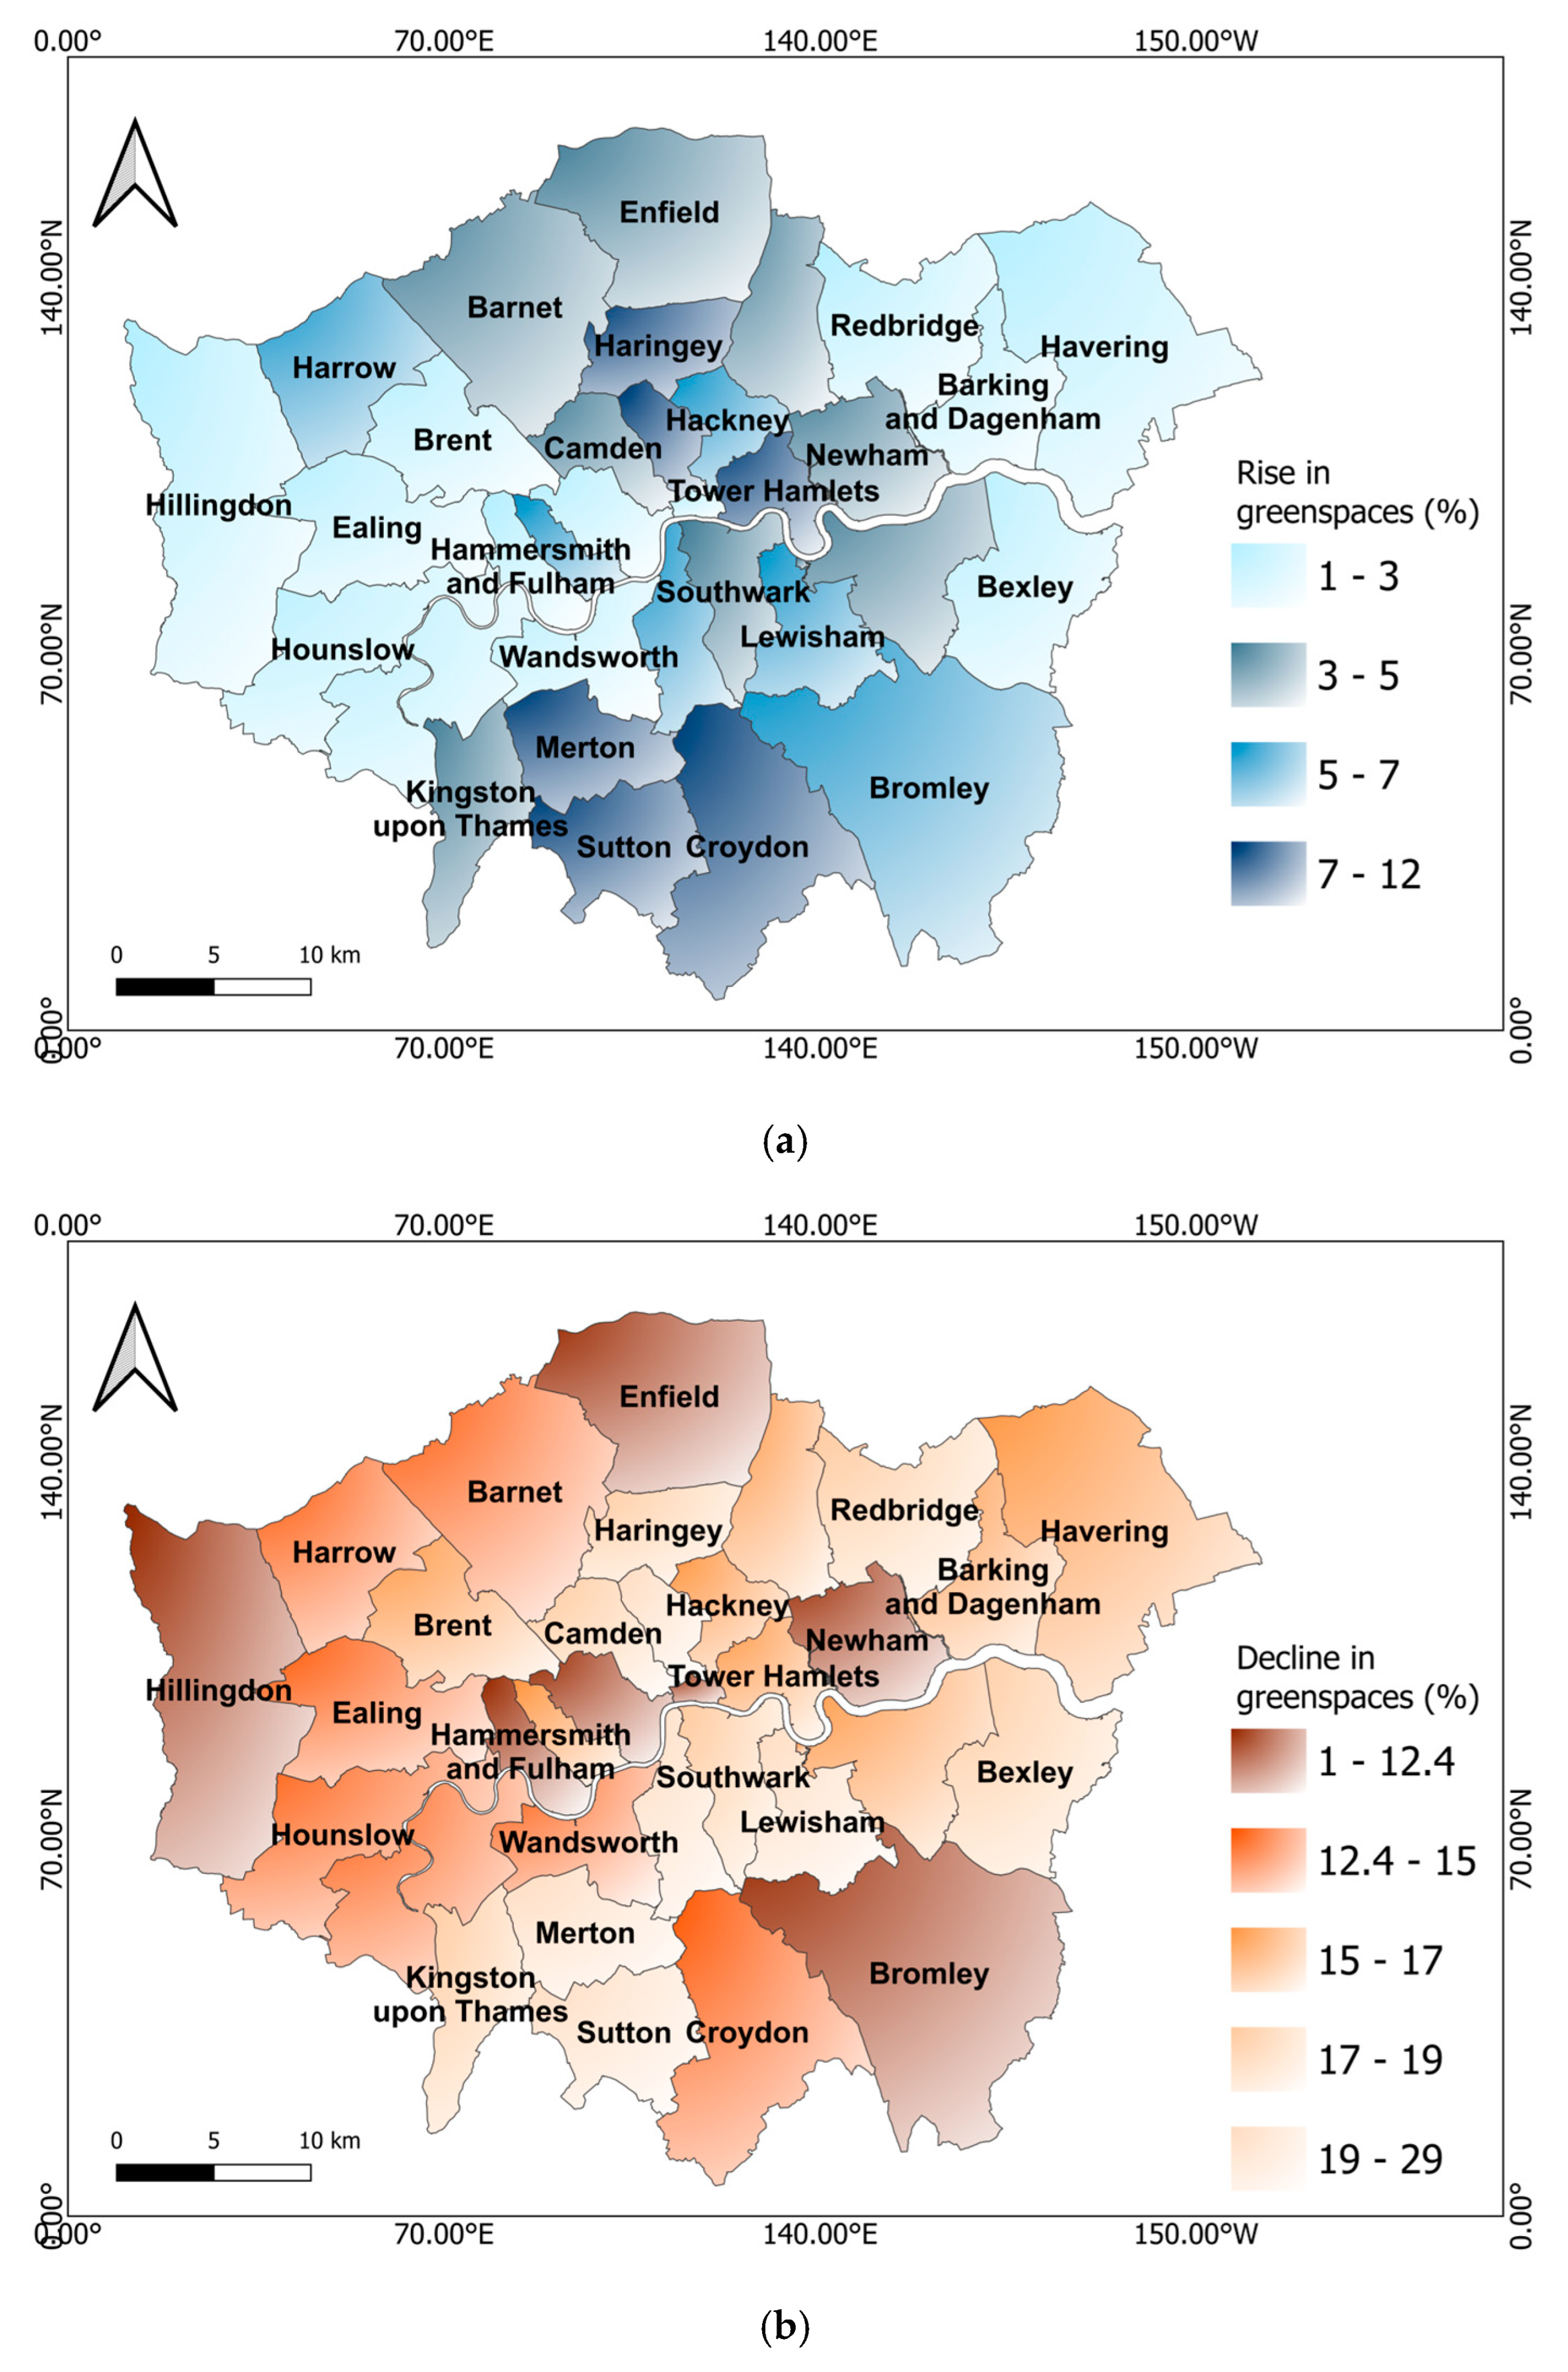
The yearly assessment showed an average increase of approximately 5 percent for all the boroughs between 2017 and 2024 and an approx. decline of 16 percent between 2020 and 2024 (Figure 4). It is also worth noting that these assessments are based on satellite-derived products and need further investigation, as well as the integration of finer-resolution datasets for enhanced accuracy of the observed results in complex urban environments.
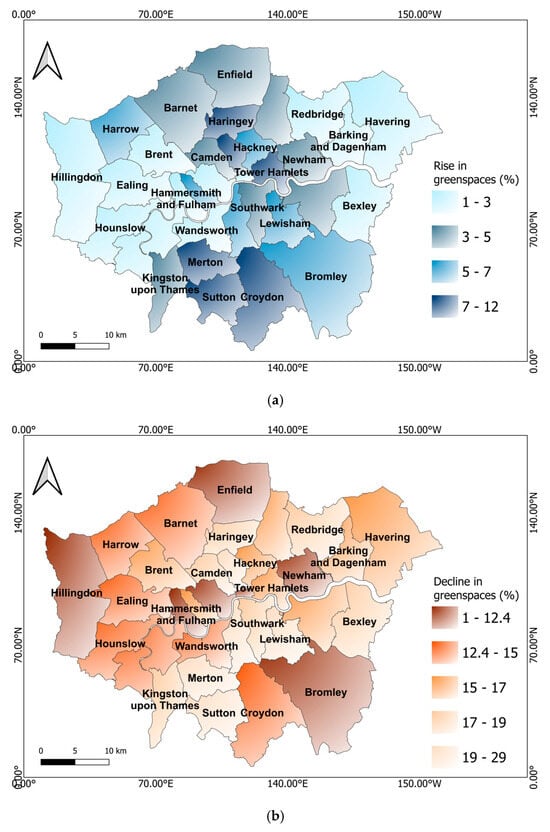
Figure 4.
Spatial distribution of change in green spaces: (a) Between 2017 and 2020, there was an average increase in green cover of ~5% across all boroughs. (b) Between 2020 and 2024, there was an average decline in green cover of ~11% across all boroughs.
Human exposure to green spaces between 2017 and 2024 was further assessed for all the boroughs of London and the City of London. The analysis shows that there is a significant difference in green space exposure among the residents of inner and outer boroughs across London. Residents of outer boroughs have more exposure to green spaces than the inner boroughs (Figure 5). The graph shows a decline of more than 15 percent in green space exposure for inner and outer boroughs between 2017 and 2024. Further assessment reveals that the percentage of green space exposure has decreased from ~58 percent to ~49 percent between 2017 and 2024 (Figure 6).
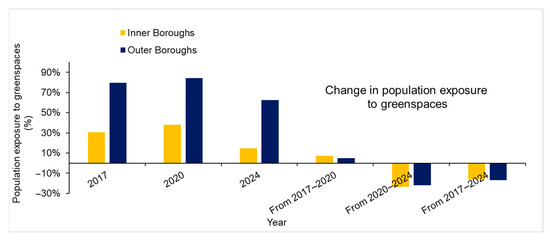
Figure 5.
Population exposure to green spaces for inner and outer boroughs of London for the years 2017, 2020, and 2024. The graph also shows the change in green spaces between 2017 and 2020, 2020 and 2024, and 2017 and 2024.
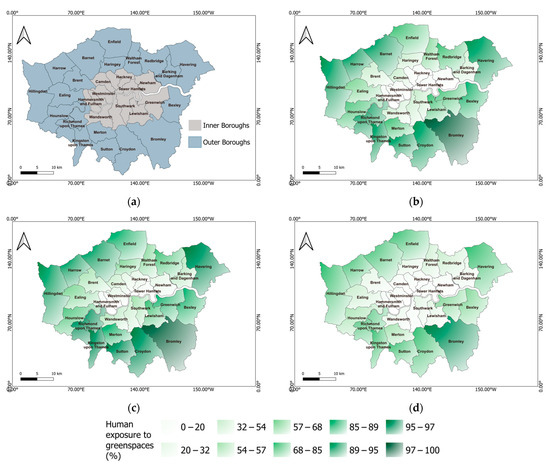
Figure 6.
(a) Inner and outer Boroughs of London, and Borough-level assessment of human exposure to green spaces using satellite-derived vegetation index and population data, with darker colours indicating higher levels of green space exposure; (b) 2017, (c) 2020, and (d) 2024.
London stands out among other global cities for its public green space, ranking tenth out of thirty global cities, surpassing other urban centres such as New York, Berlin, and Paris [31].
Despite London’s relatively high green cover, the report from the London Environment Strategy (2018) reported recent losses in green cover spaces due to new infrastructure developments such as housing, industries, schools, and transport [31]. The current study outcomes support the recent losses and indicate spatial differences in green spaces and green space exposure to residents of the neighbourhood in London and highlight the need to develop a strategy for the protection and enhancement of London GI. However, there are several noticeable limitations. First, these images do not consider the phenology and other characteristics of GI in complex urban environments. Second, the measurements allocate equal green spaces to a population irrespective of their accessibility. Third, the analytical outcomes for different boroughs could be influenced by the spatial aggregation and resampling techniques used to harmonise the datasets, which sometimes smooth out the finer spatial details. Additionally, it is believed that the green space exposure also varies due to geographical heterogeneity and regional weather patterns. Further, the spatial distribution of green spaces is also influenced by urbanisation patterns, master plans, and funding opportunities.
4. Conclusions and Future Developments
This study highlights the utilisation of satellite-derived products to map urban green coverage. Additionally, the integration of demographic information with satellite products to quantify green spaces and human exposure is one of the many abilities of satellite-based applications in the field of urban resilience. The study showed a ~5% increase in area percentage between 2017 and 2020 and a ~15% loss between 2020 and 2024 in green space coverage across London. This study also underscores that the inner boroughs of London have a denser population, scattered green spaces, and fewer residents exposed to green spaces. Simultaneously, the outer Boroughs of London showed higher levels of green spaces and greater exposure to green spaces. While the current findings offer valuable insights, their robustness and granularity could be strengthened through the incorporation of higher-resolution datasets and an understanding of vegetation characteristics inferences on green coverage mapping and green space exposure for complex urban environments. Furthermore, this study contributes to understanding urban dynamics and urban green infrastructure. This insight could support stakeholders in developing strategies specific to the urban environment.
This research will further develop the integration of the phenological change in the methodology and its analysis in the urban environment. Furthermore, this research will target the development of an SDG matrix to assess how green spaces and the impact of green space exposure on communities contribute to achieving SDGs. It will help in understanding the influence of specific types of GI in the existing urban setup, ultimately fostering more equitable and sustainable urban environments.
Author Contributions
Conceptualisation: S.K., T.T.T., and F.T.; methodology: S.K., T.T.T., and F.T.; formal analysis: S.K.; writing—original draft preparation: S.K.; writing—review and editing: S.K., F.T., S.K.G., P.C., A.B., L.H., and T.T.T.; supervision: F.T., T.T.T., S.K.G., P.C., D.M., A.B., and L.H. All authors have read and agreed to the published version of the manuscript.
Funding
This research was funded by the Vice-Chancellor’s PhD Scholarship at the University of West London.
Institutional Review Board Statement
Not applicable.
Informed Consent Statement
Not applicable.
Data Availability Statement
The original contributions presented in this study are included in this article. Further inquiries can be directed to the corresponding author.
Acknowledgments
Sincere thanks to the following for their support: Lord Faringdon Charitable Trust, The Schroder Foundation, Cazenove Charitable Trust, Ernest Cook Trust, Henry Keswick, Ian Bond, P. F. Charitable Trust, Prospect Investment Management Limited, The Adrian Swire Charitable Trust, The John Swire 1989 Charitable Trust, The Tanlaw Foundation, and The Wyfold Charitable Trust. The geospatial analysis and map visualisation in this study were performed using QGIS, an open-source geographic information system.
Conflicts of Interest
The authors declare no conflicts of interest.
Abbreviations
The following abbreviations are used in this manuscript:
| UN | United Nations |
| SDG | Sustainable Development Goals |
| EVI | Enhanced Vegetation Index |
| GI | Green Infrastructure |
| ES | Economic Services |
| SWIR | Shortwave Infrared |
| LAD | Local Authority District |
| m | metre |
| Approx. | Approximately |
| GLA | Greater London Authority |
| GIS | Geographic Information System |
| QGIS | Quantum Geographic Information System |
Appendix A
There are 32 boroughs in London and another division called the City of London, which is a separate district [23].

Table A1.
List of inner and outer London boroughs.
Table A1.
List of inner and outer London boroughs.
| Borough Name | Location |
|---|---|
| Barking and Dagenham | Outer |
| Barnet | Outer |
| Bexley | Outer |
| Brent | Outer |
| Bromley | Outer |
| Camden | Inner |
| City of London | Inner |
| Croydon | Outer |
| Ealing | Outer |
| Enfield | Outer |
| Greenwich | Inner |
| Hackney | Inner |
| Hammersmith and Fulham | Inner |
| Haringey | Outer |
| Harrow | Outer |
| Havering | Outer |
| Hillingdon | Outer |
| Hounslow | Outer |
| Islington | Inner |
| Kensington and Chelsea | Inner |
| Kingston upon Thames | Outer |
| Lambeth | Inner |
| Lewisham | Inner |
| Merton | Outer |
| Newham | Inner |
| Redbridge | Outer |
| Richmond upon Thames | Outer |
| Southwark | Inner |
| Sutton | Outer |
| Tower Hamlets | Inner |
| Waltham Forest | Outer |
| Wandsworth | Inner |
| Westminster | Inner |
References
- United Nations. Resolution Adopted by the General Assembly on 25 September 2015. 21 October 2015. Available online: https://docs.un.org/en/A/RES/70/1 (accessed on 22 April 2025).
- United Nations. The Sustainable Development Goals Report 2023: Special Edition; United Nations: New York, NY, USA, 2023; pp. 1–76. Available online: https://unstats.un.org/sdgs/report/2023/The-Sustainable-Development-Goals-Report-2023.pdf (accessed on 22 May 2025).
- Shukla, P.R.; Skea, J.; Buendia, E.C.; Masson-Delmotte, V.; Pörtner, H.-O.; Roberts, D.C.; Zhai, P.; Slade, R.; Connors, S.; van Diemen, R.; et al. (Eds.) Summary for Policymakers. In Climate Change and Land: An IPCC Special Report on Climate Change, Desertification, Land Degradation, Sustainable Land Management, Food Security, and Greenhouse Gas Fluxes in Terrestrial Ecosystems; 2019; Available online: https://www.ipcc.ch/srccl/chapter/summary-for-policymakers/ (accessed on 5 March 2025).
- Wang, Y.; Moskovits, D.K. Tracking Fragmentation of Natural Communities and Changes in Land Cover: Applications of Landsat Data for Conservation in an Urban Landscape (Chicago Wilderness). Conserv. Biol. 2001, 15, 835–843. [Google Scholar] [CrossRef]
- Bibri, S.E.; Krogstie, J. Smart sustainable cities of the future: An extensive interdisciplinary literature review. Sustain. Cities Soc. 2017, 31, 183–212. [Google Scholar] [CrossRef]
- Qi, J.; Mazumdar, S.; Vasconcelos, A.C. Understanding the Relationship between Urban Public Space and Social Cohesion: A Systematic Review. Int. J. Commun. 2024, 7, 155–212. [Google Scholar] [CrossRef]
- Sandström, U.G. Green Infrastructure Planning in Urban Sweden. Plan. Pract. Res. 2002, 17, 373–385. [Google Scholar] [CrossRef]
- Sandström, U.G.; Angelstam, P.; Khakee, A. Urban comprehensive planning—Identifying barriers for the maintenance of functional habitat networks. Landsc. Urban Plan. 2005, 75, 43–57. [Google Scholar] [CrossRef]
- European Commission. Review of Progress on Implementation of the EU Green Infrastructure Strategy; European Commission: Brussels, Belgium, 2019; pp. 1–11. Available online: https://eur-lex.europa.eu/legal-content/EN/TXT/PDF/?uri=CELEX:52019DC0236&from=ga (accessed on 20 April 2025).
- Hermoso, V.; Morán-Ordóñez, A.; Lanzas, M.; Brotons, L. Designing a network of green infrastructure for the EU. Landsc. Urban Plan. 2020, 196, 103732. [Google Scholar] [CrossRef]
- Greater London Authority. Using Green Infrastructure to Protect People from Air Pollution; Greater London Authority: London, UK, 2019. Available online: https://www.london.gov.uk/sites/default/files/green_infrastruture_air_pollution_may_19.pdf (accessed on 20 February 2025).
- Amano, T.; Butt, I.; Peh, K.S.H. The importance of green spaces to public health: A multi-continental analysis. Ecol. Soc. Am. 2018, 28, 1473–1480. [Google Scholar] [CrossRef] [PubMed]
- Kumar, P.; Shani, J.; Perez, K.C.; Ahlawat, A.; de Fatima Andrade, M.; Athanassiadou, M.; Cao, S.-J.; Collins, L.; Dey, S.; Sabatino, S.D.; et al. Urban greening for climate resilient and sustainable cities: Grand challenges and opportunities. Front. Sustain. Cities 2025, 7, 1595280. [Google Scholar] [CrossRef]
- Zhang, R.; Ying, J.; Zhang, Y.; Li, Z.; Zhou, X. Future carbon sequestration Benefits: The role of urban green Infrastructure’s spatial patterns. Ecol. Indic. 2024, 166, 112582. [Google Scholar] [CrossRef]
- Isendahl, C.; Dunning, N.P.; Grazioso, L.; Hawken, S.; Lentz, D.L.; Scarborough, V.L. Growth and decline of a sustainable city: A multitemporal perspective on blue-black-green infrastructures at the pre-Columbian Lowland Maya city of Tikal. Urban Stud. 2025, 62, 487–506. [Google Scholar] [CrossRef]
- Koc, C.B.; Osmond, P.; Peters, A. Evaluating the cooling effects of green infrastructure: A systematic review of methods, indicators and data sources. Sol. Energy 2018, 166, 486–508. [Google Scholar] [CrossRef]
- Carlson, T.N.; Arthur, S.T. The impact of land use -land cover changes due to urbanization on surface microclimate and hydrology: A satellite perspective. Glob. Planet. Change 1998, 25, 49–65. [Google Scholar] [CrossRef]
- Venter, Z.S.; Shackleton, C.M.; Van Staden, F.; Selomane, O.; Masterson, V.A. Green Apartheid: Urban green infrastructure remains unequally distributed across income and race geographies in South Africa. Landsc. Urban Plan. 2020, 203, 103889. [Google Scholar] [CrossRef]
- Furberg, D.; Ban, Y.; Mörtberg, U. Monitoring Urban Green Infrastructure Changes and Impact on Habitat Connectivity Using High-Resolution Satell Data. Remote Sens. 2020, 18, 3072. [Google Scholar] [CrossRef]
- Leng, S.; Sun, R.; Yang, X.; Chen, L. Global inequities in population exposure to urban green spaces increased amidst tree and nontree vegetation cover expansion. Commun. Earth Environ. 2023, 4, 464. [Google Scholar] [CrossRef]
- Chen, B.; Wu, S.; Song, Y.; Webster, C.; Xu, B.; Gong, P. Contrasting inequality in human exposure to green space between cities of Global North and Global South. Nat. Commun. 2022, 13, 4636. [Google Scholar] [CrossRef] [PubMed]
- Arzberger, S.; Egerer, M.; Suda, M.; Annighöfer, P. Thermal regulation potential of urban green spaces in a changing climate: Winter insights. Urban For. Amp. Urban Green. 2024, 100, 128488. [Google Scholar] [CrossRef]
- Pipe, J.; Ali, S.; Halliwell, D.; Layfield, T. The London Plan. 2021. Available online: https://www.london.gov.uk/programmes-strategies/planning/london-plan/the-london-plan-2021-table-contents (accessed on 20 April 2025).
- Greater London Authority. London Datastore, 2025; Volume 2022. Available online: https://data.london.gov.uk/ (accessed on 15 November 2024).
- The European Space Agency. The European Space Agency, 2025; Volume 2025. Available online: https://www.esa.int/ (accessed on 18 October 2024).
- Huete, A.R.; Liu, H.Q.; Batchily, K.; van Leeuwen, W. A comparison of vegetation indices over a global set of TM images for EOS-MODIS. Remote Sens. Environ. 1997, 59, 440–451. [Google Scholar] [CrossRef]
- Huete, A.; Didan, K.; Miura, T.; Rodriguez, E.P.; Gao, X.; Ferreira, L.G. Overview of the radiometric and biophysical performance of the MODIS vegetation indices. Remote Sens. Environ. 2002, 83, 195–213. [Google Scholar] [CrossRef]
- WorldPop. Open Spatial Demographic Data and Research, 2025; Volume 2025. Available online: https://www.worldpop.org/ (accessed on 18 October 2024).
- QGIS Association. QGIS Association: QGIS Geographic Information System, 2024; Volume 3.40.0. Available online: https://qgis.org/project/visual-changelogs/visualchangelog340/ (accessed on 18 October 2024).
- Song, Y.; Chen, B.; Ho, H.C.; Kwan, M.; Liu, D.; Wang, F.; Wang, J.; Cai, J.; Li, X.; Xu, Y. Observed inequality in urban green space exposure in China. Environ. Int. 2021, 156, 106778. [Google Scholar] [CrossRef] [PubMed]
- Greater London Authority. London Environment Strategy, 05-05. 2018. Available online: https://www.london.gov.uk/sites/default/files/implementation_plan.pdf (accessed on 18 October 2024).


Disclaimer/Publisher’s Note: The statements, opinions and data contained in all publications are solely those of the individual author(s) and contributor(s) and not of MDPI and/or the editor(s). MDPI and/or the editor(s) disclaim responsibility for any injury to people or property resulting from any ideas, methods, instructions or products referred to in the content. |
© 2025 by the authors. Licensee MDPI, Basel, Switzerland. This article is an open access article distributed under the terms and conditions of the Creative Commons Attribution (CC BY) license (https://creativecommons.org/licenses/by/4.0/).