1. Introduction
Agricultural production in Bulgaria is a key contributor to the national economy, with cereal crops such as wheat, maize, and sunflower dominating arable land use [
1]. Accurate and timely yield predictions are essential for optimizing resource allocation, supporting supply chain management, and informing agricultural policy [
2]. However, existing national yield estimation methods primarily rely on statistical surveys and farmer reports, which can be delayed, spatially generalized, and susceptible to reporting errors.
Accurate and timely crop yield prediction plays a critical role in agricultural planning, food security, and sustainable land management [
3,
4]. In the context of climate change, shifting weather patterns, and increasing demands on food systems, reliable methods for estimating yield are more important than ever [
5]. Traditional methods, relying on field reports and statistical surveys, are often labor-intensive, delayed, or lacking spatial granularity [
6].
Recent advancements in remote sensing and the availability of high-resolution satellite imagery have enabled the development of scalable, data-driven approaches to monitoring crop development and forecasting yields [
7,
8]. Sentinel-2, with its high spatial and temporal resolution, provides key multispectral information that can be used to derive vegetation indices such as the NDVI (Normalized Difference Vegetation Index), EVI (Enhanced Vegetation Index), and GCI (Green Chlorophyll Index). These indices are not only the most frequently used [
9], but they also offer insights into vegetation health, canopy structure, and chlorophyll content—valuable indicators of crop performance [
10].
In the local context of Bulgaria, studies such as Kamenova et al.’s [
11] have successfully applied Sentinel-2-based crop type mapping and yield prediction, using classifiers like Random Forest and SVM to estimate winter wheat yields in the Upper Thracian Lowland. Furthermore, Chanev et al. [
12] evaluated higher-resolution Sentinel-2 Deep Resolution 3.0 (1 m) imagery for organic barley mapping and yield analysis, demonstrating that fine-spatial-scale data can enhance crop identification accuracy.
Building on these advances, this study leverages Sentinel-2 imagery, computes robust vegetation index time-series (NDVI, EVI, GCI), integrates publicly available Bulgarian agricultural and climate data, and employs machine learning (Random Forest) for localized yield forecasting. The goal is to develop a reproducible, data-driven model tailored to Bulgaria’s agro-climatic context.
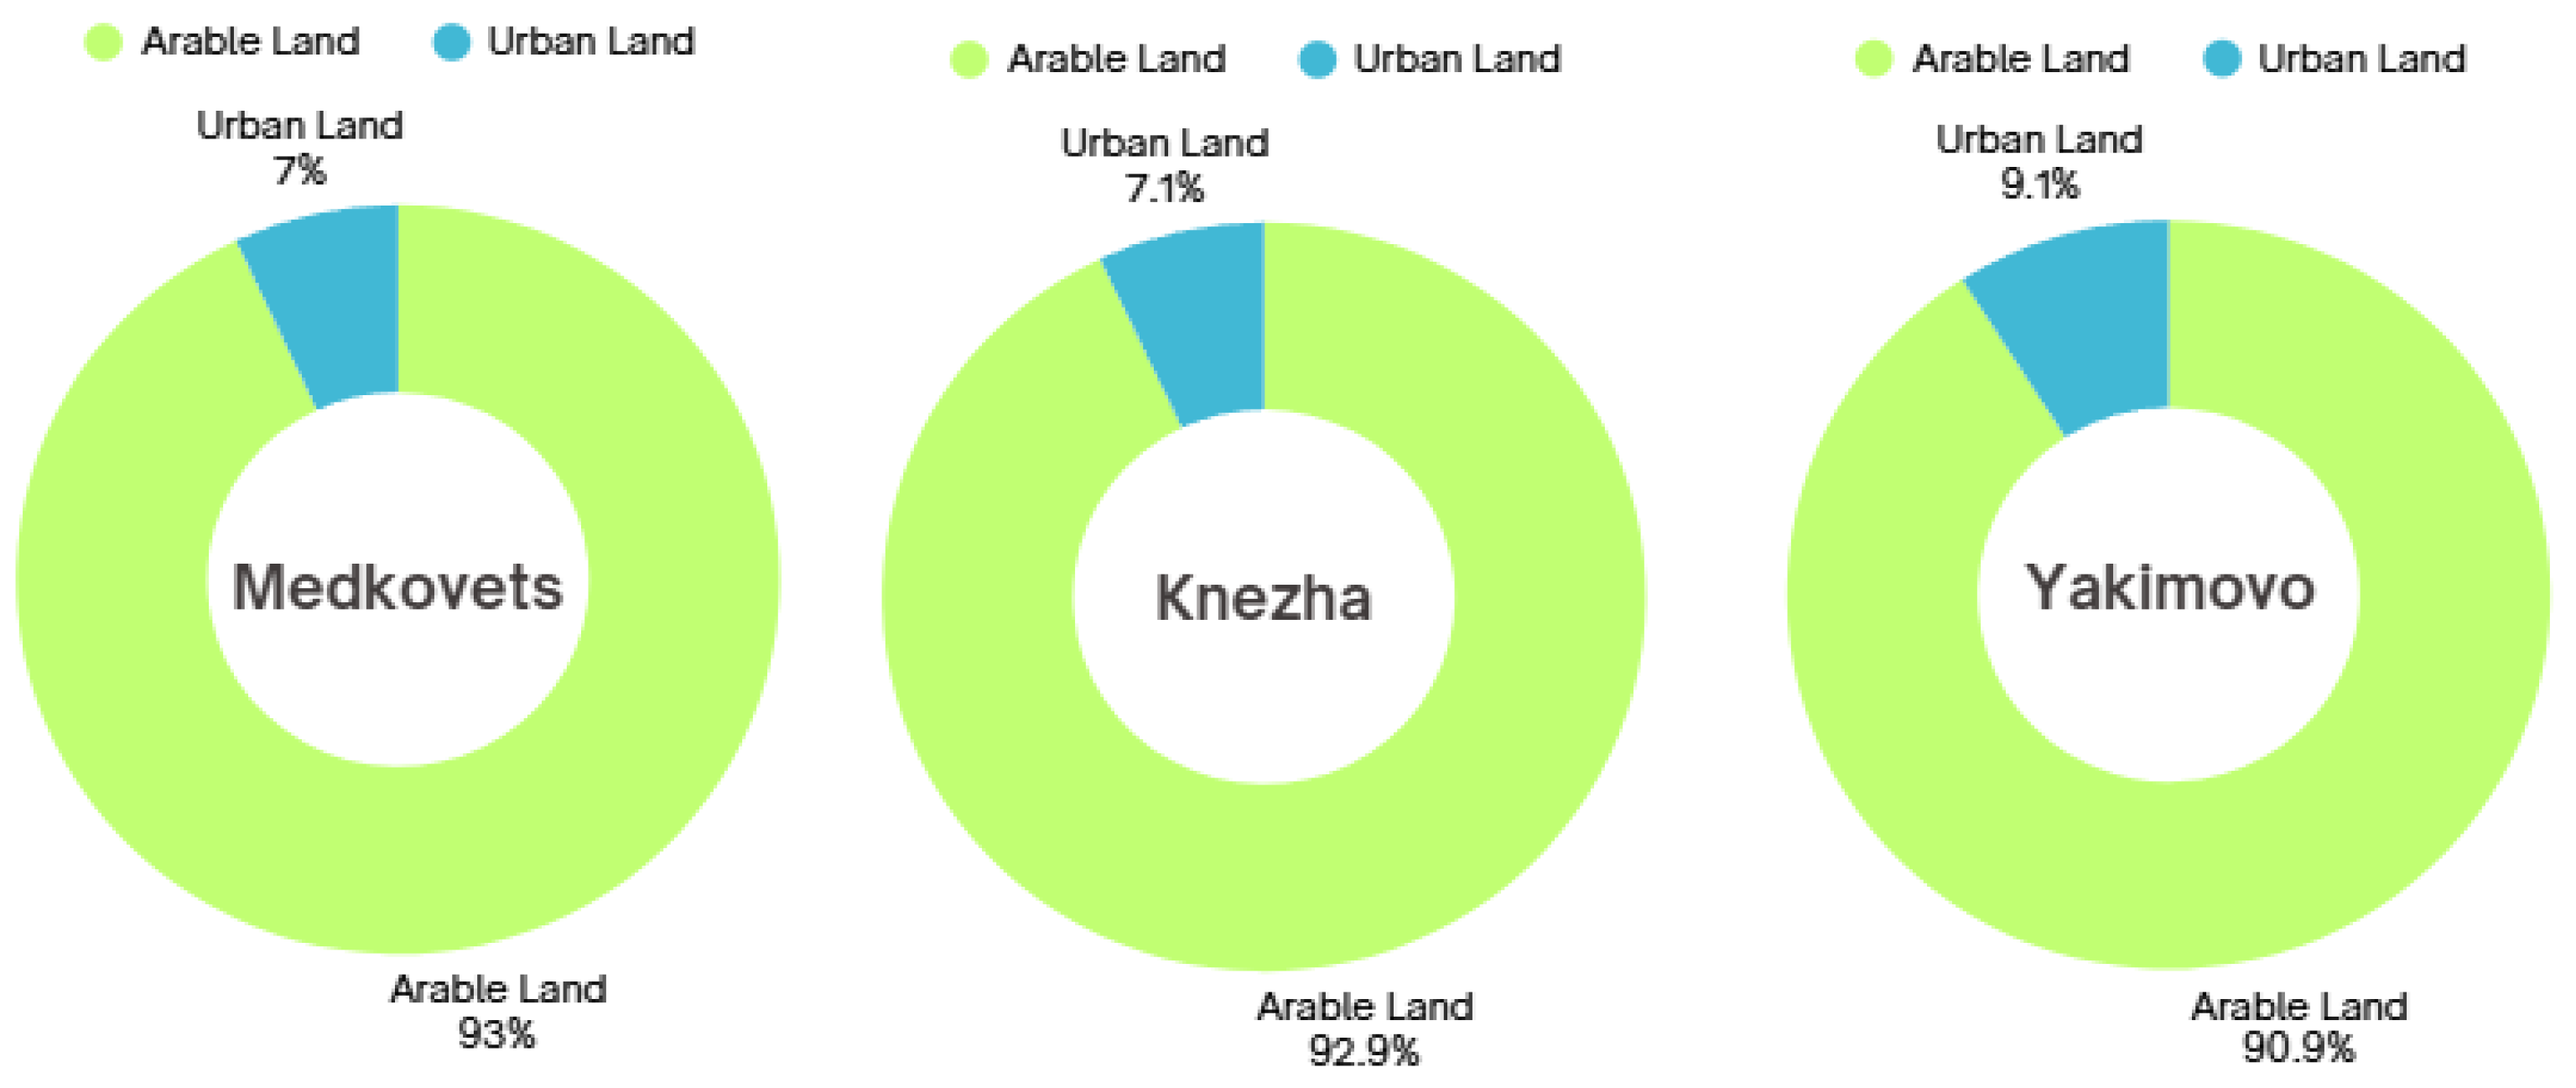
This study focuses on three municipalities in Northern Bulgaria—Medkovets, Yakimovo, and Knezha—selected based on their high concentration of arable land. According to the Bulgarian National Statistical Institute [
1], the municipalities of Medkovets, Knezha, and Yakimovo have more than 90% of arable parcels in their territory (see
Figure 1).
The research aim is to train a yield prediction model that could be used for the basic crops harvested in Bulgaria: maize, sunflower, and wheat. This paper describes a technological scheme that the authors developed. Although there are a number of Bulgarian studies in the area of precision agriculture, fewer researchers work on prediction models in order to aid farmers in their everyday tasks [
13,
14]. The latter is more than necessary considering climate change and its impact on nature and urban and arable land as well.
2. Study Area
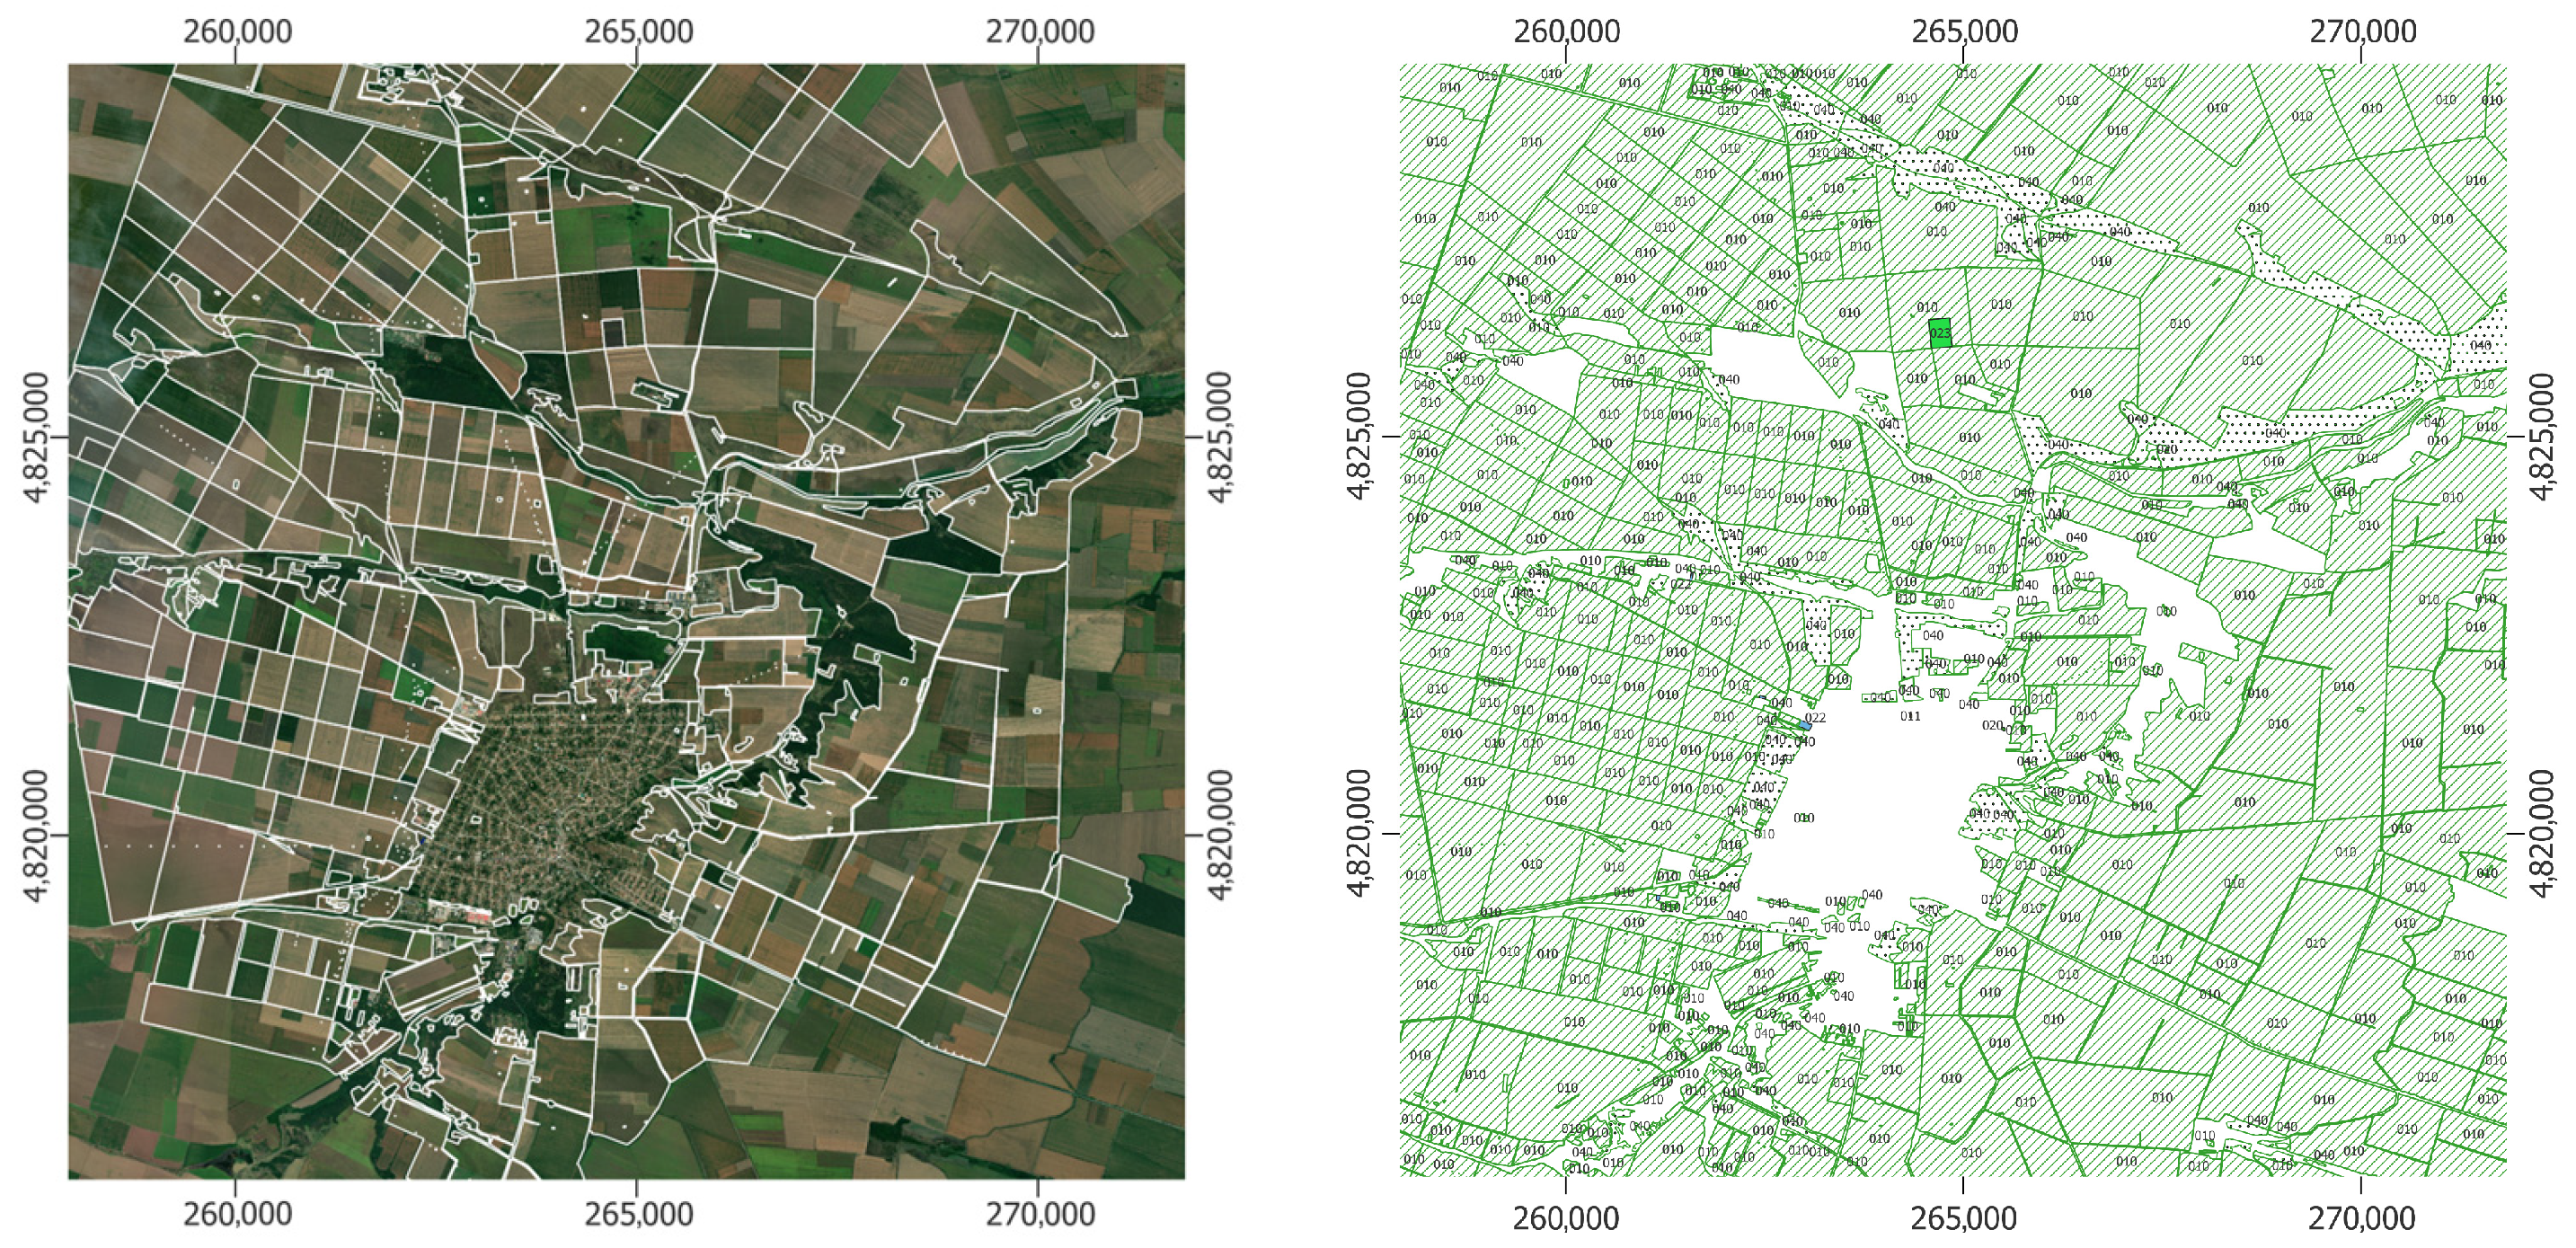
This study focuses on three municipalities in northern Bulgaria—Medkovets, Yakimovo, and Knezha—selected for their agricultural prominence and high concentration of arable land. Medkovets and Yakimovo are adjacent to each other and share similar agro-climatic conditions, characterized by continental climate, fertile plains, and dominant cereal cultivation. Their proximity allows for comparative analysis under similar environmental and management regimes. Extraction from the public parcel data for the area of Medkovets is shown in
Figure 2. Check
Figures S1 and S2 in the Supplementary Materials for the other two municipalities.
3. Data and Materials
In this study, a combined approach is applied using Sentinel-2 multispectral satellite data and open public data provided by the Bulgarian government to support agricultural analysis and yield prediction. The workflow begins with the preprocessing of Sentinel-2 imagery, followed by the computation of key vegetation indices—NDVI (Normalized Difference Vegetation Index), EVI (Enhanced Vegetation Index), and GCI (Green Chlorophyll Index)—over time, resulting in detailed regional time-series. These indices are stated as the most effective for monitoring vegetation vigor, chlorophyll content, and biomass [
15]. They are also widely adopted for agricultural yield prediction. Moreover, the NDVI and EVI are demonstrated to be robust predictors of crop yield across diverse climates, with the EVI showing better performance in high-biomass conditions [
16,
17]. These satellite-derived metrics are then aggregated and aligned with public datasets, such as administrative boundaries, reported yields, and land use information. The integrated dataset is subsequently prepared for machine learning, including feature engineering, model training, and performance evaluation, supporting data-driven decision-making in agricultural monitoring.
3.1. Satellite Data (Sentinel-2)
Sentinel-2 Level-2A imagery was used to compute three vegetation indices for the years 2023 and 2024:
NDVI (Normalized Difference Vegetation Index), which indicates vegetation greenness and density.
EVI (Enhanced Vegetation Index), which improves sensitivity in high-biomass regions.
GCI (Green Chlorophyll Index), which captures chlorophyll content and crop vigor.
Time-series were constructed at 10–15-day intervals, processed using ESA SNAP 12.0.0 [
18], and further analyzed in Python 3.8.10 [
19] using geospatial libraries like gdal [
20], rasterio [
21], geopandas [
22], and matplotlib [
23].
3.2. Public Data
Historical crop yield records per municipality were sourced from the State Agricultural Fund [
2] and used as the target variable in model training. The data were aligned with the vegetation and climate inputs based on calendar year and administrative boundaries.
3.3. Climate and Land Cover Data
Weather data, including precipitation and temperature, were retrieved from the Bulgarian Meteorology and Hydrology Institute [
24]. Land use and field boundaries were extracted from Bulgaria’s Agricultural Fund database. Data used for the research is described in
Table 1.
4. Methodology
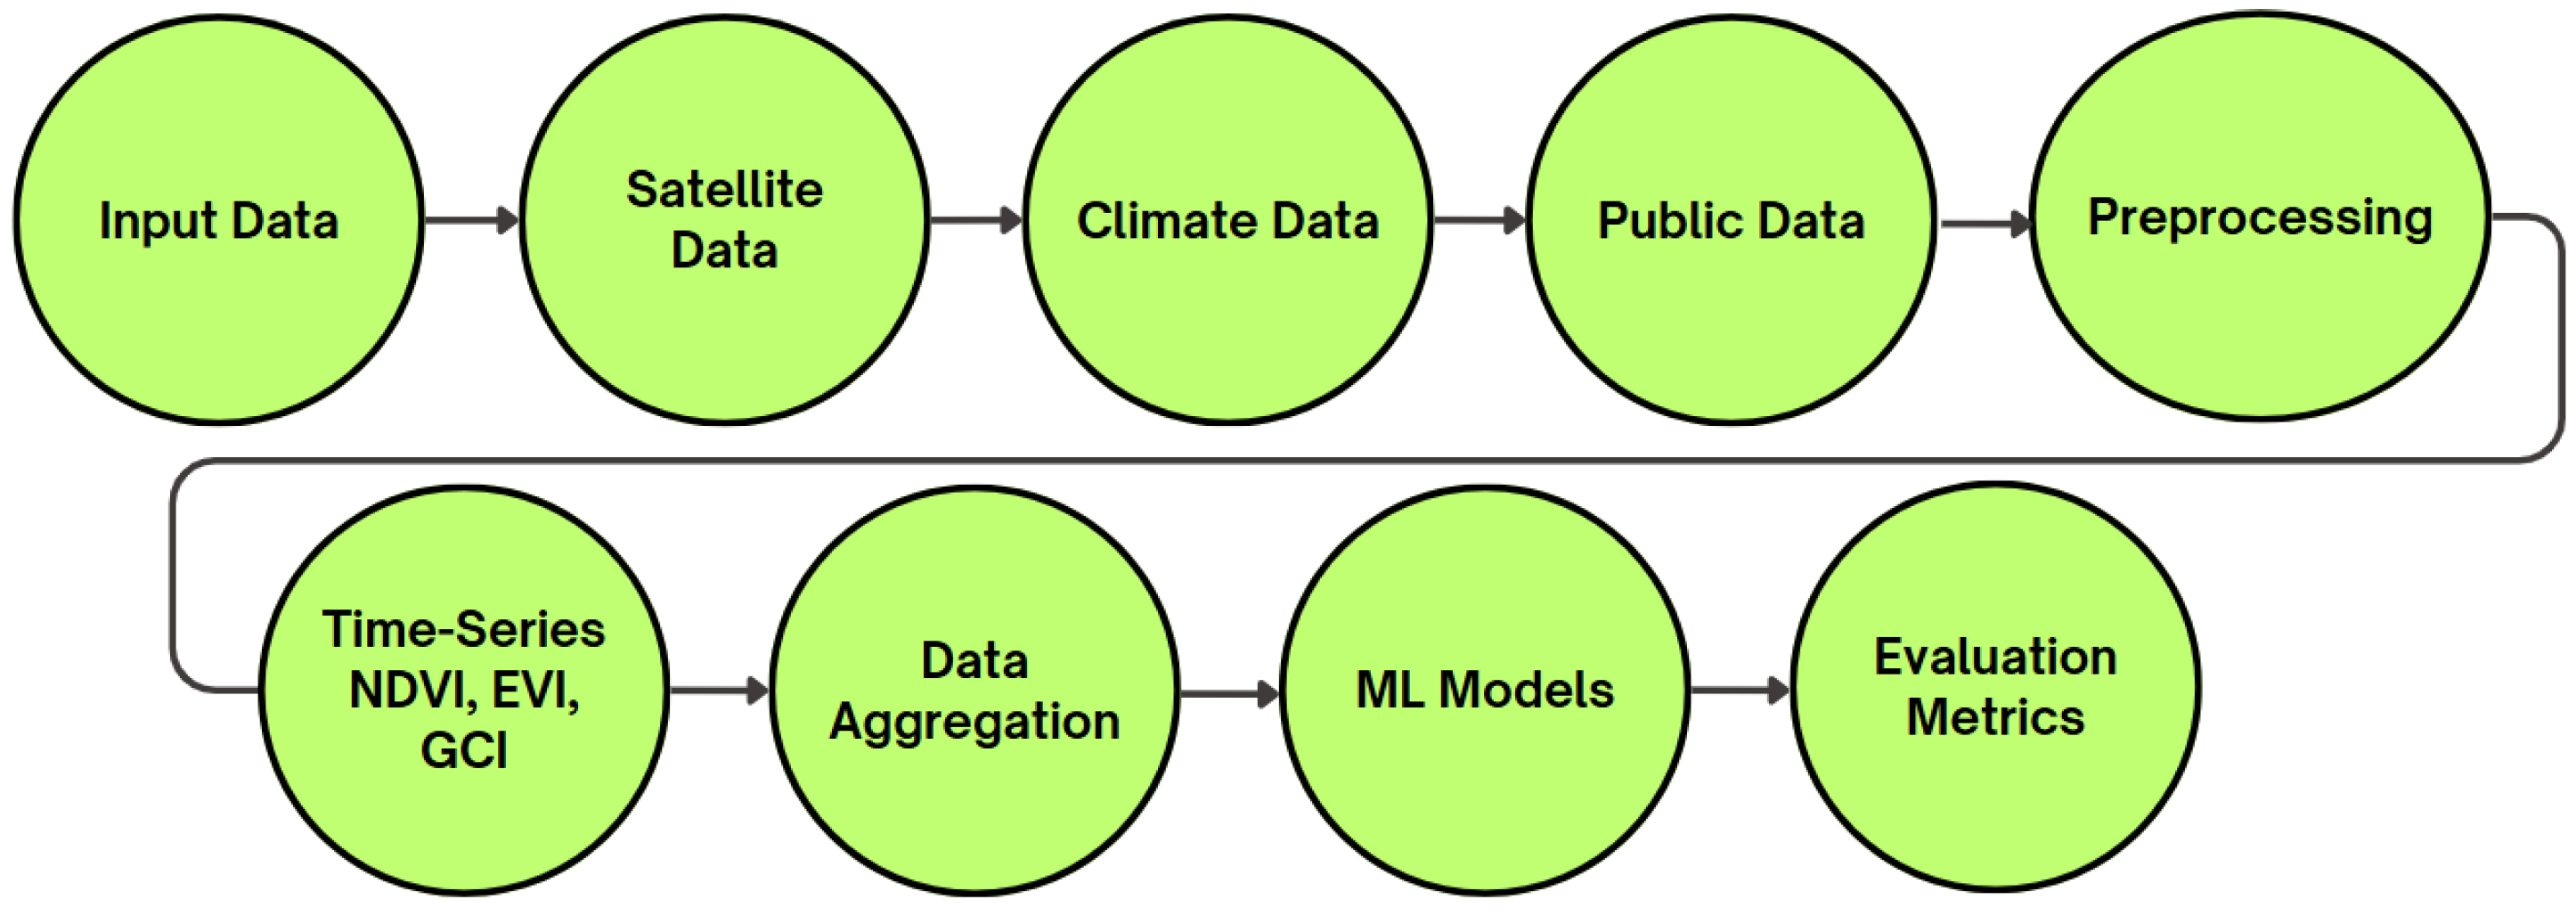
The methodological framework developed in this study integrates multitemporal Sentinel-2 satellite imagery, open public agricultural and climate datasets, and machine learning algorithms for municipal-scale crop yield prediction (
Figure 3). The process consists of four main stages: data acquisition, preprocessing and time-series construction, feature extraction and integration, and model training and evaluation.
A brief overview of the methodological steps is shown in
Figure 3.
4.1. Time-Series Construction
Vegetation indices were calculated for each scene and aggregated by municipality and cluster group. The data were normalized across years using calendar-day alignment to ensure comparability. The final dataset consisted of 15-day time-series profiles for the NDVI, EVI, and GCI for each municipality and cluster for both 2023 and 2024.
4.2. Feature Extraction
For each municipality–year–cluster combination, statistical features were extracted from the vegetation index time-series, including the following:
Climate variables were similarly summarized over the growing season. These were combined with land cover labels and yield records to build the feature set.
4.3. Machine Learning Model
A Random Forest Regressor was trained using the 2023 dataset. The model was evaluated with a test set and subsequently applied to the 2025 features to simulate prediction. Performance metrics included R2 (coefficient of determination), RMSE (Root Mean Square Error), and MAE (Mean Absolute Error).
5. Results
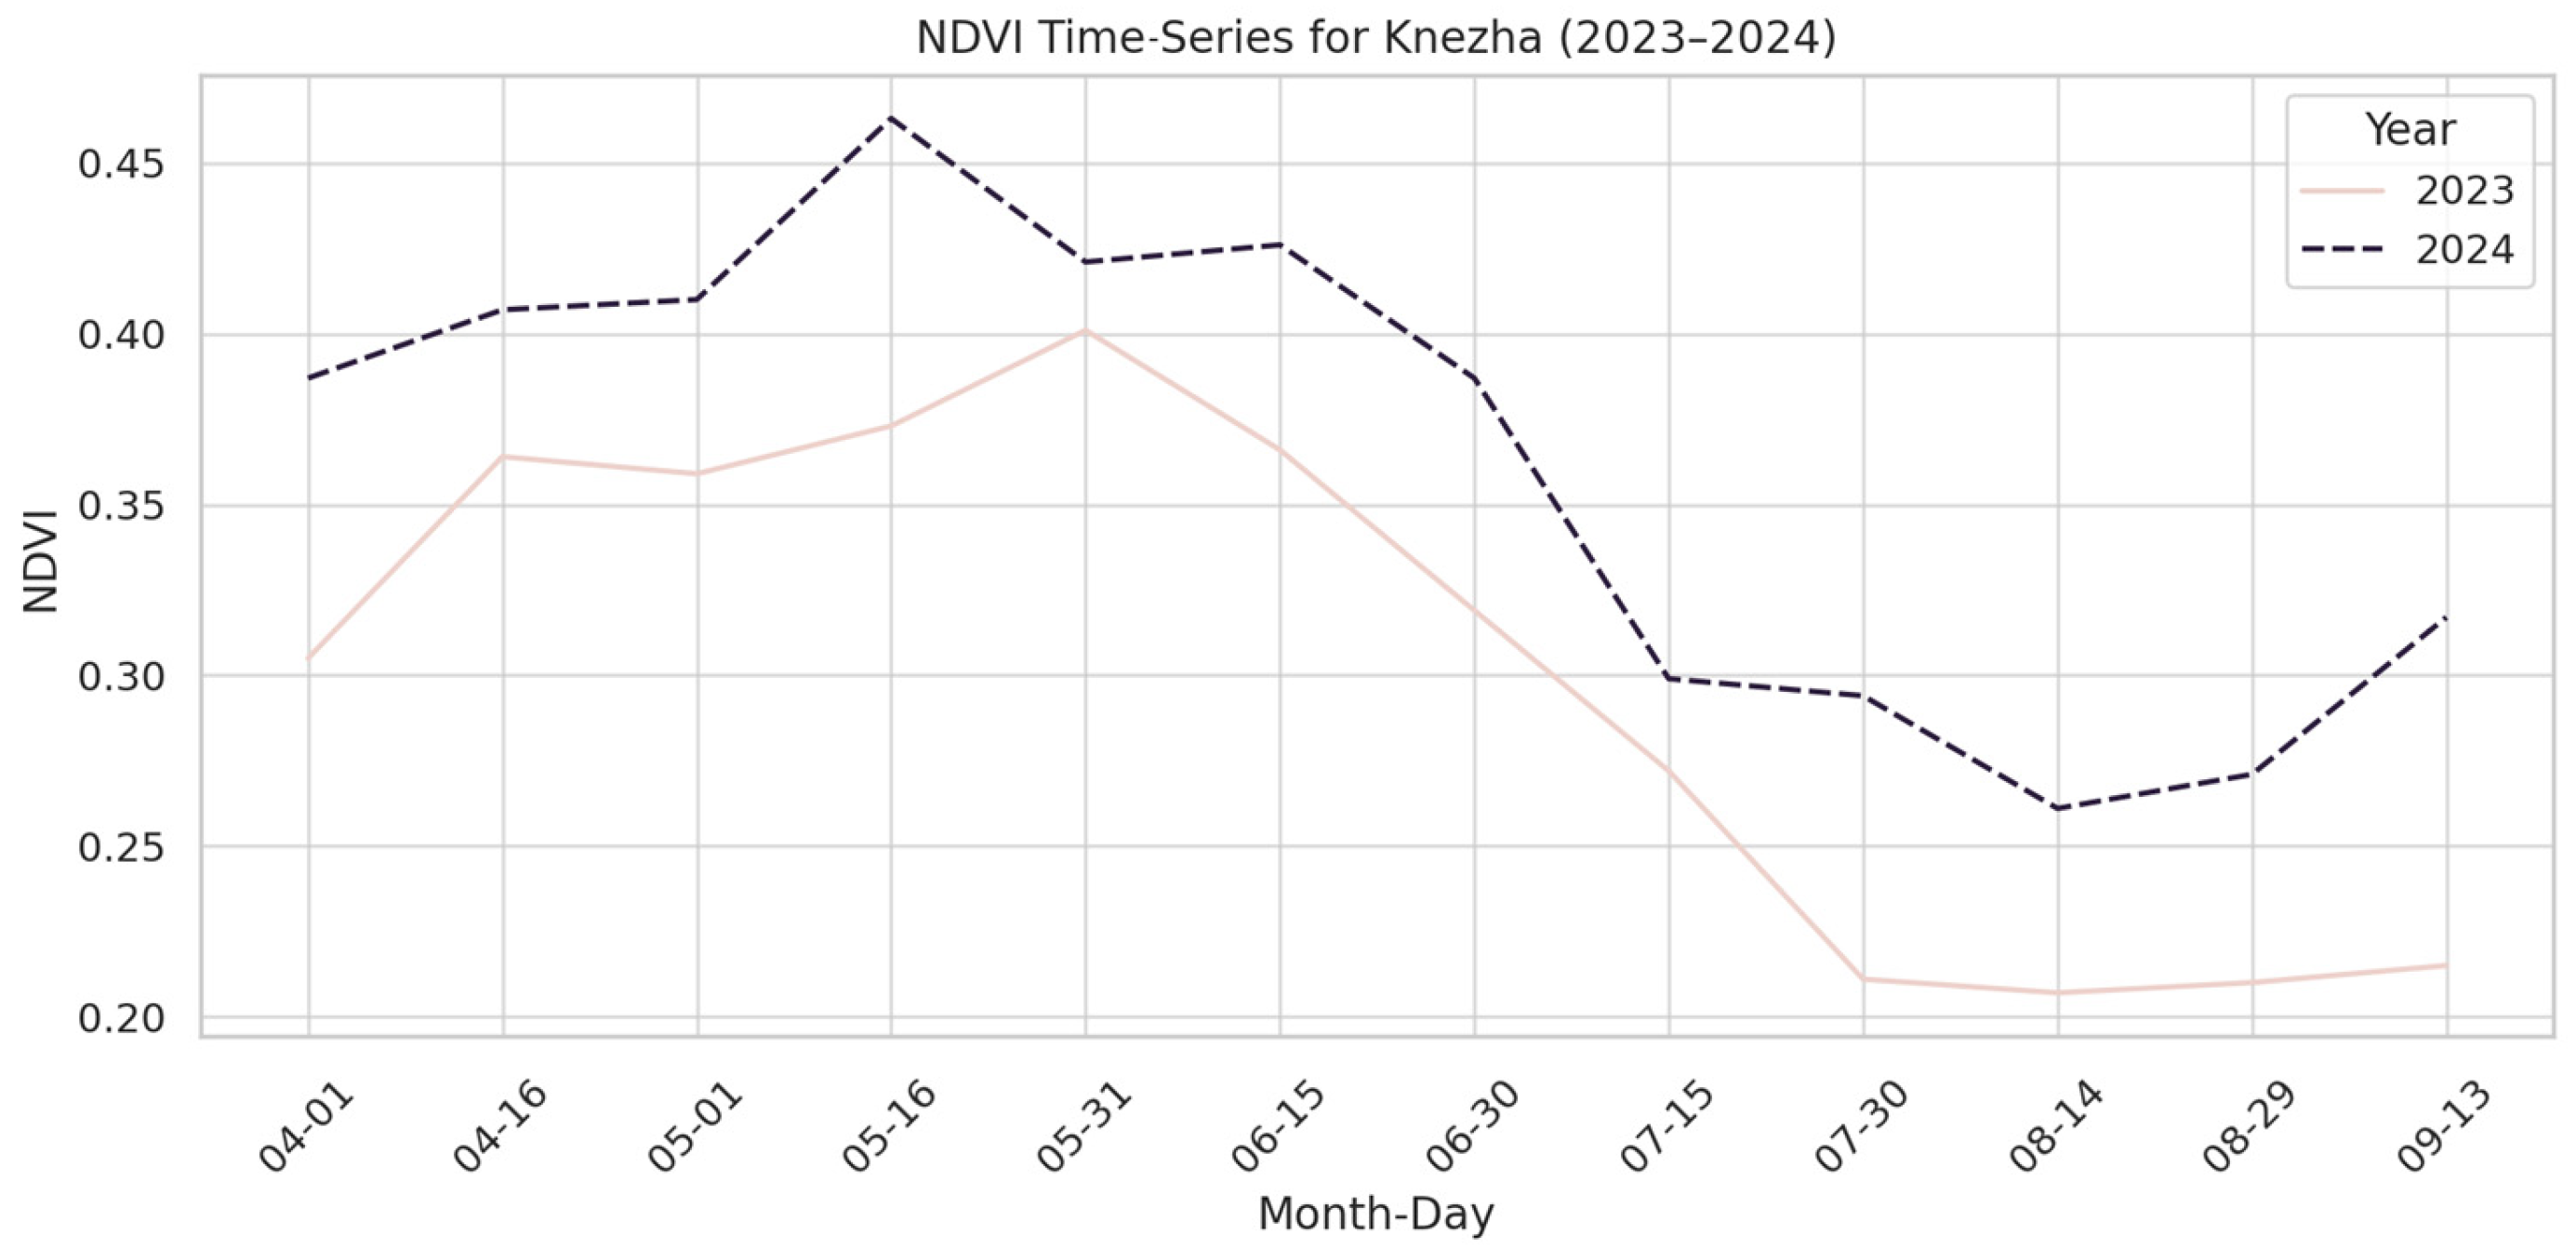
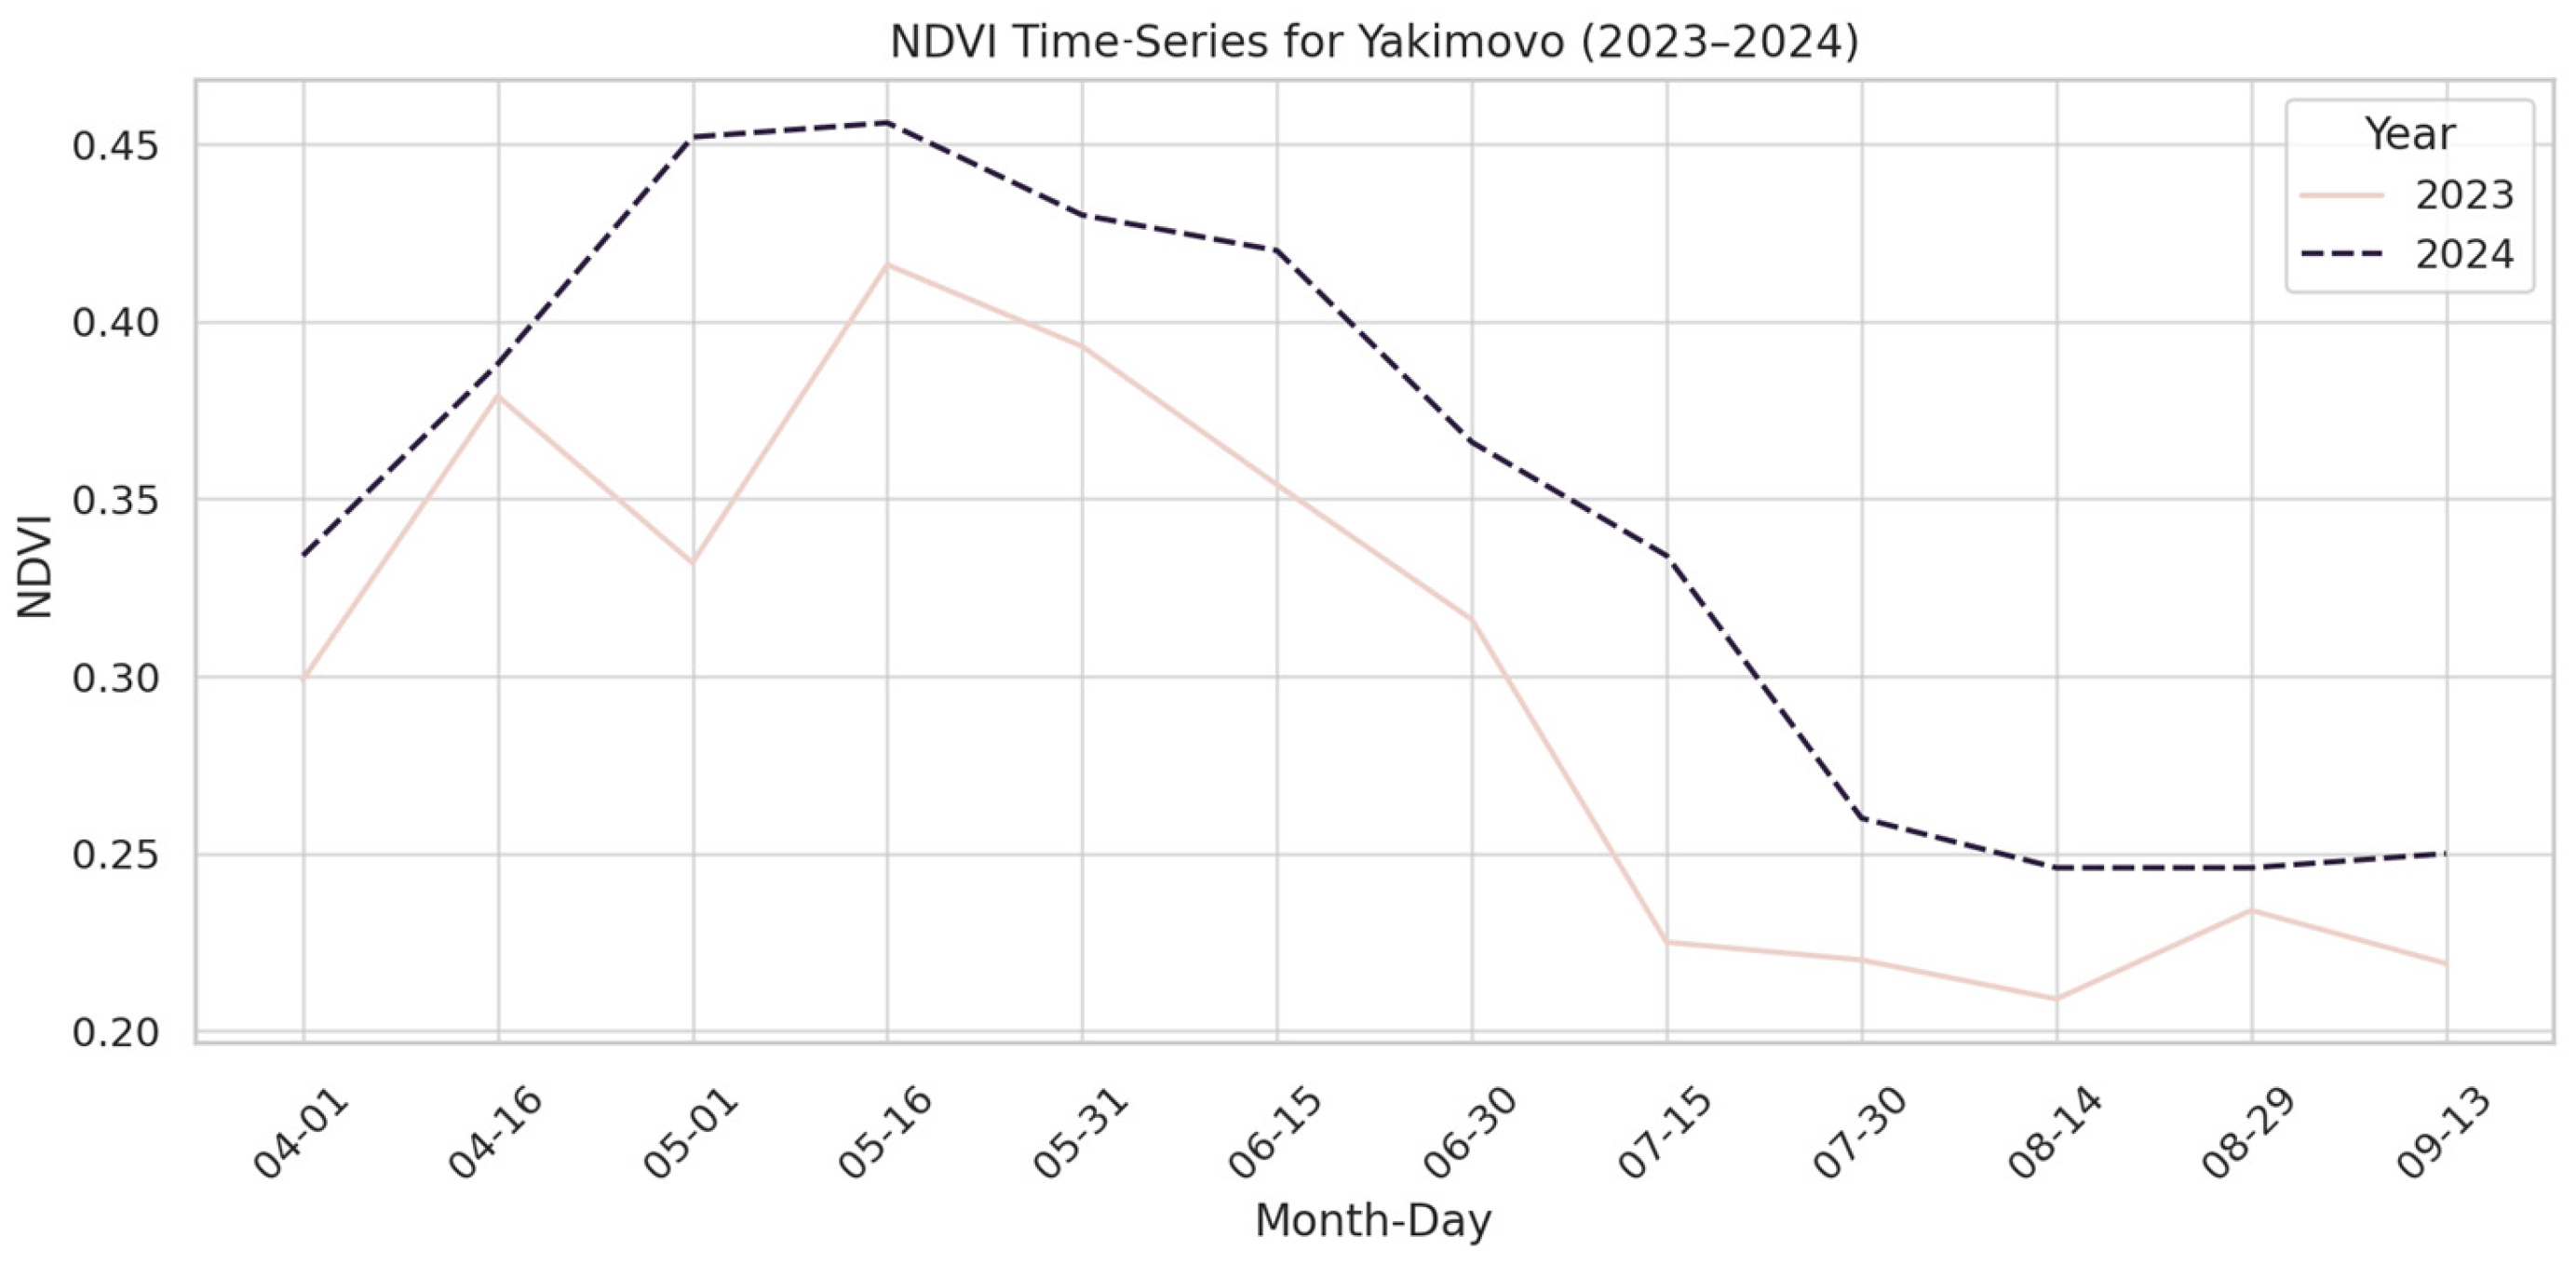
Time-series graphs show strong seasonal signals for the NDVI, EVI, and GCI across all municipalities. Cluster 0 consistently exhibited higher vegetation index values, indicating late-season or high-biomass crops. Cluster 1 showed moderate peaks consistent with early-harvested cereals, while Cluster 2 had the lowest values, indicating sparse or fallow vegetation. Interannual comparisons between 2023 and 2024 revealed variations in the timing and intensity of growth. In general, 2024 exhibited slightly earlier peaks in all indices, possibly due to warmer spring temperatures.
5.1. Vegetation Index Dynamics
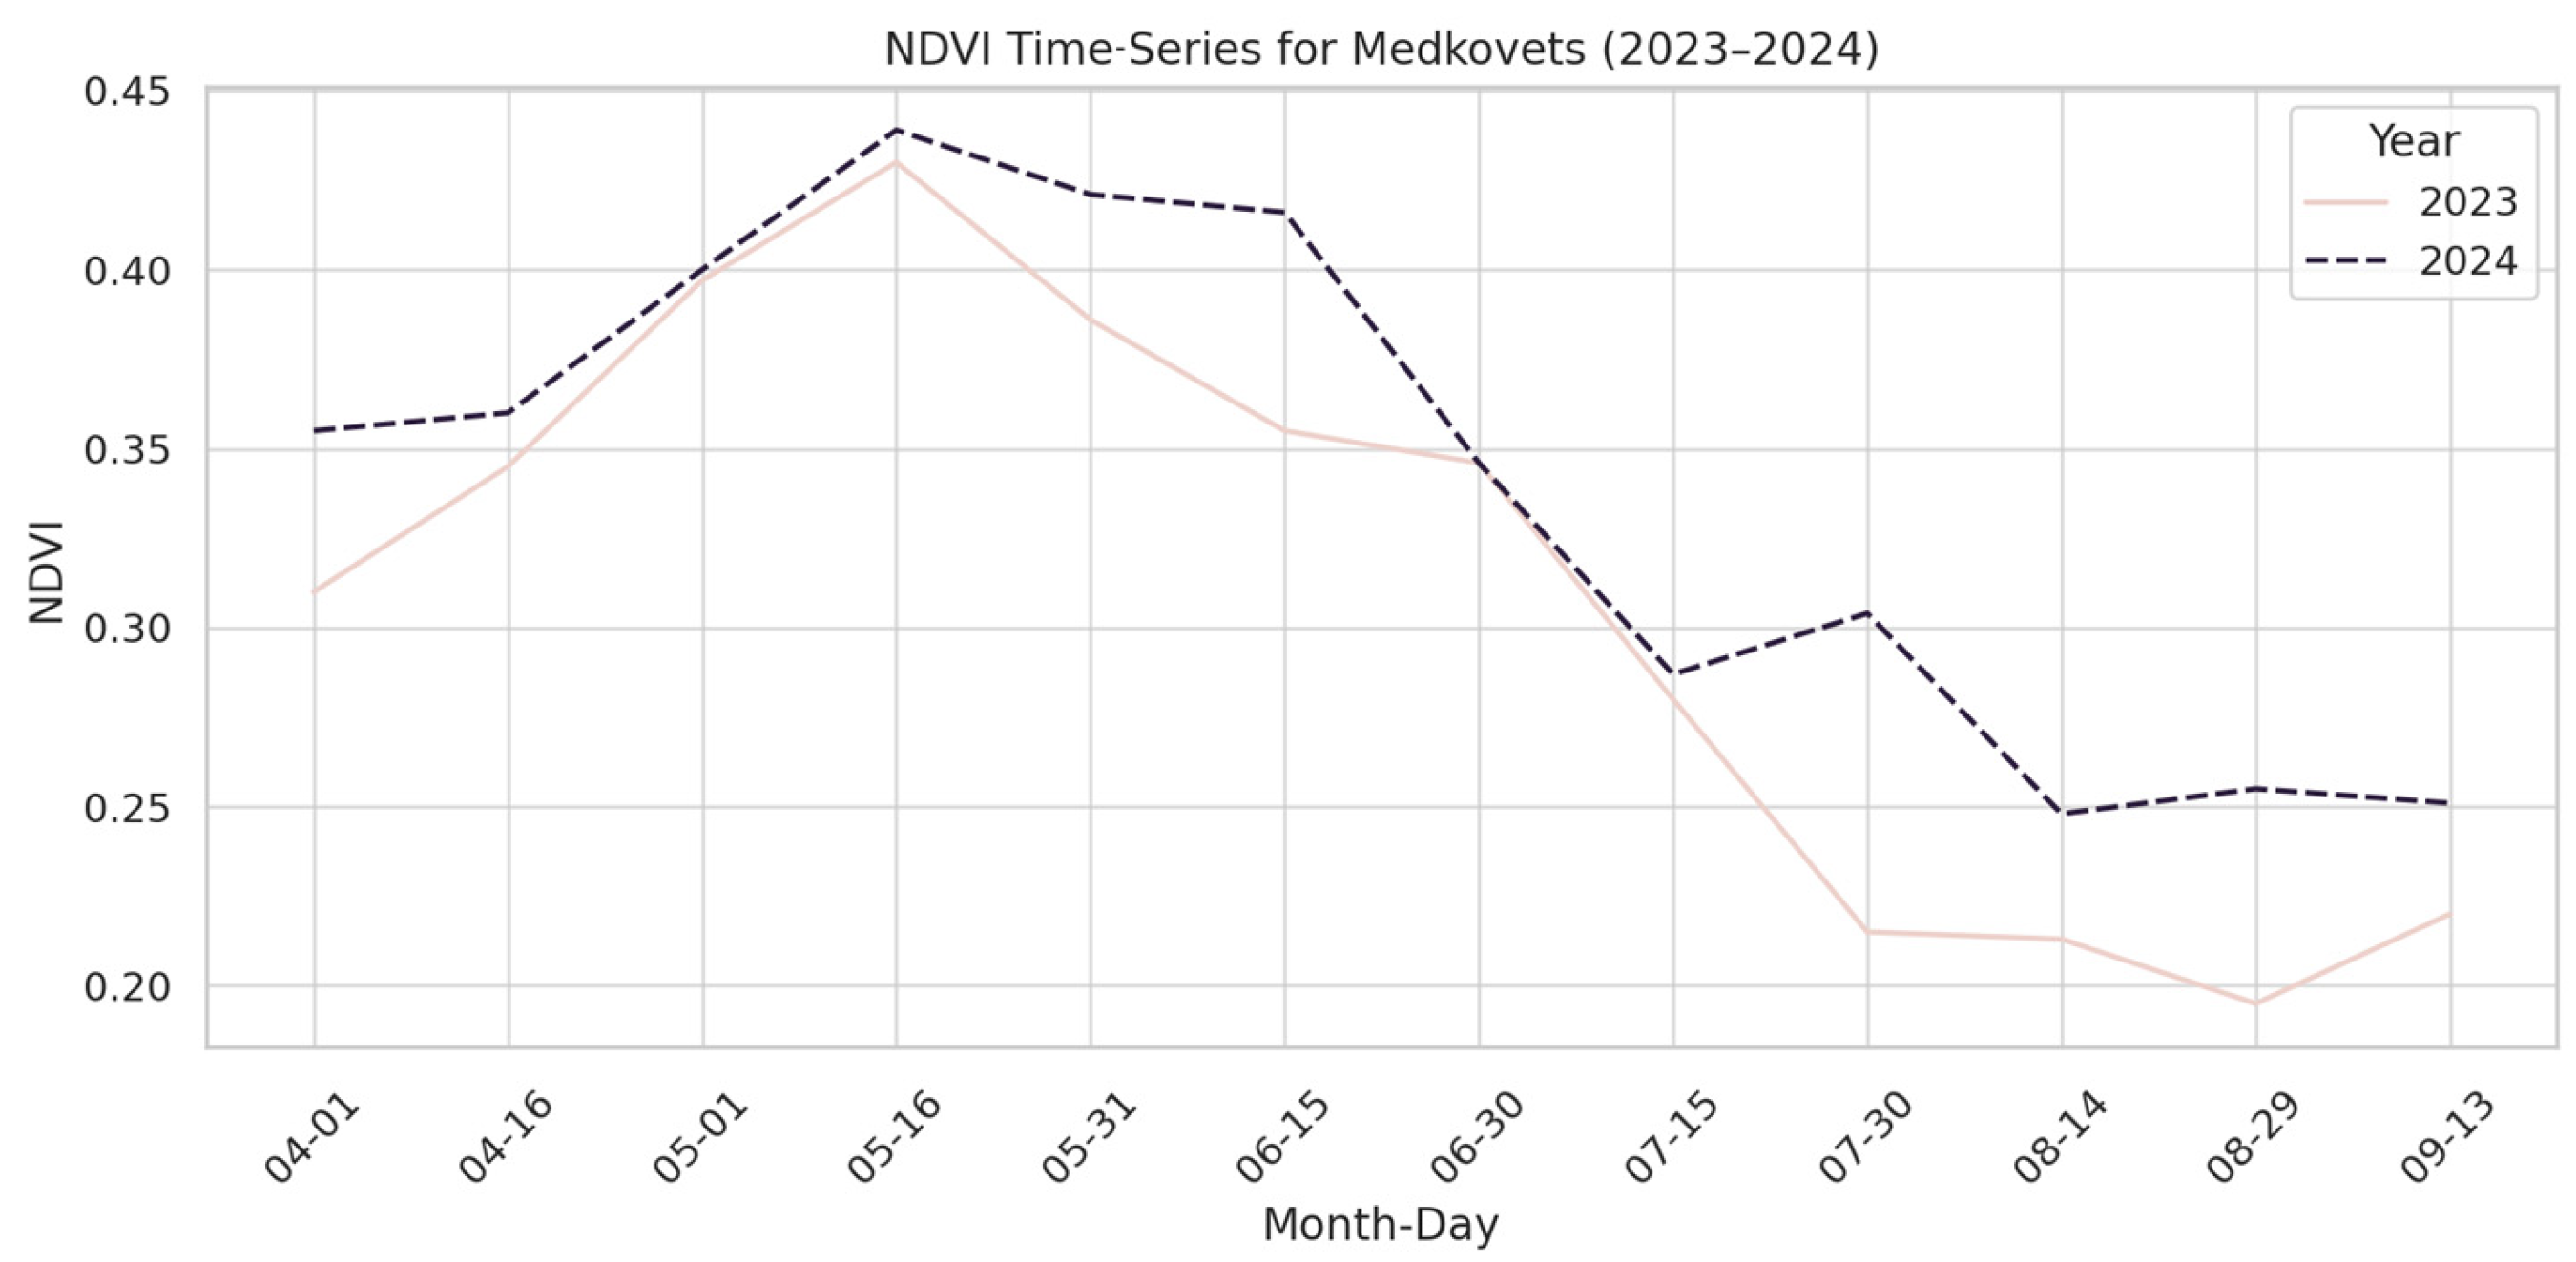
Time-series plots show clear seasonal vegetation patterns. NDVI and EVI values rise from early April, peaking between late May and early July, then declining toward harvest. GCI patterns follow a similar trend but show sharper mid-season peaks, especially in Cluster 0, suggesting dense and chlorophyll-rich vegetation likely associated with high-yield crops.
5.2. Yield Prediction Model
Using the extracted features, a Random Forest model was trained on 2023 and 2024 data and reflects possible 2025 yield prediction.
The model was trained on the results of the time-series created before. A set of features was generated, e.g., the mean NDVI and max. EVI, and then paired with yield values taken from the open public data. The scatterplot in
Figure 7 represents observed versus predicted yield and illustrates the model’s behavior.
Due to the use of a small sample size, the model yielded the following performance metrics:
Preliminary results are the yield prediction model are shown in
Table 2.
Feature importance analysis revealed that the mean EVI and NDVI, along with the maximum GCI, were the most influential predictors. This aligns with agronomic expectations, as these indices correlate with biomass accumulation and chlorophyll content.
6. Discussion and Future Work
The integration of multitemporal Sentinel-2 vegetation indices (NDVI, EVI, and GCI) with publicly available agricultural and climate datasets proved to be a viable approach to predicting crop yields at the municipal scale in Bulgaria. The results confirm previous findings that the NDVI and EVI are sensitive to seasonal vegetation dynamics, while the GCI adds valuable chlorophyll-related information, which is particularly relevant for monitoring nitrogen status and crop vigor.
The Random Forest regression model achieved an R2 of 0.78 and an RMSE of 1.24 t/ha, which is notable given the relatively small training dataset and the aggregation at the municipal level. Feature importance analysis indicated that the mean EVI, mean NDVI, and maximum GCI were the most influential predictors. This aligns with agronomic theory, as high vegetation greenness and chlorophyll concentration during the peak growing period are strongly correlated with biomass accumulation and yield.
Nonetheless, several limitations need to be acknowledged. First, the use of municipal-level yield statistics rather than field-level measurements introduces aggregation bias, potentially masking municipal variability. Second, the lack of explicit crop-type information means that the model predicts aggregated yields, which may dilute accuracy for individual crops. Third, while Sentinel-2 offers valuable spectral and temporal resolution, cloud cover remains a challenge during critical growth stages, suggesting the benefit of integrating Sentinel-1 SAR data for all-weather monitoring
The authors are currently expanding their research. Future work should include the following:
Expansion to additional municipalities and multiple crop types.
Use of real, field-level yield data from the State Agricultural Fund or farmer records.
Incorporation of Sentinel-1 SAR data to improve monitoring under cloud cover.
Application of other machine learning methods such as XGBoost or ReBoost.
Integration of phenological stage detection to improve temporal feature selection.
Such developments would enhance the robustness and scalability of the model, supporting broader adoption in national agricultural monitoring systems.
7. Conclusions
This study presents a robust methodology for predicting crop yields using Sentinel-2 satellite time-series data and open public datasets. The case study of Medkovets, Yakimovo, and Knezha demonstrates the capacity of the NDVI, EVI, and GCI to capture spatial and temporal differences in crop growth. While the current results are based on two-year yields, the framework offers strong potential for real-world applications with the inclusion of ground-truth data and expanded spatial coverage.
Supplementary Materials
The following supporting information can be downloaded at:
https://www.mdpi.com/article/10.3390/engproc2025094026/s1, Figure S1. (a) Orthophoto with overlapped arable parcels–Knezha, Bulgaria (b) arable parcels and crop code according to the Bulgarian State Agricultural Fund; Figure S2. (a) Orthophoto with overlapped arable parcels—Knezha, Bulgaria (b) arable parcels and crop code according to the Bulgarian State Agricultural Fund; Figure S3. EVI Time-Series for the municipality of Medkovets, Bulgaria (2023–2024); Figure S4. EVI Time-Series for the municipality of Yakimovo, Bulgaria (2023–2024); Figure S5. EVI Time-Series for the municipality of Knezha, Bulgaria (2023–2024); Figure S6. GCI Time-Series for the municipality of Medkovets, Bulgaria (2023–2024); Figure S7. GCI Time-Series for the municipality of Yakimovo, Bulgaria (2023–2024); Figure S8. GCI Time-Series for the municipality of Knezha, Bulgaria (2023–2024).
Author Contributions
Conceptualization, P.R. and D.F.; methodology, P.R. and P.M.; software, P.R.; validation, P.R., P.M. and D.F.; formal analysis, D.F.; investigation, P.R.; resources, P.R.; data curation, P.R.; writing—original draft preparation, P.R.; writing—review and editing, P.R.; visualization, P.R.; supervision, P.M.; project administration, P.M.; funding acquisition, P.R. All authors have read and agreed to the published version of the manuscript.
Funding
This research was funded by the program “Млади учени и пoстдoктoранти—2” managed by the Bulgarian Ministry of Education and Science and received by Paulina Raeva through the University of Architecture, Civil Engineering and Geodesy, Sofia, Bulgaria.
Institutional Review Board Statement
Not applicable.
Informed Consent Statement
Not applicable.
Data Availability Statement
Data is contained within the article.
Acknowledgments
This research is part of the PostDoc program of the corresponding author—Paulina Raeva. This study was supported by the program ”Млади учени и пoстдoктoранти—2” managed by the Bulgarian Ministry of Education and Science. PostDoc research was under the guidance of Plamen Maldjanski and was carried out at the Department of Photogrammetry and Cartography, Faculty of Geodesy, University of Architecture, Civil Engineering and Geodesy, Bulgaria.
Conflicts of Interest
No conflict of interest is declared.
References
- National Statistical Institute. Available online: https://www.nsi.bg/en (accessed on 31 May 2025).
- State Agricultural Fund (SAF). Declared Agricultural Land Areas—Geospatial Dataset; Sofia, Bulgaria. 2025. Available online: https://www.dfz.bg (accessed on 31 May 2025).
- Zhou, Q.; Ismaeel, A. Integration of maximum crop response with machine learning regression model to timely estimate crop yield. Geo-Spat. Inf. Sci. 2021, 24, 474–483. [Google Scholar] [CrossRef]
- Pang, A.; Chang, M.W.L.; Chen, Y. Evaluation of Random Forests (RF) for Regional and Local-Scale Wheat Yield Prediction in Southeast Australia. Sensors 2022, 22, 717. [Google Scholar] [CrossRef] [PubMed]
- Bojinov, B.; Ivanov, B.; Vasileva, S. Current state and usage limitations of vegetation indices in precision agriculture. Bulgarian J. Agric. Sci. 2022, 28, 387–394. [Google Scholar]
- Kebede, E.; Vasileva, S.; Ivanov, B.; Dengiz, O.; Bojinov, B. Optimizing data collection in precision agriculture–comparing remote sensing and in situ analyses. Bulg. J. Agric. Sci. 2022, 30, 11–16. [Google Scholar]
- Ali, A.M.; Abouelghar, M.; Belal, A.; Saleh, N.; Yones, M.; Selim, A.I.; Amin, M.E.; Elwesemy, A.; Kucher, D.E.; Maginan, S.; et al. Crop Yield Prediction Using Multi Sensors Remote Sensing (Review Article). Egypt. J. Remote. Sens. Space Sci. 2022, 25, 711–716. [Google Scholar] [CrossRef]
- Joshi, A.; Pradhan, B.; Gite, S.; Chakraborty, S. Remote-Sensing Data and Deep-Learning Techniques in Crop Mapping and Yield Prediction: A Systematic Review. Remote Sens. 2023, 15, 2014. [Google Scholar] [CrossRef]
- Muruganantham, P.; Wibowo, S.; Grandhi, S.; Samrat, N.H.; Islam, N. A Systematic Literature Review on Crop Yield Prediction with Deep Learning and Remote Sensing. Remote Sens. 2022, 14, 1990. [Google Scholar] [CrossRef]
- Eltazarov, S.; Bobojonov, I.; Kuhn, L.; Glauben, T. The role of crop classification in detecting wheat yield variation for index-based agricultural insurance in arid and semiarid environments. Environ. Sustain. Indic. 2023, 18, 100250. [Google Scholar] [CrossRef]
- Kamenova, I.; Stoyanova, M.; Dimitrov, P. Sentinel-2 based crop type mapping and yield estimation for winter wheat in the Upper Thracian Lowland, Bulgaria. Remote Sens. Appl. Soc. Environ. 2024, 36, 101094. [Google Scholar]
- Chanev, M.; Yordanov, G.; Koleva, E. High-resolution Sentinel-2 Deep Resolution 3.0 imagery for organic barley mapping and yield analysis. J. Appl. Remote Sens. 2025, 19, 026503. [Google Scholar] [CrossRef]
- Delcheva, E. Efficient Farming and Technological Solutions in the Agricultural Sector in Bulgaria. Trakia J. Sci. 2023, 21, 208–212. [Google Scholar] [CrossRef]
- Zheleva, V.; Delcheva, E. Digitalization of Agriculture in Bulgaria. 2023. Available online: https://www.researchgate.net/publication/372788711_DIGITALIZATION_OF_AGRICULTURE_IN_BULGARIA (accessed on 31 May 2025).
- SNAP–ESA Sentinel Application Platform; European Space Agency: [2025]. Available online: http://step.esa.int (accessed on 31 May 2025).
- Python Software Foundation. Python Language Reference, Version 3.11; Python Software Foundation: Wilmington, DE, USA, 2023; Available online: https://www.python.org/ (accessed on 31 May 2025).
- GDAL/OGR Contributors. GDAL/OGR Geospatial Data Abstraction Software Library, Open Source Geospatial Foundation. 2025. Available online: https://gdal.org (accessed on 31 May 2025).
- Gillies, S. Rasterio: Geospatial Raster I/O for Python. 2025. Available online: https://rasterio.readthedocs.io (accessed on 31 May 2025).
- Jordahl, K. GeoPandas: Python Tools for Geographic Data. Version 0.10.2. Zenodo. 2020. Available online: https://geopandas.org (accessed on 31 May 2025).
- Hunter, J.D. Matplotlib: A 2D Graphics Environment. Comput. Sci. Eng. 2007, 9, 90–95. [Google Scholar] [CrossRef]
- National Institute of Meteorology and Hydrology (NIMH). Official Website; Sofia, Bulgaria. 2025. Available online: https://meteo.bg (accessed on 31 May 2025).
- Haboudane, D.; Miller, J.R.; Tremblay, N.; Zarco-Tejada, P.J.; Dextraze, L. Integrated narrow-band vegetation indices for prediction of crop chlorophyll content for application to precision agriculture. Remote Sens. Environ. 2002, 81, 416–426. [Google Scholar] [CrossRef]
- Franch, B.; Vermote, E.; Becker-Reshef, I.; Claverie, M.; Huang, J.; Zhang, J.; Justice, C. Improving agricultural yield prediction at field to global scales with vegetation indices from satellite data. Remote Sens. Environ. 2023, 295, 113650. [Google Scholar] [CrossRef]
- Nguyen, H.T.; Johansen, K.; Strong, W.M.; Banks, J.C.; de Bie, C.A.J.M. Sentinel-2 derived chlorophyll indices for monitoring cereal crop development and yield estimation. Comput. Electron. Agric. 2024, 215, 108579. [Google Scholar]
| Disclaimer/Publisher’s Note: The statements, opinions and data contained in all publications are solely those of the individual author(s) and contributor(s) and not of MDPI and/or the editor(s). MDPI and/or the editor(s) disclaim responsibility for any injury to people or property resulting from any ideas, methods, instructions or products referred to in the content. |
© 2025 by the authors. Licensee MDPI, Basel, Switzerland. This article is an open access article distributed under the terms and conditions of the Creative Commons Attribution (CC BY) license (https://creativecommons.org/licenses/by/4.0/).
