1. Introduction
Driven by the advancement of satellite and aerial sensing technologies and the open access nature of their data, most remote sensing studies utilize imagery from optical, hyperspectral, or Synthetic Aperture Radar (SAR) sources acquired from airborne or spaceborne platforms. The operational capabilities of SAR sensors to acquire high-quality data day and night and through clouds and rain makes them crucial in the development of remote sensing activities [
1,
2,
3]. However, the electromagnetic (EM) interactions between the emitted EM wave and the scene of interest are complex and involve different scattering phenomena. In particular, for a scene of interest with complex objects present on a rough soil, a composite scattering field between the object and the soil occurs. It consists mainly of multiple reflections between the different elements of the scene that create distortions on the SAR image like defocus and ghost target signatures [
4,
5]. These distortions affect the effectiveness of SAR image processing. Therefore, the development of raw SAR signal simulators are needed to investigate these EM phenomena and their effects on SAR images of a complex scene of interest. Several works have been published on the SAR image simulation of complex targets, including multiple scattering [
6,
7,
8]. However, there is still room for improvement in integrating the target into its environment and the consideration of all the elements of the radar acquisition chain.
This article aims to present a methodology for modelling the raw SAR signals and the SAR images of a complex scene of interest that allows us to investigate the composite scattering between the target and the environment. With this prospect, the entire radar acquisition chain is considered: the sensor parameters, the atmospheric attenuation, the modelling of the EM interactions between the radar wave and the scene of interest, the SAR image formation, and its analysis.
First, scene modelling and SAR signal processing will be derived in
Section 2, before presenting the simulation results of the SAR images for a scene of interest with rough dielectric soil and a target considered as a Perfect Electric Conductor (PEC) in
Section 3. Finally, a discussion on the simulation results and future work will be presented in
Section 4.
2. Scene Modelling and SAR Signal Processing
The scene of interest is considered to be deterministic and static during the acquisition process and is meshed with triangular facets. The presence of the target on rough soil creates a shadow on the soil. The shaded facets are determined using the ray–triangle intersection test proposed by Möller and Trumbore [
9].
2.1. Radar Cross Section (RCS)
The electromagnetic interactions between the incident wave and the scene are represented through the Radar Cross Section (RCS) of each illuminated discretised element. In our study, we consider the Ku frequency band, so the size of the elements of the scene are much larger than the wavelength. Thus, EM high-frequency asymptotic approximations are suitable in this case [
10]. For the direct reflection, the Physical Optics (PO) method consists of integrating the induced currents on the surface of the illuminated planar facets. Its validity domain for the rough surface is [
11]
where
is the size of the surface,
is its statistical curvature radius,
is the standard deviation of the height, and
is the isotropic correlation length.
Diffraction contributions from the edges of the target are taken into account in the computation and are computed using the Method of Equivalent Currents (MEC) with the coefficients derived by Michaeli [
12]. Finally, to handle multiple reflections on the target itself or between the different elements of the scene, a combination between Geometrical Optics (GO) and PO is performed [
13]. For the successive reflections, the Fresnel law of reflection is used to compute the reflected field in the specular direction, and the PO approximation is used at the last reflection for computing the scattered field in the direction of the sensor.
2.2. Raw SAR Signals
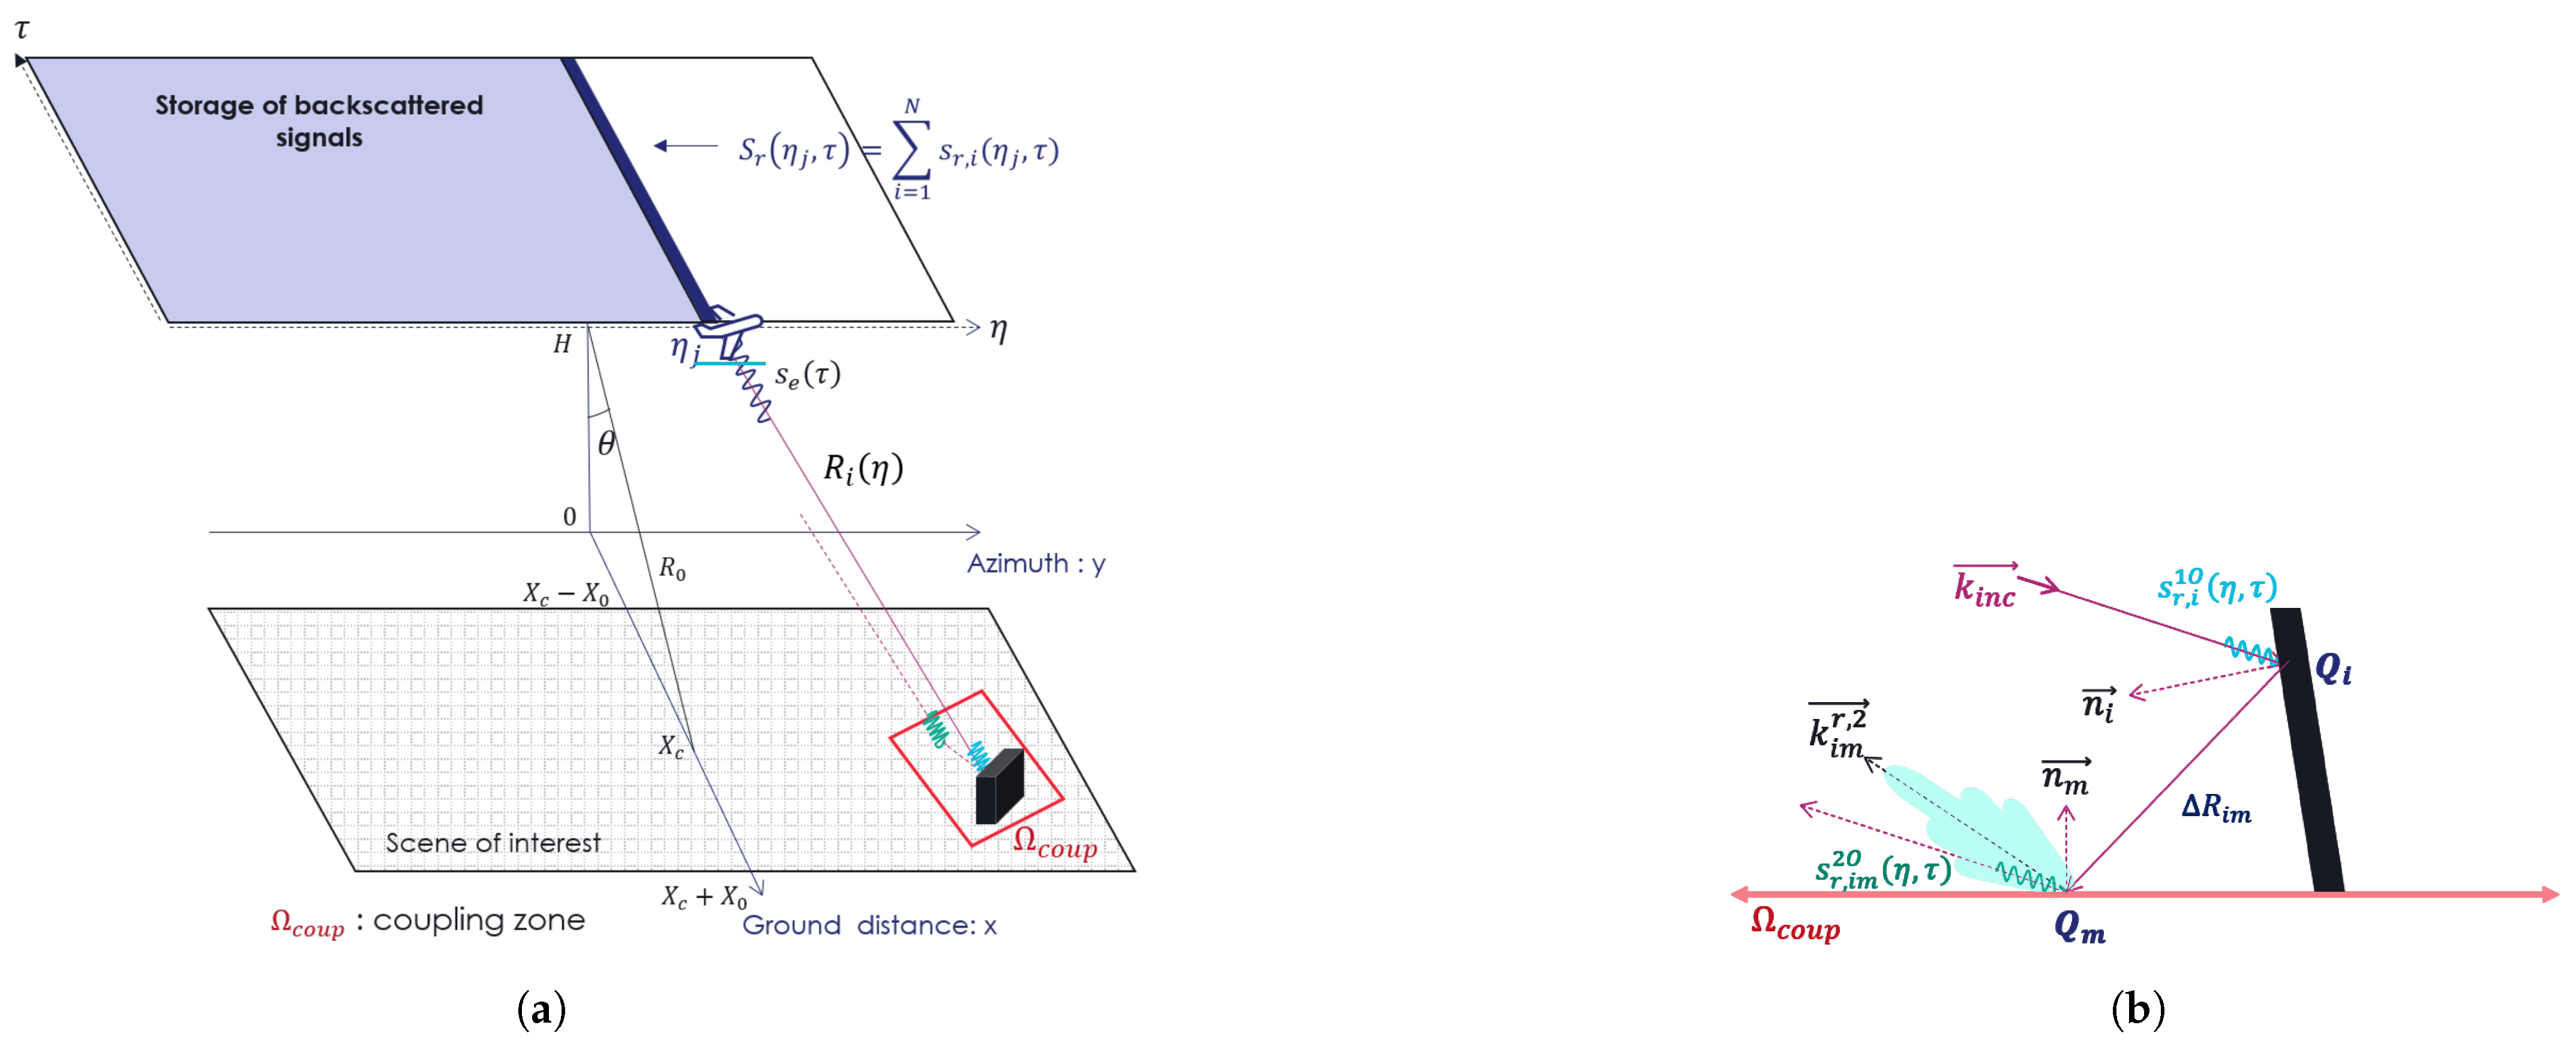
To model the raw SAR signals, the sensor is considered to have a uniform rectilinear motion along the azimuth axis as presented in
Figure 1a. The sensor periodically emits a linear-frequency-modulated signal, also called a chirp,
:
where
is the fast time,
the amplitude modulation,
the carrier frequency,
the chirp rate,
B the bandwidth of the signal, and
the chirp duration.
The chirp signal is transmitted at a Pulse Repetition Frequency (PRF) that defines the sampling rate along the slow-time axis .
Considering a discretisation
i of the scene of interest, when illuminated by the incident EM field, a portion of the energy of the emitted signal is reflected toward the sensor as illustrated in
Figure 1b. The resulting signal is named
. As explained in
Section 2.1, the combination of GO and PO allows us to consider multiple reflections. Here, the signal scattered toward the sensor after two successive reflections is
. Therefore, the backscattered signal at the interaction with the discretisation
i of the scene of interest is
with
indicating whether the discretisation
m is illuminated by the field reflected on the discretisation
i.
The signal due to the direct reflection and diffraction can be expressed after demodulation by
with the following observations:
is the projected azimuth beam pattern. The angle is the angle between the principal direction of the antenna illumination and the direction between the sensor and the discretisation.
is the amplitude factor computed from the radar equation. It involves the characteristics of the antenna like the gain G and the emitted power , as well as a loss factor , where the loss of the atmospheric propagation can be included. There is also the RCS of the discretisation computed here using the PO and the MEC.
is the distance between the sensor and the centre of the discretisation, where is the sensor velocity, H is the altitude, and is the acquisition time.
Using the ITU-R recommendations, atmospheric attenuation due to atmospheric gases [
14], as well as the presence of clouds, fog [
15] and rain [
16] can be calculated and integrated in the loss factor
L, with
, where
are the attenuation factors in dB/km, computed using each of the ITU-R recommendations.
For the backscattered signal after two successive reflections on the facets
i and
m, the reasoning is very similar. We indeed have
with
, where the RCS is computed using the GO-PO combination and
is the distance between the two discretisations
i and
m.
2.3. SAR Image Formation
Signal processing techniques must be applied on the modelled raw SAR signals to focus the energy of the signals in both range and azimuth directions. Depending on the acquisition mode, the modulation of the emitted signal, and the trade-off between accuracy and algorithmic complexity, different signal processing techniques have been proposed in the literature [
2,
17]. In this work, we focus on a linear-frequency-modulated (LFM) signal, the stripmap, and spotlight acquisition modes with a negligible squint angle (low time of acquisition). Regarding these characteristics, we selected the Range-Doppler Algorithm (RDA) that consists of three successive steps: range compression, range cell migration correction and azimuthal compression.
The range compression performed by a matched filter gives a theoretical resolution in the range of
[
2]. For the azimuth direction, the matched filter gives a temporal resolution of
, giving an azimuth resolution of
, where
is the slow-time Doppler bandwidth that depends on the SAR acquisition mode. For a negligible squint angle, the Doppler frequency is
. For stripmap acquisition, the illumination time of a scatterer is
, which gives a Doppler bandwidth of
, and therefore,
.
3. Results
To illustrate the potential use of the presented methodology, simulations have been performed on a scene of interest with rough dielectric soil and a PEC target.
3.1. SAR Parameters and Scene of Interest
The simulations are conducted in the Ku frequency band at 14 GHz with horizontal polarisation at both the emission and the reception. All the other parameters are listed in
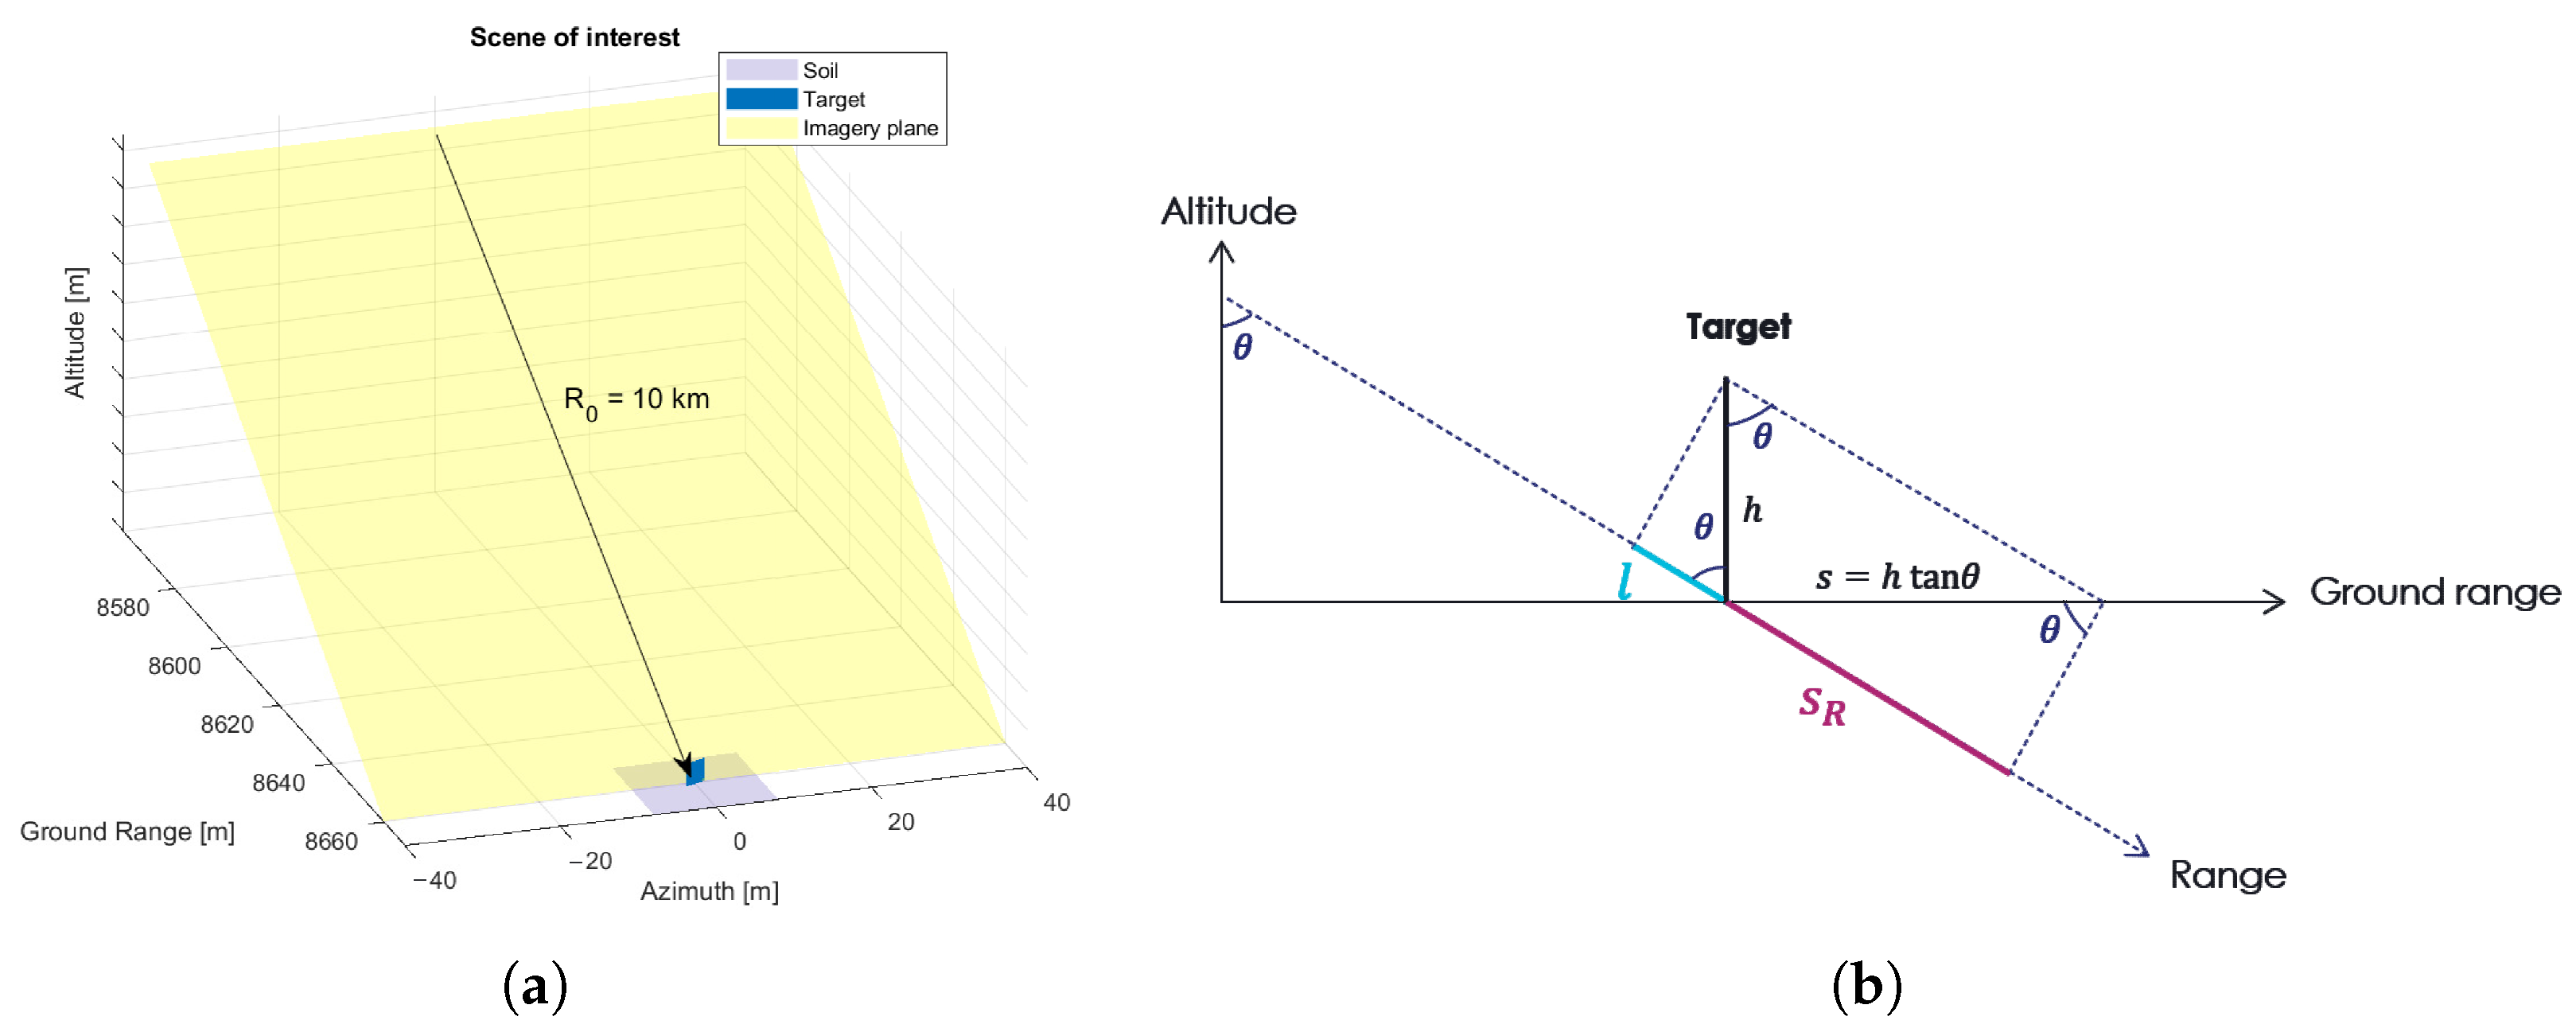
Table 1. The theoretical resolution is 0.5 m in both range and azimuth directions. The scene of interest is presented in
Figure 2a. On the rough dielectric soil (
), a vertical square plate of 9
is rotated by an angle
around the altitude axis. The soil is generated with a Gaussian spectrum with a height standard deviation of
mm and a length correlation of
cm. These statistical values constitute the surface in the validity domain of the PO approximation stated in Equation (
1). The relative complex permittivity is
. These values have been chosen to approximate the behaviour of grass-covered soil [
18].
3.2. Simulated SAR Images
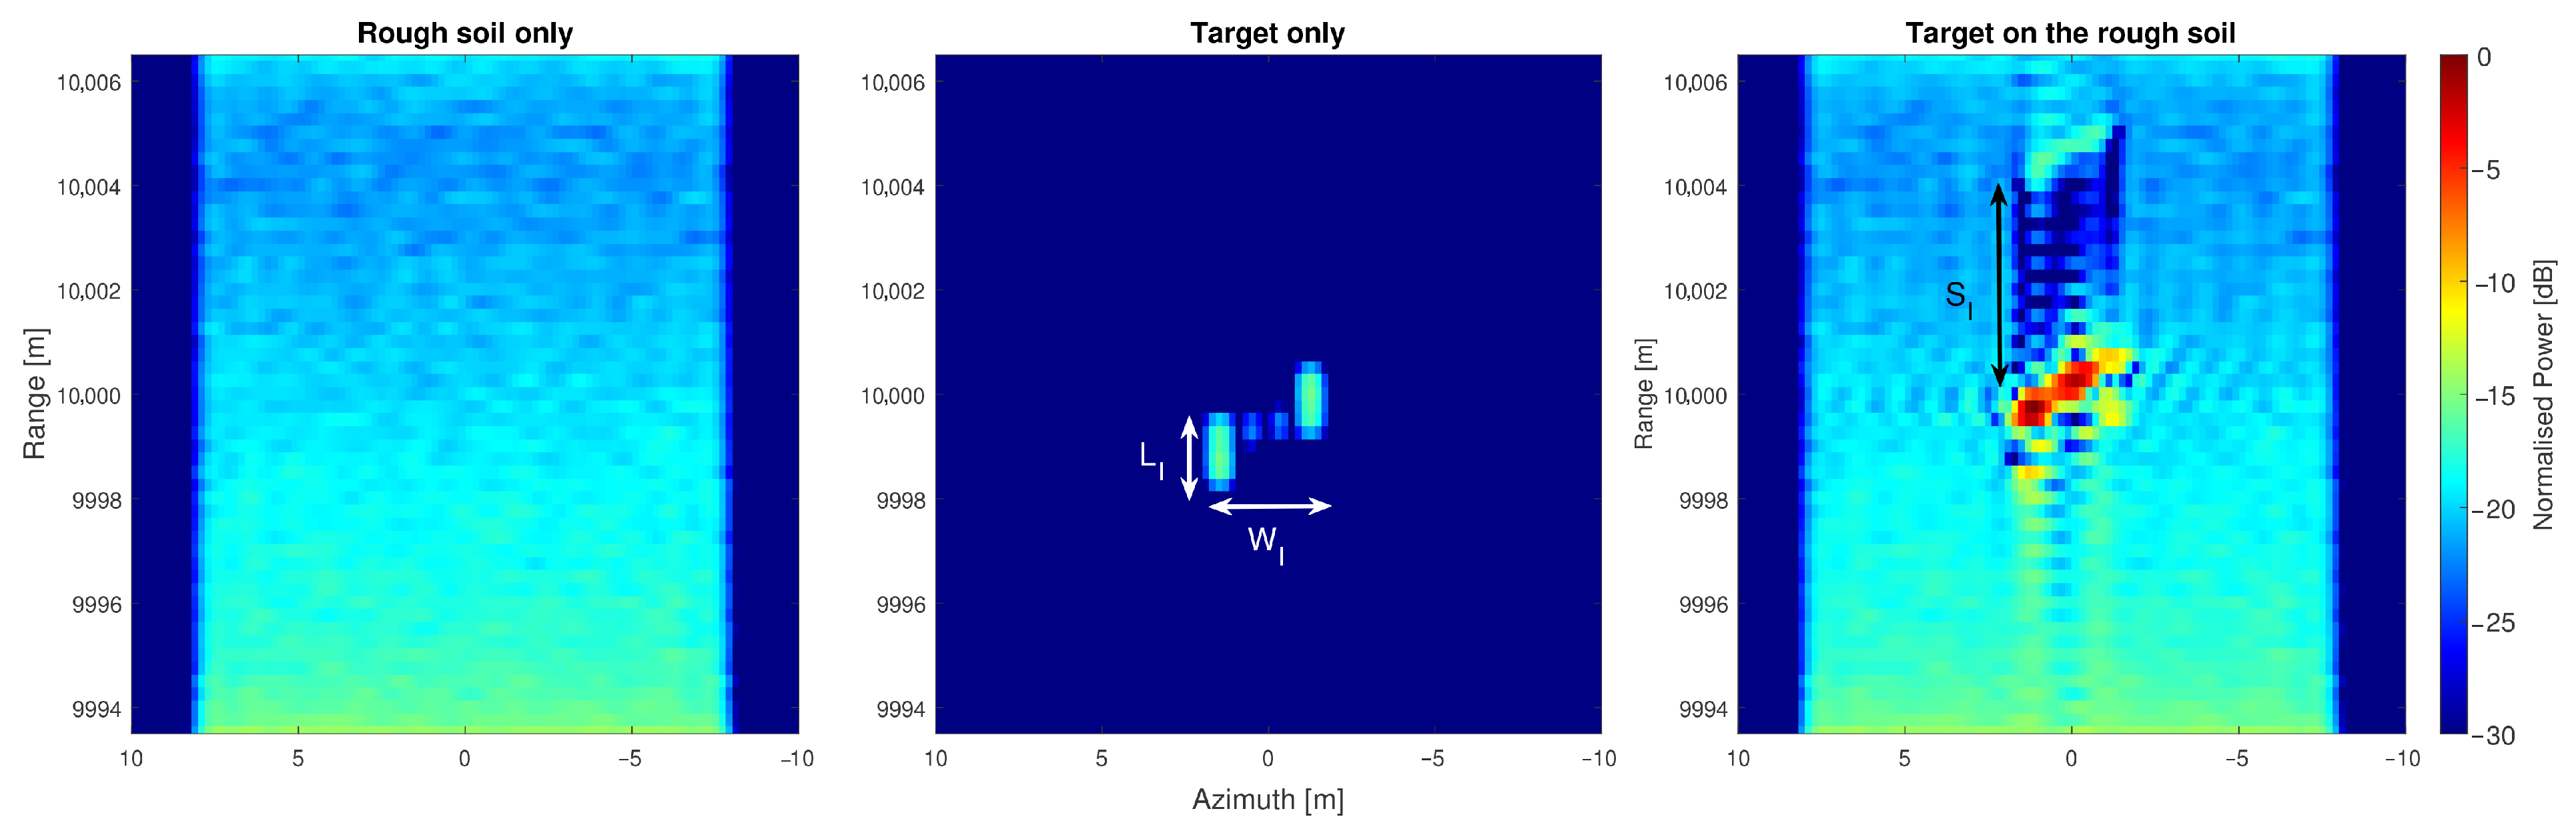
The simulated SAR images are presented in
Figure 3. First, it can be observed that the clutter power level decreases with increasing values in range. It can be explained by the amplitude factor attenuation due to the distance and the higher value of the incident angle of the radar EM wave at far range. The signature of the target mainly corresponds to the diffraction by the edges of the plate and is spread along the range axis. This can be interpreted as the layover phenomenon due to the altitude of the target. As illustrated in
Figure 2b, the theoretical layover extension due to an altitude
h is
. This gives a theoretical value of
for our simulation. In the SAR signature, the extension is
, showing an agreement with the range resolution. The azimuth extension of the target is
, which is represented here as
, in agreement with the observed value
and the azimuth theoretical resolution.
When the target is present on the rough soil, the shadow area is clearly visible, as well as the strong response of the composite scattering between the target and the soil. The theoretical range extension of the shadow is
(
Figure 2b); so here,
, which is in line with the observed range extension of
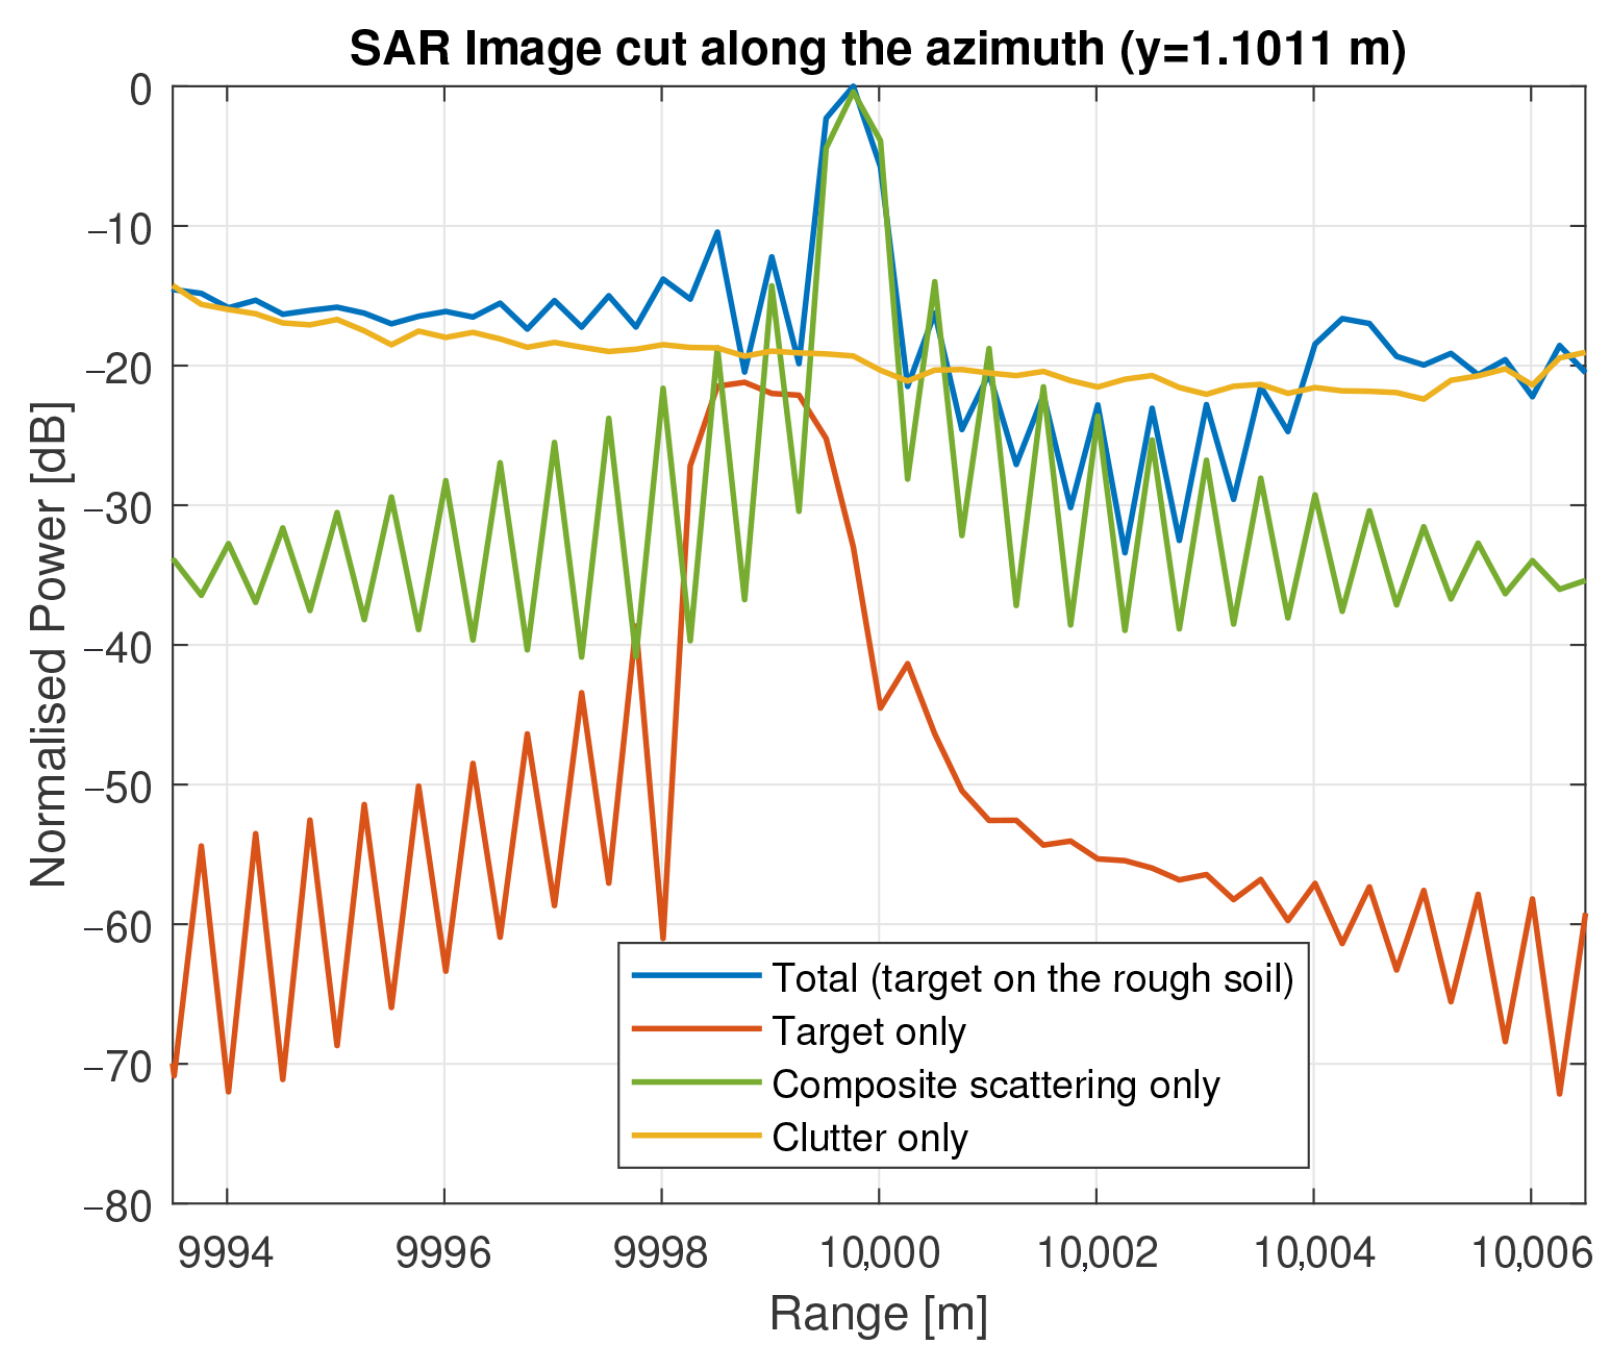
in the SAR image. The dominant signature in the SAR image is one of the double-bounce interactions that occur in the composite scattering between the target and the soil. This comes from the dihedral configuration of the scene for which double-bounce scattering is stronger than direct scattering. Indeed,
Figure 4 compares the SAR signals due to the different interactions along the range direction at the azimuth position y = 1.1011 m. We can notice a difference of 21 dB between the peak of the composite scattering signature and one of the signals due to the target scattering. Moreover, the sidelobes of the focused SAR signals of the double-bounce signature have a higher power level than the peak of the target signature.
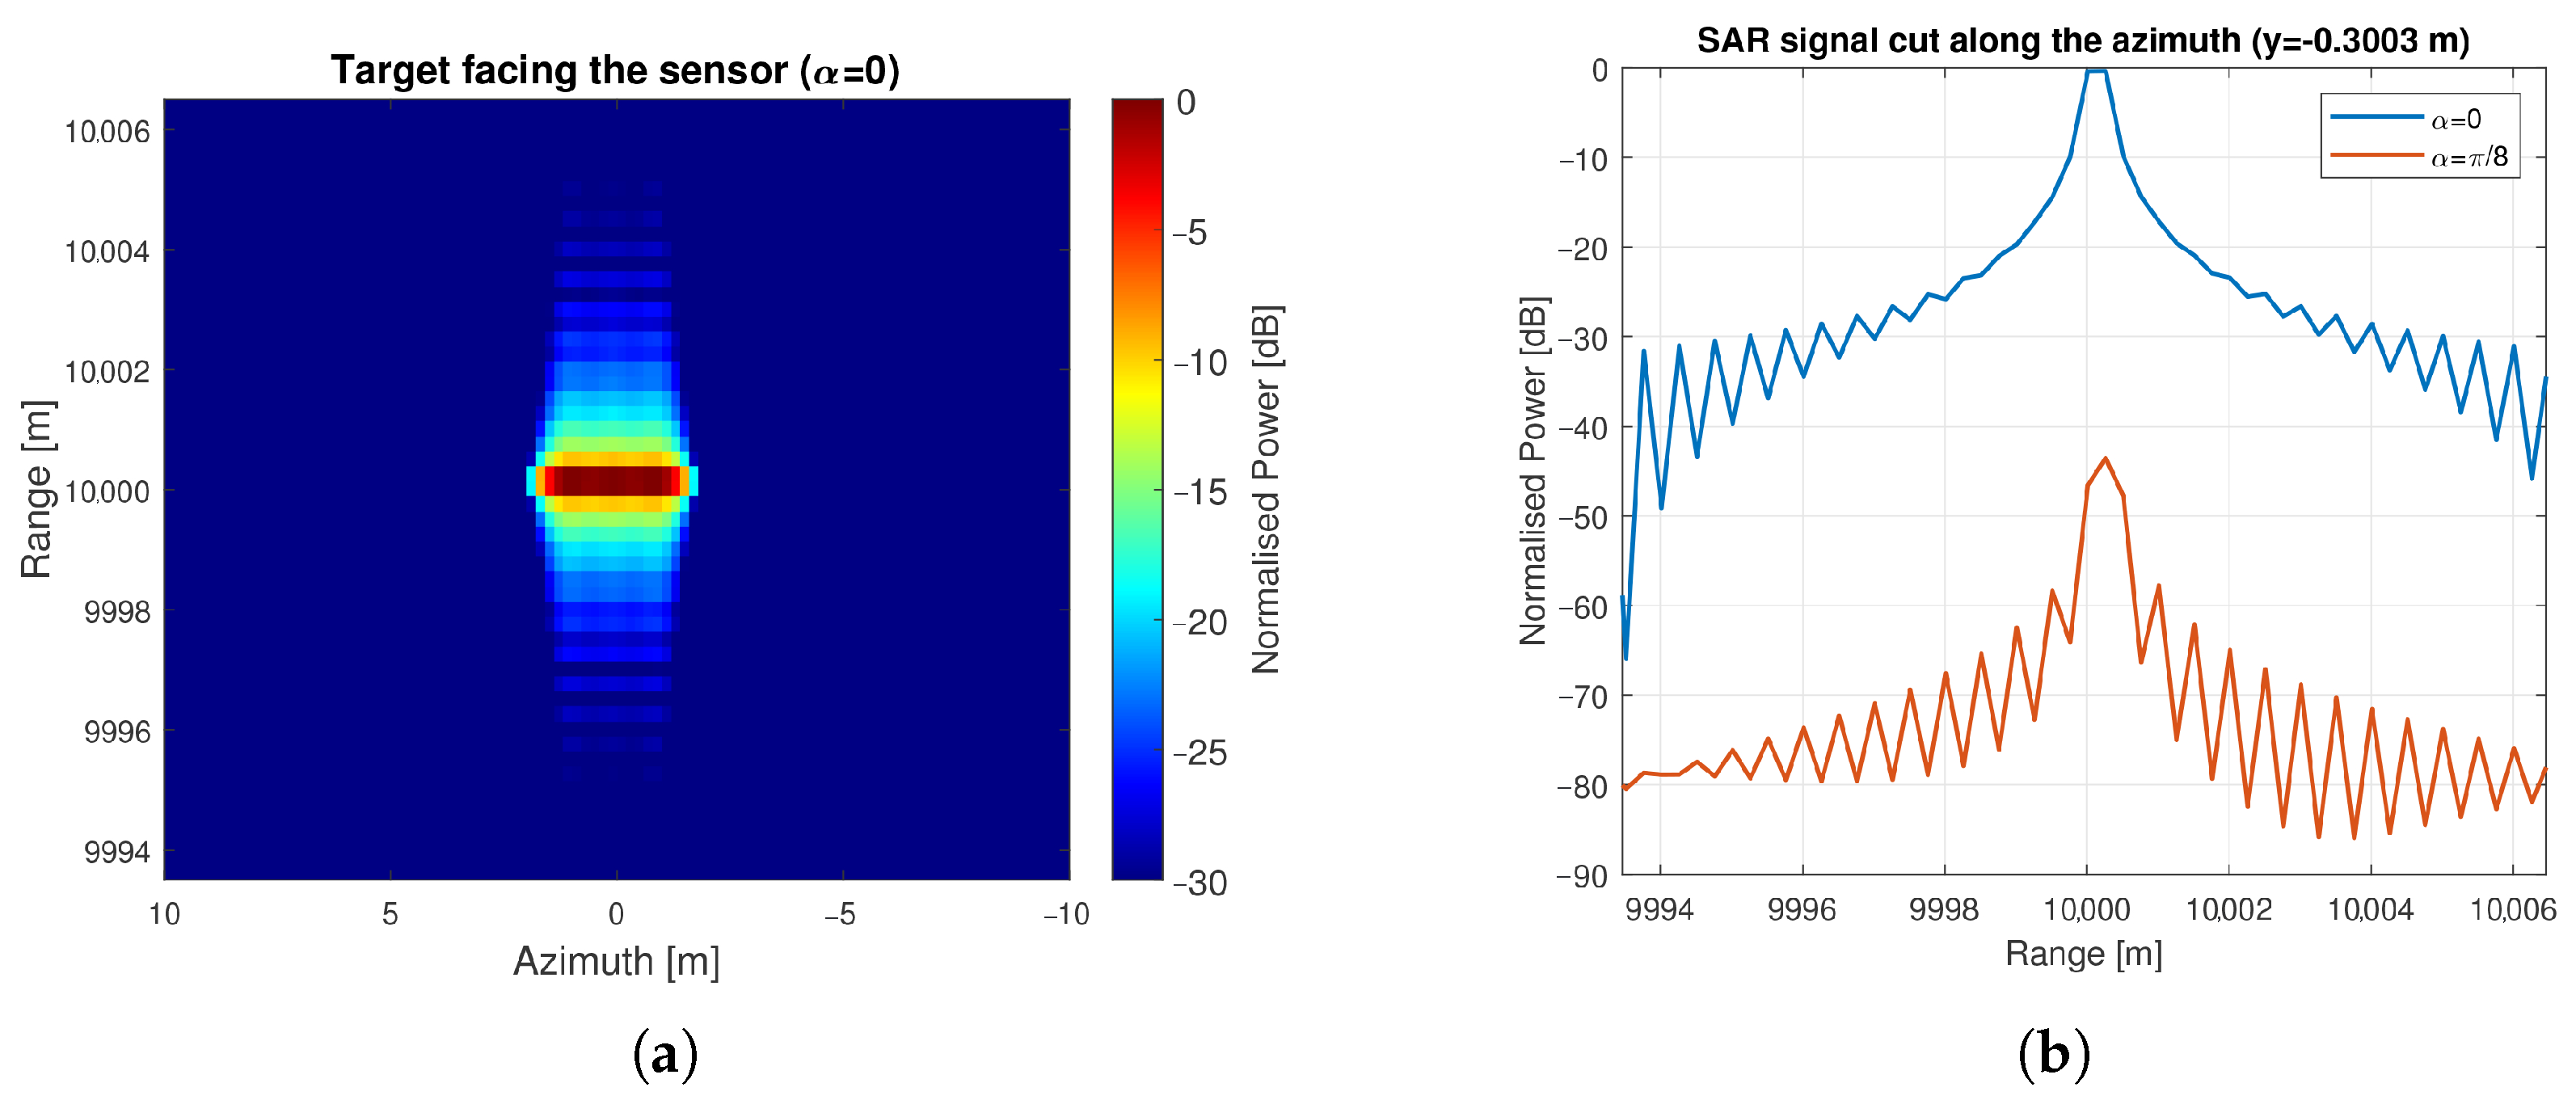
These double-bounce interactions are even stronger when the target is facing the sensor (
). The simulated SAR image of the scene is presented in
Figure 5a. Only the signature of the composite scattering is visible on the SAR image.
Figure 5b shows a comparison of the SAR signals due to double-bounce interactions in these two scenarios. We can notice a strong difference of 43 dB between the power peak of the two signals. This explains why the clutter and the direct scattering by the target are not visible in the SAR image presented in
Figure 5a.
4. Discussion and Conclusions
As illustrated by the simulation results presented in
Section 3, the methodology presented in this article offers a strong basis for simulating raw SAR data and the SAR image of a scene of interest, where composite scattering between the target and the environment occurs. More specifically, the layover, the shadow area, and the double scattering line are simulated in line with the theoretical resolutions. The simulated SAR images can be utilised for investigation purposes by exploring the signature of the different EM phenomena or the SAR distortions observed in the actual SAR images, depending on the characteristics of the scene of interest and the SAR parameters.
To be applied on more complex scenes of interest or for more detailed investigations, some limitations of the model need to be considered. First, to improve the accuracy of the multiple reflection estimation with the presented GO-PO combination, a finer mesh could be required that would increase the computing time of the ray–triangle intersection test. This requires the optimisation of these intersection tests. Therefore, a thorough study on the impacts of the mesh size and the optimisation strategy in the composite scattering field estimation need to be conducted.
Author Contributions
Conceptualisation, R.V., F.C., A.K. and J.P.-F.; methodology, R.V.; software, R.V.; validation, R.V., F.C., A.K., J.P.-F. and P.P.; formal analysis, R.V.; investigation, R.V.; resources, R.V.; data curation, R.V.; writing—original draft preparation, R.V.; writing—review and editing, F.C., A.K. and J.P.-F.; visualisation, R.V.; supervision, F.C., A.K., J.P.-F. and P.P.; project administration, A.K.; funding acquisition, A.K. All authors have read and agreed to the published version of the manuscript.
Funding
This work is funded by THALES LAS France and the French Defence Innovation Agency (AID-DGA).
Institutional Review Board Statement
Not applicable.
Informed Consent Statement
Not applicable.
Data Availability Statement
The data presented in this study are available on request from the corresponding author.
Acknowledgments
The authors would like to thank the French Defence Innovation Agency and the THALES LAS company for their support.
Conflicts of Interest
The authors declare that they have no known competing financial interests or personal relationships that could have appeared to influence the work reported in this paper. Raphaël Valeri and Jacques Petit-Frère is employee of THALES LAS France SAS, who provided funding and technical support for the work. The funder had no role in the design of the study; in the collection, analysis, or interpretation of data, in the writing of the manuscript, or in the decision to publish the results.
References
- Moreira, A.; Prats-Iraola, P.; Younis, M.; Krieger, G.; Hajnsek, I.; Papathanassiou, K. A Tutorial on Synthetic Aperture Radar. IEEE Geosci. Remote Sens. Mag. (GRSM) 2013, 1, 6–43. [Google Scholar] [CrossRef]
- Cumming, I.G.; Wong, F.H. Digital Processing of Synthetic Aperture Radar Data: Algorithms and Implementation; Artech House: Norwood, MA, USA, 2005. [Google Scholar]
- Tomiyasu, K. Tutorial review of synthetic-aperture radar (SAR) with applications to imaging of the ocean surface. Proc. IEEE 1978, 66, 563–583. [Google Scholar] [CrossRef]
- Knapskog, A.O. Moving targets and multipath in SAR images of harbour scenes. In Proceedings of the EUSAR 2012—9th European Conference on Synthetic Aperture Radar, Nuremberg, Germany, 23–26 April 2012; pp. 547–550. [Google Scholar]
- Peng, P.; Wang, Q.; Feng, W.; Wang, T.; Tong, C. An SAR Imaging and Detection Model of Multiple Maritime Targets Based on the Electromagnetic Approach and the Modified CBAM-YOLOv7 Neural Network. Electronics 2023, 12, 4816. [Google Scholar] [CrossRef]
- Wu, K.; Jin, G.; Xiong, X.; Zhang, H.; Wang, L. Fast SAR Image Simulation Based on Echo Matrix Cell Algorithm Including Multiple Scattering. Remote Sens. 2023, 15, 3637. [Google Scholar] [CrossRef]
- Wu, K.; Jin, G.; Xiong, X.; Zhang, H.; Wang, L. SAR Image Simulation Based on Effective View and Ray Tracing. Remote Sens. 2022, 14, 5754. [Google Scholar] [CrossRef]
- Chiang, C.Y.; Chen, K.S.; Yang, Y.; Zhang, Y.; Zhang, T. SAR Image Simulation of Complex Target including Multiple Scattering. Remote Sens. 2021, 13, 4854. [Google Scholar] [CrossRef]
- Möller, T.; Trumbore, B. Fast, Minimum Storage Ray-Triangle Intersection. J. Graph. Tools 1997, 2, 21–28. [Google Scholar] [CrossRef]
- Knott, E.F.; Shaeffer, J.F.; Tuley, M. Radar Cross Section, 2nd ed.; SciTech Publishing: Boston, MA, USA, 2004. [Google Scholar]
- Ulaby, F.; Moore, R.; Fung, A. Microwave Remote Sensing: Active and Passive; Number vol. 2 in Microwave Remote Sensing: Active and Passive; Addison-Wesley Publishing Company, Advanced Book Program/World Science Division: New York, NY, USA, 1981. [Google Scholar]
- Michaeli, A. Equivalent edge currents for arbitrary aspects of observation. IEEE Trans. Antennas Propag. 1984, 32, 252–258. [Google Scholar] [CrossRef]
- Griesser, T.; Balanis, C. Backscatter analysis of dihedral corner reflectors using physical optics and the physical theory of diffraction. IEEE Trans. Antennas Propag. 1987, 35, 1137–1147. [Google Scholar] [CrossRef]
- Radiocommunication Sector of International Telecommunication Union. Recommendation ITU-R P.676-13: Attenuation by Atmospheric Gases; Radiocommunication Sector of International Telecommunication Union: Geneva, Switzerland, 2022. [Google Scholar]
- Radiocommunication Sector of International Telecommunication Union. Recommendation ITU-R P.840-9: Attenuation Due to Clouds and Fog; Radiocommunication Sector of International Telecommunication Union: Geneva, Switzerland, 2023. [Google Scholar]
- Radiocommunication Sector of International Telecommunication Union. Recommendation ITU-R P.838-3: Specific Attenuation Model for Rain for Use in Prediction Methods; Radiocommunication Sector of International Telecommunication Union: Geneva, Switzerland, 2005. [Google Scholar]
- Cruz, H.; Véstias, M.; Monteiro, J.; Neto, H.; Duarte, R.P. A Review of Synthetic-Aperture Radar Image Formation Algorithms and Implementations: A Computational Perspective. Remote Sens. 2022, 14, 1258. [Google Scholar] [CrossRef]
- Brunner, D.; Bruzzone, L.; Ferro, A.; Lemoine, G. Analysis of the reliability of the double bounce scattering mechanism for detecting buildings in VHR SAR images. In Proceedings of the 2009 IEEE Radar Conference, Pasadena, CA, USA, 4–8 May 2009; pp. 1–6. [Google Scholar]
| Disclaimer/Publisher’s Note: The statements, opinions and data contained in all publications are solely those of the individual author(s) and contributor(s) and not of MDPI and/or the editor(s). MDPI and/or the editor(s) disclaim responsibility for any injury to people or property resulting from any ideas, methods, instructions or products referred to in the content. |
© 2025 by the authors. Licensee MDPI, Basel, Switzerland. This article is an open access article distributed under the terms and conditions of the Creative Commons Attribution (CC BY) license (https://creativecommons.org/licenses/by/4.0/).


 ,
, 
