Abstract
This study examines urban expansion, coastal erosion, and extreme wave events in Licantén, Maule Region, following the 2010 earthquake and tsunami. Using multi-source data—Landsat and Sentinel-2 imagery, ERA5 reanalysis, high-resolution Maxar images, UAV surveys, and the CoastSat algorithm—we detected significant urban growth in tsunami-prone areas: Iloca (36.88%), La Pesca (33.34%), and Pichibudi (20.78%). A 39-year shoreline reconstruction (1985–2024) revealed notable changes in erosion rates and shoreline dynamics using DSAS v6.0, influenced by tides, storm surges, and wave action modeled in R to quantify storm surge events over time. Results underscore the lack of urban planning in hazard-exposed areas and the urgent need for resilient coastal management under climate change.
1. Introduction
The central coast of Chile, due to its tectonic and geomorphological conditions, exposes this territory to multiple threats, primarily of tectonic and oceanic origin. At the same time, the beaches of central Chile have shown marked erosion trends in the last decade, with examples such as Algarrobo [1], Caleta Portales, and Las Salinas [2], among others. These erosive trends have also been noted in the Maule region, where localities such as the Licantén commune have experienced noticeable changes over the past decades. Additionally, strong housing pressure has generated constant occupation of its coastal environments, from dune environments to areas near the coastline.
Furthermore, due to global climate change, hydroclimatic and oceanic phenomena and anomalies directly impact Chilean coasts [3], mainly due to the occurrence of increased swell events over the past 15 years. Thus, the 8.8 Mw earthquake in Cobquecura (~180 km from the study area) changed the configuration and dynamics of the coastal areas in central Chile, related to uplift-subsidence in beach and rocky areas of the coastline [4].
On the other hand, a constant expansion of living space has been notoriously detected through spatial and satellite images, building structures such as houses and tourist complexes close to the shoreline, increasing the exposed areas to floods related to storm surges and tsunami events in the study area.
The coastal areas of Licantén are in Maule region, Chile (−34.93 N, −72.18 E). The beaches considered in the study area are Pichibudi, Iloca, and La Pesca, due to their relevance to the tourism activities and the fishery industry. Thus, this area is well known for the impacts of the 2010 earthquake and tsunami, causing multiple material and human impacts. This study aims to highlight the lack of regulatory frameworks governing urban planning in this coastal region, which has led to the development of settlements and communities in areas highly vulnerable to oceanographic and tectonic hazards. By integrating remote sensing technologies with field-collected data, this research evaluates the spatial and temporal evolution of the coastline and its geomorphological characteristics. This comparative analysis enables a more accurate assessment of environmental risks and land-use changes over time. This work is particularly relevant in the context of increasing climate variability and seismic activity, which amplifies the exposure and vulnerability of coastal populations. The absence of effective planning and risk mitigation strategies underscores the urgent need for informed policy-making and sustainable development practices in hazard-prone coastal zones.
2. Methodology
The following outlines the different phases of the study, organized according to the research workflow and the objectives established:
2.1. GIS—Remote Sensing Dataset
For shoreline modeling, Coastsat [5] was used to extract the shoreline position derived from satellite images (SDSs) to generate the spatio-temporal models and to calculate the erosion rate with DSASv6. Landsat 5 TM, Landsat 7 ETM+, Landsat 8/9 OLI, and Sentinel-2 were used to extract SDSs for the erosion rates. LRR (Linear Regression Rate) from the DSAS product was used to estimate the tendency to erosion/accretion of the beach. Specifically, for the erosion rates, the analysis was focused on the 2010 earthquake event, showing the impacts of this seismic event on the sedimentological regime affecting erosion/accretion rates. For the impacts of the2010 earthquake, 518 SDSs for Pichibudi, 479 SDSs for Iloca, and 389 SDSs for La Pesca were used for the post event analysis.
Layers of tsunami inundation areas elaborated by the Oceanographic and Hydrological Service of the Navy (SHOA in Spanish) in 2024 were applied to compare the exposed areas in the current inhabited coastal space. The analysis of erosion rates was made from 2004 to 2024, marking 2010 as the break year of changes. All the GIS layers/dataset were processed in ArcMap 10.8, QGIS, 3.28.0, and R 4.2.2.
2.2. Oceanographic Conditions and Storm Surges
Era5 reanalysis was used to describe the oceanographic conditions of the study area. Significant height of total swell (shts) dataset was extracted to analyze and count the storm surges from 1984 to 2024. Currently, there is no standardized criterion to define a storm surge event, from the physical conditions of the waves to the duration and independence criteria from each event. A statistical criterion was taken to reference the storm surges based on the behavior of the shts, analyzing Peaks Over Threshold (POT) to discriminate the extreme event from the main dataset [6]. The numerical criteria can be summarized as follows: Low threshold (2.0 m) as a minimal threshold to determine a significant storm surge, High threshold (2.7 m) as a threshold required to confirm the existence of an event core, Minimal duration of the event (72 h), and Minimal independence (48 h) as the minimum time between consecutive events to consider them independent. The described conditions were proposed to define the storm surge event based on the behavior of the entire dataset values of shts. The entire process was executed in R.
2.3. Increasing Urban Area
High resolution images (Maxar/Airbus) obtained from Google Earth Pro, were used to delineate the urban area in 2004 and 2024 through photointerpretation. Images from 3 March 2010, were included to show the impacts of tsunami in the study area. UAV flights were also used to compare the effects of the expansion of houses and tourism complexes in the study area.
3. Results
Changes in the shoreline position and frequency of storm surges are clearly observed, among the expansion of living space. All the beaches have their living space in coverage of tsunami inundation areas over 90% (Table 1). Between 2004 and 2024, mean urban growth for the study area was approximately 30.33%. Iloca showed the most significant growth in 20 years with an expansion of 36.8% of its surface; is followed by La Pesca with 33.34% and Pichibudi with 20.78% due to its economic activity related to the fishery industry, and for its small size. Also, almost the totality of the land occupied in the study area are under inundation areas in the event of a tsunami.

Table 1.
Percentage of land occupied in tsunami flood zones, relative to total coverage.
3.1. Erosion Rates
Changes in coastal dynamics before and after the 2010 8.8 Mw earthquake underscore its significant impact on shoreline behavior (Figure 1), initiating a persistent trend of coastal erosion. In the case of La Pesca, however, accretion has been recorded in the proximal zone of the beach, largely attributed to sediment input from the Mataquito River mouth (Table 2).
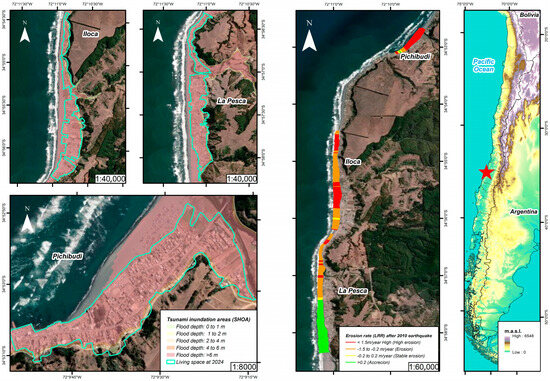
Figure 1.
Tsunami inundation areas (first frame), erosion rates after 2010 (second frame), and location map (third frame). Red star refers to the location of study area.
Table 2.
LRR values in both periods (before and after earthquake 2010). Units of LRR are measured in meters per year (m/year).
3.2. Spatiotemporal Models
The analysis of beach width variations, based on Satellite-Derived Shorelines (SDSs) extractions using CoastSat, reveals distinct trends in coastal dynamics. In Pichibudi, a significant increase in beach width was observed following the earthquake, likely driven by sediment redistribution and post-seismic coastal adjustments. However, this initial expansion has gradually declined over the past five years, indicating a transition toward erosional processes.
In contrast, the effects of erosion are more pronounced in Iloca and La Pesca, particularly in the distal zones of both beaches, where sediment loss and shoreline retreat are visibly accelerating (Figure 2). These patterns underscore the importance of long-term monitoring and sediment transport analysis to better understand the drivers of coastal change and their implications for shoreline stability. Orientation and length of the beach also play a fundamental role in their erosion/accretion behavior, considering the origin of swell that affects the coastal areas of central Chile (SW) with La Pesca being the most exposed beach according to this observation.
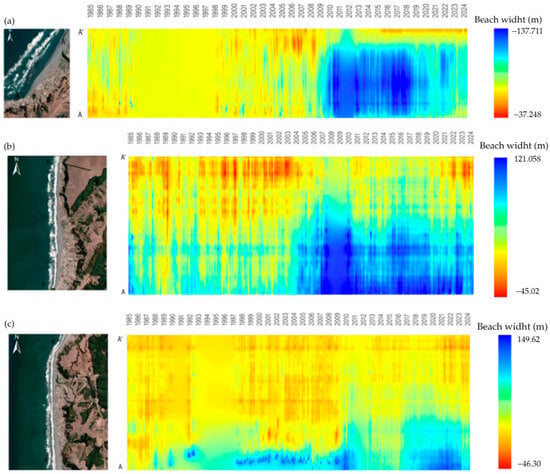
Figure 2.
Spatiotemporal models of Pichibudi (a), Iloca (b), and La Pesca (c).
3.3. Oceanographic Conditions
The Peaks Over Threshold (POT) method was applied to the dataset of Significant height of the Total Swell (SHTS) to quantify swell events in the study area. The analysis reveals a progressive increase in the occurrence of these events since the early 2010s. This upward trend has been sustained, with notable peaks in specific years, maintaining a high frequency over time and indicating a recurring pattern in oceanographic variability (Figure 3).
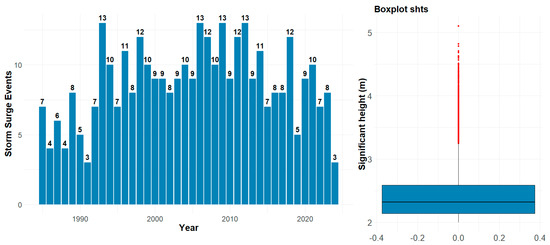
Figure 3.
Storm surge events and distribution of SHTS values over time.
The observed trend suggests a potential link to changes in atmospheric circulation and oceanographic conditions, such as increased wave energy or the intensification of low-pressure systems. Statistical analysis confirms a substantial rise in the number of swell events over the past 15 years, highlighting the need for more detailed studies to better understand their implications for coastal dynamics and their impact on vulnerable communities.
3.4. Livings Space Increase
The evolution of the inhabited areas shows a notorious increase in the 3 beaches, Pichibudi (20.78%), Iloca (36.88%), and La Pesca (33.34%). Houses, tourist complexes, crop fields, and sports infrastructure are the new buildings identified in the aerial images. As it is mentioned in the beginning of this section, there is a high percentage of land occupation over inundation areas despite the impacts of earthquake and tsunami of 2010 (Figure 4).
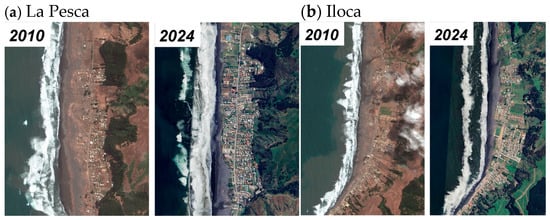
Figure 4.
Tsunami effects in La Pesca (a) and Iloca (b). Comparison between 2010 (March 3rd) and 2024.
4. Discussions
The coastal areas of Licantén are highly dynamic and susceptible to changes triggered by disruptive events such as coastal storms and large-magnitude seismic activity that impact their beach width. Numerous records document the impacts of the 2010 tsunami on these communities, including considerable economic losses and many victims, highlighting the risks associated with reconstruction and expansion in zones exposed to such hazards.
The 2010 event is particularly notable for causing an uplift of the coastal platform by approximately 50 cm [7]. Although this seismic event significantly altered coastal dynamics across the three beaches, it is essential to recognize that changes in sedimentation regimes—manifesting as both erosion and accretion—are influenced by a multitude of factors beyond the secondary effects of a major earthquake. Submarine coastal geomorphological features such as sandbanks, submarine canyons, and the specific bathymetry of each beach directly affect the energy of incoming wave action along the study area’s shoreline.
Additionally, climate change impacts—such as increased frequency of coastal storms and swells, including extreme events as the meteotsunami of 2015—that disrupt these kinds of events in central Chile cause significant damage along the coast of central Chile [3]. These events not only hinder sediment deposition but also intensify beach erosion due to the force of wave energy, generating greater dangers to the communities and towns that inhabit these coastal areas, raising questions about how to inhabit and develop coastal spaces in the face of new climate change scenarios [8]. Methodologies such as SamGeo [9] can be a suitable option to measure build-up areas with bigger extensions and more complex shapes.
Understanding the historical behavior of beaches in this region is therefore critical. These beaches have shown significant erosion and narrowing over various periods, influenced by El Niño/La Niña events as well as tectonic activity. This underscores the hazards of building near the shoreline, particularly in dune fields or areas where sandbanks and sediment deposits have been depleted due to land cover changes. Models developed by the SDS provide valuable input for creating planning instruments that align with the geomorphological and oceanographic realities of beaches such as Pichibudi, Iloca, and La Pesca.
Mixed-method approaches—integrating field data collection with geospatial analyses of coastal dynamics—enable comprehensive monitoring and assessment of coastal zones. This methodology facilitates the identification and characterization of areas most vulnerable to coastal hazards. To complement the physical analysis, indicators such as the Social Vulnerability Index (SoVI) can be employed to evaluate the socioeconomic dimensions of vulnerability in communities exposed to these phenomena. Previous research [10] applying SoVI in the coastal town of Cartagena—located approximately 400 km north of the current study area—highlighted the importance of incorporating such indices into urban planning frameworks. Other multicriteria methods can be useful to assess the exposed areas to coastal flooding considerating socio-economic and geomorphological variables to define the grade of danger in coastal areas [11]. This approach can significantly enhance disaster risk reduction strategies in coastal settlements, avoiding economic and human losses.
5. Conclusions
Coastal communities and major urban centers in central Chile are increasingly facing compounded challenges from both tectonic and hydro-meteorological hazards—primarily earthquakes, tsunamis, and coastal storms. These drivers contribute to persistent erosional cycles that are visibly affecting the beaches analyzed in this study. In response to these escalating threats, it is essential to develop and implement comprehensive planning instruments alongside multi-level governance frameworks that enhance climate resilience in coastal cities and settlements.
The remote sensing-based methodology employed in this research offers a cost-effective and efficient tool for monitoring shoreline dynamics, providing critical data to support evidence-based decision-making. The progressive landward retreat of the coastline—encroaching upon residential areas and infrastructure built on dune fields and even directly on the beach—underscores the urgency of proactive intervention. Strengthening adaptation strategies and integrating coastal protection measures are vital to mitigating human and material losses, ensuring long-term sustainability amid projected climate-related extreme events.
Author Contributions
Conceptualization, J.V.-J.; methodology, J.V.-J. and I.B.d.U.; software, J.V.-J., I.B.d.U. and I.D.-Q.; validation, J.V.-J.; formal analysis, J.V.-J. and I.B.d.U.; investigation, J.V.-J. and I.B.d.U.; resources, I.B.d.U. and W.P.-M.; data curation, J.V.-J.; writing—original draft preparation, J.V.-J.; writing—review and editing, I.B.d.U. and I.D.-Q.; visualization, J.V.-J.; supervision, I.B.d.U.; project administration, I.B.d.U.; funding acquisition, I.B.d.U. All authors have read and agreed to the published version of the manuscript.
Funding
This research was funded by Agencia Nacional de Investigación y Desarrollo (Concurso de investigación tecnologica FONDEF 2023, Proyecto IT 23I0069), and by the projects MONCOSTA Red nacional de monitoreo de la costa chilena.
Institutional Review Board Statement
Not applicable.
Informed Consent Statement
Not applicable.
Data Availability Statement
Dataset can be available at https://gorev.moncosta.org/ (accessed on 20 May 2025).
Conflicts of Interest
The authors declare no conflicts of interest.
References
- Briceño de Urbaneja, I.C.; Pardo-Pascual, J.E.; Cabezas-Rabadán, C.; Aguirre, C.; Martínez, C.; Pérez-Martínez, W.; Palomar-Vázquez, J. Characterization of Multi-Decadal Beach Changes in Cartagena Bay (Valparaíso, Chile) from Satellite Imagery. Remote Sens. 2024, 16, 2360. [Google Scholar] [CrossRef]
- Martínez, C.; Contreras-López, M.; Winckler, P.; Hidalgo, H.; Godoy, E.; Agredano, R. Coastal erosion in central Chile: A new hazard? Ocean Coast. Manag. 2018, 156, 141–155. [Google Scholar] [CrossRef]
- Carvajal, M.; Contreras-López, M.; Winckler, P.; Sepúlveda, I. Meteotsunamis Occurring Along the Southwest Coast of South America During an Intense Storm. Pure Appl. Geophys. 2017, 174, 3313–3323. [Google Scholar] [CrossRef]
- Vargas, G.; Farías, M.; Carretier, S.; Tassara, A.; Baize, S.; Melnick, D. Andean Geology formerly Revista Geológica de Chile Coastal uplift and tsunami effects associated to the 2010 M w 8.8 Maule earthquake in Central Chile. Andean Geol. 2011, 38, 219–238. [Google Scholar]
- Vos, K.; Splinter, K.D.; Harley, M.D.; Simmons, J.A.; Turner, I.L. CoastSat: A Google Earth Engine-enabled Python toolkit to extract shorelines from publicly available satellite imagery. Environ. Model. Softw. 2019, 122, 104528. [Google Scholar] [CrossRef]
- Harley, M. Coastal Storm Definition. In Coastal Storms: Processes and Impacts; Wiley Blackwell: Hoboken, NJ, USA, 2016; pp. 1–21. [Google Scholar]
- Lario, J.; Zazo, C.; Goy, J.L. Tectonic and morphosedimentary features of the 2010 Chile earthquake and tsunami in the Arauco Gulf and Mataquito River (Central Chile). Geomorphology 2016, 267, 16–24. [Google Scholar] [CrossRef]
- Igualt, F.; Breuer, W.A.; Contreras-López, M.; Martínez, C. Effects of climate change on the urban tourist and coastal area of Viña del Mar: Survey of damage for flooding by storm surge and perception of security. Revista 180 2019, 44, 120–133. [Google Scholar] [CrossRef]
- Wu, Q.; Osco, L.P. Samgeo: A Python package for segmenting geospatial data with the Segment Anything Model (SAM). J. Open Source Softw. 2023, 8, 5663. [Google Scholar] [CrossRef]
- Martínez, C.; Cienfuegos, R.; Inzunza, S.; Urrutia, A.; Guerrero, N. Worst-case tsunami scenario in Cartagena Bay, central Chile: Challenges for coastal risk management. Ocean Coast. Manag. 2020, 185, 105060. [Google Scholar] [CrossRef]
- Ferreira, J.C.; Cardona, F.S.; Santos, C.J.; Tenedório, J.A. Hazards, vulnerability, and risk analysis on wave overtopping and coastal flooding in low-lying coastal areas: The case of costa da caparica, Portugal. Water 2021, 13, 237. [Google Scholar] [CrossRef]


Disclaimer/Publisher’s Note: The statements, opinions and data contained in all publications are solely those of the individual author(s) and contributor(s) and not of MDPI and/or the editor(s). MDPI and/or the editor(s) disclaim responsibility for any injury to people or property resulting from any ideas, methods, instructions or products referred to in the content. |
© 2025 by the authors. Licensee MDPI, Basel, Switzerland. This article is an open access article distributed under the terms and conditions of the Creative Commons Attribution (CC BY) license (https://creativecommons.org/licenses/by/4.0/).