Abstract
End milling is a process that is widely used for producing components in aerospace applications, automobile applications, and many other fields. It is crucial to forecast a workpiece’s deformation behaviour during the machining process to choose the best process settings and maximize the part’s overall quality. Understanding the behaviour of each workpiece during the end-milling process through physical experiments is critical, but expensive. Hence, it is inevitable that a numerical study will be developed to estimate workpiece deformation with higher accuracy and less computational cost. The end-milling process on AISI 1045 is simulated in this work using a 3D finite element modelling technique. The ANSYS Workbench 2020 R1 is used to conduct an explicit dynamic analysis in the suggested model. The workpiece’s stress and deformation values throughout the machining process are estimated and examined.
1. Introduction
The simulation of the end-milling process has become a critical research area in manufacturing engineering due to the need for high precision and efficiency in machining operations. An efficient way to simulate the end-milling process is with finite element analysis (FEA), which allows for a better understanding of the physics and the ability to optimize the process parameters. The most recent and cutting-edge finite element analysis (FEA) models of end milling will be the focus of this literature study.
In order to investigate the micro-end milling of Ti-6Al-4V titanium alloy, Thepsonthi and Özel [1] utilized three-dimensional finite element process models. Experimentation confirmed the accuracy of the chip flow and tool wear calculations. The researchers validated the chip flow and tool wear through experimental analysis. Rex and Ravindran [2] employed transient dynamic analysis to simulate the workpiece’s behaviour during the end-milling operation. Finite element analysis was used to assess the elastic deformation of the workpiece. Deepanraj et al. [3] employed FEA using Deform-3D V13.0 software to simulate the end milling process, resulting in significant insights which were confirmed through experimental testing. Ren et al. [4] examined the milling process of laser-made parts made of Ti6Al4V titanium metal. They used FEA to analyze the process. Davoudinejad et al. [5] simulated micro end milling and examined how tool run-out affected the process. Their study demonstrated the accurate predictive capabilities of FEA in determining machining outcomes. Rex et al. [6] employed a parametric finite element model to ascertain the deformation of the workpiece during the pocket milling process. Abbas et al. [7] investigated how the shape of the tool edge and the conditions of the cut affected performance markers in dry turning. They utilized FEA for process analysis. Li et al. [8] conducted an optimization study on the milling of aluminum alloy 6061-T6 using a modified Johnson–Cook model. Their research demonstrated the efficiency of FEA in optimizing the milling process. Rex et al. [9] utilized a mathematical model to calculate the locator’s reaction force while simulating the milling process and compared the results with the findings from a finite element analysis. Pei and Shu [10] performed an experimental investigation and employed a 3D simulation augmented by FEA to deepen their comprehension of the machining of titanium alloys.
Similarly, Wang et al. [11] focused on high-speed milling of titanium alloys and employed experimental analysis and 3D simulation aided by FEA to gain additional insights. Davoudinejad et al. [12] utilized 3D FEA to predict the movement of chips, the creation of burrs, and the forces involved in cutting during the micro end-milling simulation on aluminum 6061-T6. This study provided valuable knowledge on the dynamics of micro-scale machining and assisted in optimizing the process. In their study, Mamedov and Lazoglu [13] conducted thermal research on the micro milling of titanium alloy Ti–6Al–4V. The investigation provided valuable insights into the development and dissipation of heat during machining, which is crucial for enhancing the efficiency and durability of the tools utilized.
Overall, in recent years, a thorough examination of the finite element analysis (FEA) study of end-milling machining has been conducted. The choice of a 3D finite element model (FEM) for predicting deformation during end milling is driven by its ability to accurately capture the complex interactions between the tool and workpiece, including stress, strain, and thermal effects, in three dimensions [3]. Unlike simplified 2D models or analytical methods, a 3D FEM provides a more detailed representation of the tool’s geometry, material removal processes, and dynamic interactions. Furthermore, FEM can effectively handle non-linear material behaviours and varying boundary conditions, making it the preferred method for precise predictions of deformation and stress in machining operations. The results are also in close agreement with experimental findings [14]. This investigation uses an effective three-dimensional finite element model to ascertain the elastic deformation in the workpiece throughout the end-milling operation.
2. Selection of Materials and the Methodology
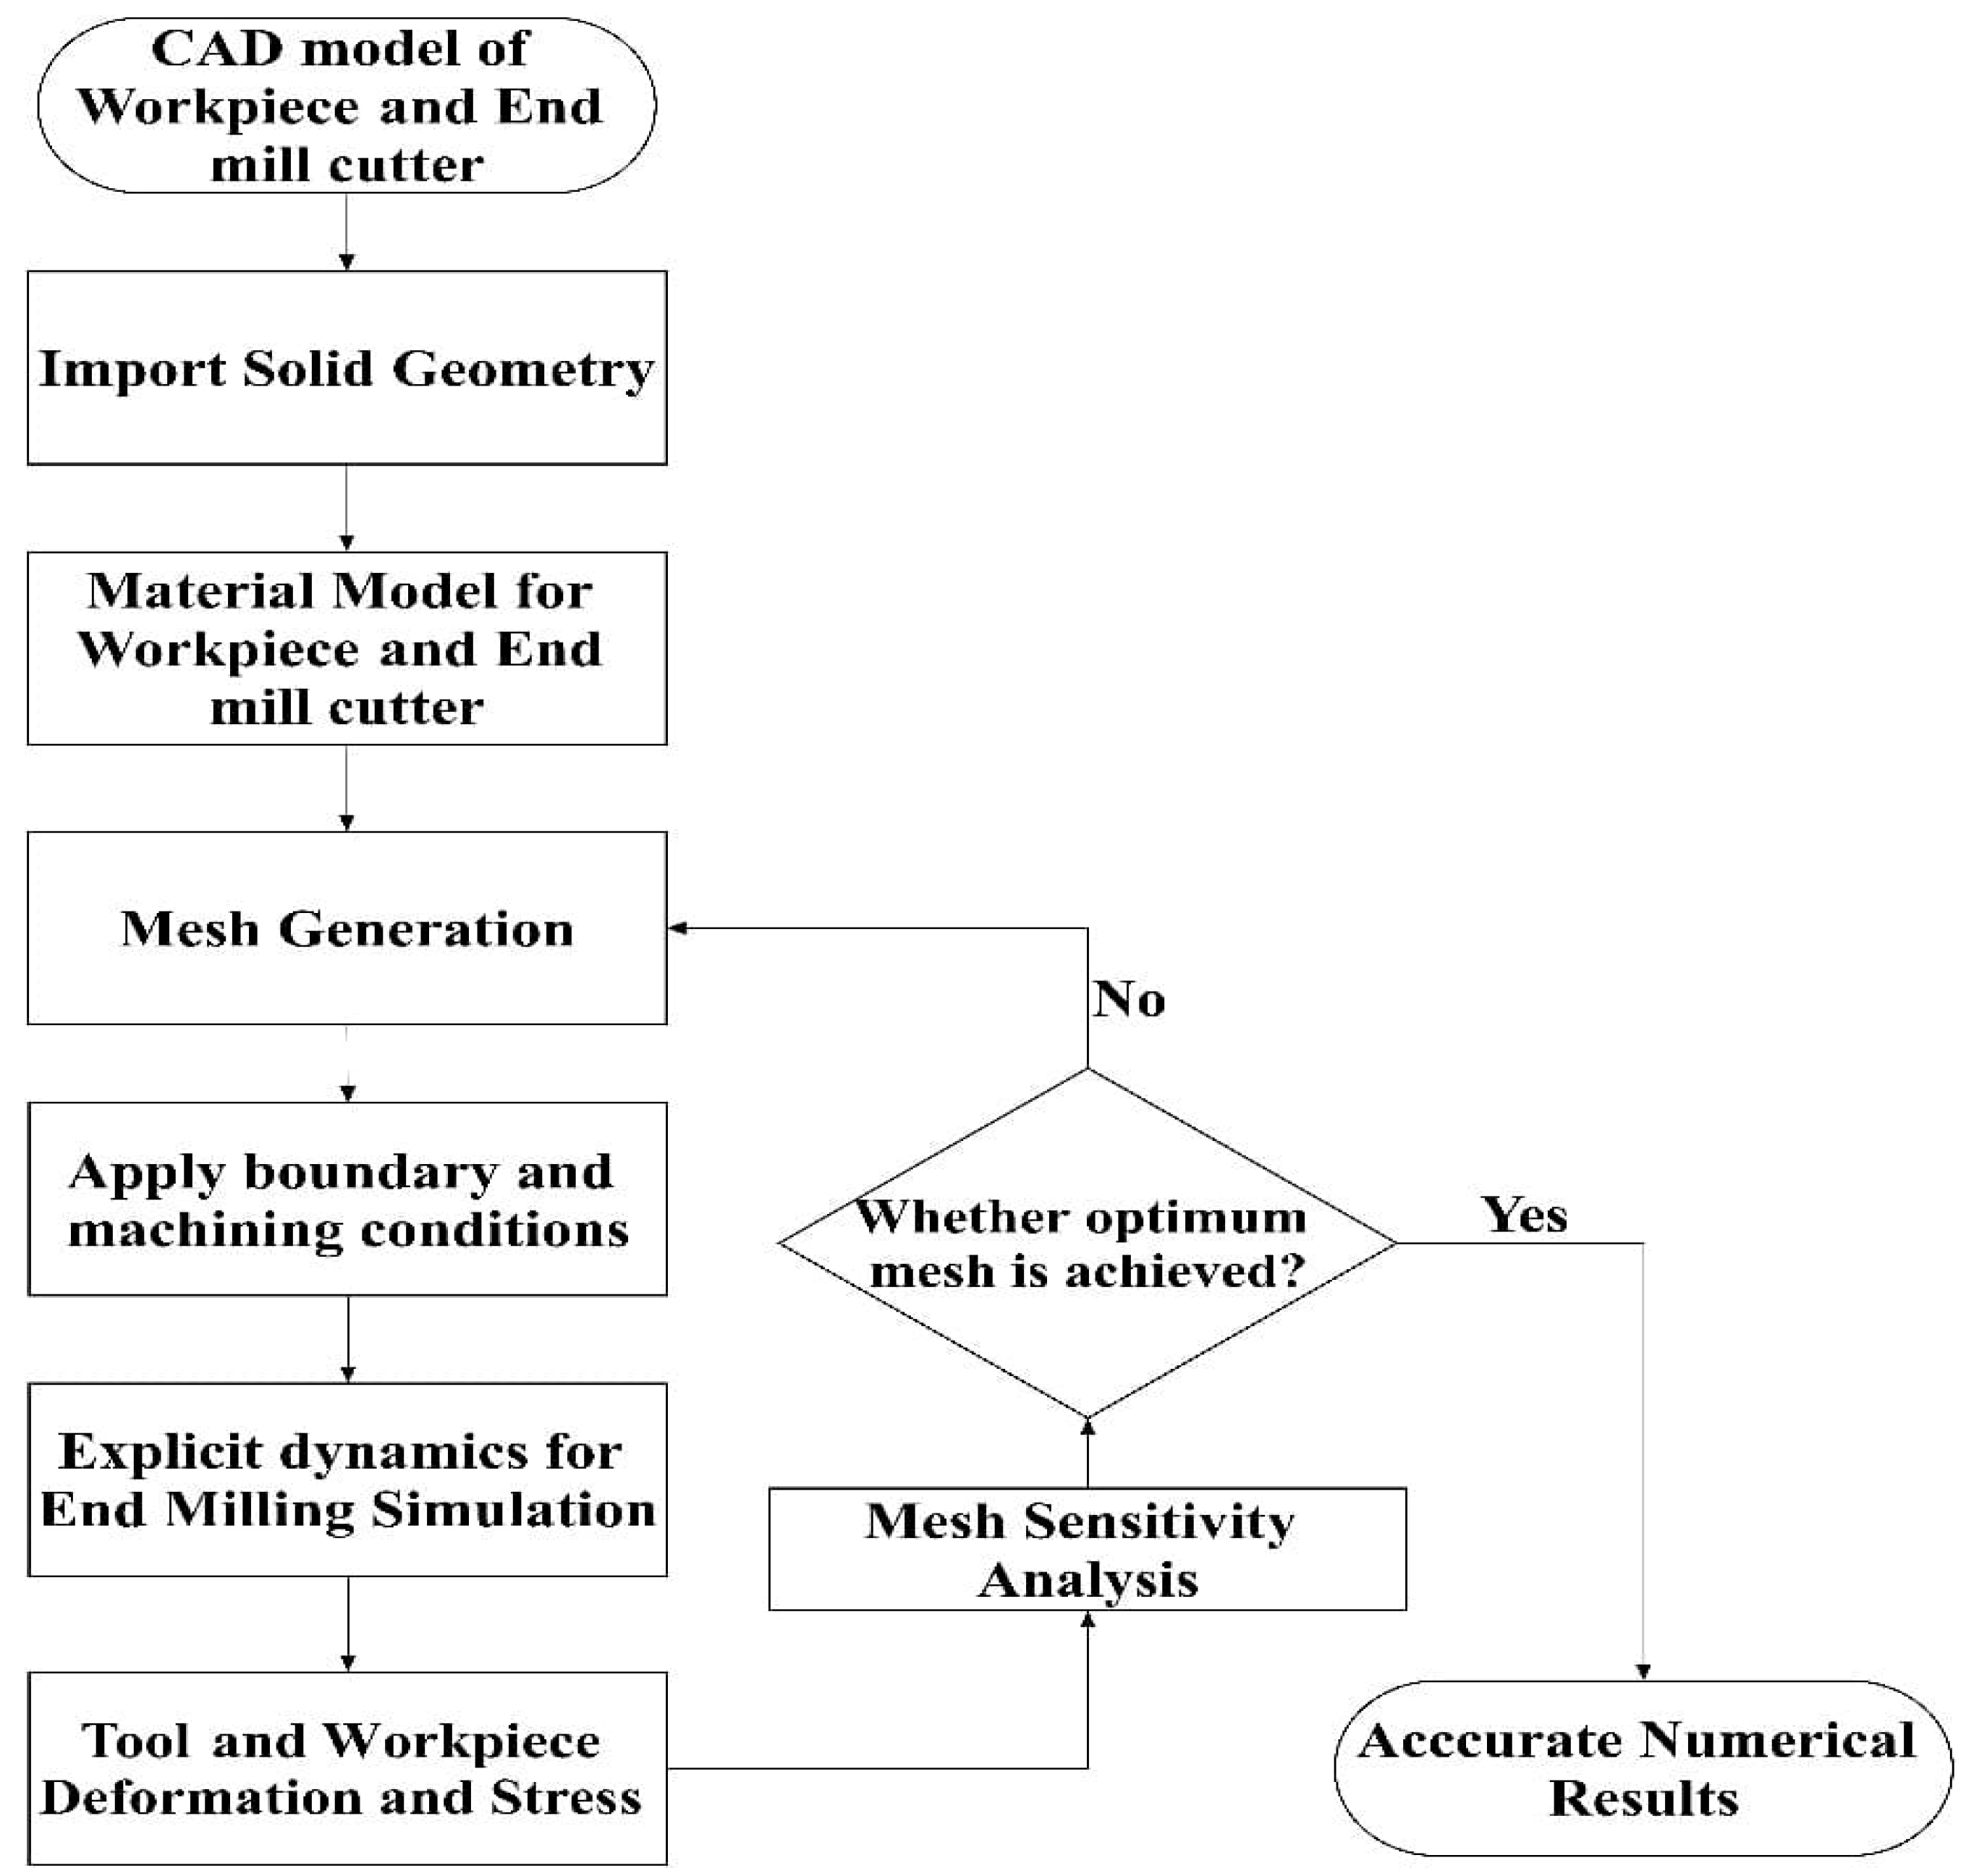
The methodology described in Figure 1 is a systematic approach to simulating an end-milling process. The first step is to develop a 3D model of the workpiece and tool that accurately represents their geometry and relative positions. The second step involves developing a finite element model of the workpiece and tool by defining the material properties, mesh size, boundary conditions, and loading conditions. In the third step, explicit dynamic analysis is carried out on the finite element model to model the machining process, including the workpiece and tool’s elastic deformation and stress values. Finally, the results obtained from the simulation are analyzed, including stress and deformation values of the workpiece and tool, to identify potential issues and areas for improvement. This methodology can assist in optimizing the milling process by providing insight into the behaviour of the workpiece and tool while the machining operation is being carried out.

Figure 1.
Methodology.
2.1. The Workpiece and End-Mill Cutter’s CAD Model
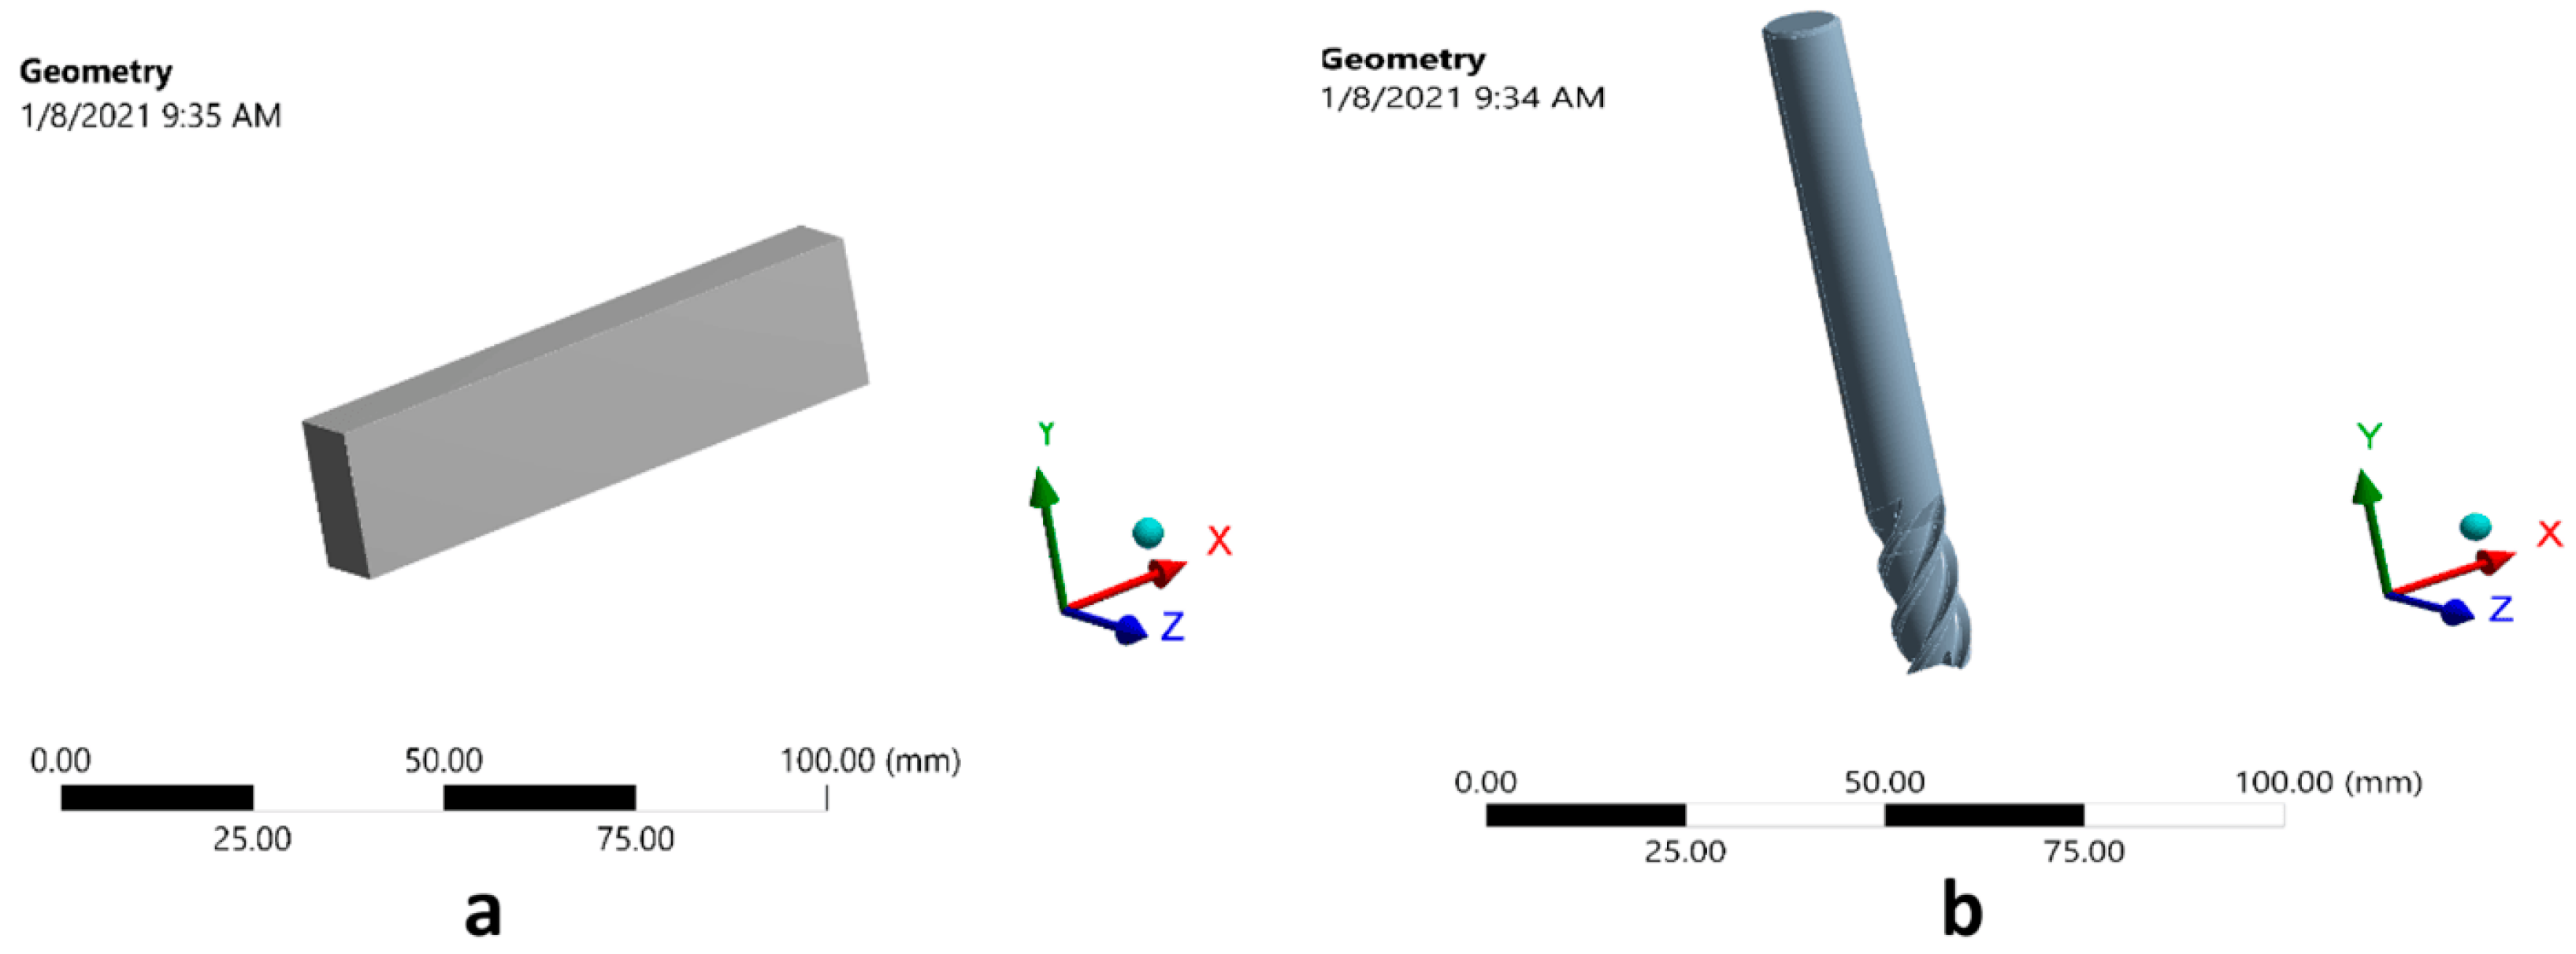
A representation of the CAD geometry created for the workpiece can be seen in Figure 2a. The workpiece is a prismatic bar of size 80 × 20 × 10 mm. Figure 2b shows the CAD model of an end-mill cutter with three flutes and a dimension of 8 mm.
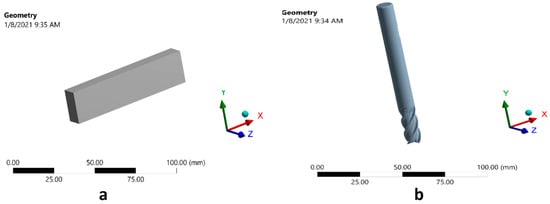
Figure 2.
CAD geometry of workpiece and end-mill cutter. (a) Workpiece. (b) End-mill cutter.
2.2. The FEM of the Workpiece and End-Mill Cutter and Meshing Strategy
We utilized FE simulations to overcome these constraints, as performing, analyzing, and evaluating physical machining processes can be time-consuming, costly, and complex. Our FE model was validated against experimental results in the literature [14] to ensure accuracy, replicating similar machining conditions. These validation steps confirmed the model’s reliability before it was applied to further simulations in this study. In the simulation of end milling, the depth of cut was set at 5 mm, the breadth was also set at 5 mm, and the length was set at 40 mm.
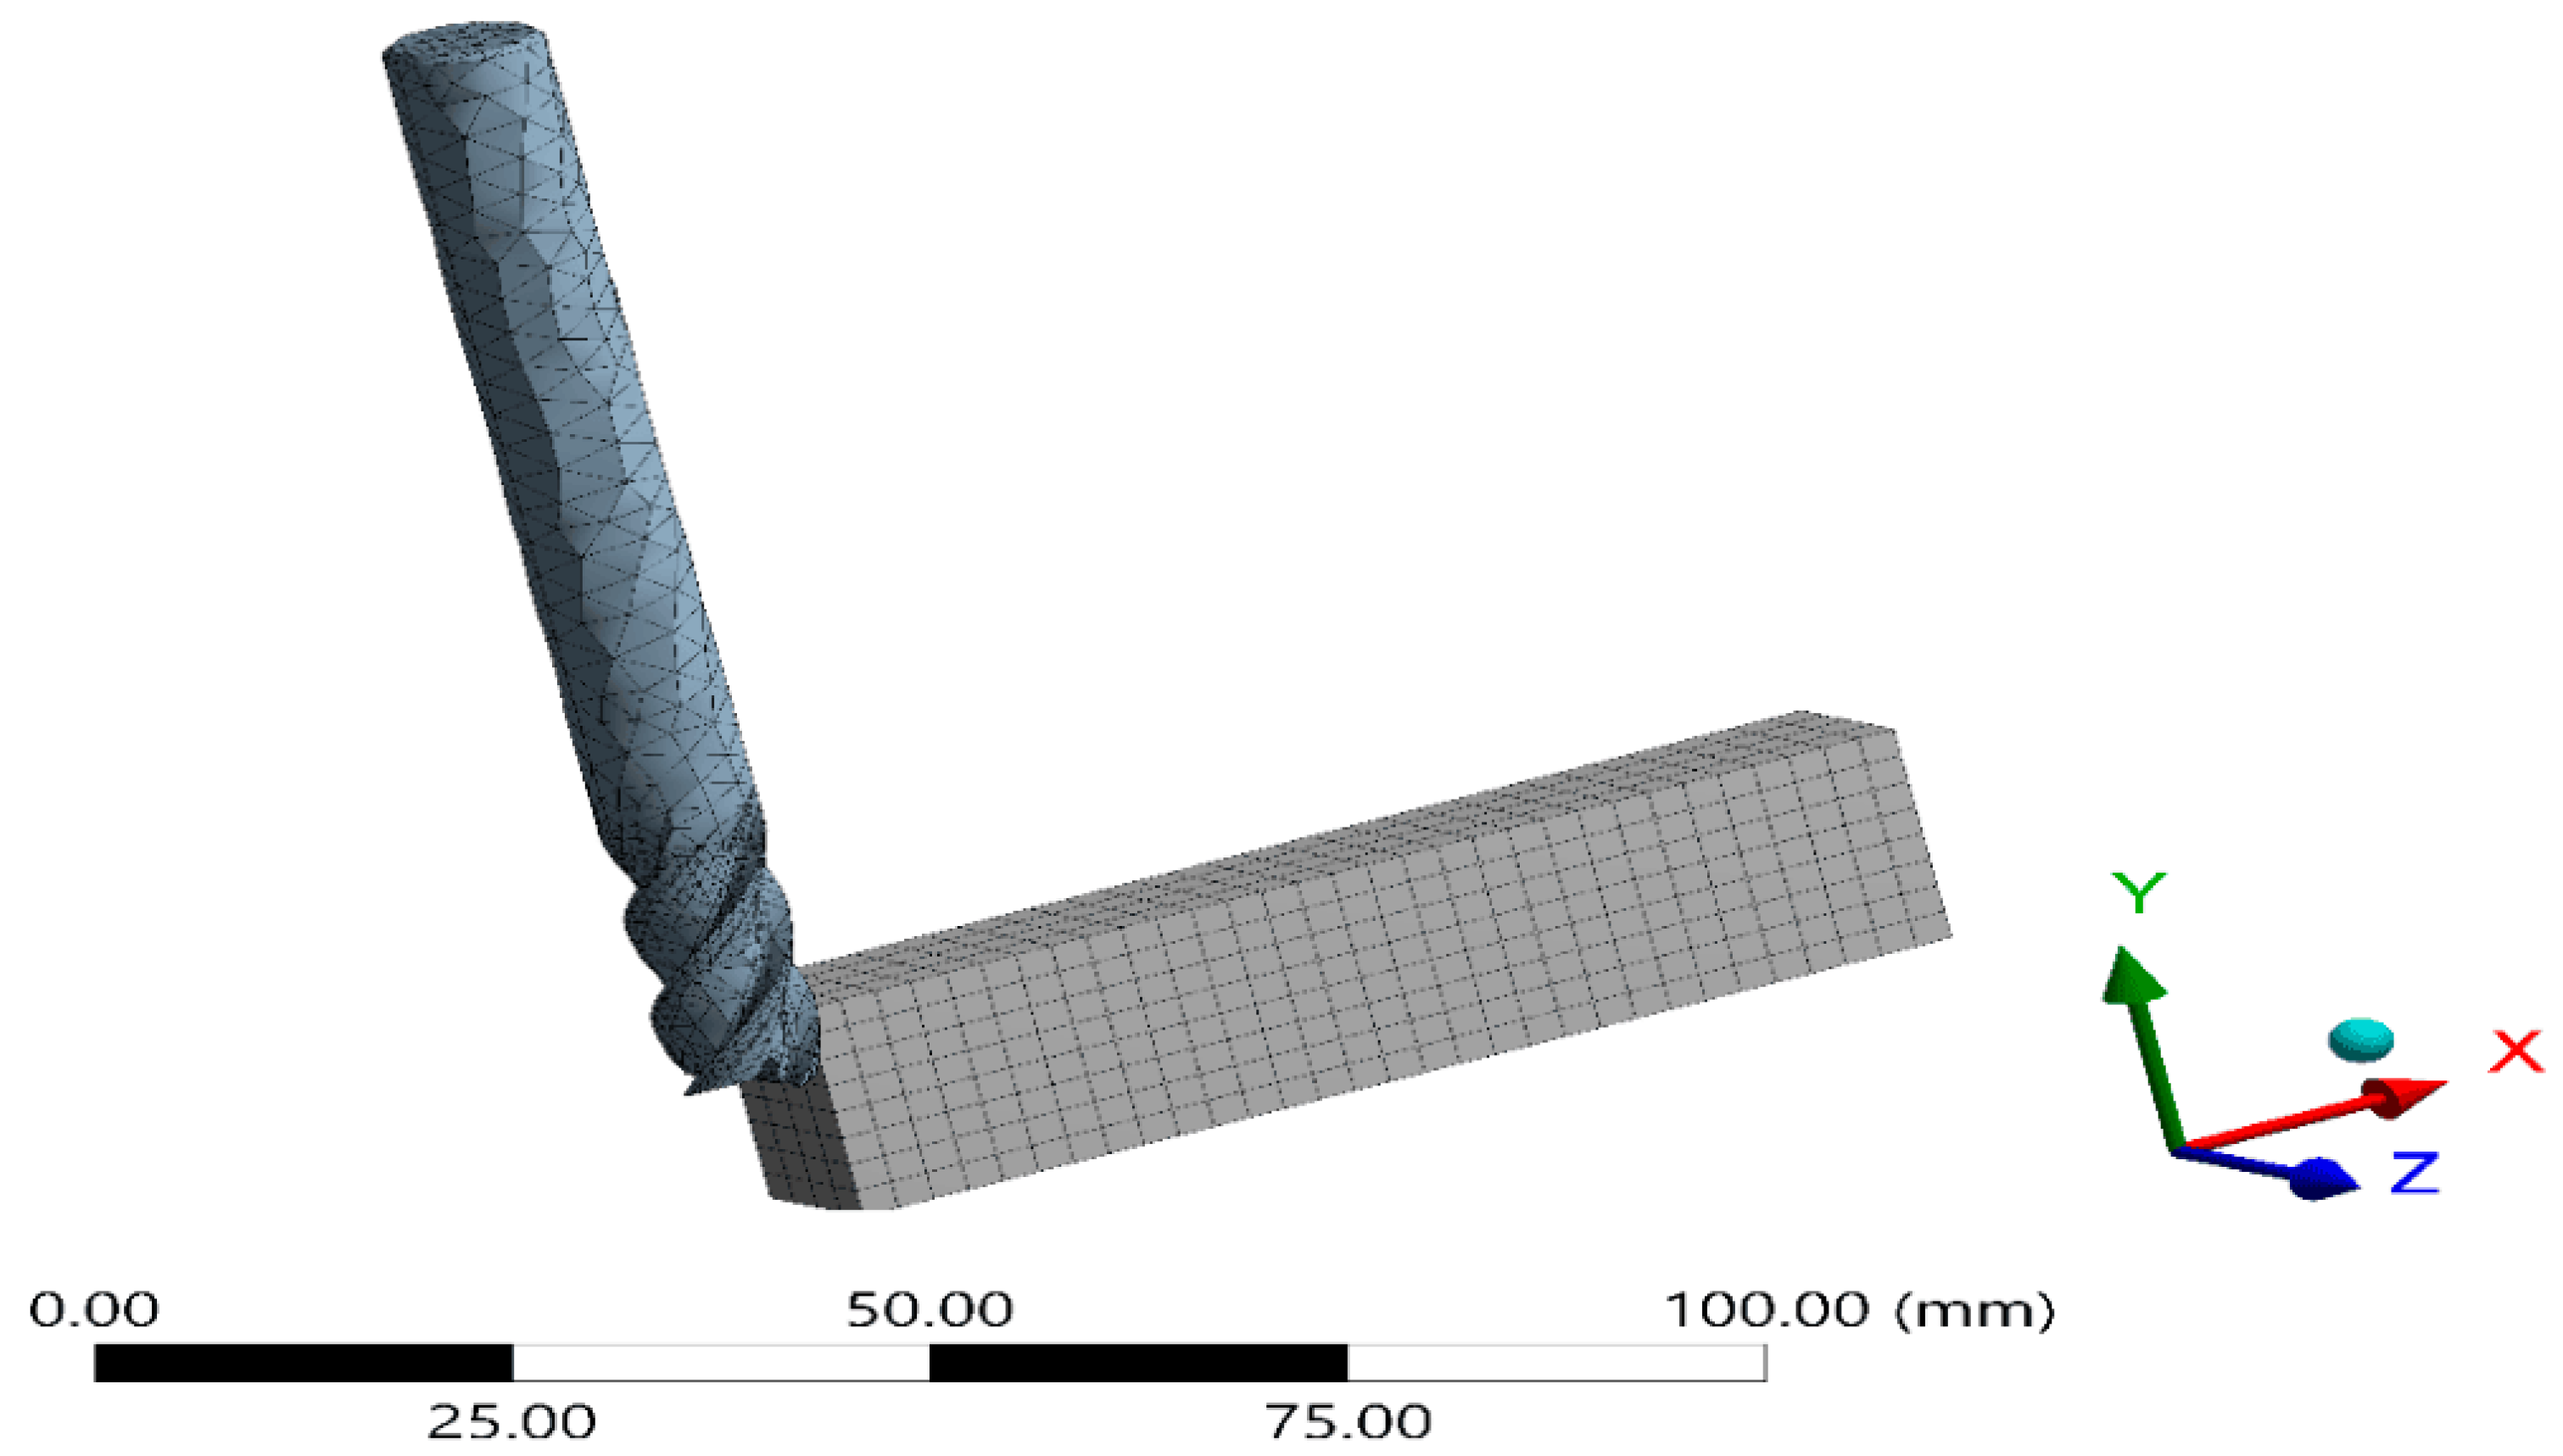
The meshing technique uses various element types for the tool and the workpiece to balance accuracy and computational economy. Tetrahedral components are utilized for cutting tools because of their complicated geometry with curved surfaces, which allows for a more precise representation of the shape. The workpiece is meshed using hexahedral elements, which are more appropriate for its relatively simple, homogeneous geometry. A mesh sensitivity analysis establishes the best mesh size, ensuring the mesh density adequately captures stress, strain, and temperature distributions while reducing computing costs. Figure 3 depicts the finite element model of a workpiece and an end-mill cutter, described in detail.
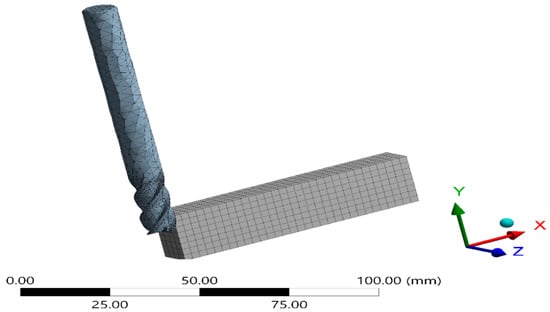
Figure 3.
FE model of the workpiece and end-mill cutter.
2.3. Analysis of the Boundary Conditions’ Explicit Dynamics
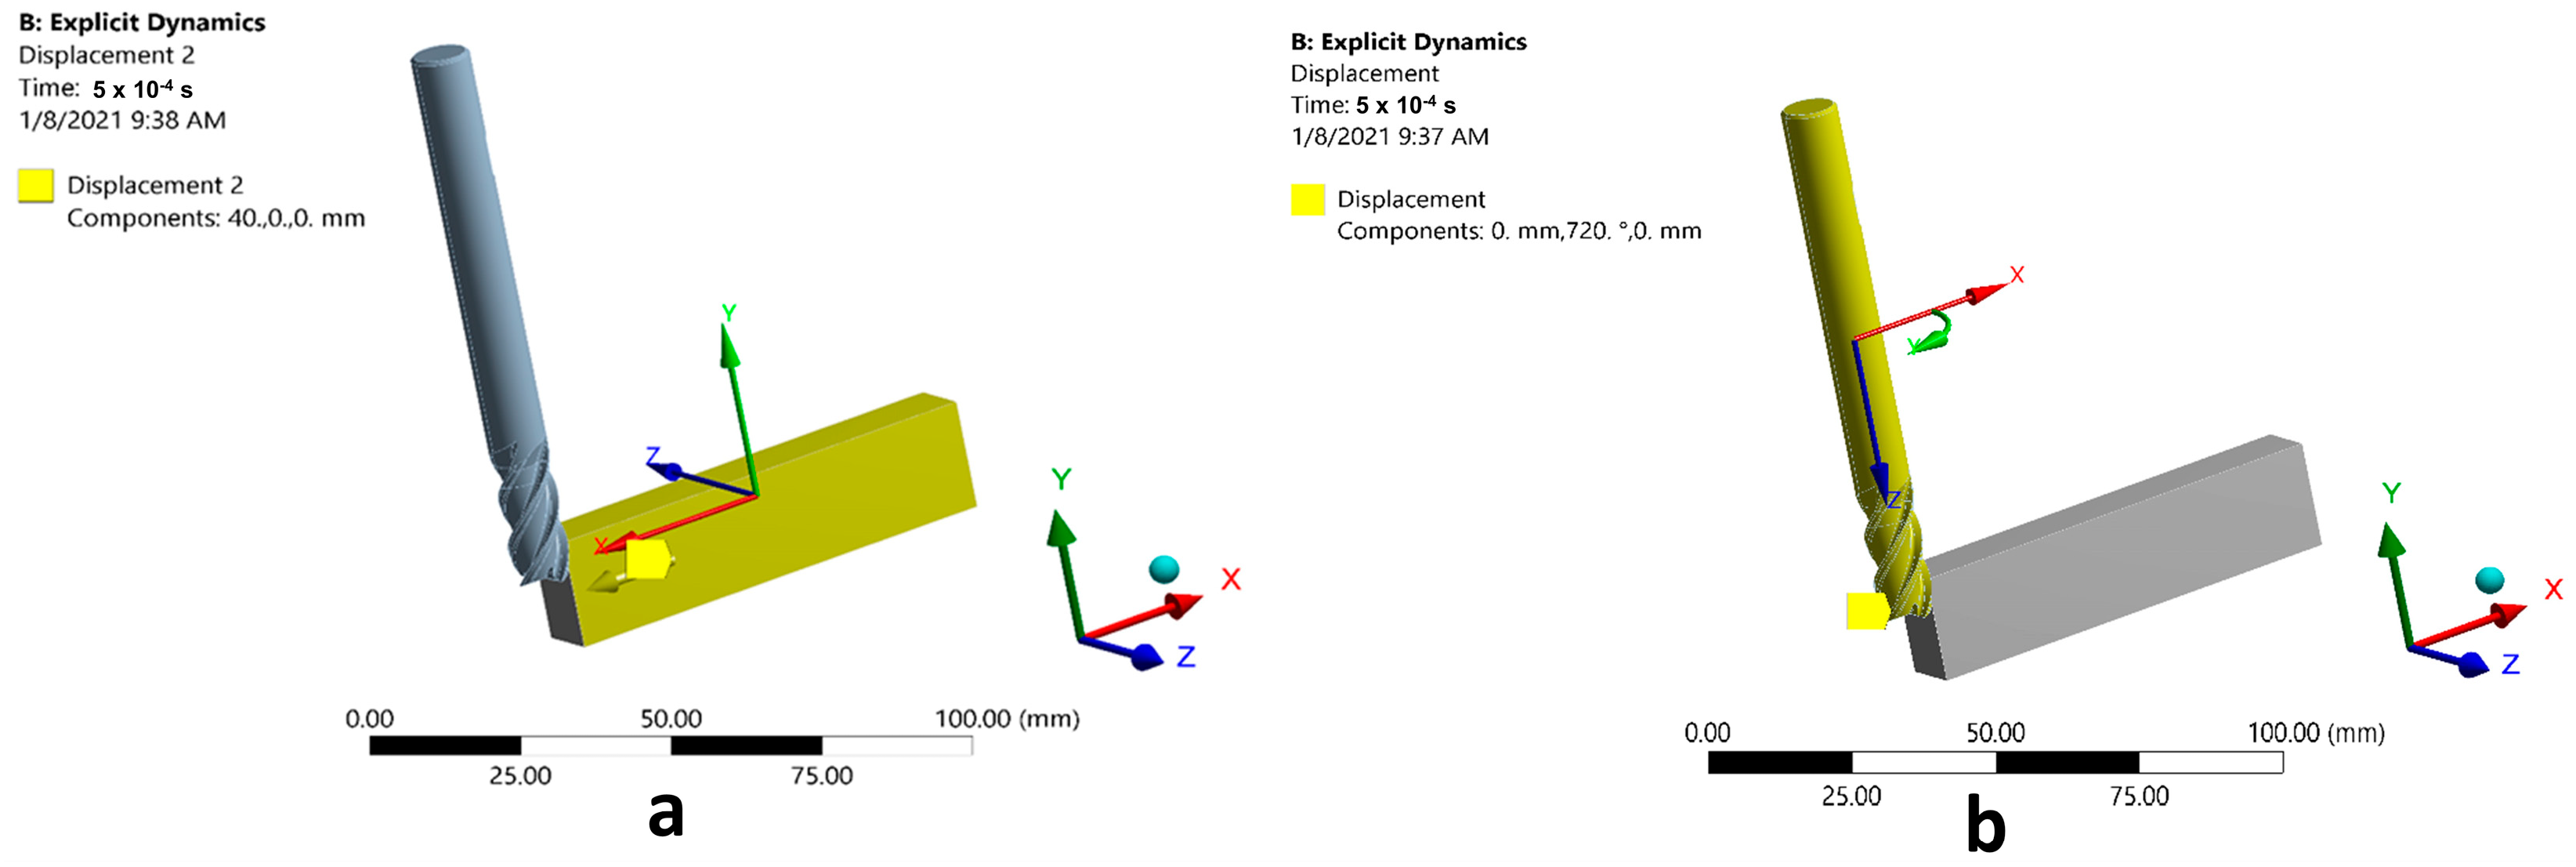
The workpiece and cutting tool boundary conditions are precisely outlined to reproduce the final milling process accurately. The workpiece is limited on its bottom and side surfaces, preventing any movement matching real-world clamping conditions. Furthermore, the workpiece translation in the x-axis direction is set to 40 mm, which simulates the feed. The tool’s motion is executed as a rotation. Specifically, the end-mill cutter rotates clockwise. Figure 4 illustrates the boundary condition defined for the workpiece and end-mill cutter. A frictional contact is established between the tool and the workpiece to simulate the interaction during milling. The end mill cutting blades are regarded as the target body, while the workpiece is the target body, as seen in Figure 5. The tool–workpiece interface frictional forces are appropriately represented by setting the static and dynamic friction coefficients to 0.4 and 0.2.
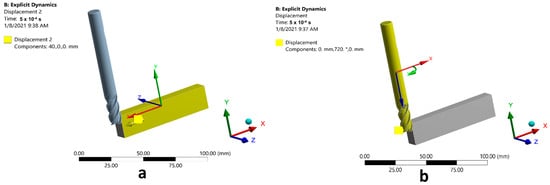
Figure 4.
Boundary condition. (a) Workpiece displacement. (b) End-mill cutter displacement.
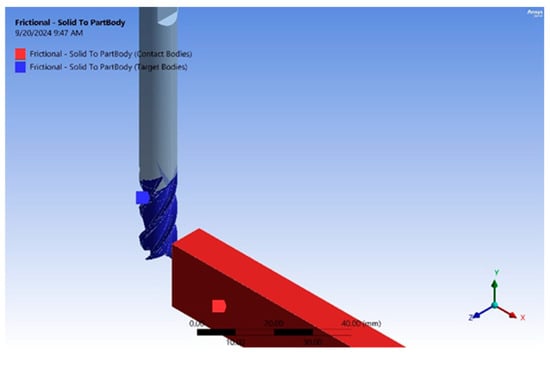
Figure 5.
Contact condition between the workpiece and end-mill cutter.
The friction interaction between the tool and workpiece is defined based on findings from previous literature, which investigated the sliding friction between AISI 1045 steel and carbide tools. According to these studies, the coefficient of friction was reported to range between 0.2 and 0.7 [15,16,17]. For this analysis, the lower value of 0.2 is assumed as the kinetic coefficient of friction, as it typically represents conditions of sustained motion. Meanwhile, a value of 0.4 is selected for the static coefficient of friction, representing an intermediate assumption between reported limits and accounting for initial resistance to motion. Further, the coefficient of friction affects deformation and stress in machining. Higher friction increases heat, tool wear, and stress, leading to more deformation in the workpiece and tool. To achieve smoother cutting, less wear, and improved machining accuracy, friction must be reduced significantly.
2.4. Material Properties
The Johnson–Cook explicit dynamics material and failure model parameters for AISI1045 are selected for the workpiece material. Tin carbide was chosen as the material for the tool. The selected Johnson–Cook material parameters for the workpiece, including an initial yield stress of 553.1 MPa, a hardening constant of 600.8 MPa, and a thermal softening exponent of 1, are tailored for explicit dynamic analysis to accurately model the material’s behaviour under high strain rates and varying temperatures during the simulation.
2.5. Assumptions in FEA
The workpiece is elastic, whereas the tool is rigid. Assuming the tool is rigid implies it does not deform under cutting forces. It simplifies the simulation by reducing the computational complexity, since the tool’s geometry and material properties do not need to be modelled in detail. The tool–workpiece interaction can then be examined, with particular focus on how the workpiece material behaves under milling.
3. Result and Analysis
A complete investigation of the tool–workpiece interaction is required to understand chip flow and burr formation in a simulated milling environment. Figure 6a shows the workpiece’s deformation over a simulation period of 5 × 10⁻⁴ s. The highest distortion measured in the workpiece is 0.1309 mm. This localized distortion is concentrated around the cutting edge, indicating substantial plastic deformation in this area. Such deformations are consistent with the material’s response to cutting forces, which might result in burr formation, particularly at the workpiece’s edges. Similarly, Figure 6b shows the cutting tool’s deformation, which reaches a maximum of 0.01054 mm. While the tool’s deformation is modest compared to the workpiece, this conclusion is essential in understanding tool wear and fatigue over time. Further examination of the deformation field might reveal places where the tool may be likely to encounter a greater stress concentration, resulting in wear.
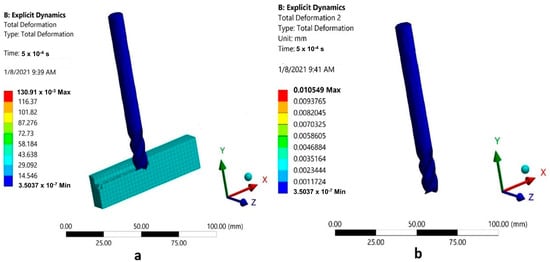
Figure 6.
Total deformation. (a) Workpiece. (b) Cutting tool.
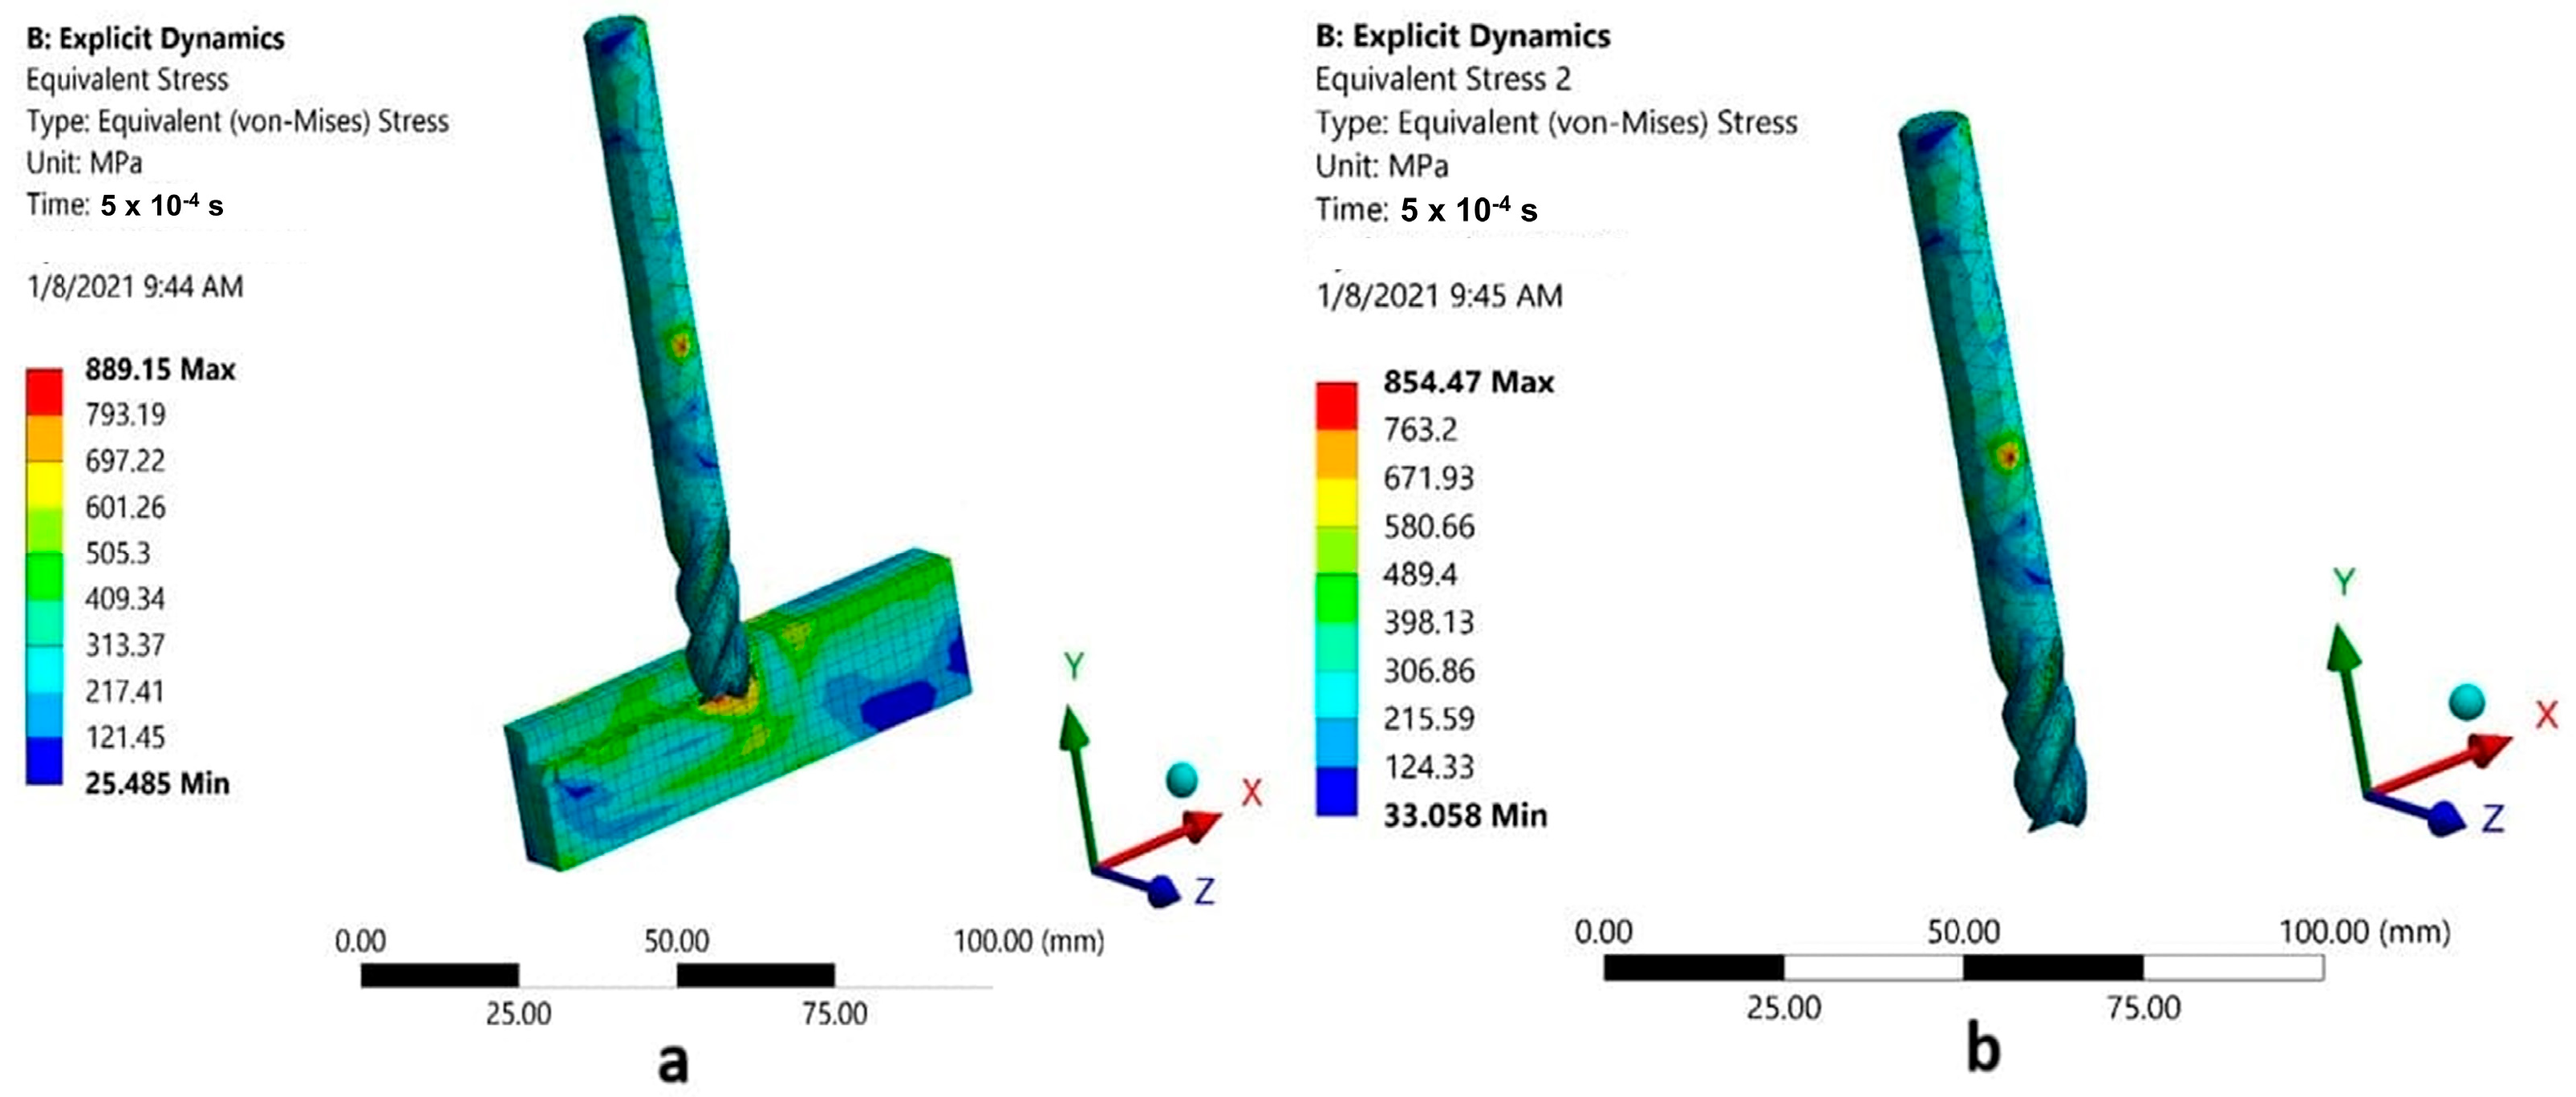
Figure 7a shows the equivalent von Mises stress across the workpiece during milling, with a maximum measured stress of 889.15 MPa. As expected, the highest stress levels are found along the tool–workpiece interface, given the direct contact and cutting forces involved. These stress concentrations may impact the microstructural changes in the workpiece, influencing its mechanical properties and surface quality after machining. These data are crucial for adjusting cutting parameters to reduce stress and surface flaws. The cutting tool’s stress distribution is depicted in Figure 7b, where the most significant equivalent stress is 854.47 MPa. Although the yield strength of conventional carbide tools is higher than this stress level, constant exposure to this kind of stress can lead to slow tool degradation and eventual failure. By analyzing this stress distribution, we can forecast the sections of the tool that need coatings or design changes to prolong tool life.
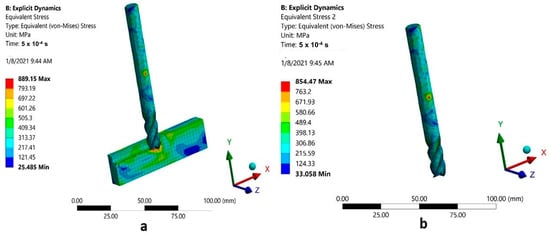
Figure 7.
Equivalent stress. (a) Workpiece. (b) Cutting tool.
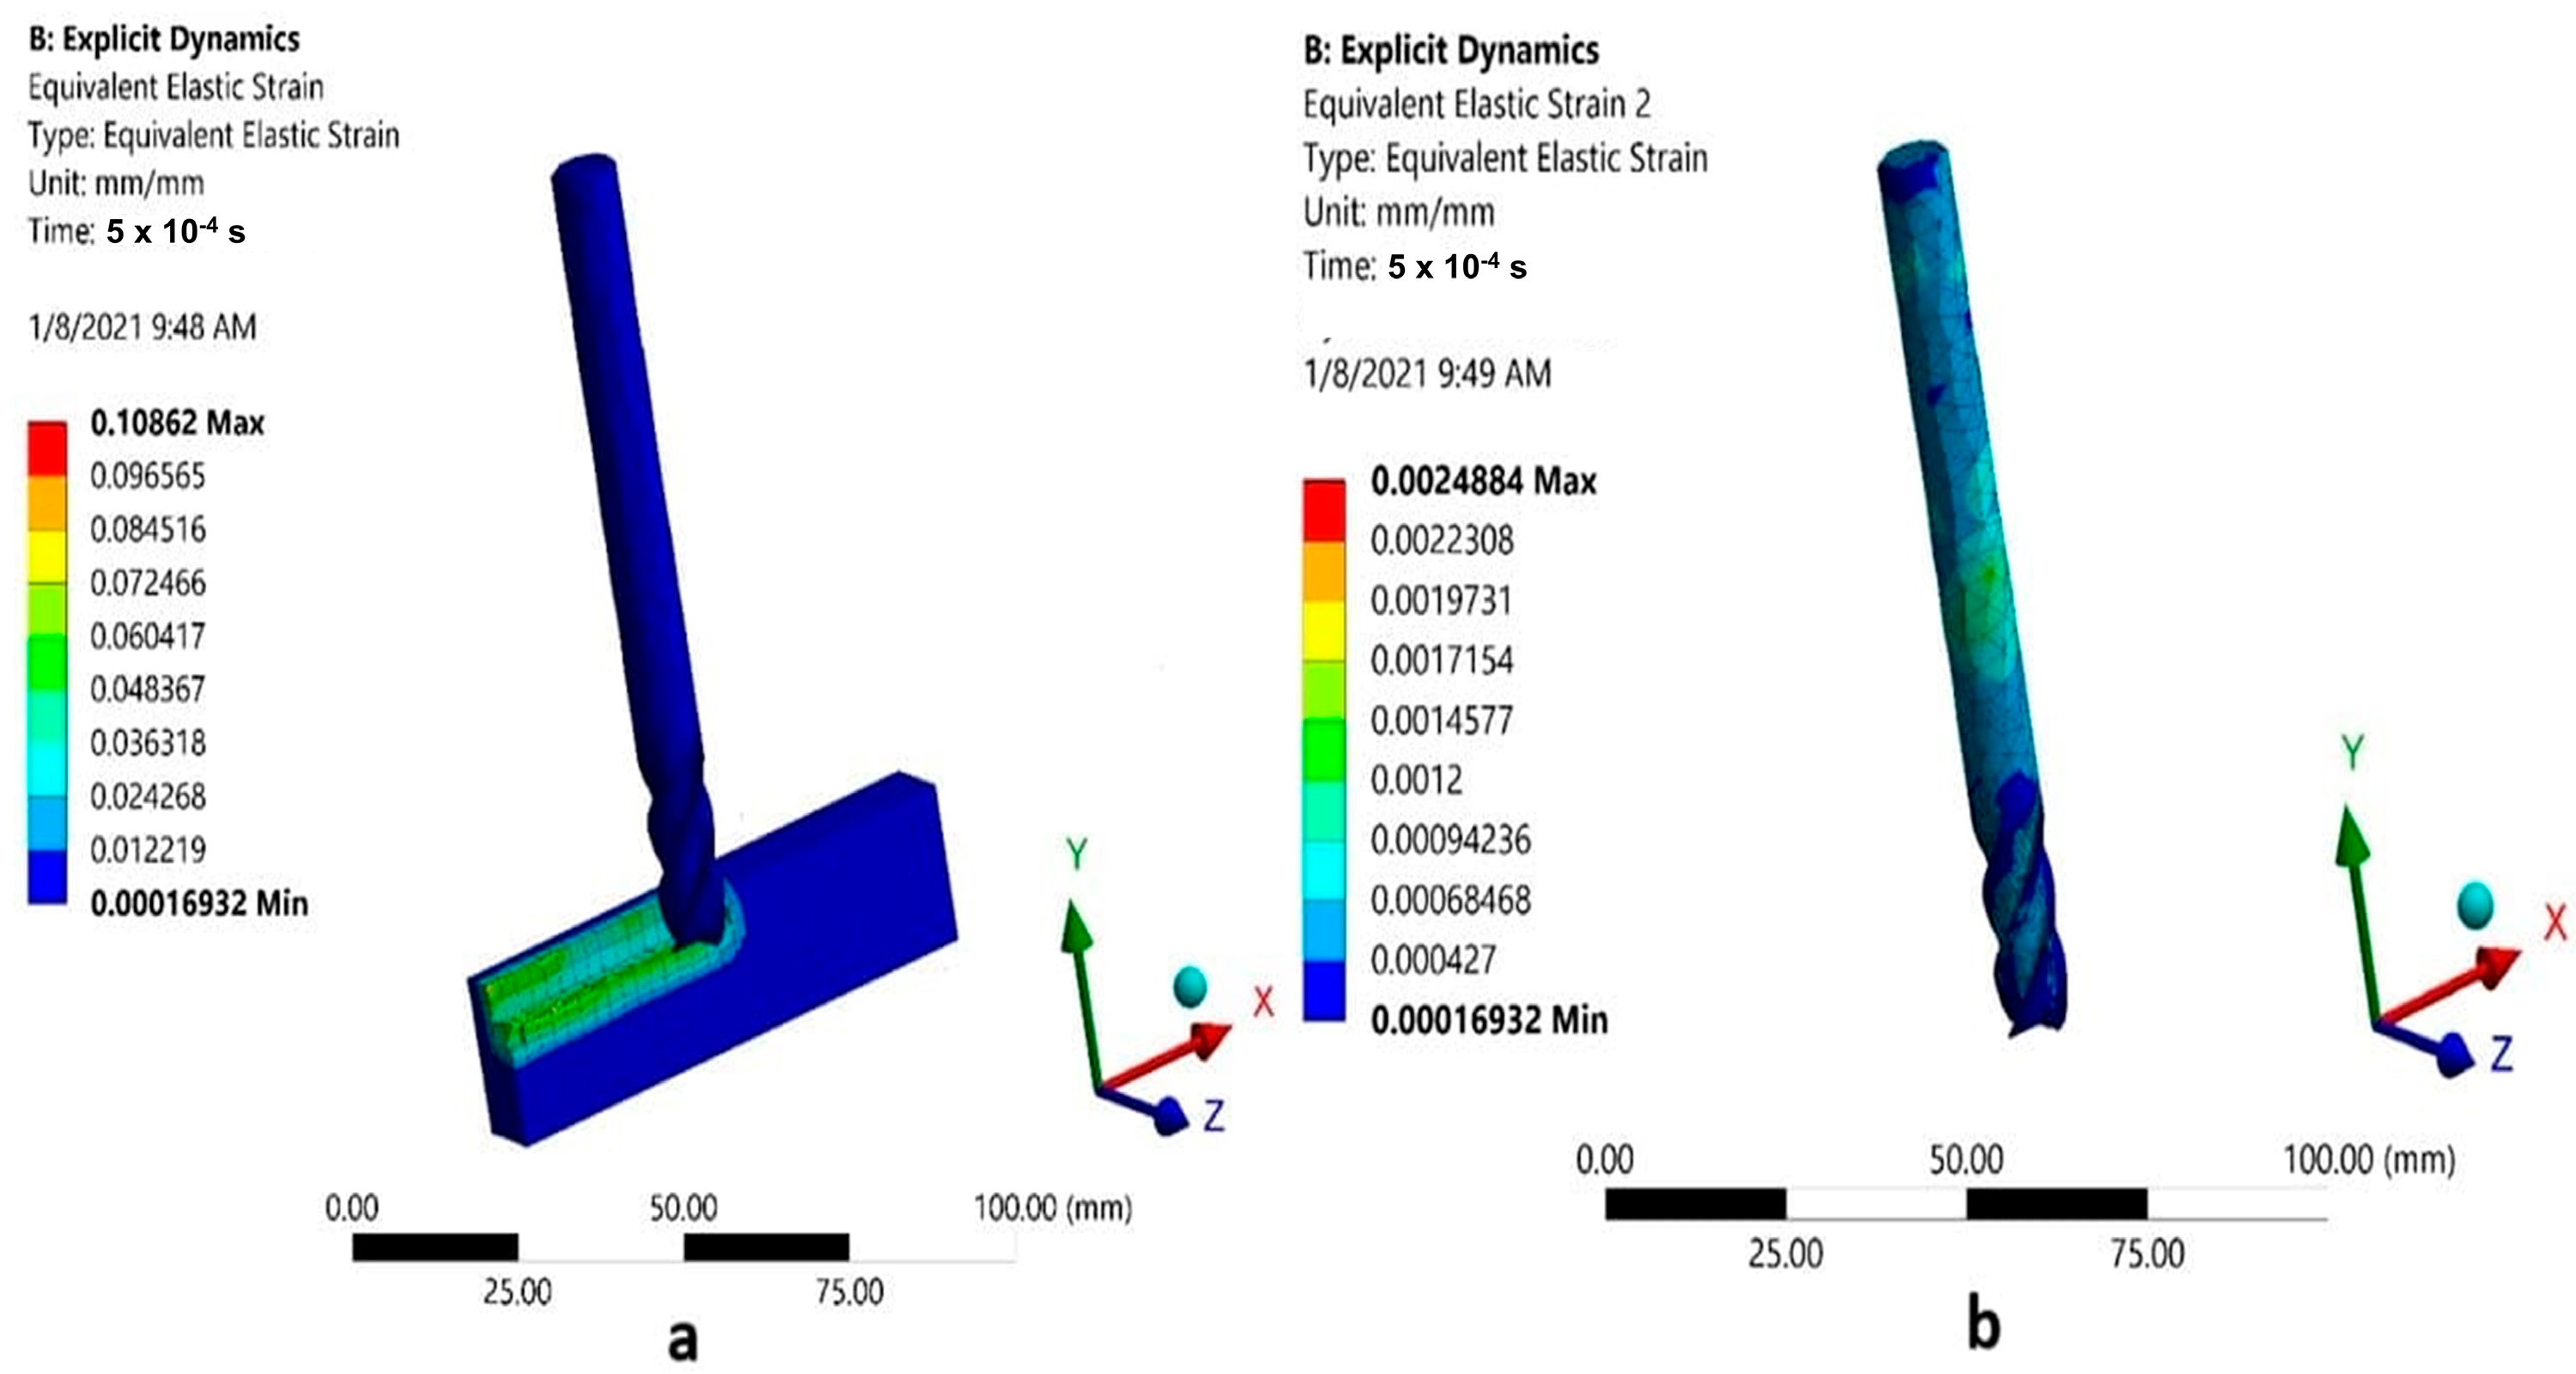
A representation of the strain distributions in the workpiece and the tool is shown in Figure 8a and Figure 8b, respectively. The workpiece sustains a maximum equivalent strain of 0.108, which is primarily concentrated at the point of contact with the cutting edge. This strain level indicates plastic deformation, directly impacting the material removal rate and machined surface quality. In contrast, the tool strain remains very low (0.002), indicating that the tool maintains structural integrity during machining. However, more investigation over more extended time periods or at higher cutting speeds may reveal more about the tool’s long-term behaviour.

Figure 8.
Equivalent strain. (a) Workpiece. (b) Cutting tool.
Improving surface roughness and machining quality requires a thorough understanding of workpiece deformation behaviour. It is possible to study the stress and deformation distributions to identify areas where excessive deformation could lead to imperfections or roughness. This understanding is essential for maintaining high-quality surfaces during machining and optimizing cutting parameters. In addition, the data on stress and deformation offer valuable insights for enhancing fixture design optimization. Limiting deformation and stress under specific machining conditions can produce an appropriate fixture to firmly hold the workpiece, improving stability and precision throughout the milling operation.
4. Conclusions
The present study employed a 3D finite element modelling technique to accurately replicate the end-milling procedure on AISI 1045 steel. ANSYS Workbench enabled an explicit dynamic analysis in the suggested model, which allowed for a thorough investigation of the tool–workpiece interaction. The collected data yielded valuable insights into the deformation and stress distribution within the workpiece and the cutting tool during the end-milling process. The statistics on maximal deformation, equivalent stress, and equivalent strain were collected and presented with great attention to detail. This study highlights the significance of using cutting-edge computational approaches, such as explicit dynamic analysis, to comprehend and enhance machining operations. Engineers and manufacturers can optimize productivity, quality, and manufacturing costs if they have a precise understanding of the complex dynamics of the milling operation.
Further research might focus on improving machining settings and tool designs to increase efficiency and reduce the likelihood of tool wear and workpiece distortion. Furthermore, conducting experimental verification of the simulation outcomes could enhance the certainty level regarding the suggested model’s precision and dependability.
Author Contributions
Conceptualization, F.M.T.R.; methodology, R.S.; validation, R.S.; formal analysis, M.B.; investigation, F.M.T.R. and R.S.; writing—original draft preparation, M.B.; writing—review and editing, F.M.T.R.; visualization, P.S.; supervision, F.M.T.R. All authors have read and agreed to the published version of the manuscript.
Funding
This research received no external funding.
Institutional Review Board Statement
Not applicable.
Informed Consent Statement
Not applicable.
Data Availability Statement
The raw data supporting the conclusions of this article will be made available by the authors upon request.
Acknowledgments
The experiments were conducted using the facilities available in the Department of Mechanical Engineering at the National Engineering College, Kovilpatti 628503, Tamil Nadu, India.
Conflicts of Interest
The authors declare no conflicts of interest.
References
- Thepsonthi, T.; Özel, T. 3-D finite element process simulation of micro-end milling Ti-6Al-4Vtitanium alloy: Experimental validations on chip flow and tool wear. J. Mater. Process. Technol. 2015, 221, 128–145. [Google Scholar] [CrossRef]
- Rex, F.M.T.; Ravindran, D. An integrated approach for optimal fixture layout design. Proc. Inst. Mech. Eng. Part B J. Eng. Manuf. 2017, 231, 1217–1228. [Google Scholar] [CrossRef]
- Deepanraj, B.; Senthilkumar, N.; Hariharan, G.; Tamizharasan, T.; Bezabih, T.T. Numerical modelling, simulation, and analysis of the end-milling process using Deform-3D with experimental validation. Adv. Mater. Sci. Eng. 2022, 2022, 5692298. [Google Scholar] [CrossRef]
- Ren, Z.; Zhang, X.; Wang, Y.; Li, Z.; Liu, Z. Finite Element Analysis of the Milling of Ti6Al4V Titanium Alloy Laser Additive Manufacturing Parts. Appl. Sci. 2021, 11, 4813. [Google Scholar] [CrossRef]
- Davoudinejad, A.; Tosello, G.; Parenti, P.; Annoni, M. 3D Finite Element Simulation of Micro End-Milling by Considering the Effect of Tool Run-Out. Micromachines 2017, 8, 187. [Google Scholar] [CrossRef]
- Michael Thomas Rex, F.; Hariharasakthisudhan, P.; Andrews, A.; Prince Abraham, B. Optimization of flexible fixture layout to improve form quality using parametric finite element model and mixed discrete-integer genetic algorithm. Proc. Inst. Mech. Eng. Part C J. Mech. Eng. Sci. 2022, 236, 16–29. [Google Scholar] [CrossRef]
- Abbas, A.T.; El Rayes, M.M.; Al-Abduljabbar, A.A.; Ragab, A.E. Faycal Benyahia and Ahmed Elkaseer. Effects of Tool Edge Geometry and Cutting Conditions on the Performance Indicators in Dry Turning AISI 1045 Steel. Machines 2023, 11, 397. [Google Scholar] [CrossRef]
- Li, S.; Sui, J.; Ding, F.; Wu, S.; Chen, W.; Wang, C. Optimization of Milling Aluminum Alloy 6061-T6 using Modified Johnson-Cook Model. Simul. Model. Pract. Theory 2021, 111, 102330. [Google Scholar] [CrossRef]
- Michael Thomas Rex, F.; Ravindran, D.; Andrews, A.; Prince Abraham, B. An Integrated Approach for Fixture Layout Design and Clamping Force Optimization. J. Sci. Ind. Res. 2022, 81, 1204–1216. [Google Scholar]
- Pei, L.; Shu, X. Investigation of the turning process of the TC21 titanium alloy: Experimental analysis and 3D simulation. Proc. Inst. Mech. Eng. Part E J. Process Mech. Eng. 2021, 235, 489–498. [Google Scholar] [CrossRef]
- Wang, F.; Zhao, J.; Li, A.; Zhu, N.; Zhao, J. Three-dimensional finite element modeling of high-speed end milling operations of Ti-6Al-4V. Proc. Inst. Mech. Eng. Part B J. Eng. Manuf. 2014, 228, 893–902. [Google Scholar] [CrossRef]
- Davoudinejad, A.; Parenti, P.; Annoni, M. 3D finite element prediction of chip flow, burr formation, and cutting forces in micro end-milling of aluminum 6061-T6. Front. Mech. Eng. 2017, 12, 203–214. [Google Scholar] [CrossRef]
- Mamedov, A.; Lazoglu, I. Thermal analysis of micro milling titanium alloy Ti–6Al–4V. J. Mater. Process. Technol. 2016, 229, 659–667. [Google Scholar] [CrossRef]
- Jalili Saffar, R.; Razfar, M.R.; Zarei, O.; Ghassemieh, E. Simulation of three-dimension cutting force and tool deflection in the end milling operation based on finite element method. Simul. Model. Pract. Theory 2008, 16, 1677–1688. [Google Scholar] [CrossRef]
- Abdelali, H.B.; Claudin, C.; Rech, J.; Salem, W.B.; Kapsa, P.; Dogui, A. Experimental characterization of friction coefficient at the tool–chip–workpiece interface during dry cutting of AISI 1045. Wear 2012, 286, 108–115. [Google Scholar] [CrossRef]
- Ma, J.; Duong, N.H.; Lei, S. Finite element investigation of friction and wear of microgrooved cutting tool in dry machining of AISI 1045 steel. Proc. Inst. Mech. Eng. Part J J. Eng. Tribol. 2015, 229, 449–464. [Google Scholar] [CrossRef]
- Rech, J.; Claudin, C.; D’eramo, E. Identification of a friction model—Application to the context of dry cutting of an AISI 1045 annealed steel with a TiN-coated carbide tool. Tribol. Int. 2009, 42, 738–744. [Google Scholar] [CrossRef]


Disclaimer/Publisher’s Note: The statements, opinions and data contained in all publications are solely those of the individual author(s) and contributor(s) and not of MDPI and/or the editor(s). MDPI and/or the editor(s) disclaim responsibility for any injury to people or property resulting from any ideas, methods, instructions or products referred to in the content. |
© 2025 by the authors. Licensee MDPI, Basel, Switzerland. This article is an open access article distributed under the terms and conditions of the Creative Commons Attribution (CC BY) license (https://creativecommons.org/licenses/by/4.0/).