Abstract
The study presents a real-time object detection system for tap water contamination, employing the YOLOv8 model to identify specific pollutants, including algae, ants, and sand. The presence of these pollutants poses significant risks to water quality and public health, particularly in urban settings. To address these concerns, a high-precision object detection system was implemented to monitor and analyze water samples effectively. The developed system integrates unconventional image processing, enabling the accurate identification of foreign objects and potential contaminants with high accuracy. The data collected were utilized to train the YOLOv8 model, ensuring reliable performance across diverse environmental conditions. The system provides timely detection of contaminants through real-time analysis, facilitating proactive water quality management. The performance of the YOLOv8 model was systematically evaluated using key metrics, including precision, recall, and inference speed, to validate its effectiveness. This object detection device represents a critical advancement in safeguarding public health by incorporating machine learning into existing water quality monitoring frameworks, ultimately supporting sustainable and safe urban water management.
1. Introduction
Ensuring the safety and quality of tap water is a fundamental public health concern, as the presence of foreign substances, such as algae, ants, and sand, can pose significant health risks. The detection and classification of these contaminants are essential for maintaining clean and safe drinking water. To address this challenge, this study proposes a real-time object detection system capable of identifying and classifying such pollutants in tap water using the YOLOv8 deep learning model.
To accurately detect impurities in tap water, the YOLOv8 model’s performance must be rigorously evaluated using metrics such as precision, recall, and inference speed. These assessments determine the model’s effectiveness across varied environmental conditions. By integrating object detection and a machine learning system, the setup facilitates real-time monitoring, ensuring timely identification of contaminants. Additionally, an IoT-based approach is employed to enhance the monitoring process, allowing for early detection of hazardous substances. The use of IoT technology enables remote access to water quality data, improving resource management and system efficiency.
Despite advancements in water quality monitoring technology, existing systems are often limited in their ability to detect a broad range of contaminants in real time. Current solutions primarily focus on chemical parameters, such as pH and turbidity, while neglecting the classification of physical impurities with such contaminants. Moreover, many of these systems lack real-time alert mechanisms and remote monitoring capabilities, which are crucial for effective contamination management. This research addresses these limitations by implementing a real-time object detection system based on YOLOv8, thereby enhancing the accuracy and efficiency of water quality assessment.
2. Literature Review
Relevant information on the proposed system in relation to water monitoring, parameters, and the detection of foreign particles underwater was collected from previous research studies.
2.1. Classification of Tap Water Contaminants
Algae are an essential component of aquatic ecosystems, contributing to oxygen production and maintaining the food chain. When present in appropriate amounts, they support water biodiversity. However, excessive algal growth, often triggered by nutrient pollution and stagnant conditions, can degrade water quality and disrupt ecological balance. In particular, harmful algal blooms (HABs) are of increasing concern, as they can significantly impact the safety of tap water by introducing toxins and reducing water quality [1]. Sand particles contribute to water turbidity and sedimentation, affecting both its esthetic and safety aspects. Additionally, sand can carry contaminants such as heavy metals and organic compounds, further compromising water quality [2]. Insects, particularly ants, can also infiltrate water distribution systems, potentially introducing foreign materials that alter the safety and quality of the water supply [3].
2.2. IoT-Based Water Quality Monitoring
The use of a smart water quality monitoring (SWQM) system leveraging Internet of Things (IoT) technology enables the assessment of key parameters such as pH, temperature, turbidity, and electrical conductivity. In this system, the sensors are connected to an Arduino Uno. The collected data are transmitted to a .NET desktop application. The recorded data are then analyzed against predefined thresholds using a fast forest binary classifier, which determines whether the water meets potable standards [4].
2.3. Image Processing
Convolutional Neural Networks (CNNs) are highly effective for image classification and object detection, as they automatically extract relevant features from images. Convolution layers identify specific patterns while pooling layers reduce the size of feature maps without losing essential information. This ability to capture spatial hierarchies allows CNNs to accurately detect shapes and objects [5]. CNNs play a pivotal role in tasks such as image categorization and object detection. Their depth and flexibility enable models such as YOLOv8 to handle complex visual patterns. YOLOv8 is an advanced object detection model that integrates deep CNNs and Feature Pyramid Networks (FPNs) to detect objects of varying sizes in intricate environments, thereby improving accuracy and generalization in real-world scenarios [6]. Its optimized architecture includes an improved backbone, refined anchor boxes, and a decoupled head, all of which contribute to enhanced accuracy and computational efficiency. These advancements make YOLOv8 particularly well suited for real-time applications such as autonomous driving and video surveillance. The evolution of YOLO highlights the balance between accuracy and efficiency, which is crucial for practical implementations [7].
3. Methodology
3.1. System Framework
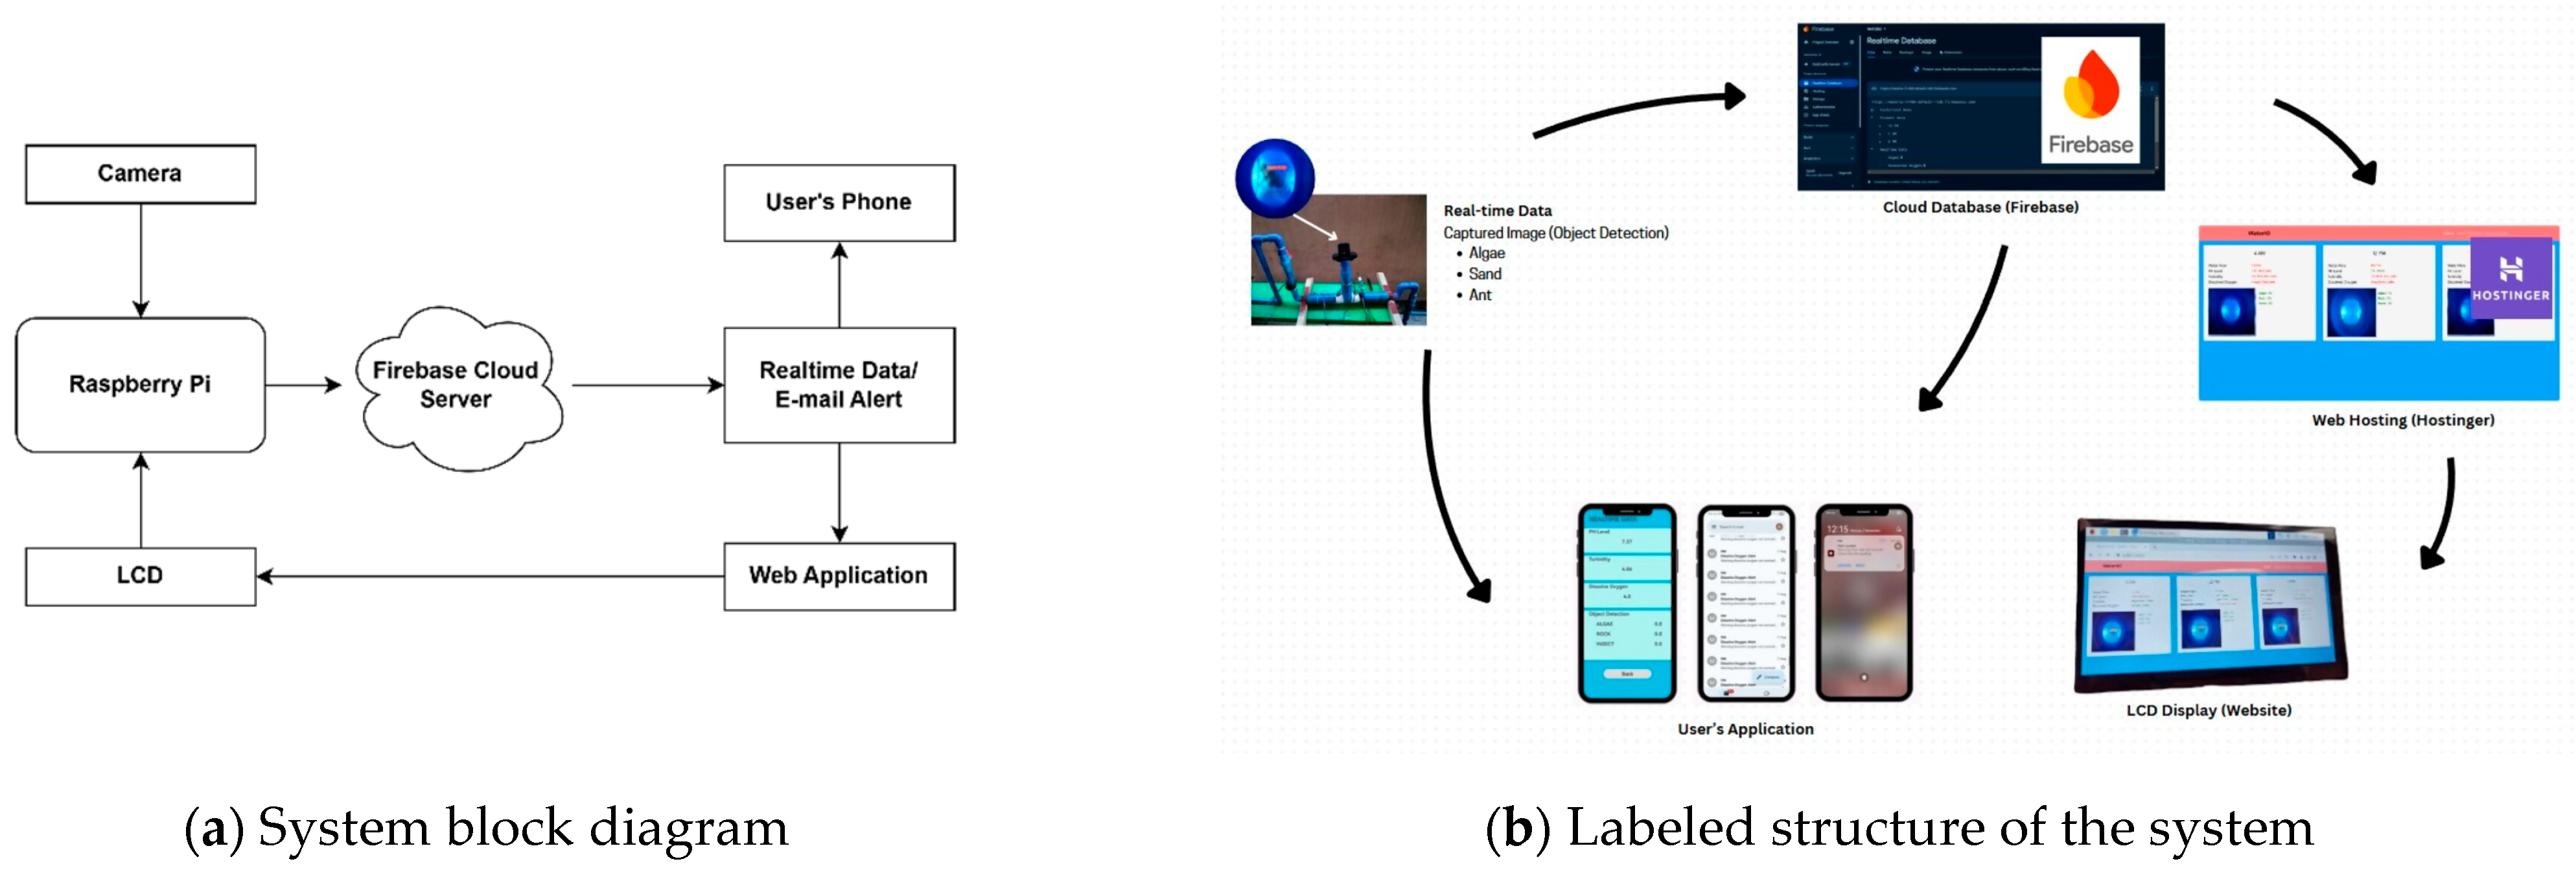
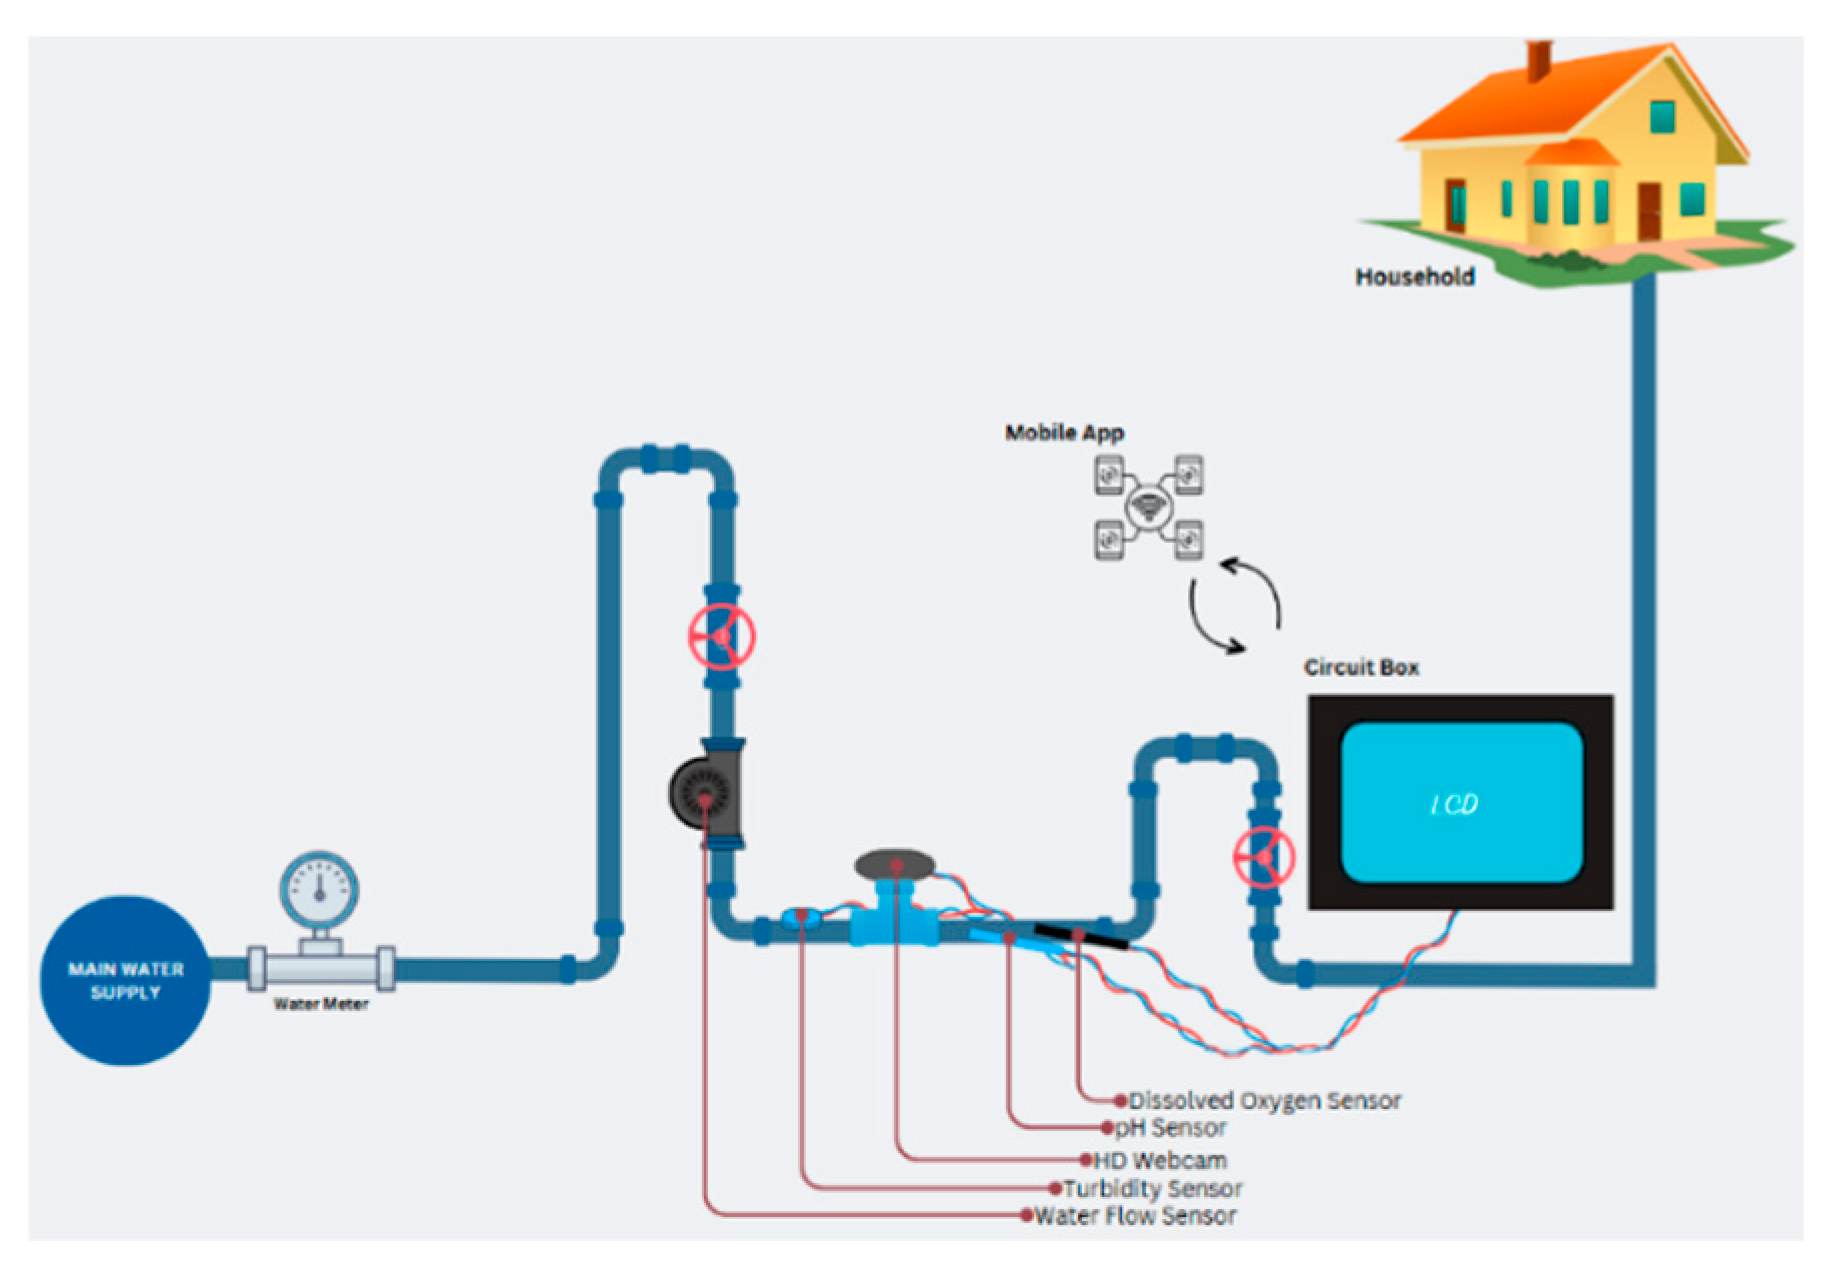
Figure 1 provides an overview of the system architecture and components of the IoT-based water monitoring system. The Raspberry Pi (RPI) serves as the main processing unit, handling data from the camera’s images. The raw data are sent to the RPI and stored in the cloud via Firebase version 11.0.2, enabling continuous and precise monitoring. The system alerts both the application and web hosting service if anomalies in the water quality are detected.

Figure 1.
Architecture and elements of the developed system.
The system is equipped with a 7-inch capacitive touch LCD display (Waveshare, manufactured in Shenzen, China) to facilitate real-time user interaction, displaying both water quality data and system status. Hostinger’s web hosting service is utilized to enable users to monitor performance and detect issues, such as sudden changes in water quality or leaks. The structure emphasizes the integration of hardware and software, ensuring accurate real-time water quality assessments.
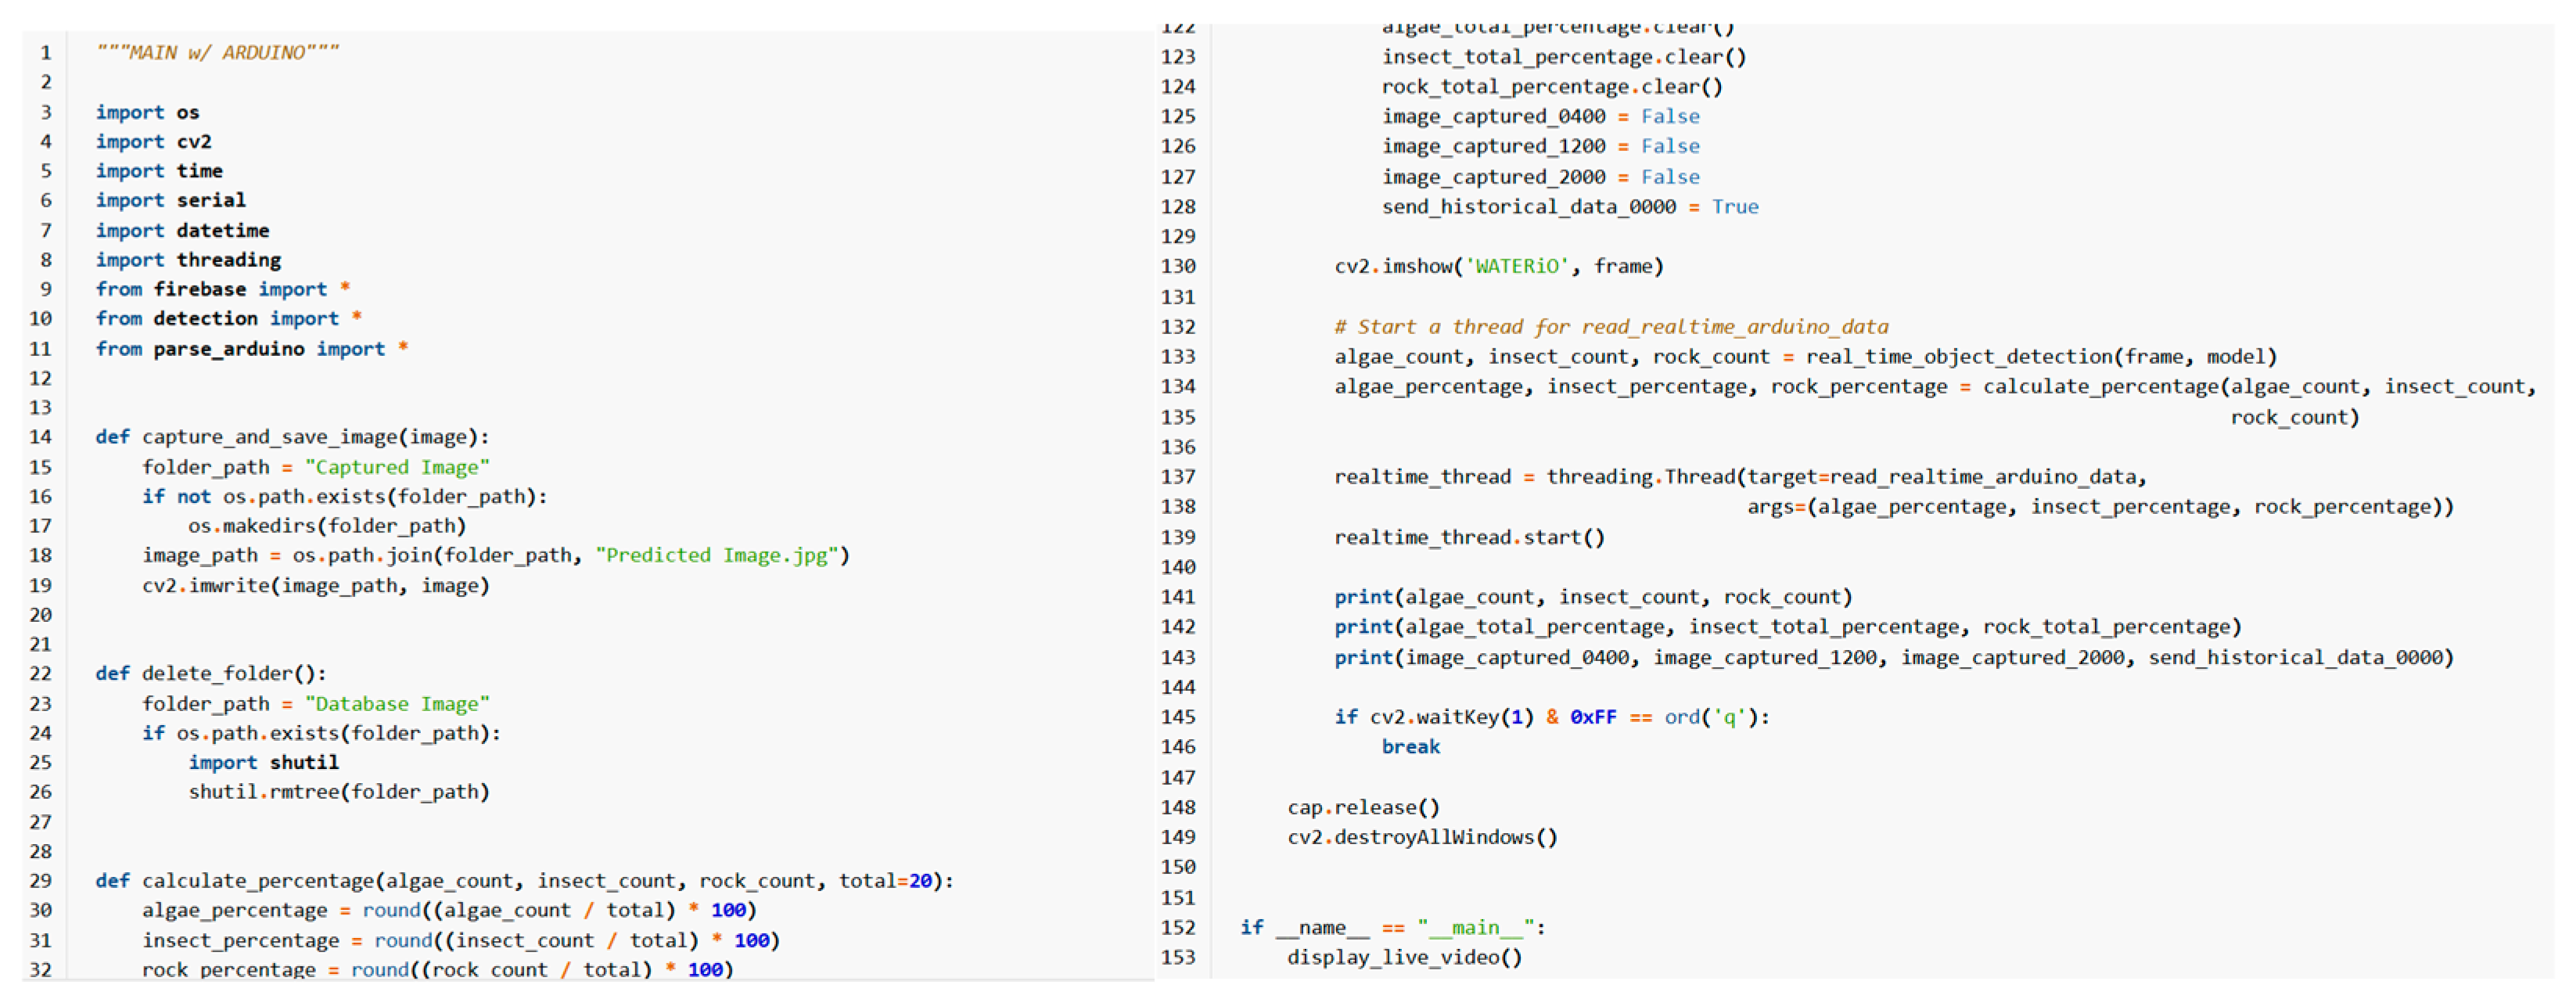
A program based on Python version 3.9.13 integrates the detection process of real-time monitoring and analysis to assess tap water quality and identify leaks. It processes video data from the camera and detects objects using libraries such as “cv2”. Key functions include image capture, storage management, and any findings of the particular contaminants, namely, algae, ants, and sand. The primary function, “display_live_video”, captures video, analyzes frames, and employs the pre-trained YOLOv8 model to classify contaminants in real time, adjusting to different times of the day (Figure 2).
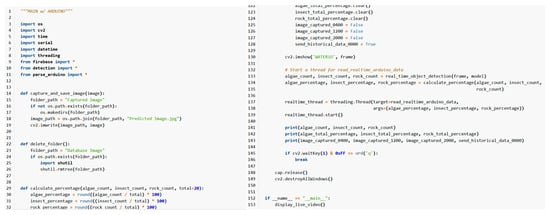
Figure 2.
Illustrative section from the central program of the system.
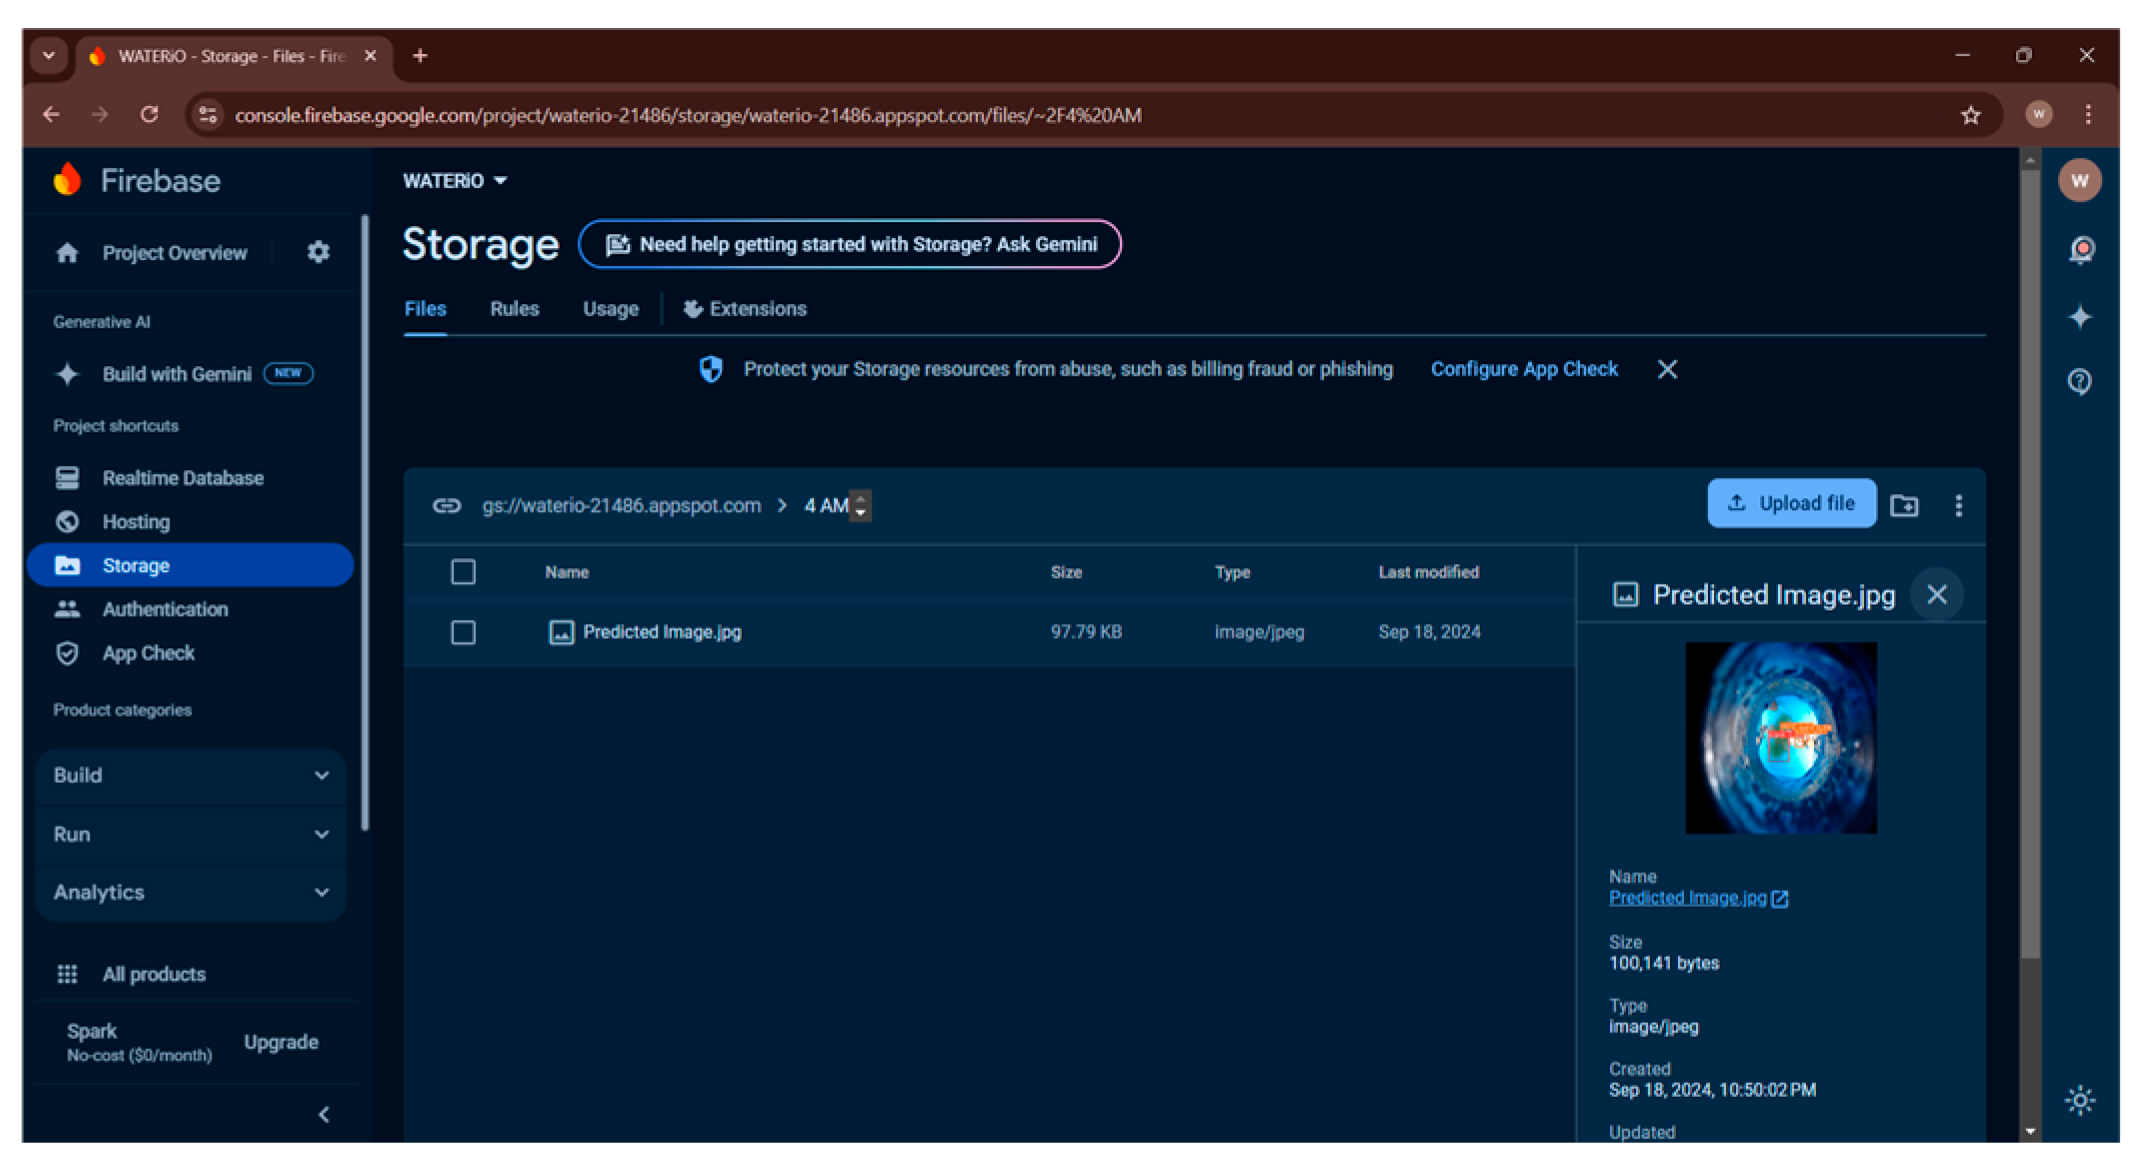
Images are captured and analyzed at scheduled intervals at 4:00 a.m., 12:00 p.m., and 8:00 p.m., detecting pollutants such as algae, ants, and sand to provide precise, time-sensitive data. A mobile app allows users to view live data, observe trends, and receive alerts. The results are stored as percentages for analysis, and the system also processes real-time and scheduled Arduino data (Figure 3).
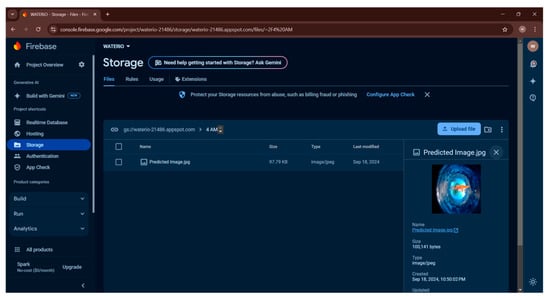
Figure 3.
Cloud-based storage of acquired images.
3.2. Data Gathering and Process
Water quality was assessed before reaching the storage tanks by deploying a Raspberry Pi 4 and a camera within the pipeline systems of three residential households in Batangas. The system supervised any object within the pipeline, displaying real-time data on an LCD screen and providing mobile app access. Using this system, registered users can access water quality readings and receive automated alerts through a dedicated mobile application. Data were transmitted to Firebase Cloud, with email notifications generated when contamination levels exceeded established thresholds (Figure 4).
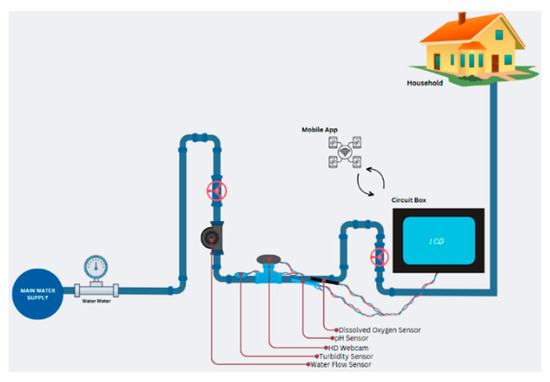
Figure 4.
System integration through the water pipeline.
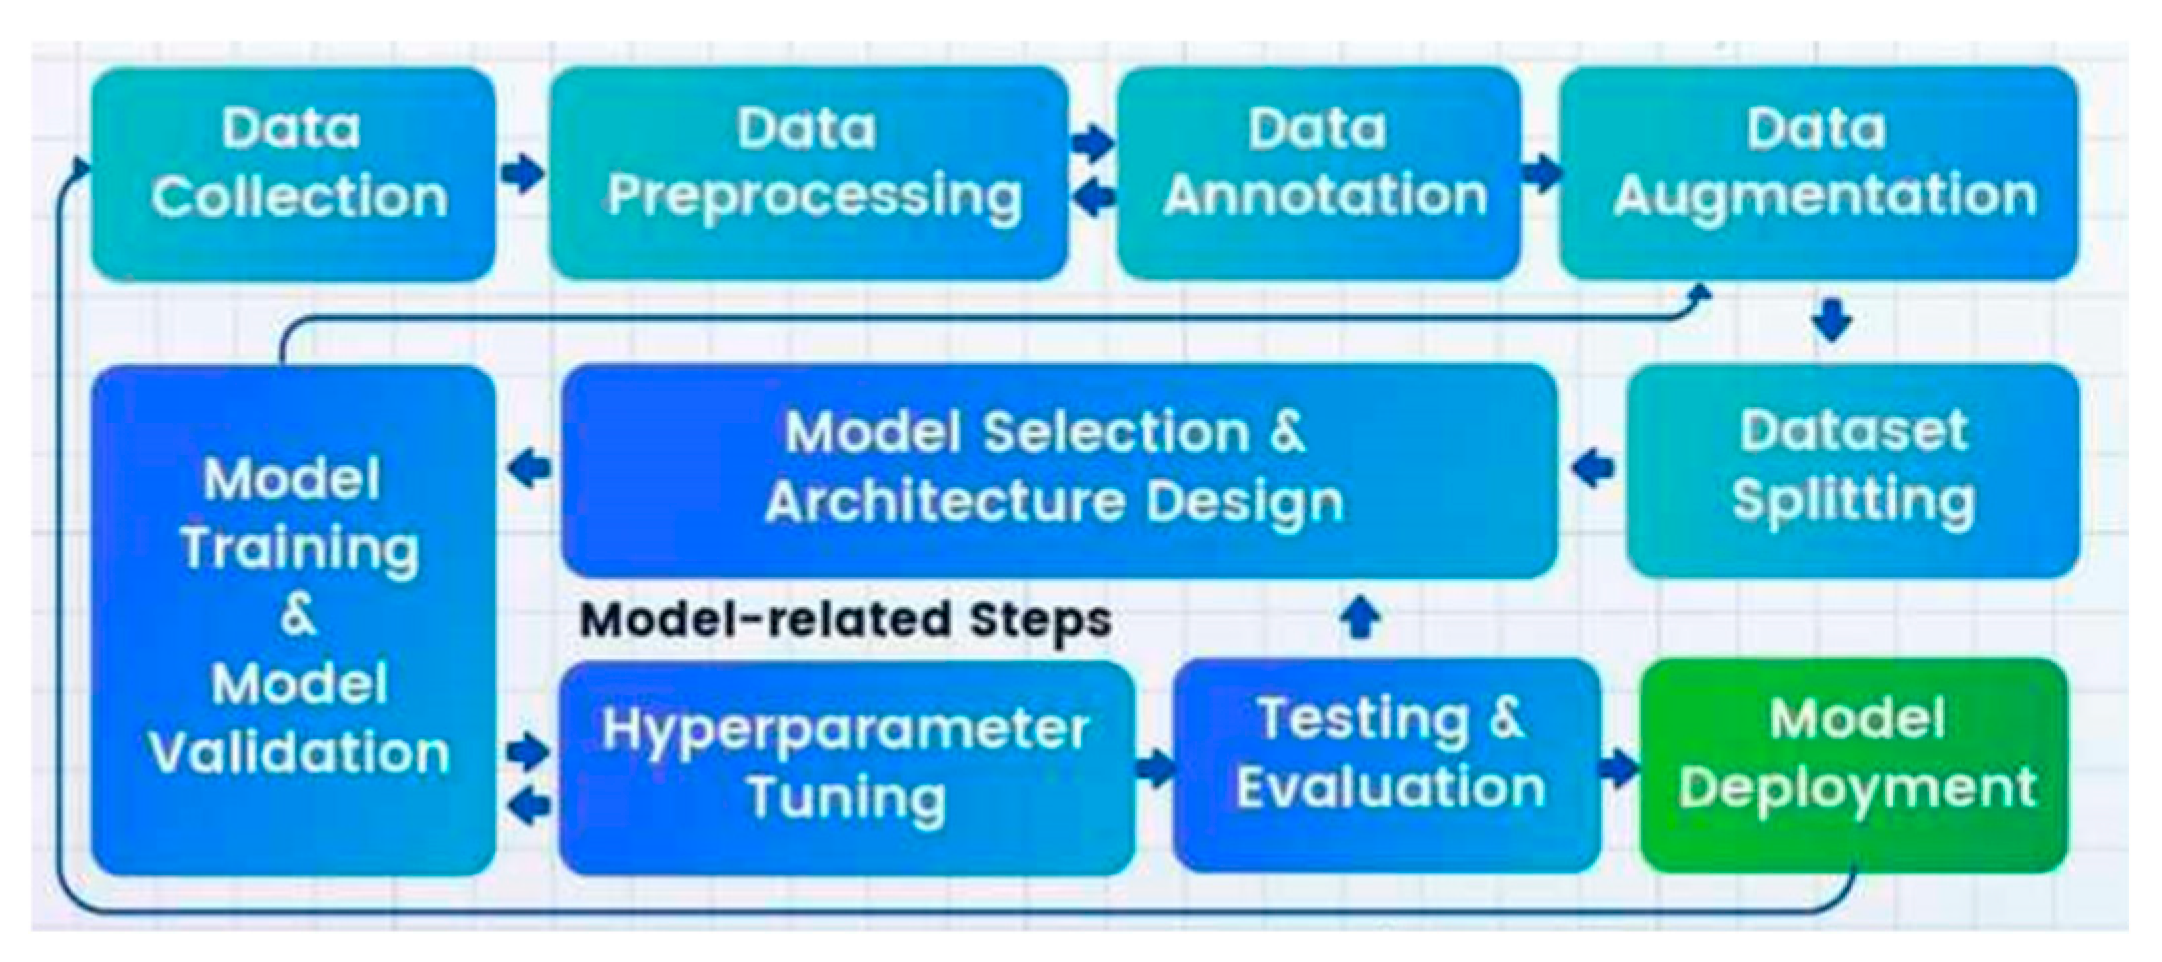
The experimental stage began with data collection to identify foreign particles in tap water (Figure 5).
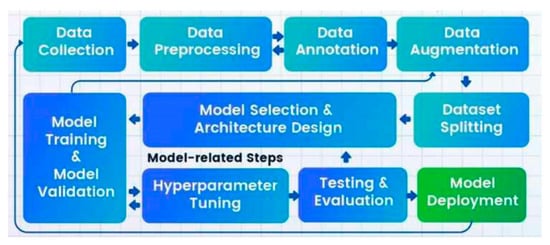
Figure 5.
Operational flow of object detection. Adapted from Basic AI [8].
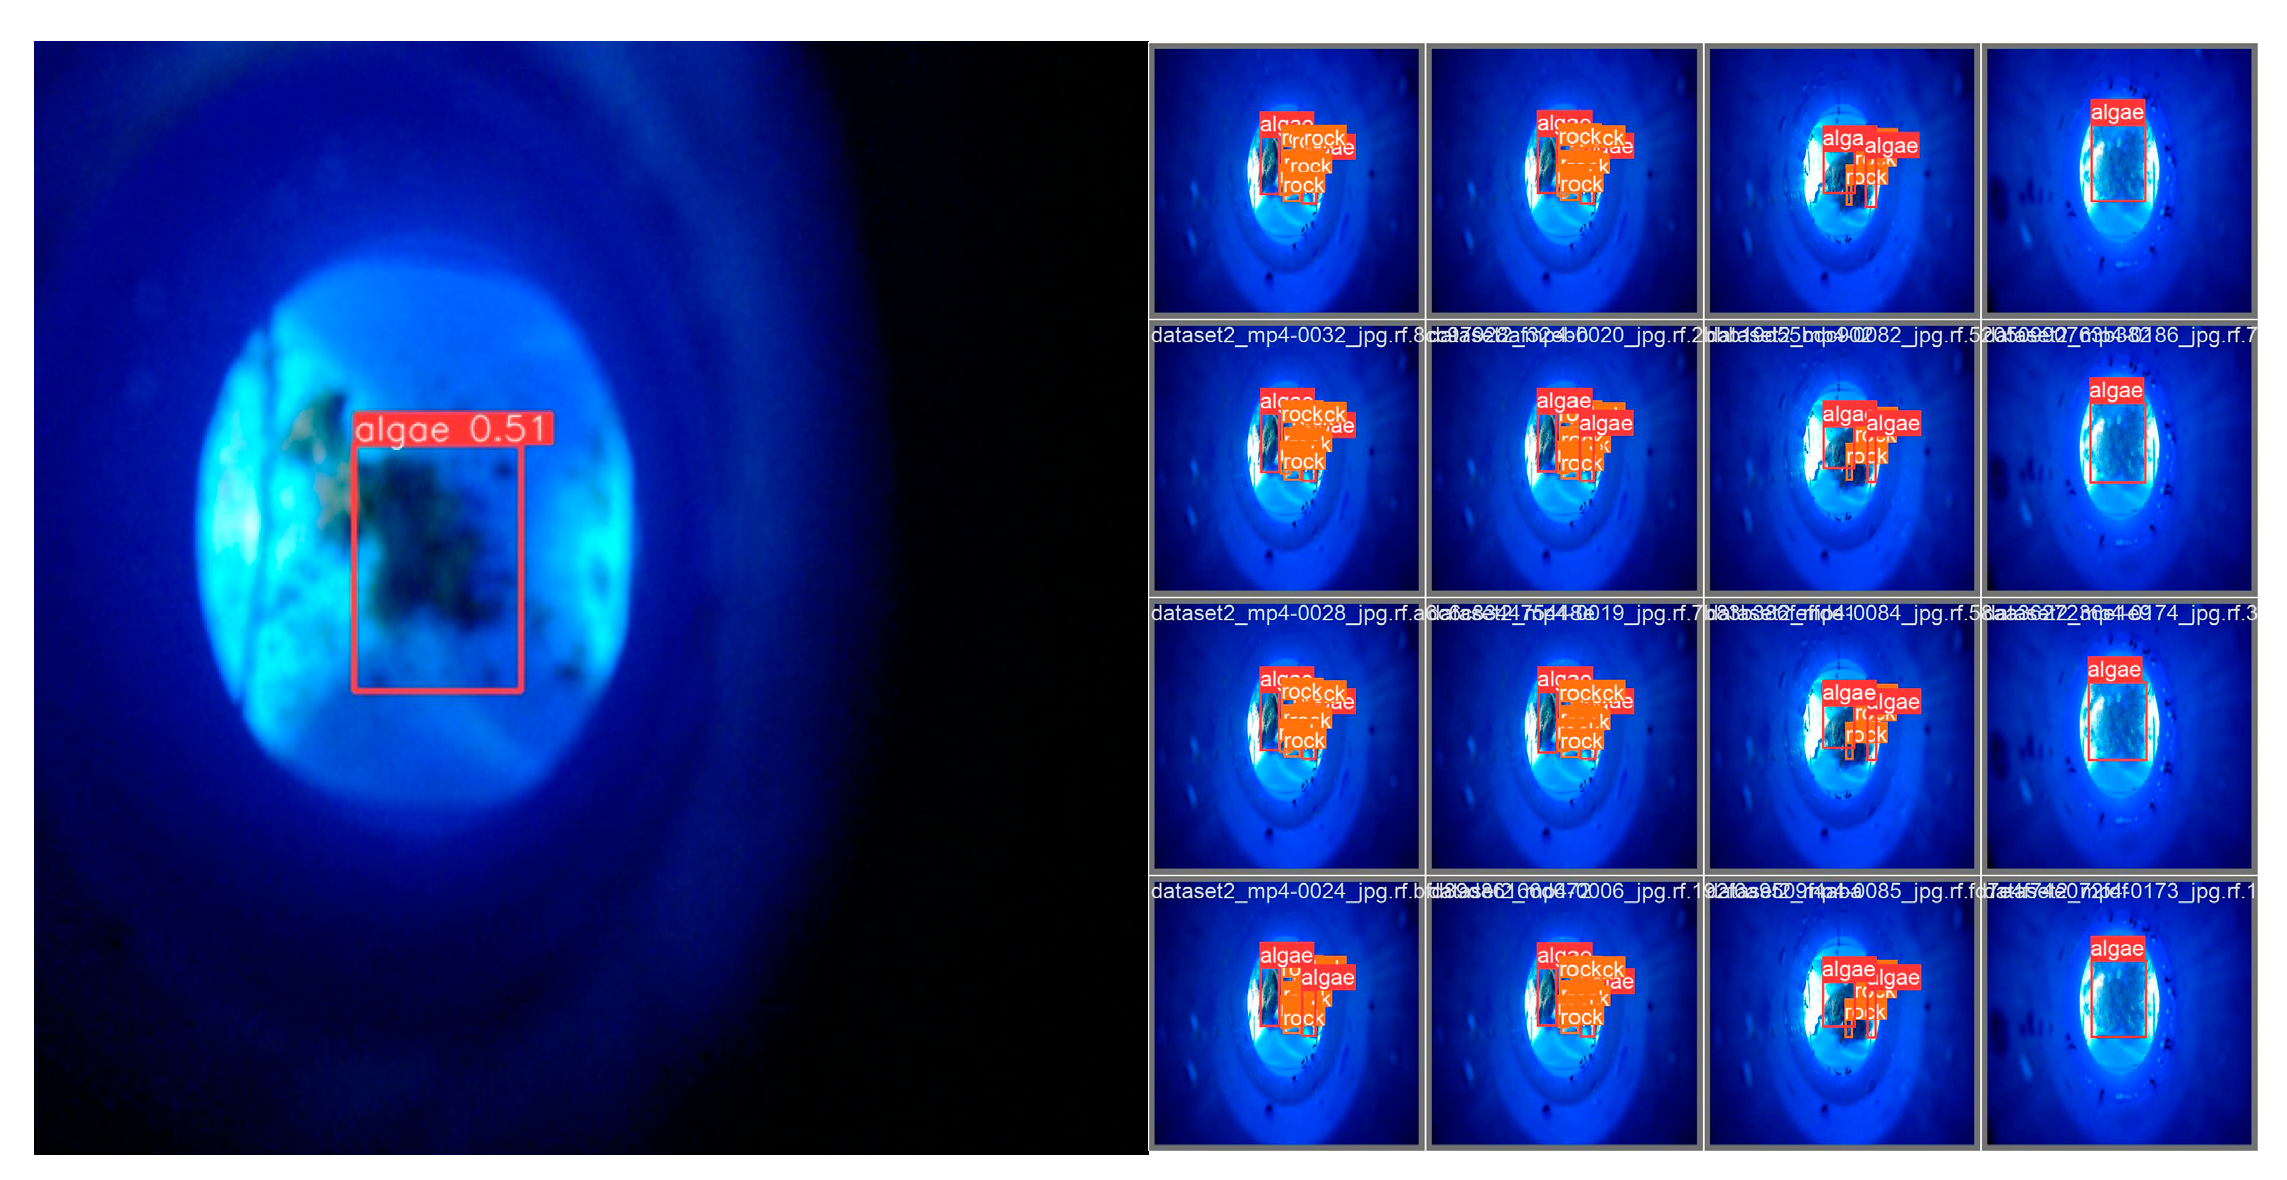
A high-resolution webcam was strategically placed above the water samples to acquire images for analysis under controlled lighting conditions provided by LED lights within the pipe. The model was trained using 3206 images, comprising both contaminated and uncontaminated samples, to ensure accurate detection.
For efficient object detection, the images were resized to 640 × 640 pixels from their original resolution of 1280 × 720 pixels, while maintaining the original proportion. Each image was annotated to mark impurities such as algae, sand, and ants. The dataset was processed using Roboflow, which extracted high-quality frames from the video streams, ensuring consistency and usability for the study.
Roboflow’s annotation tools were used to accurately label the images and indicate the location of contaminants with bounding boxes, as illustrated in Figure 6. Precise annotation was crucial for training the YOLOv8 model. The preprocessing phase involved key steps that optimized the dataset for object detection tasks. Dataset quality and diversity were enhanced through techniques such as normalization, scaling, and data augmentation. Flipping, rotation, brightness modification, and mosaic augmentation were utilized to increase the model’s ability to handle different input variations. Roboflow automatically split the dataset into 2241 training images, 648 validation images, and 317 test images, ensuring an ideal balance for training, validation, and testing, while reducing overfitting and enhancing model robustness. Figure 7 presents sample images from the training set, showing how the model detects various contaminants during the training phase.
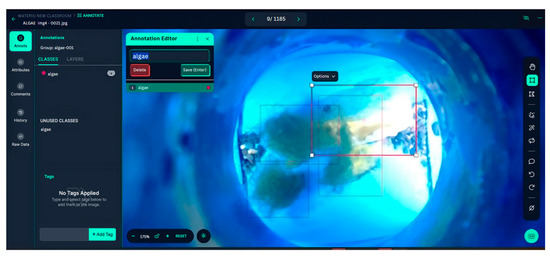
Figure 6.
Image annotation using Roboflow.
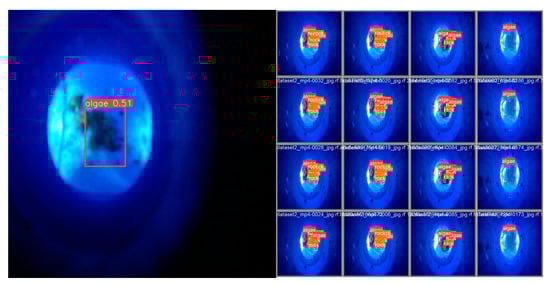
Figure 7.
Contaminant detection samples in training images.
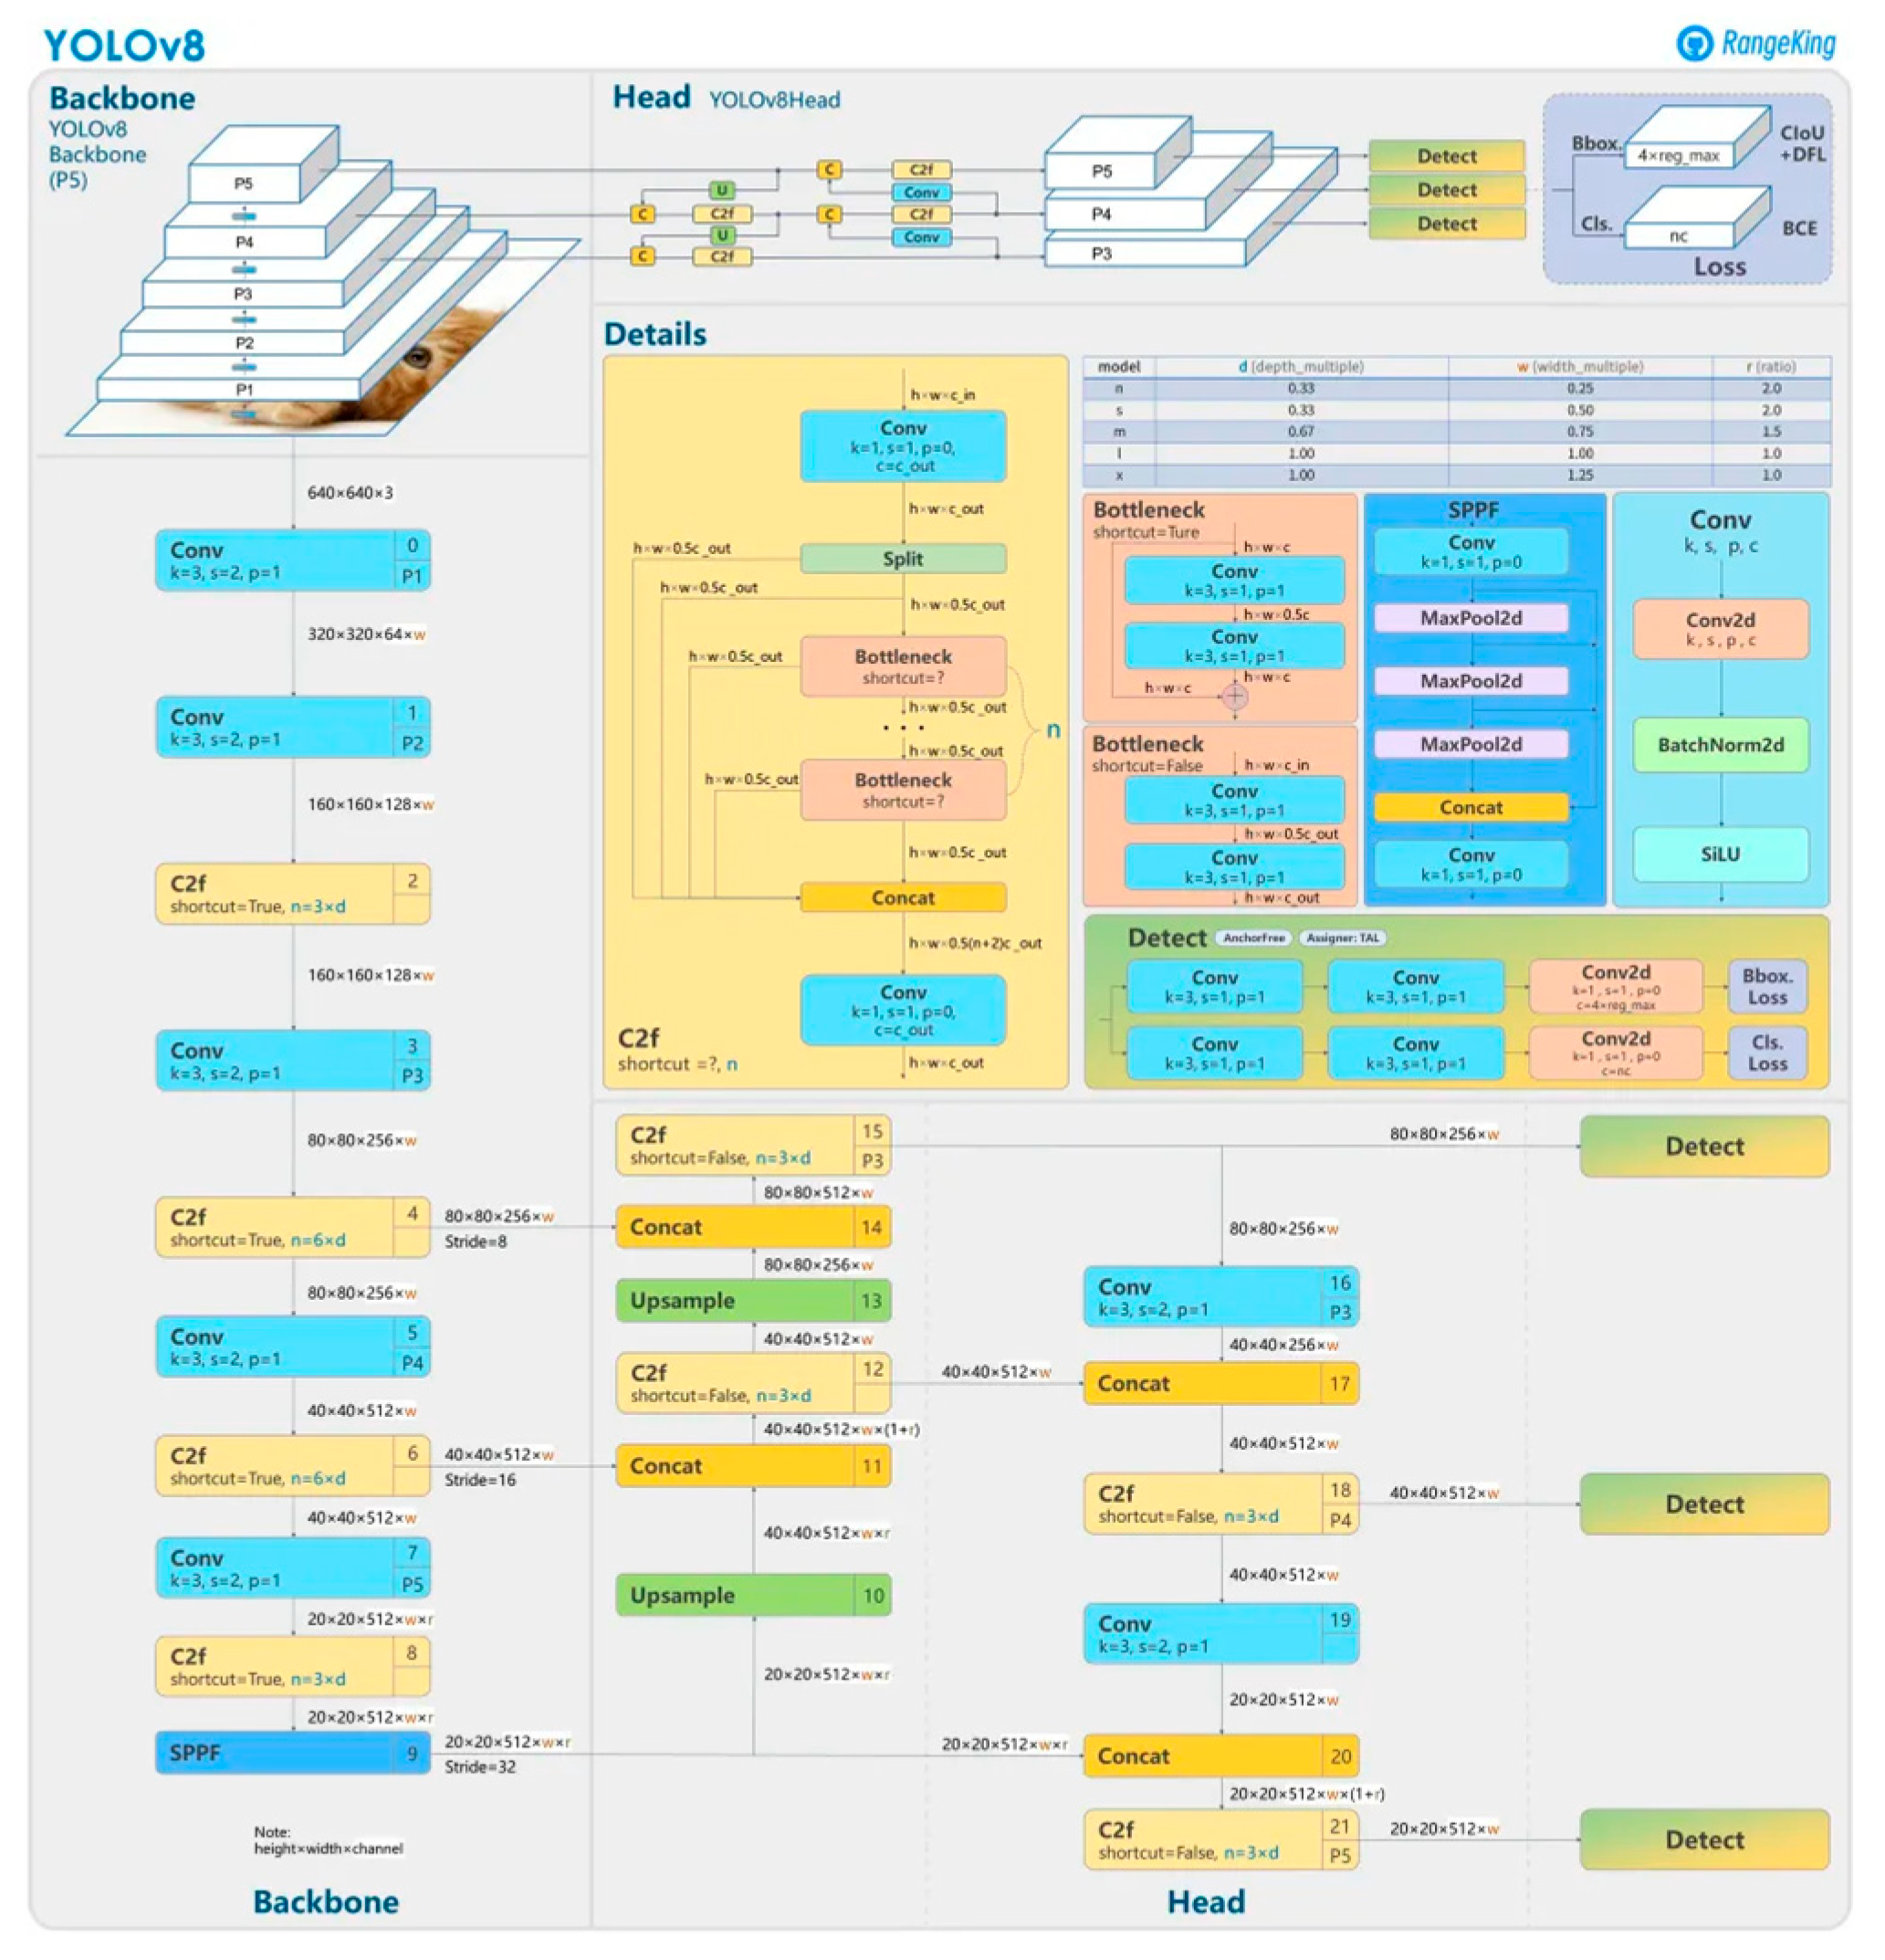
The YOLOv8 architecture was selected for its superior performance in object detection tasks, balancing computational efficiency with detection accuracy (Figure 8). Utilizing an anchor-free detection strategy, the YOLOv8 model effectively detected small and irregular objects. This study specifically applied the model to identify algae, sand, and ants in water samples, addressing complexities arising from their varying shapes and textures. YOLOv8’s ability to detect objects at different scales and conditions was critical for achieving the high precision required for contamination monitoring.
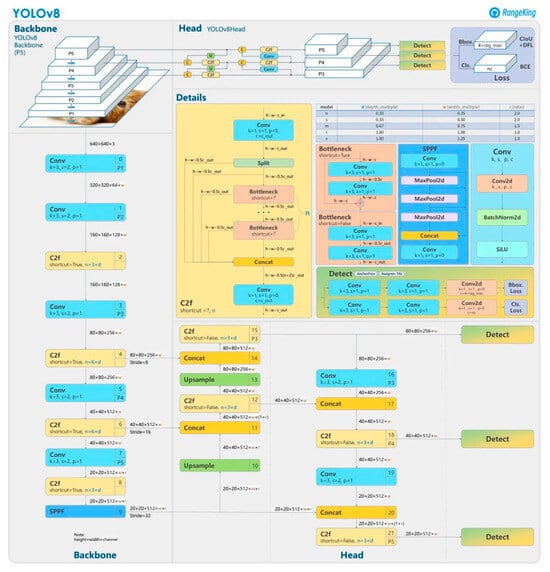
Figure 8.
Overview of the YOLOv8 network structure. Adapted from Solawetz and Pochetti [9], with reference to a visualization by GitHub user RangeKing.
4. Results and Discussion
The system’s performance was evaluated based on a thorough analysis of the experimental results, as presented below.
Testing Results
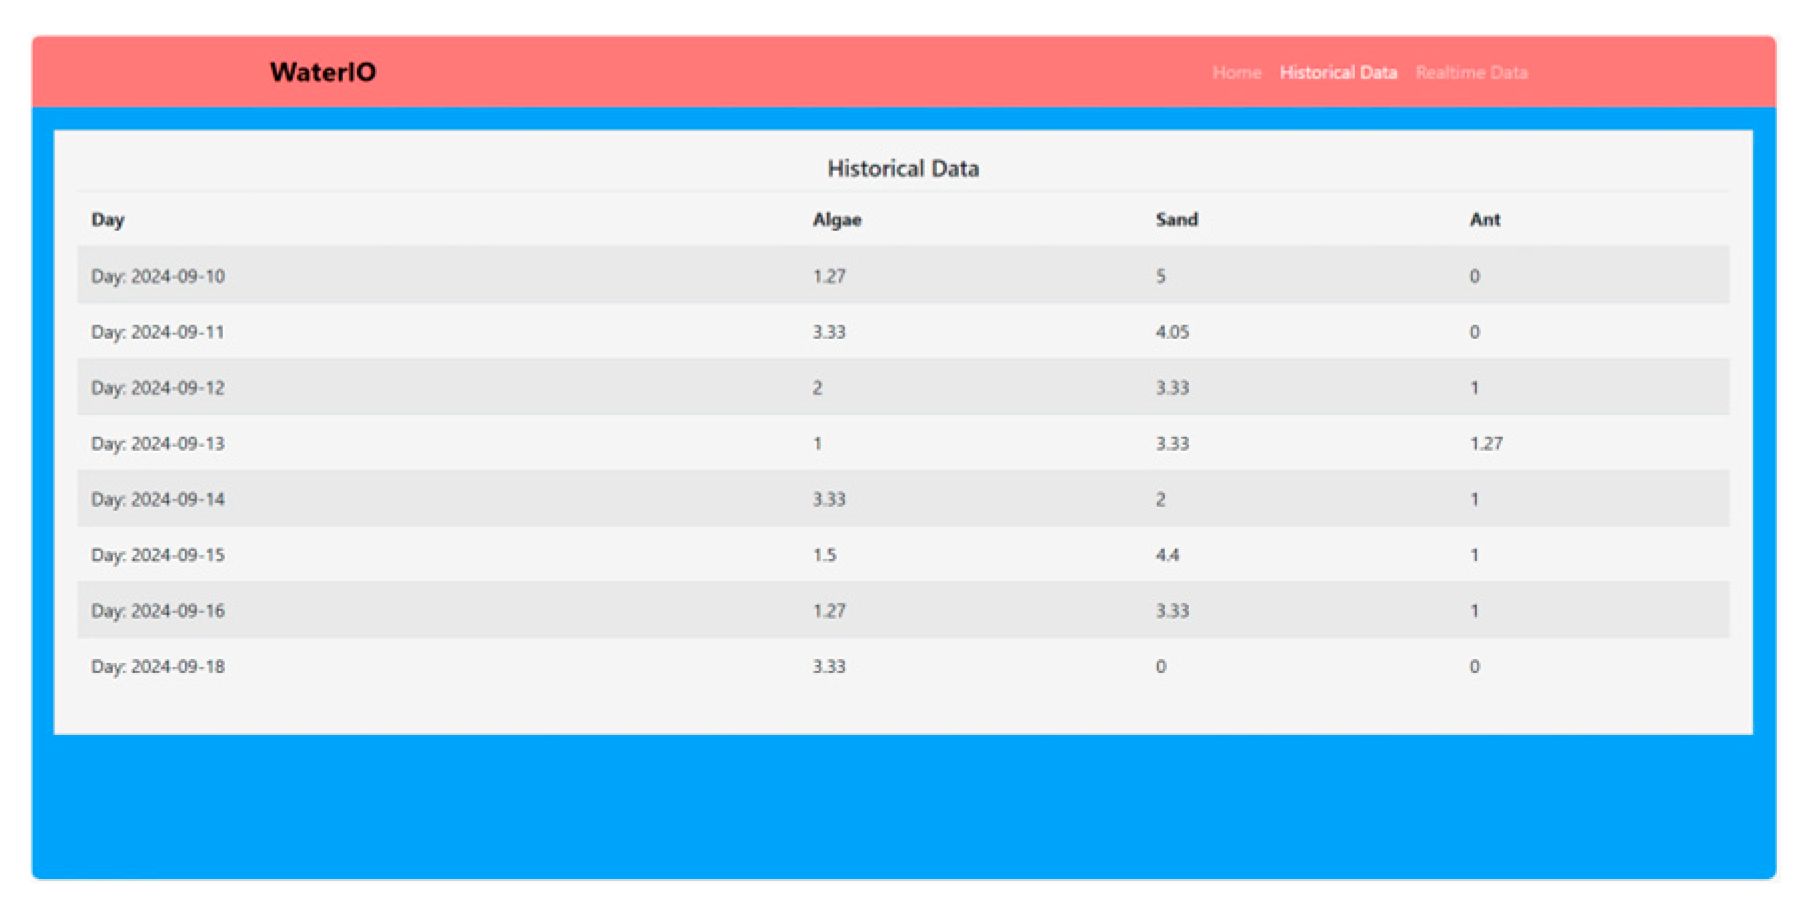
Pollutants identified by the system using YOLOv8 were derived from weekly household data and are presented in Figure 9 and Table 1. The results indicate the prevalence of the identified contaminants over a 24 h period, offering insights into daily patterns of water impurity.
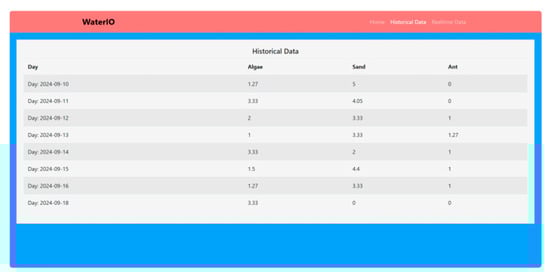
Figure 9.
Recorded object detection data.

Table 1.
Object detection data from uncontrolled conditions.
Contaminants were continuously monitored for 24 h to enhance data clarity. The analysis revealed that algae were the most frequently detected, followed by ants and sand. Although YOLOv8 accurately detected contaminants, it exhibited a tendency to underrepresent their average concentrations (Figure 10 and Table 2). The controlled dataset in Table 2 highlights the system’s effectiveness in detecting varying contaminants.
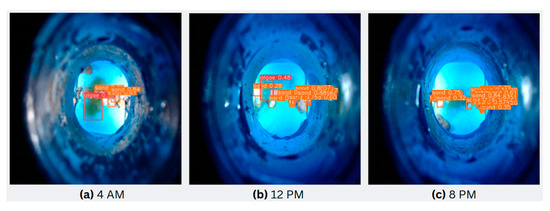
Figure 10.
Recorded object detection over a 24 h monitoring.
Table 2.
Object detection data under controlled conditions.
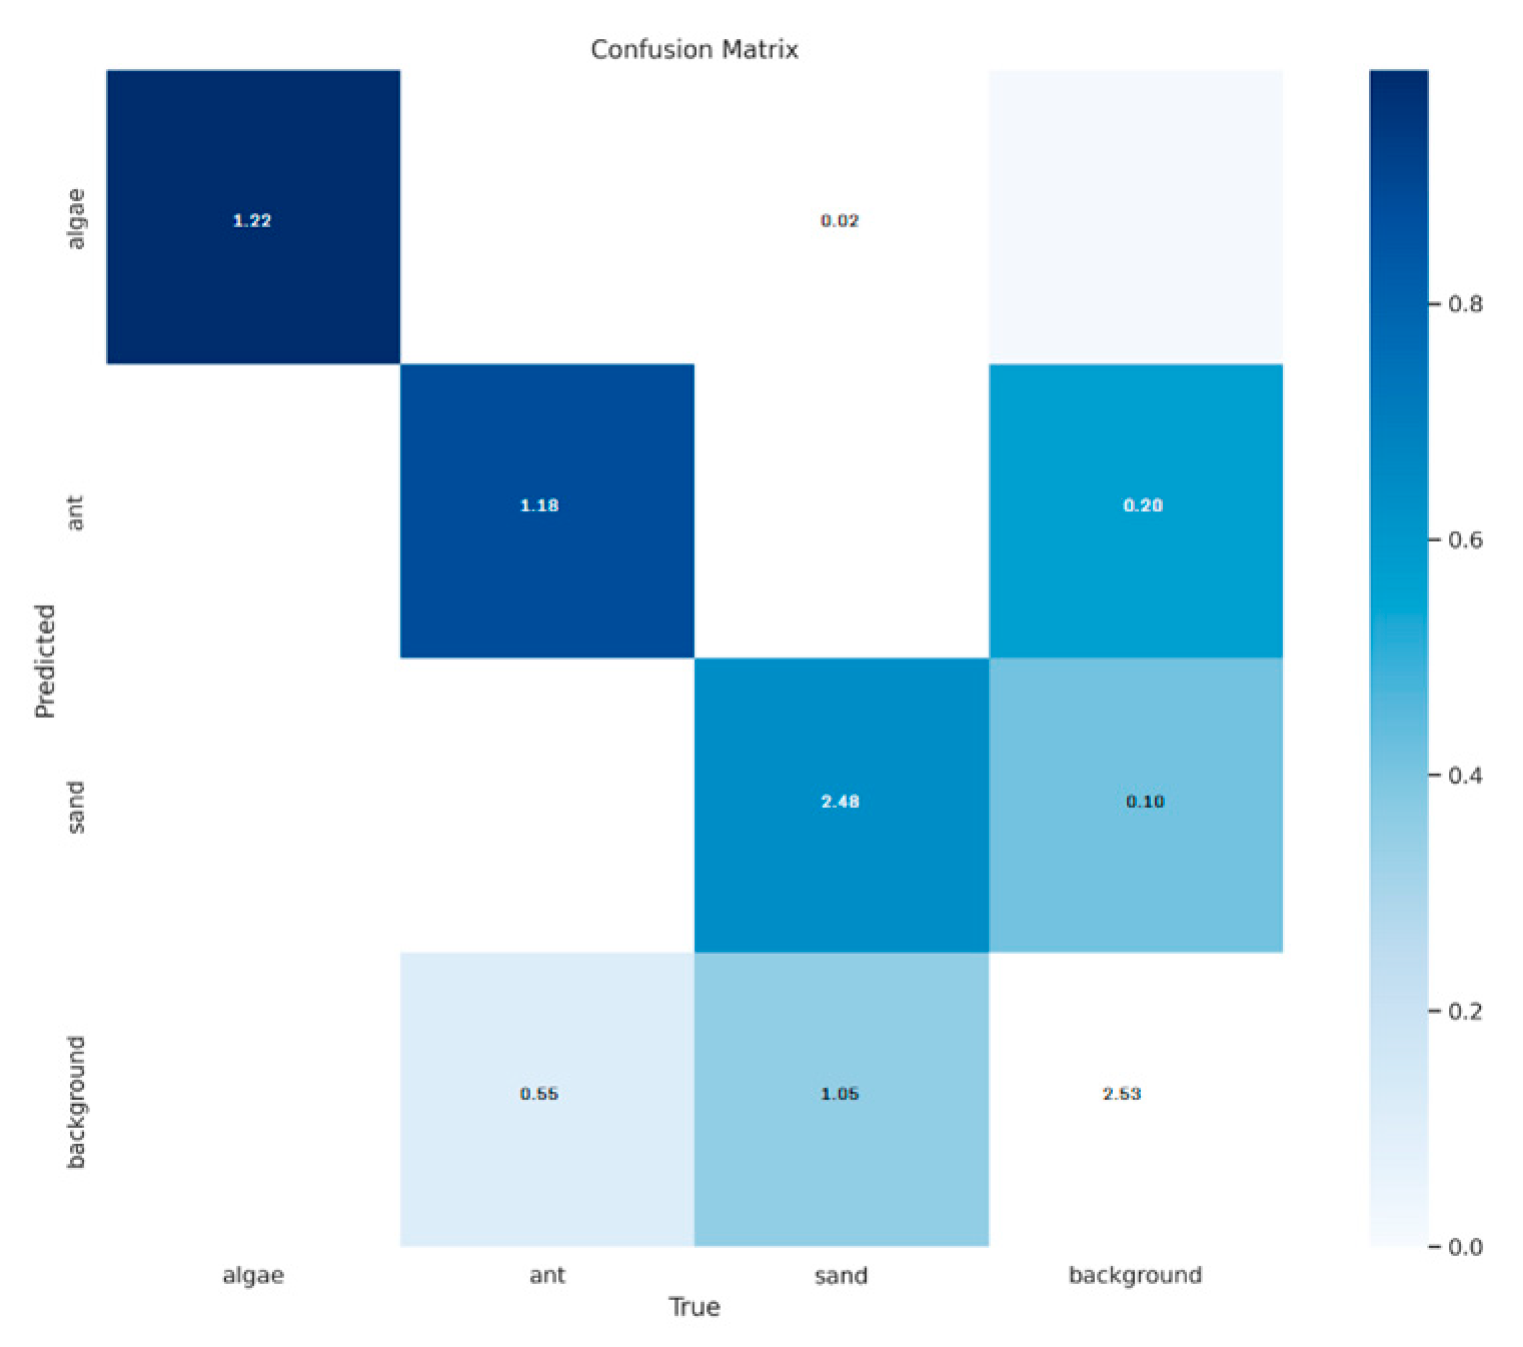
Detected materials were classified by the model into predefined categories: algae, ants, sand, and background (Figure 11). A comprehensive performance evaluation was conducted using a confusion matrix and statistical performance metrics, involving precision, recall, F1-score, mean average precision (mAP), and accuracy. Correct classifications were reflected by diagonal values in the confusion matrix, demonstrating high accuracy for algae (1.92), ants (1.18), sand (2.48), and background materials (2.53). However, classification errors were also present, such as sand being misclassified as algae (0.55), ants as sand (0.20), and background materials being incorrectly identified as ants (1.05) or algae (0.02) (Table 3). Despite these, the model’s overall performance was robust, though there remains room for improvement in distinguishing similar categories such as ants and background materials.

Figure 11.
Classification results represented in a confusion matrix.
Table 3.
Accuracy and precision metrics.
YOLOv8’s performance metrics demonstrate its classification capabilities. The model reliably identified test samples, with an overall accuracy of 79.41%. Algae achieved the highest precision (100%), followed by sand (70.20%) and ants (68.20%), while the background class attained 96.20% precision (Table 4).
Table 4.
Recall metric.
Algae demonstrated a recall of 99.01%, indicating near-complete identification of occurrences. The recall rates for ants and sand were recorded at 85.50% and 96.20%, respectively. However, the background class recorded a recall of 70.70%, suggesting limitations in background material detection (Table 5).
Table 5.
F1-score metric.
Reflecting the equilibrium between precision and recall, the F1-score analysis revealed that algae attained the highest score at 99.50%. Sand and ants followed with F1-scores of 81.50% and 75.90%, respectively. The background class attained an F1-score of 81.50%, reflecting the model’s ability to balance the detection of true positives and false negatives.
5. Conclusions
The YOLOv8 model was effective in detecting contaminants in tap water, specifically algae, sand, and ants. The model demonstrated strong performance in identifying algae, with high precision and recall, affirming its reliability for detecting this contaminant. However, its performance in detecting ants and sand was less consistent, revealing challenges in distinguishing between these visually similar contaminants, leading to instances of misclassification. Additionally, averaging data across different time intervals during uncontrolled trials led to an underrepresentation of some contaminants, such as ants, limiting the model’s ability to capture temporal variations in contaminant presence. Although the model’s overall accuracy is commendable, especially for algae detection, further refinements are necessary to enhance precision and recall for ants and sand, particularly when subjected to varying environmental influences. By integrating YOLOv8, the system demonstrates the capability of modern object detection frameworks in facilitating real-time water quality surveillance. Contributing to progress in environmental monitoring, this system features the importance of ongoing refinements in model precision and dependability to ensure the safety of municipal water sources.
For future research aimed at improving the effectiveness of water quality monitoring systems, it will be essential to refine contaminant detection algorithms and model architectures, particularly in addressing misclassification and the visual similarities between contaminants such as ants and sand. Incorporating time-specific annotations or weighted learning techniques enables the algorithm to adjust to temporal inconsistencies in contaminant presence, thereby improving detection accuracy. Enhancing dataset diversity by incorporating a more extensive range of ant and sand samples under different environmental contexts will be critical for improving contaminant classification. The implementation of underwater cameras and small-scale imaging devices would facilitate detailed pipeline monitoring, ultimately enhancing the overall data acquisition process. Moreover, the adoption of time-series analysis or temporal segmentation techniques would enable the recognition of contamination patterns that fluctuate throughout the day, ensuring the accurate detection of low-frequency contaminants. Additionally, detection performance, particularly in complex cases involving ants and sand, can be further improved by integrating YOLOv8 with complementary detection frameworks.
Author Contributions
Conceptualization, P.A.D.G. and G.E.B.; methodology, P.A.D.G.; software, P.A.D.G. and G.E.B.; validation, R.G.G.; formal analysis, P.A.D.G.; investigation, P.A.D.G.; resources, P.A.D.G. and G.E.B.; data curation, P.A.D.G.; writing—original draft preparation, P.A.D.G.; writing—review and editing, P.A.D.G. and G.E.B.; visualization, P.A.D.G. and G.E.B.; supervision, R.G.G.; project administration, R.G.G. All authors have read and agreed to the published version of the manuscript.
Funding
This research was conducted without any external funding support.
Institutional Review Board Statement
Not applicable.
Informed Consent Statement
Not applicable.
Data Availability Statement
The data used in this study are not openly available to the public due to access limitations. Interested researchers may obtain the data by contacting the corresponding author upon reasonable request and with appropriate confirmation.
Conflicts of Interest
The authors declare no conflicts of interest.
References
- U.S. Environmental Protection Agency, The Effects: Dead Zones and Harmful Algal Blooms. U.S. Environmental Protection Agency. 12 March 2013. Available online: https://www.epa.gov/nutrientpollution/effects-dead-zones-and-harmful-algal-blooms#:~:text=Elevated%20nutrient%20levels%20and%20algal (accessed on 25 July 2024).
- Earle, S. 14.4 Groundwater Quality. In Physical Geology; BCcampus: Victoria, BC, Canada, 2015. [Google Scholar]
- Pag-Ong, A.I.; Nisperos, D.M.; Flores, R. Diversity and relative abundance of ants (Hymenoptera: Formicidae) in the National Capital Region, Philippines. Asian Int. J. Life Sci. 2022, 31, 1–21. Available online: https://www.researchgate.net/publication/362544068_Diversity_and_relative_abundance_of_ants_Hymenoptera_Formicidae_in_the_National_Capital_Region_Philippines (accessed on 26 July 2024).
- Mukta, M.; Islam, S.; Barman, S.D.; Reza, A.W.; Khan, M.S.H. Iot based Smart Water Quality Monitoring System. In Proceedings of the 2019 IEEE 4th International Conference on Computer and Communication Systems (ICCCS), Singapore, 23–25 February 2019. [Google Scholar] [CrossRef]
- Earnest, B. Getting Started with Convolutional Neural Networks (CNN). Medium; AI Mind. 24 August 2023. Available online: https://pub.aimind.so/an-overview-of-convolutional-neural-networks-cnn-454afb574613\ (accessed on 10 September 2024).
- Alzubaidi, L.; Zhang, J.; Humaidi, A.J.; Al-Dujaili, A.; Duan, Y.; Al-Shamma, O.; Santamaría, J.; Fadhel, M.A.; Al-Amidie, M.; Farhan, L. Review of deep learning: Concepts, CNN architectures, challenges, applications, future directions. J. Big Data 2021, 8, 53. [Google Scholar] [CrossRef] [PubMed]
- Pedro, J. Detailed Explanation of YOLOv8 Architecture (Part 1). Medium. 2023. Available online: https://medium.com/@juanpedro.bc22/detailed-explanation-of-yolov8-architecture-part-1-6da9296b954e (accessed on 26 July 2024).
- Basic AI. Pipeline for Model Development. Available online: https://www.basic.ai/ (accessed on 2 May 2025).
- Solawetz, J.; Pochetti, F. What Is YOLOv8? A Complete Guide. Roboflow Blog, 23 October 2024. Available online: https://blog.roboflow.com/what-is-yolov8/ (accessed on 2 May 2025).


Disclaimer/Publisher’s Note: The statements, opinions and data contained in all publications are solely those of the individual author(s) and contributor(s) and not of MDPI and/or the editor(s). MDPI and/or the editor(s) disclaim responsibility for any injury to people or property resulting from any ideas, methods, instructions or products referred to in the content. |
© 2025 by the authors. Licensee MDPI, Basel, Switzerland. This article is an open access article distributed under the terms and conditions of the Creative Commons Attribution (CC BY) license (https://creativecommons.org/licenses/by/4.0/).