
Tunnel Oxide Passivated Contact and Passivated Emitter Rear Cell Solar Module Testing †


Abstract
1. Introduction
2. PERC and TOPCon Solar Module
2.1. PERC
2.2. TOPCon
3. Methods
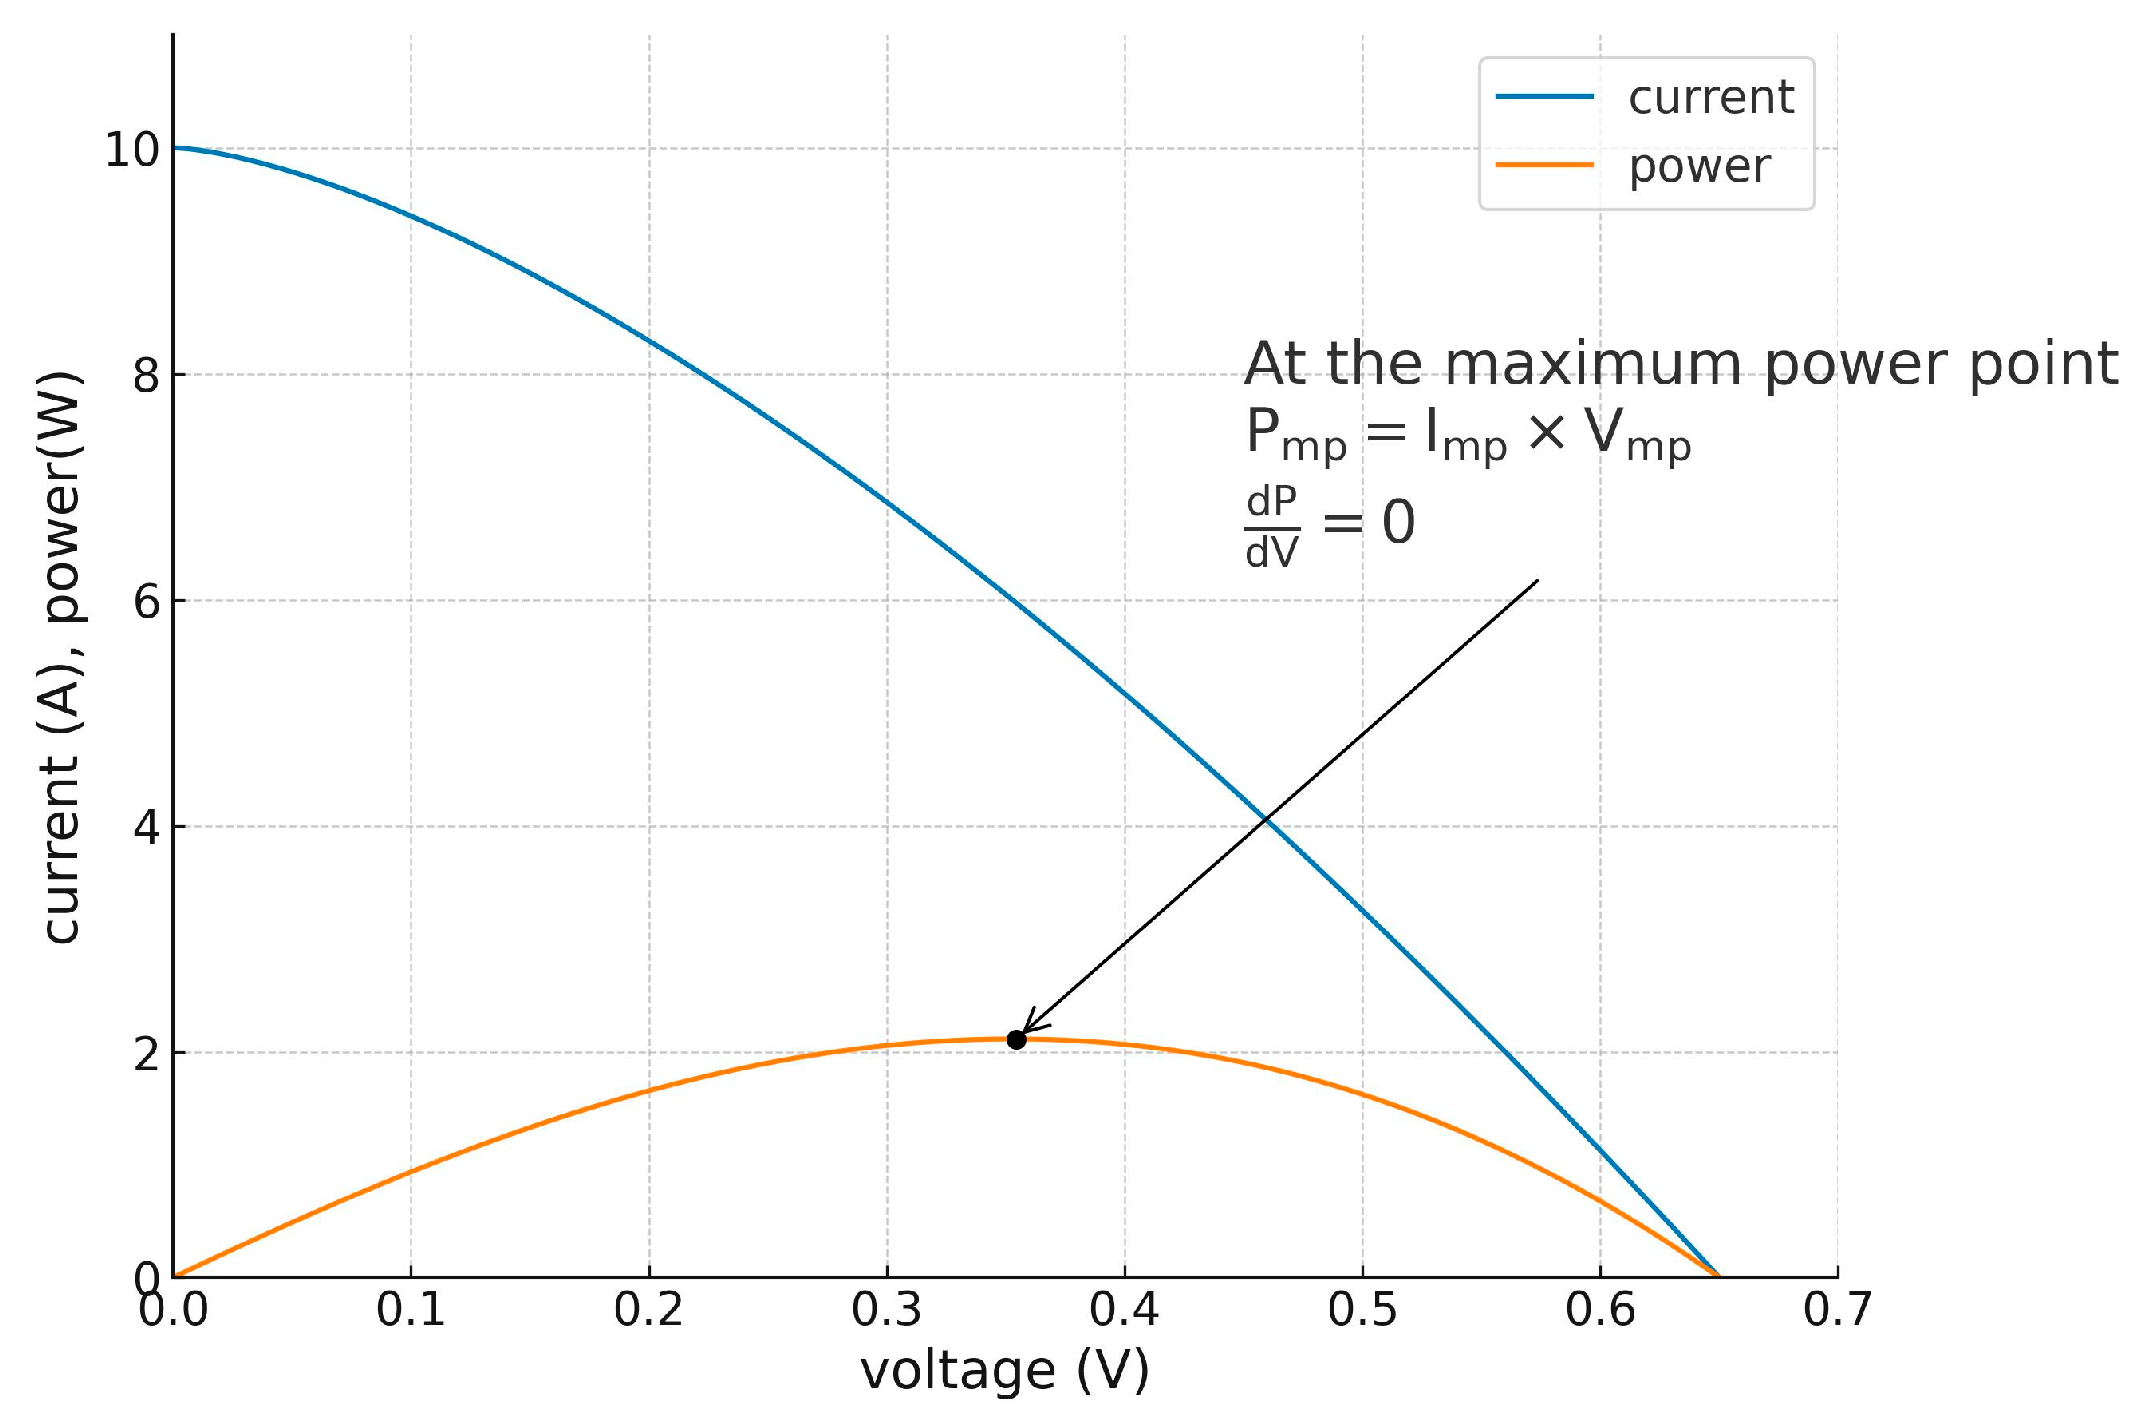
3.1. Maximum Power Measurement
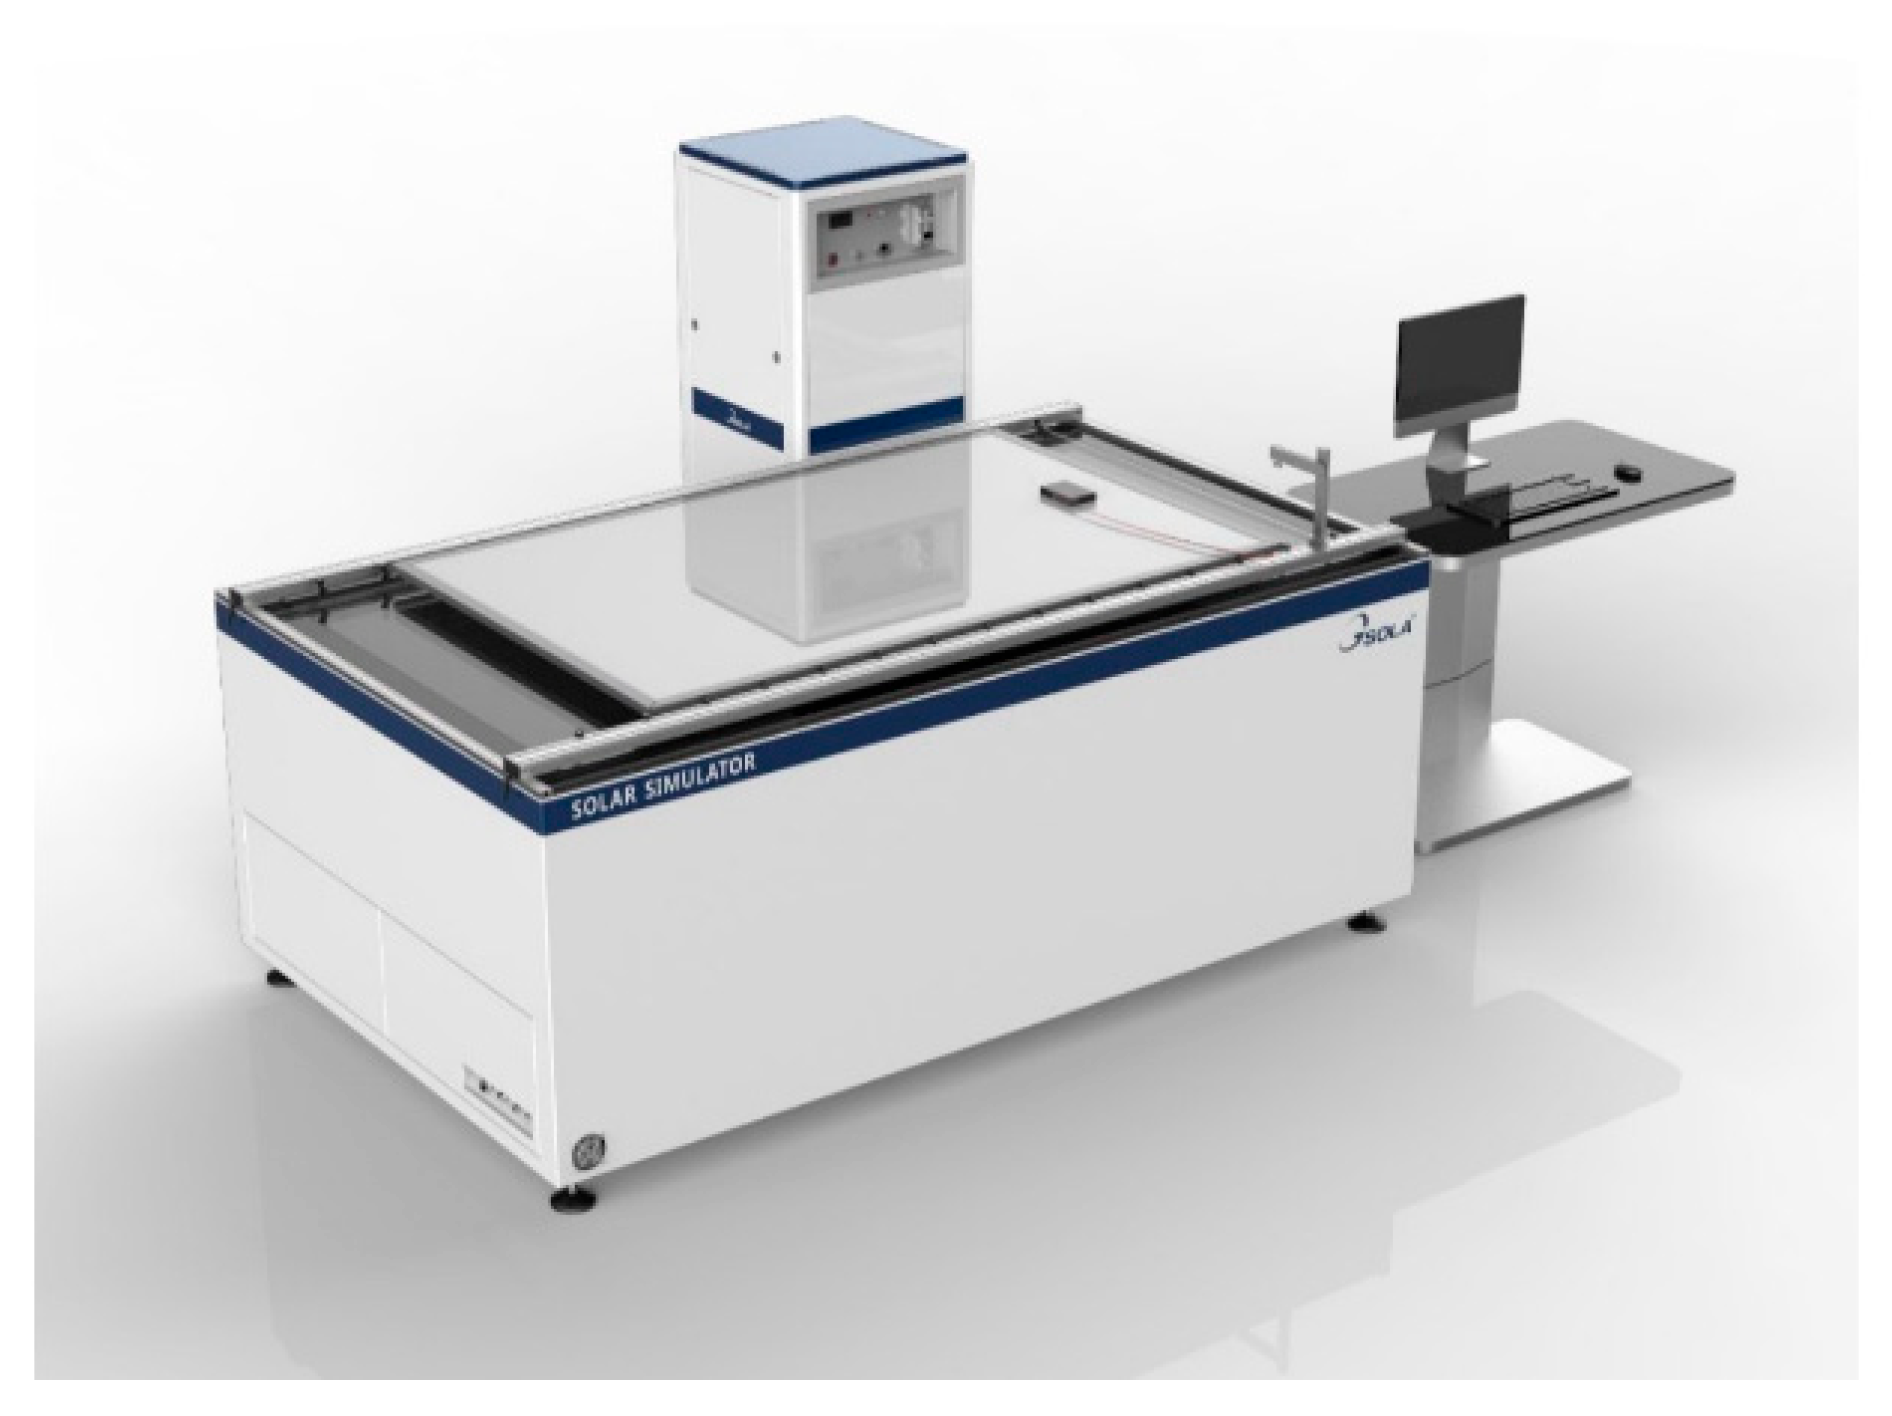
3.2. Solar Simulator
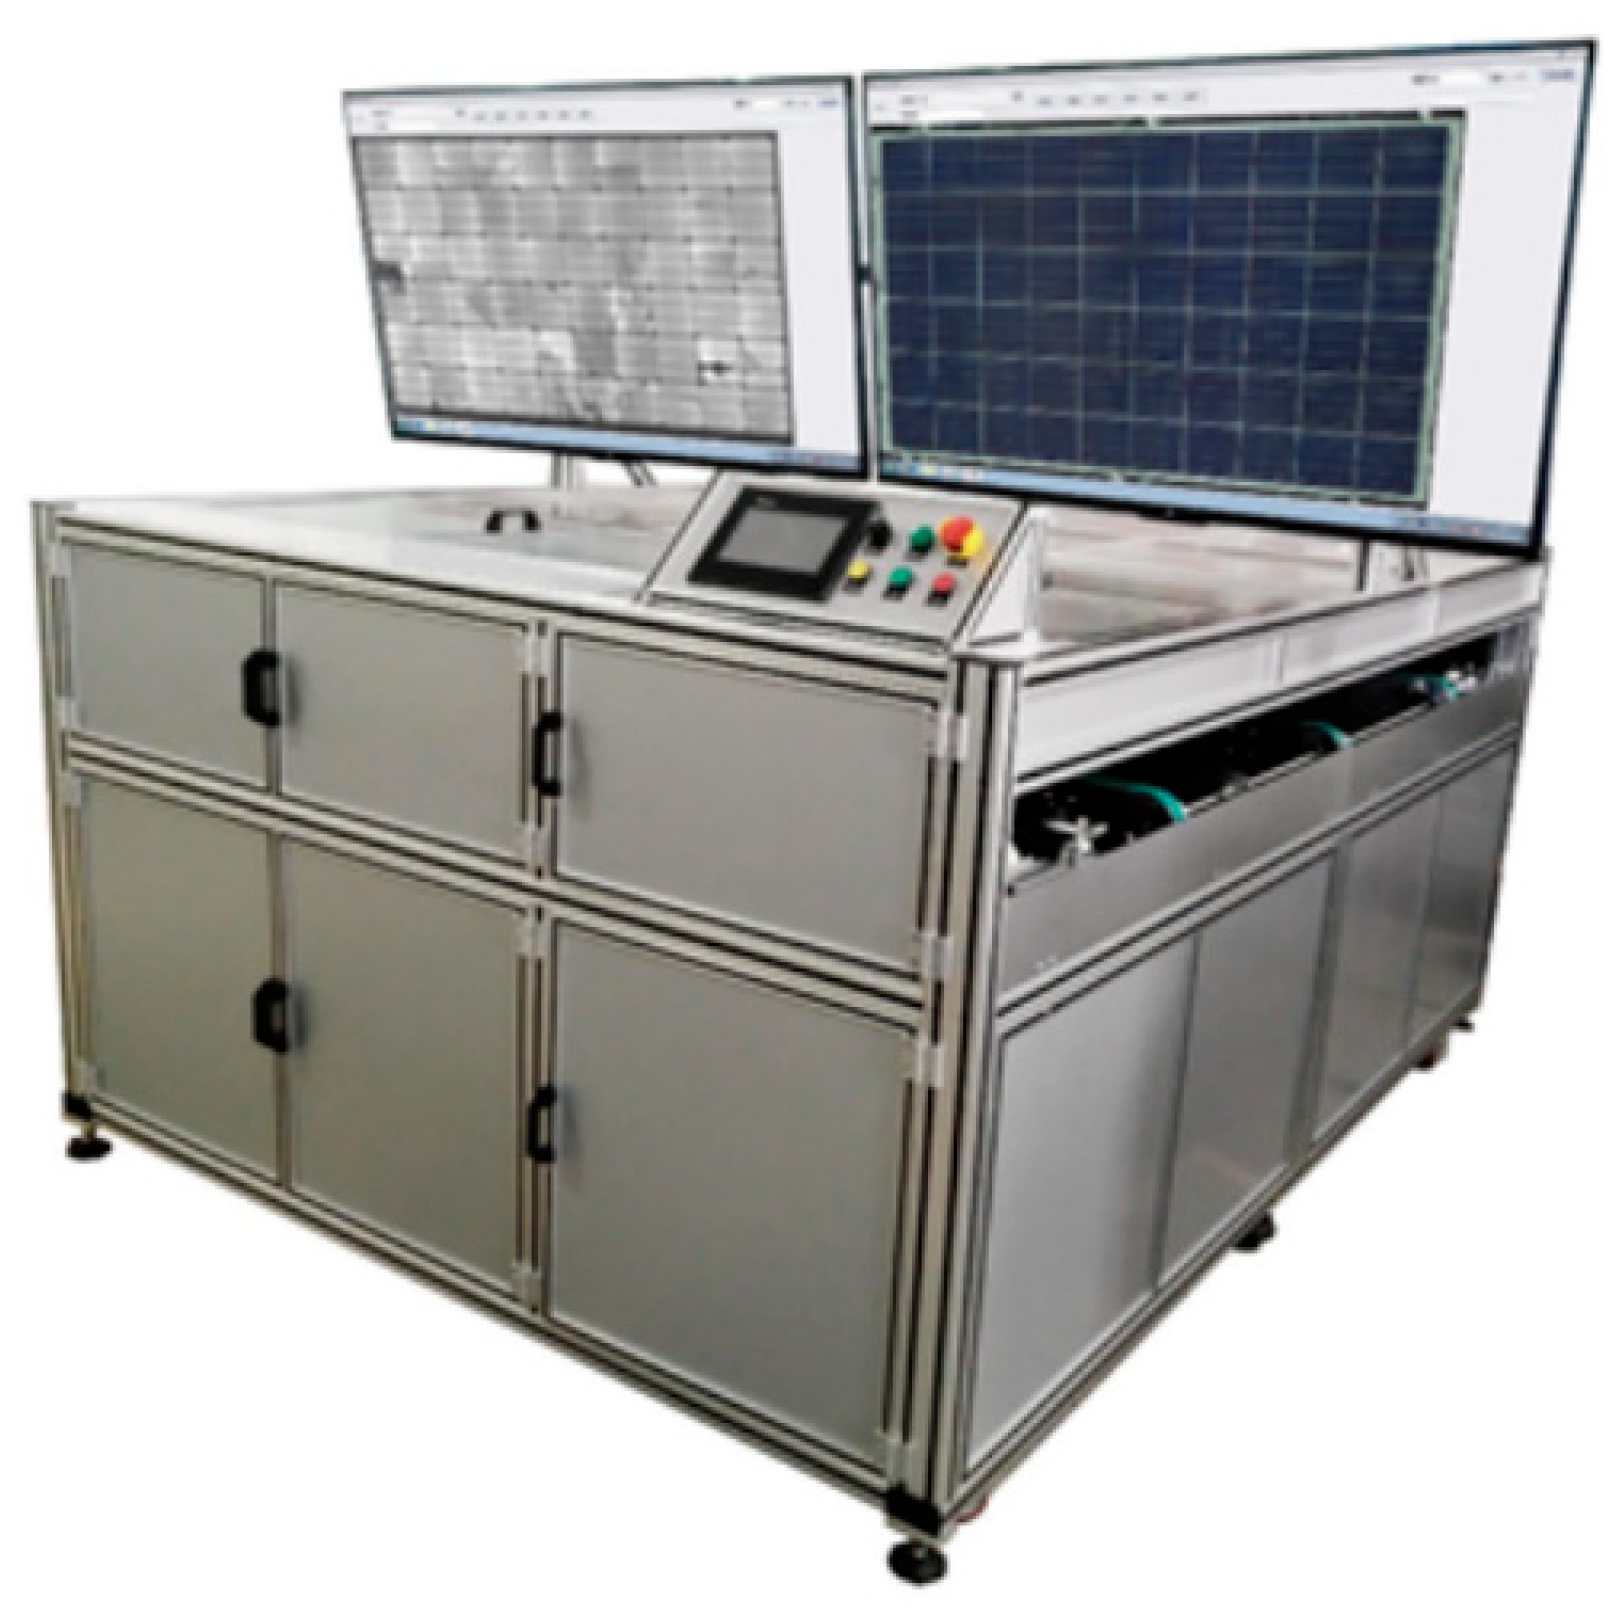
3.3. EL Test
3.4. Outdoor Exposure Power Degradation Test
4. Results and Discussion
Author Contributions
Funding
Institutional Review Board Statement
Informed Consent Statement
Data Availability Statement
Conflicts of Interest
References
- El-afifi, M.I. Solar energy: Our future for sustainable energy. Nile J. Commun. Comput. Sci. 2024, 7, 67–83. [Google Scholar] [CrossRef]
- Utility of Solar Energy in Sustainable Development. Available online: https://iipseries.org/assets/docupload/rsl2024FAEC06966F025F5.pdf (accessed on 10 October 2024).
- Bello, K.A.; Nwagwu, G.T.; Emmanuel, A.; Amoko, B.T.; Adediran, A.A.; Elewa, R.L.; Ariyo, W.J.; Ajogu, N.O.; Ibikunle, R.A.; Adeodu, A. A promising renewable source to help nigeria meet its energy demand. In Proceedings of the 2024 International Conference on Science, Engineering and Business for Driving Sustainable Development Goals (SEB4SDG), Omu-Aran, Nigeria, 2–4 April 2024; pp. 1–10. [Google Scholar] [CrossRef]
- Jafarov, E. Potential opportunities for using solar energy: Example of light industrial enterprises. Sci. Collect. «InterConf+» 2024, 44, 372–383. [Google Scholar] [CrossRef]
- Srivastava, S.K. A comparative study on grid energy and renewable solar energy system. Int. J. Humanit. Eng. Sci. Manag. 2023, 4, 14–18. [Google Scholar] [CrossRef]
- Renewable Energy Development Act. Available online: https://reurl.cc/dy3W86 (accessed on 10 October 2024).
- Dullweber, T. High-Efficiency Industrial PERC Solar Cells for Monofacial and Bifacial Applications. In High-Efficient Low-Cost Photovoltaics; Petrova-Koch, V., Hezel, R., Goetzberger, A., Eds.; Springer Series in Optical Sciences; Springer: Cham, Switzerland, 2020; Volume 140, pp. 65–94. [Google Scholar] [CrossRef]
- Kim, J.; Lee, S.; Chowdhury, S.; Yi, J. A brief review of passivation materials and process for high efficiency PERC Solar Cell. Trans. Electr. Electron. Mater. 2022, 23, 1–5. [Google Scholar] [CrossRef]
- Kashyap, S.; Madan, J.; Pssssssandey, R.; Sharma, R. Comprehensive Study on the Recent Development of PERC Solar Cell. In Proceedings of the 2020 47th IEEE Photovoltaic Specialists Conference (PVSC), Calgary, AB, Canada, 15 June–21 August 2020; pp. 2542–2546. [Google Scholar] [CrossRef]
- Rahman, R.U.; Khokhar, M.Q.; Hussain, S.Q.; Mehmood, H.; Yousuf, H.; Jony, J.A.; Park, S.; Yi, J. Progress in TOPCon Solar Cell Technology: Investigating Hafnium Oxide Through Simulation. Curr. Appl. Phys. 2024, 63, 96–104. [Google Scholar] [CrossRef]
- Khokhar, M.Q.; Yousuf, H.; Jeong, S.; Kim, S.; Fan, X.; Kim, Y.; Dhungel, S.K.; Yi, J. A Review on p-Type Tunnel Oxide Passivated Contact (TOPCon) Solar Cell. Trans. Electr. Electron. Mater. 2023, 24, 169–177. [Google Scholar] [CrossRef]
- Tsai, N.-C. Discussion on the Characteristics of Single Crystal/Polysilicon Solar Module and Single Crystal/Polysilicon PREC Solar Module. Master’s Thesis, Institute of Electrical Engineering, Kao Yuan University, Kaohsiung City, Taiwan, 2021. [Google Scholar]


| Sample | Voc (V) | Vmp (V) | Isc (A) | Imp (A) | Pmp (W) | Power Degradation Percentage |
|---|---|---|---|---|---|---|
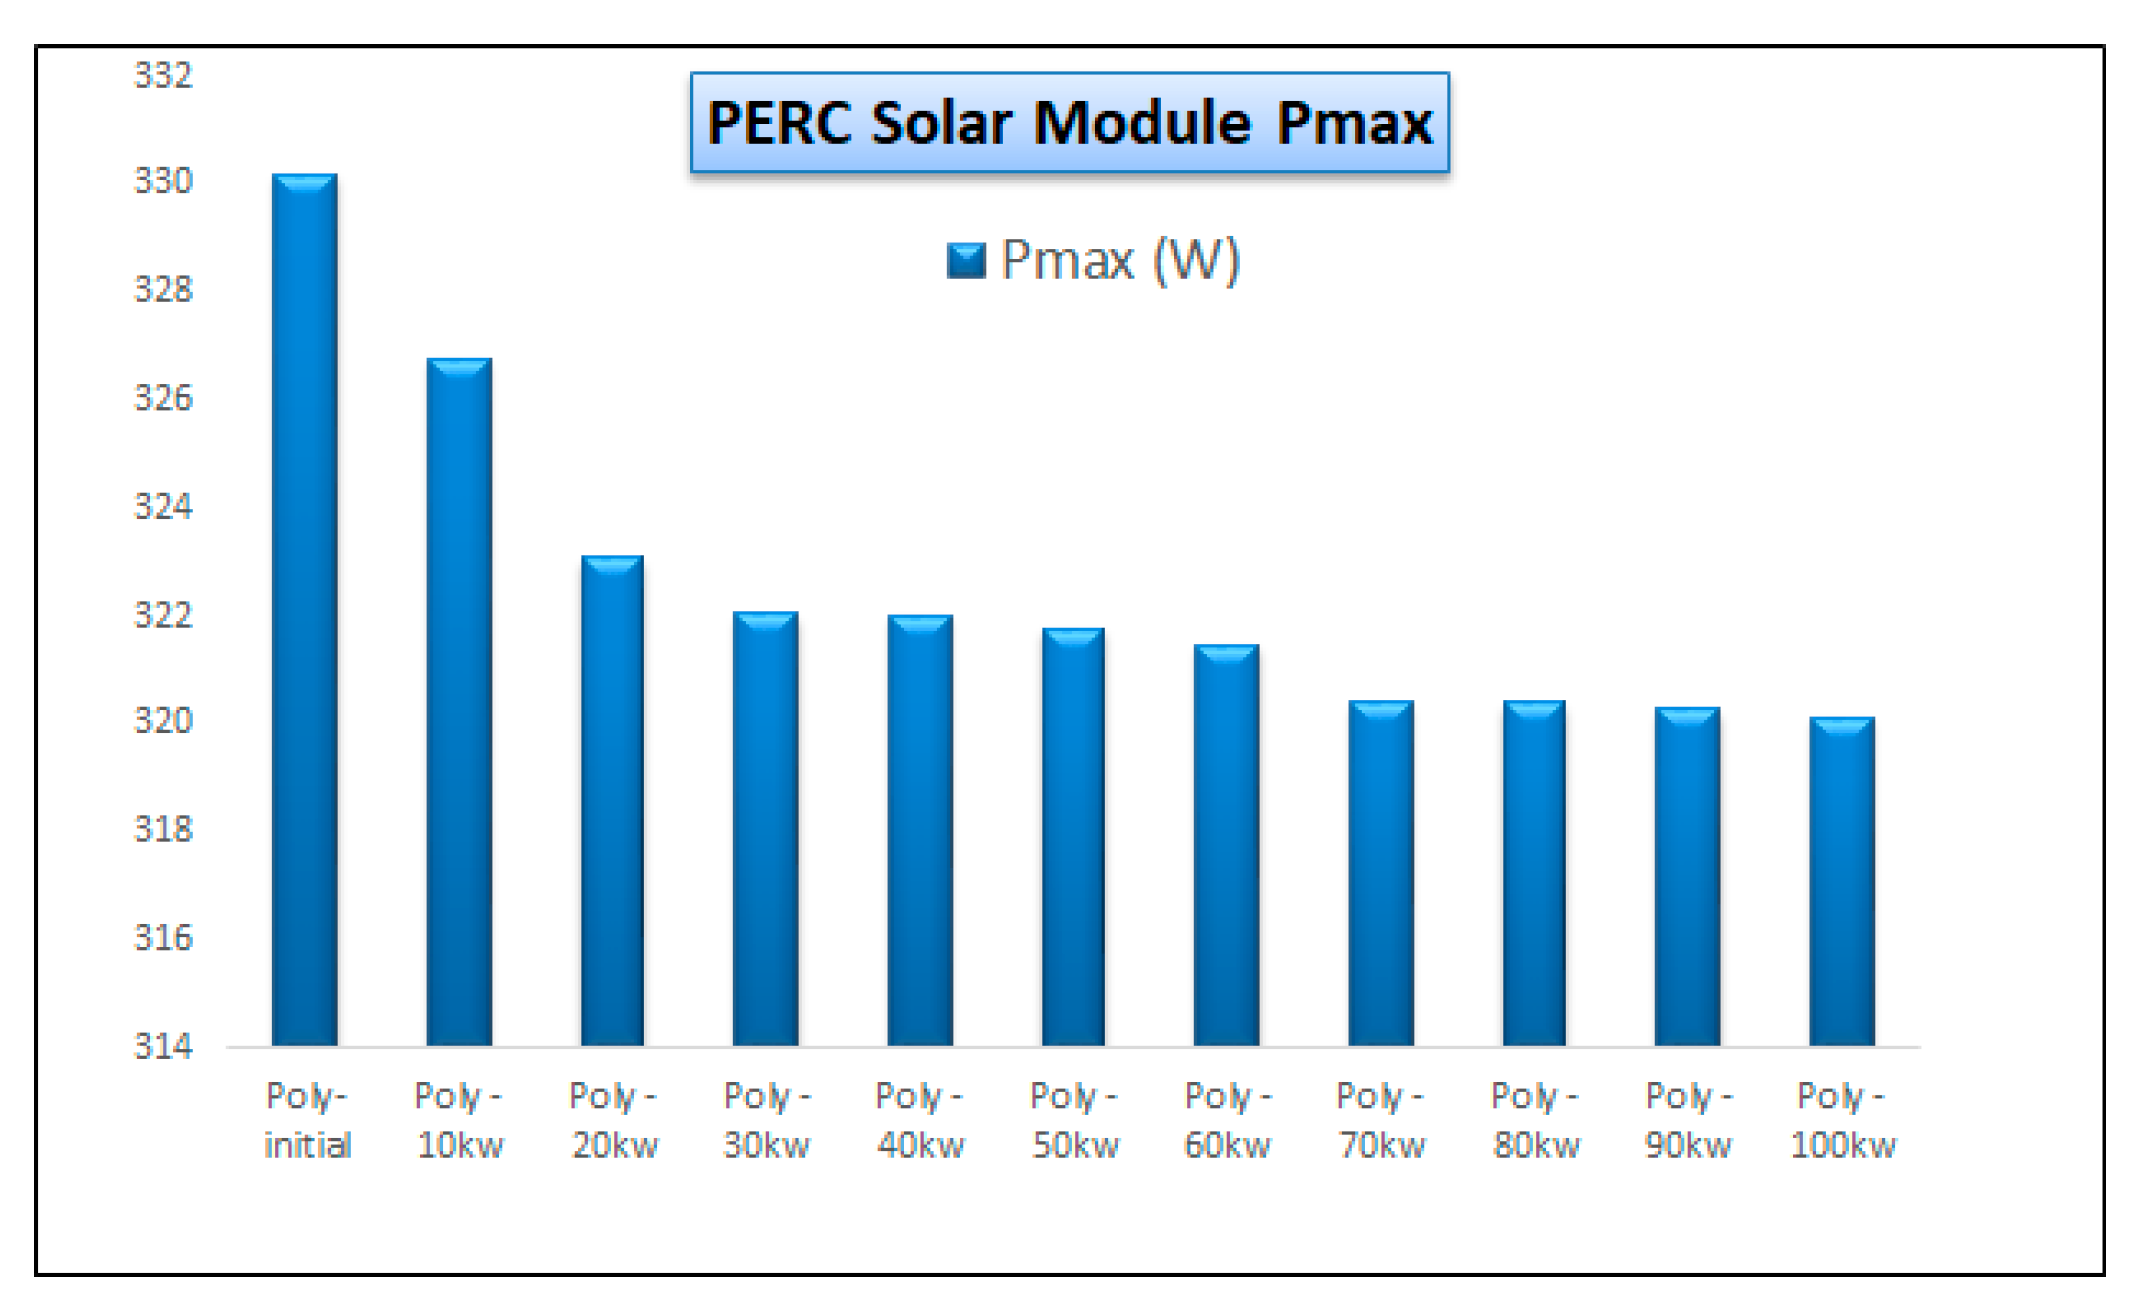
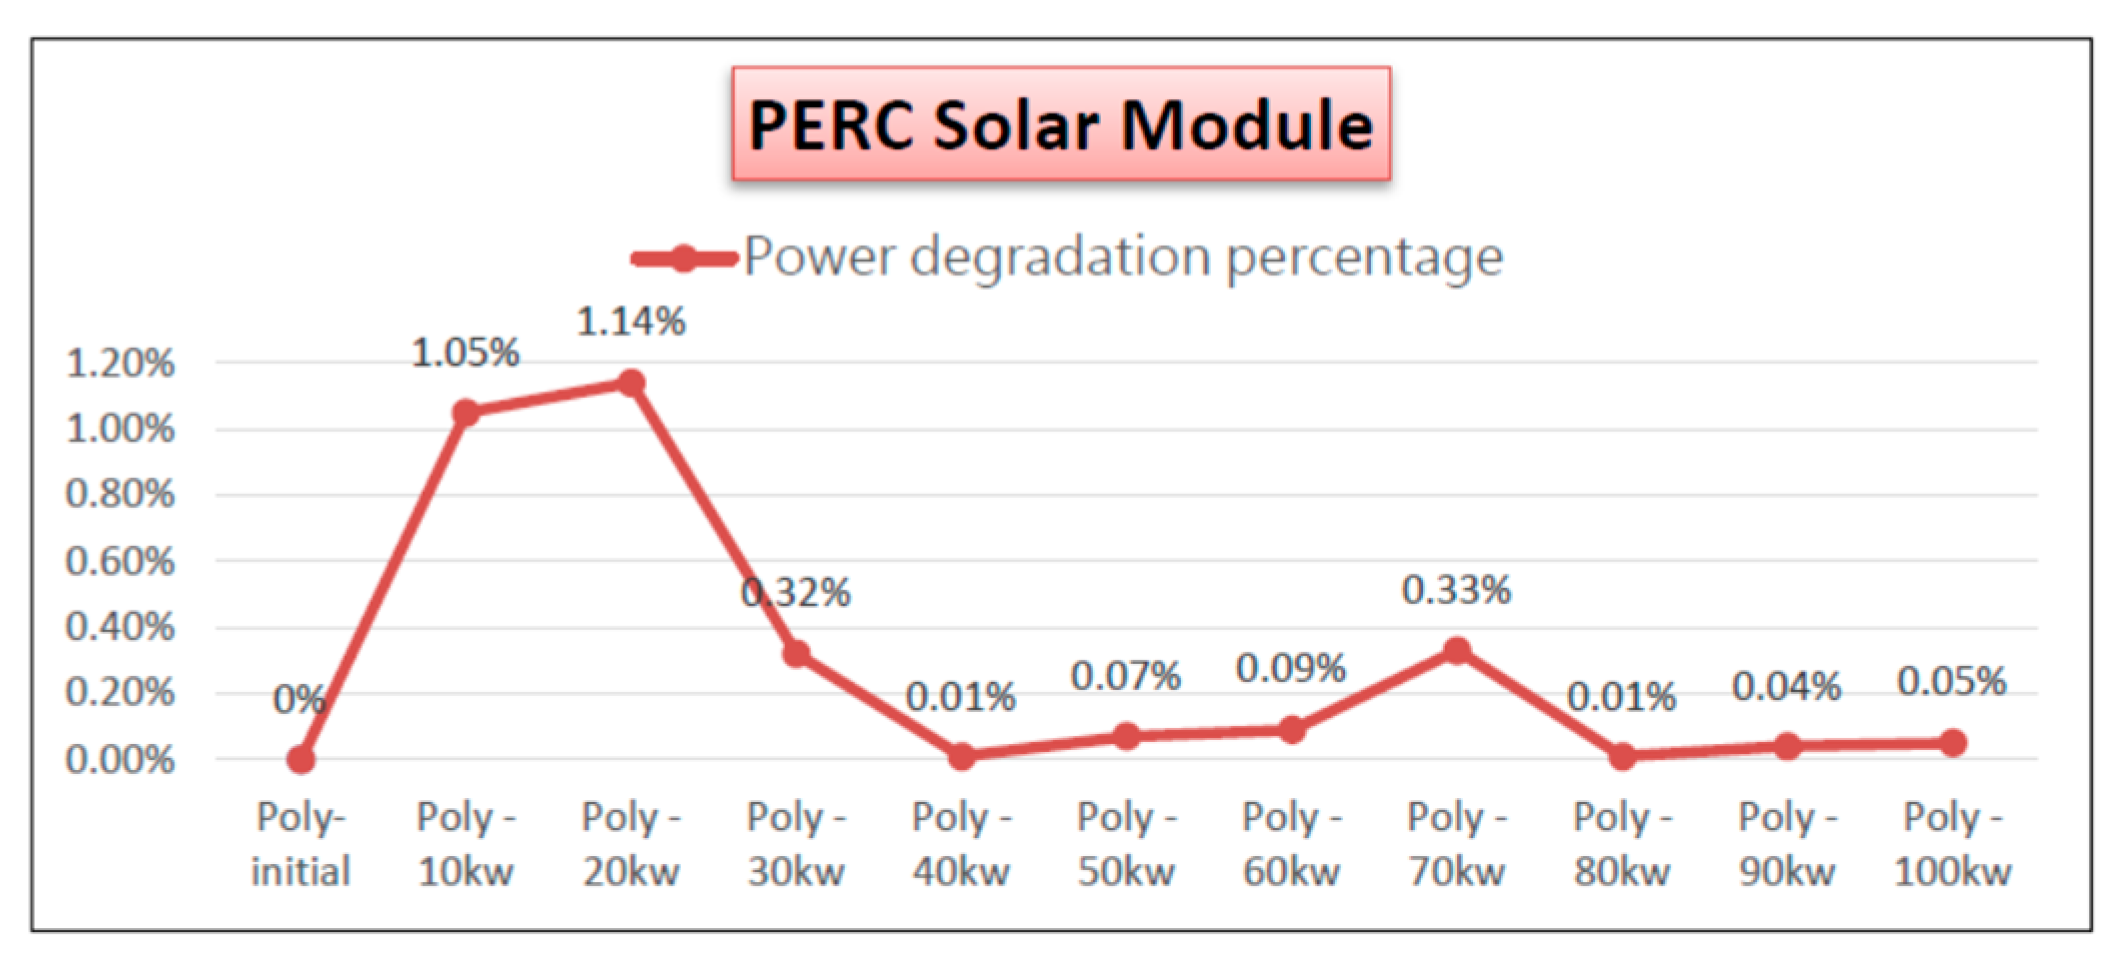
| Poly-initial | 46.589 | 37.789 | 9.213 | 8.737 | 330.192 | 0% |
| Poly-10 kw | 46.244 | 37.337 | 9.227 | 8.752 | 326.776 | 1.05% |
| Poly-20 kw | 46.265 | 37.678 | 9.121 | 8.574 | 323.08 | 1.14% |
| Poly-30 kw | 45.825 | 37.366 | 9.146 | 8.618 | 322.041 | 0.32% |
| Poly-40 kw | 46.214 | 37.388 | 9.105 | 8.612 | 322.013 | 0.01% |
| Poly-50 kw | 46.387 | 37.434 | 9.027 | 8.595 | 321.773 | 0.07% |
| Poly-60 kw | 46.394 | 37.415 | 9.018 | 8.592 | 321.481 | 0.09% |
| Poly-70 kw | 46.405 | 37.323 | 8.976 | 8.584 | 320.414 | 0.33% |
| Poly-80 kw | 46.441 | 37.305 | 8.991 | 8.588 | 320.391 | 0.01% |
| Poly-90 kw | 46.543 | 37.352 | 8.981 | 8.574 | 320.278 | 0.04% |
| Poly-100 kw | 46.554 | 37.304 | 9.022 | 8.581 | 320.131 | 0.05% |
| Sample | Voc (V) | Vmp (V) | Isc (A) | Imp (A) | Pmp (W) | Power Degradation Percentage |
|---|---|---|---|---|---|---|
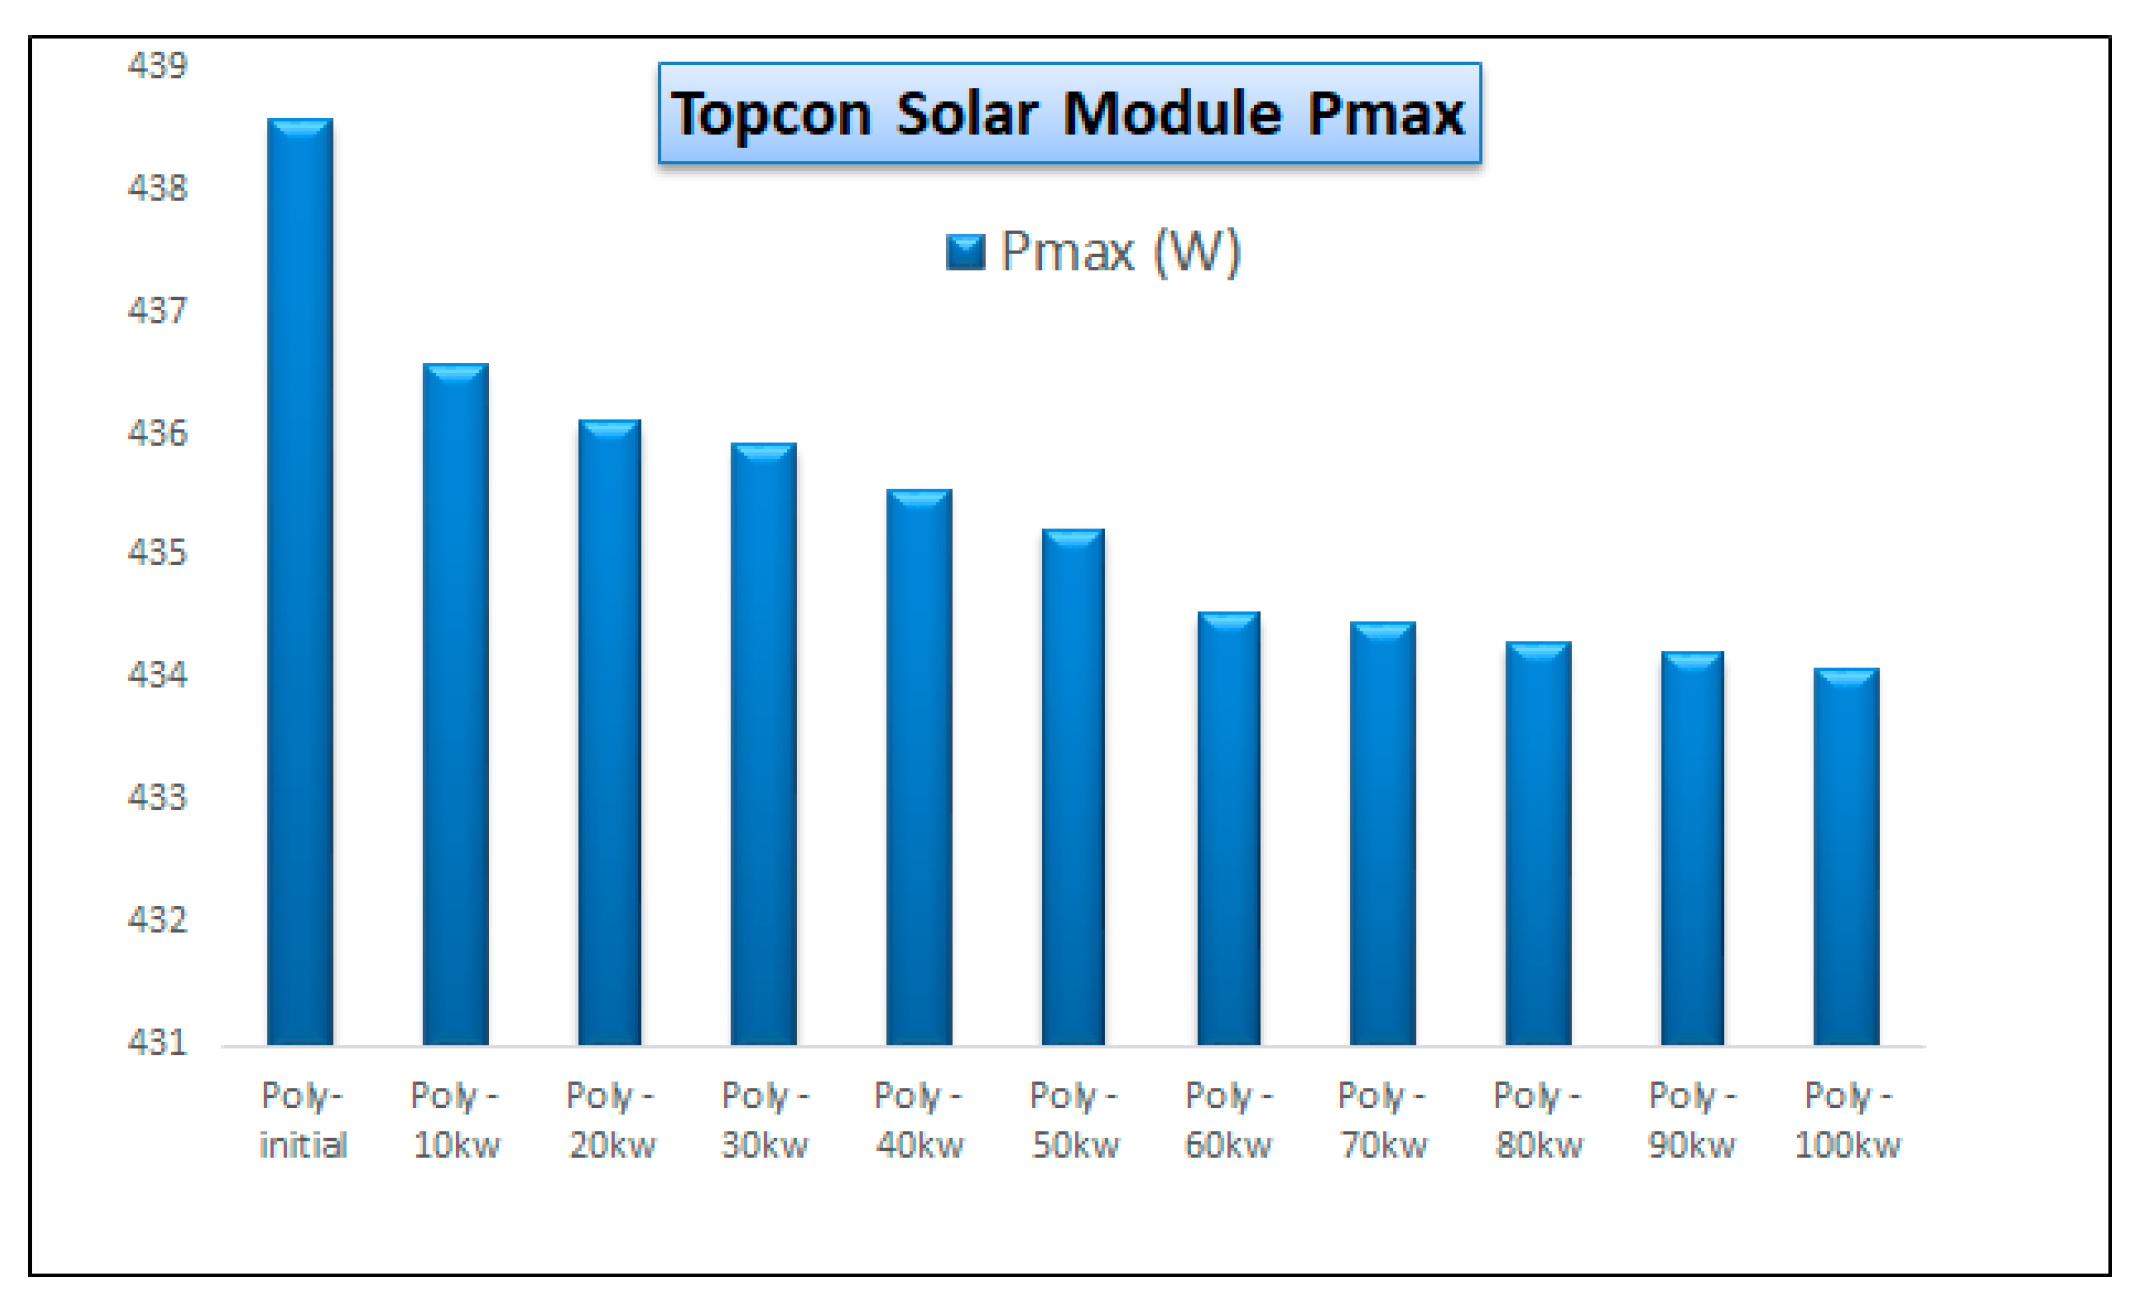
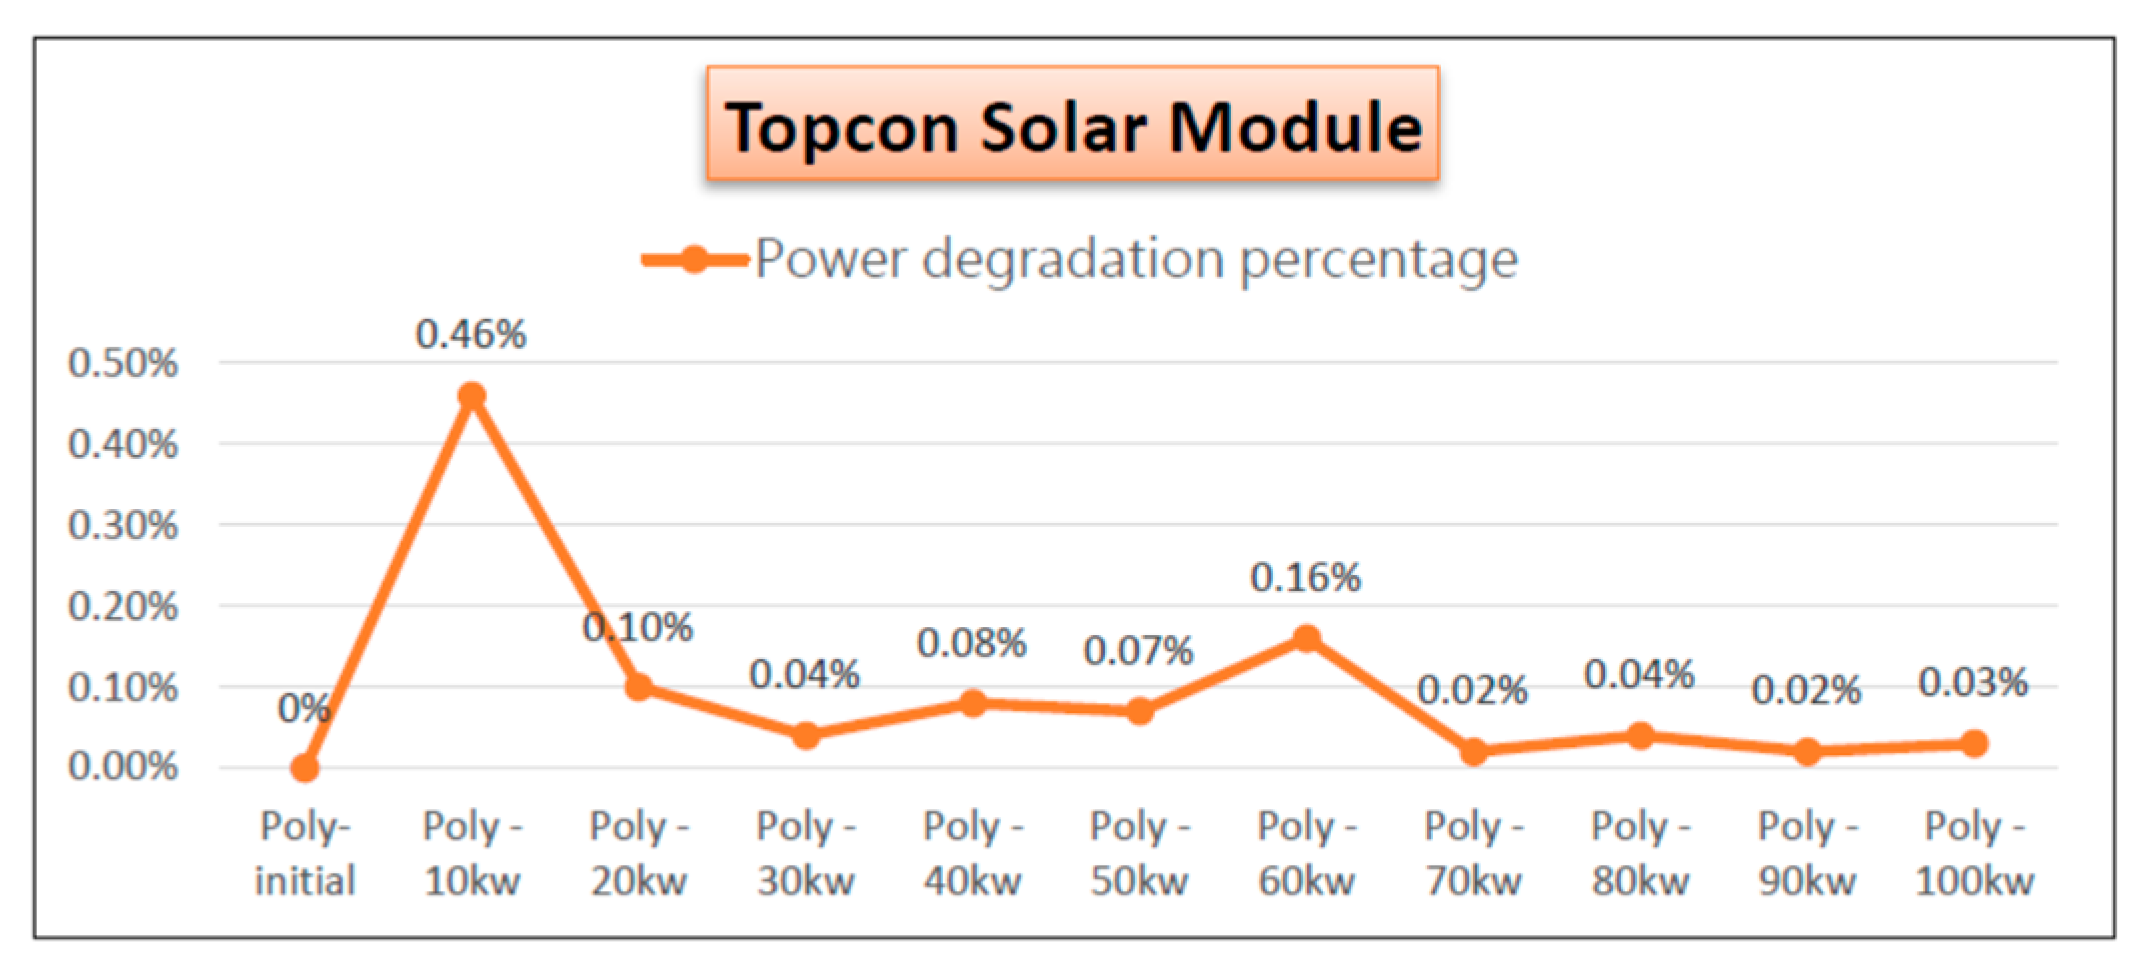
| Poly-initial | 39.4 | 32.88 | 14.02 | 13.34 | 438.56 | 0% |
| Poly-10 kw | 39.469 | 31.807 | 14.093 | 13.725 | 436.561 | 0.46% |
| Poly-20 kw | 39.529 | 31.743 | 14.113 | 13.742 | 436.105 | 0.10% |
| Poly-30 kw | 39.512 | 31.724 | 14.104 | 13.722 | 435.913 | 0.04% |
| Poly-40 kw | 39.478 | 31.801 | 14.057 | 13.801 | 435.547 | 0.08% |
| Poly-50 kw | 39.482 | 31.782 | 14.112 | 13.792 | 435.225 | 0.07% |
| Poly-60 kw | 39.489 | 31.7 | 14.072 | 13.71 | 434.526 | 0.16% |
| Poly-70 kw | 39.399 | 31.822 | 14.098 | 13.766 | 434.447 | 0.02% |
| Poly-80 kw | 39.502 | 31.781 | 14.132 | 13.698 | 434.287 | 0.04% |
| Poly-90 kw | 39.487 | 31.782 | 14.108 | 13.762 | 434.209 | 0.02% |
| Poly-100 kw | 39.458 | 31.804 | 14.097 | 13.774 | 434.092 | 0.03% |
Disclaimer/Publisher’s Note: The statements, opinions and data contained in all publications are solely those of the individual author(s) and contributor(s) and not of MDPI and/or the editor(s). MDPI and/or the editor(s) disclaim responsibility for any injury to people or property resulting from any ideas, methods, instructions or products referred to in the content. |
© 2025 by the authors. Licensee MDPI, Basel, Switzerland. This article is an open access article distributed under the terms and conditions of the Creative Commons Attribution (CC BY) license (https://creativecommons.org/licenses/by/4.0/).
Share and Cite
Tsai, T.-J.; Lu, J.-Y.; Lin, M.-H. Tunnel Oxide Passivated Contact and Passivated Emitter Rear Cell Solar Module Testing. Eng. Proc. 2025, 92, 90. https://doi.org/10.3390/engproc2025092090
Tsai T-J, Lu J-Y, Lin M-H. Tunnel Oxide Passivated Contact and Passivated Emitter Rear Cell Solar Module Testing. Engineering Proceedings. 2025; 92(1):90. https://doi.org/10.3390/engproc2025092090
Chicago/Turabian StyleTsai, Tzong-Jiy, Jun-You Lu, and Ming-Hung Lin. 2025. "Tunnel Oxide Passivated Contact and Passivated Emitter Rear Cell Solar Module Testing" Engineering Proceedings 92, no. 1: 90. https://doi.org/10.3390/engproc2025092090
APA StyleTsai, T.-J., Lu, J.-Y., & Lin, M.-H. (2025). Tunnel Oxide Passivated Contact and Passivated Emitter Rear Cell Solar Module Testing. Engineering Proceedings, 92(1), 90. https://doi.org/10.3390/engproc2025092090