1. Introduction
The collapse of the medial longitudinal arch is a characteristic of flatfoot (pes planus), a condition that can cause musculoskeletal problems and change gait mechanics. To avoid long-term problems, an accurate diagnosis is essential. Plantar pressure measurement, footprint analysis, and radiographic imaging are examples of traditional techniques [
1,
2]. These methods are limited in their applicability in standard clinical practice, though, because they either entail radiation exposure, call for specialized equipment, or depend on subjective evaluation [
3].
For the objective and non-invasive evaluation of flatfoot, morphological indices offer a substitute. It is common practice to assess foot arch structure using the Staheli Index, Chippaux–Smirak Index, and Clarke’s Angle. The study found that flatfoot is indicated by foot parameters such as a Staheli Index above 0.8125 and a Chippaux–Smirak Index above 0.4, while arch collapse is suggested by a Clarke’s Angle below 37.5 degrees [
4]. Despite being validated in a variety of populations, these indices need threshold values that are specific to a given region in order to improve diagnostic accuracy [
5].
Automated diagnostic tools are crucial for improving reproducibility and reliability, according to recent studies. Plantar pressure distribution analysis has been shown to be an effective way to distinguish between different types of flatfoot [
6,
7], has emphasized the importance of radiographic parameters like the talar uncoverage angle in diagnosing adult-acquired flatfoot. Furthermore, research has demonstrated that personalized foot orthoses considerably enhance patient-reported results, bolstering the necessity of precise detection [
8].
Despite these developments, little is known about the Indian population’s use of diagnostic tools to validate morphological indices. By creating a specially designed plantar foot imaging system that extracts morphological parameters for objective and repeatable flatfoot detection, this study fills this gap.
2. Materials and Methods
2.1. Device Design and Setup
The diagnostic device for capturing 2D plantar foot images was developed using off-the-shelf components. It features a metal frame platform with a transparent toughened glass surface capable of supporting up to 150 kg, enclosed by plywood panels. Uniform illumination is provided by LED lights along the glass edges and inside the platform, with foot placement cutouts to reduce ambient light interference. The imaging system includes two Logitech C270 digital cameras (720 p/30 fps, 0.9 MP, 55° FOV) manufactured by Logitech Asia Pacific Ltd, Hong Kong, China are mounted beneath the glass on a motorized linear sliding mechanism as shown in
Figure 1. A Python v3.9-based desktop application controls the device and collects data, while a step stool, height, and weight scales are included for accessibility and additional measurements.
Figure 1 shows the complete setup of the system.
2.2. Image Acquisition
The image acquisition process captures high-contrast, segmented plantar foot images using Total Internal Reflection (TIR)-based illumination, controlled imaging, and automated stitching. Subjects stand barefoot on a transparent toughened glass plate, with green LED strips along the edges highlighting foot contact areas via TIR. Two Logitech C270 cameras, mounted on a motorized linear carriage, move along the foot to cpture images, with a stepper motor ensuring stable motion and full coverage.
Effect of Lighting and Skin Tone: The enclosed design prevents ambient light interference, ensuring consistent imaging. TIR-based illumination makes the process independent of skin tone variations.
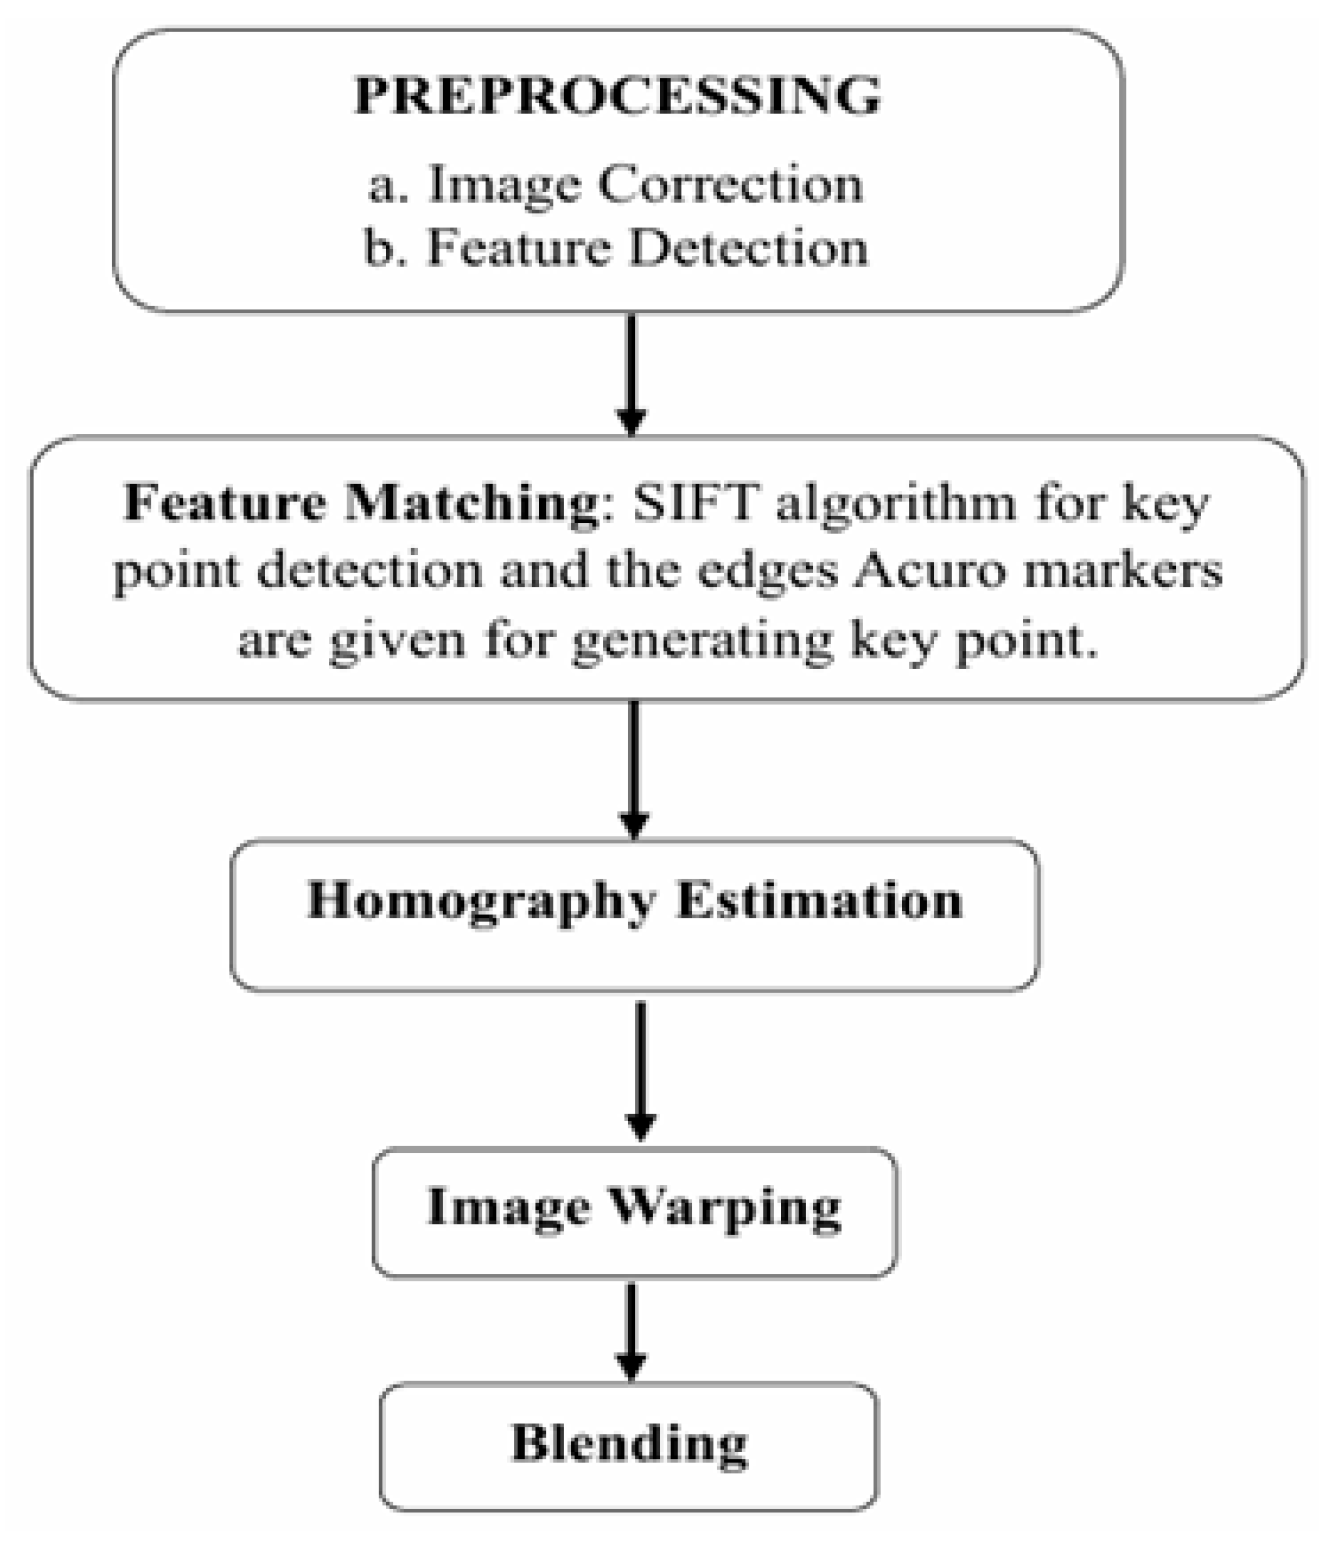
Image Stitching and Pre-processing: The pre-processing steps include resizing and making the image smooth for feature detection and matching.
Figure 2 shows a block diagram of the various steps involved in image processing and stitching.
Feature Detection and Matching: The SIFT algorithm identifies and matches key features across overlapping images.
ArUco Marker Integration: Markers along the glass edges provide reference points for alignment, eliminating reliance on foot-specific markers.
Homography Estimation and Image Warping: A transformation model aligns images based on detected key points for geometric consistency.
Blending and Seamless Integration: Overlapping regions are merged using blending algorithms to create a high-resolution, distortion-free composite image.
Segmentation and Background Removal: Color-based segmentation isolates the foot region, with a custom tuning interface for adjustments. The final image features a black background for easy feature extraction as shown in
Figure 3.
2.3. Measurement of Morphological Parameters
Key anatomical landmarks are identified on the segmented foot image, and morphological indices are calculated:
Foot Length and Width: Determined by detecting the outermost foot boundaries.
Clark’s Angle, Heel, and Forefoot Angles: Measured using key points along the plantar surface. These indices are visualized directly on the segmented image.
3. Results and Discussion
A total of 55 participants were tested to validate the system. Each provided basic information (height, weight, shoe size, and foot conditions),
Figure 4 shows the subject undergoing foot scanning process. The collected data were analyzed using scatter plots for three morphological indices: Staheli Index, Chippaux–Simirak Index, and Clarke’s Angle. The reference values for these indices were taken from previous studies.
Staheli Index: As shown in
Figure 5a, most participants’ index values were below the reference limit of 0.8125, suggesting a normal foot arch structure. However, some deviations were observed in participants suspected of having flatfeet.
Chippaux–Simirak Index:
Figure 5b shows a scatter plot with a reference threshold of 0.4 for flatfoot detection. Most participants had values below this limit, indicating normal foot morphology.
Clarke’s Angle: The scatter plot in
Figure 6 demonstrates that most participants had Clarke’s angles above 37.5 degrees, which is considered normal. However, a few participants showed significantly lower values, suggesting potential flatfoot conditions.
Table 1 summarizes the index values for selected subjects, revealing notable deviations in participants with flatfeet, which reinforces the reliability of these indices for diagnosing flatfoot conditions.
A 2D plantar foot imaging system was successfully created in this study, and a desktop application was integrated for effective data collection and analysis. When evaluating foot morphology using recognized indices like the Chippaux–Simirak, Staheli, and Clarke’s indices, the system showed an excellent accuracy. The accuracy of image stitching was greatly improved by the use of ArUco markers, guaranteeing the results’ resilience and repeatability. These results demonstrate the system’s potential for precise and non-invasive flatfoot diagnosis. Incorporating deep learning models for automated diagnosis and field-use device optimization, with an emphasis on ergonomic design and portability improvements, are future research directions. With these developments, this technology may become a useful tool for proactive healthcare in the detection of foot deformities, providing an affordable and easily accessible option for early diagnosis and treatment planning.
In comparison to other diagnostic methods, such as the medical imaging techniques used for plantar heel pain, our approach focuses on non-invasive morphological assessments rather than requiring specialized imaging like ultrasound or MRI [
9]. While medical imaging can provide detailed insights into conditions such as plantar fasciopathy [
10], our system offers a more accessible and cost-effective solution for initial screenings. The use of morphological indices in our study is consistent with the broader literature on foot conditions. For instance, studies on plantar vein thrombosis emphasize the importance of imaging techniques like ultrasound and MRI for diagnosing venous disorders in the foot [
11]. Similarly, MRI has been shown to be effective in diagnosing metatarsophalangeal plantar plate tears, highlighting the role of imaging in detailed assessments of foot anatomy [
12]. However, our system’s reliance on morphological indices provides a unique advantage in terms of simplicity and portability, making it suitable for field use in settings with limited medical facilities. Future enhancements could include integrating deep learning models for automated diagnosis and optimizing the device for real-time feedback, which would further enhance its utility in clinical settings.
4. Conclusions
A 2D plantar foot imaging system was successfully created in this study, and a desktop application was integrated into the system for effective data collection and analysis. When evaluating foot morphology using recognized indices like the Chippaux–Simirak, Staheli, and Clarke’s indices, the system showed excellent accuracy. The accuracy of image stitching was greatly improved by the use of ArUco markers, guaranteeing the results’ resilience and repeatability. These results demonstrate the system’s potential for precise and non-invasive flatfoot diagnosis. Incorporating deep learning models for automated diagnosis and field-use device optimization, with an emphasis on ergonomic design and portability improvements, are future research directions. With these developments, this technology may become a useful tool for proactive healthcare in the detection of foot deformities, providing an affordable and easily accessible option for early diagnosis and treatment planning.
5. Limitations
There are multiple limitations to this study. First off, a deep learning model cannot be developed with the 55-person dataset; further improvements will require a larger and more varied sample. The scanning procedure, which takes around a minute, might also be too long for patients who have trouble balancing. Because dust, moisture, or dirt can impair segmentation accuracy, the need for a clean glass surface and dry feet to guarantee optimal image capture presents practical difficulties. The integration of deep learning algorithms would be necessary to achieve a real-time flatfoot diagnosis, which is currently not possible with the current setup, even though the current system offers accurate assessments.
Author Contributions
Conceptualization, K.V.; methodology, K.K.; software, K.K.; validation, K.K. and K.V.; formal analysis, B.D.; investigation, K.K.; resources, K.V.; data curation, K.K.; writing—original draft preparation, K.K.; writing—review and editing, K.V.; visualization, K.K.; supervision, K.V. All authors have read and agreed to the published version of the manuscript.
Funding
This research received no external funding.
Institutional Review Board Statement
Approval obtained from Institutional Ethics Committee- Kasturba Medical College, Mangalore (Approval No: IEC KMC MLR 09/2021/292).
Informed Consent Statement
Informed consent was obtained from all subjects involved in the study.
Data Availability Statement
Data for this study are available upon request from the corresponding author.
Conflicts of Interest
Author Bishwaranjan Das was employed by the KMC Hospital. The remaining authors declare that the research was conducted in the absence of any commercial or financial relationships that could be construed as a potential conflict of interest.
References
- Harris, E.J.; Vanore, J.V.; Thomas, J.L.; Kravitz, S.R.; Mendelson, S.A.; Mendicino, R.W.; Gassen, S.C. Diagnosis and treatment of pediatric flatfoot. J. Foot Ankle Surg. 2004, 43, 341–373. [Google Scholar] [CrossRef] [PubMed]
- Roth, S.; Roth, A.; Jotanovic, Z.; Dembic, Z. Navicular index for differentiation of flatfoot from normal foot. Int. Orthop. 2013, 37, 1107–1112. [Google Scholar] [CrossRef] [PubMed]
- Pauk, J.; Daunoraviciene, K.; Ihnatouski, M.; Griskevicius, J.; Raso, J.V. Analysis of the plantar pressure distribution in children with foot deformities. Acta Bioeng. Biomech. 2010, 12, 29–34. [Google Scholar] [PubMed]
- Koirala, S.; Khanal, G.P.; Shah, S.; Khanal, L.; Yadav, P.; Baral, P. Calculation of Staheli’s Plantar Arch Index, Chippaux-Smirak Index, Clarke’s Angle Prevalence and Predictors of Flat Foot: A cross-sectional study. Austin J. Anat. 2021, 8, 1095. [Google Scholar]
- Ramos, A.; Fernandes, S.; Pooja, P.; Panicker, P.J.; Krishnan, P. Assessment of flat foot using plantar arch index in young adults. Biomedicine 2021, 41, 535–538. [Google Scholar] [CrossRef]
- Khan, F.; Chevidikunnan, M.F.; BinMulayh, E.A. Plantar pressure distribution in the evaluation and differentiation of flatfeet. Gait Posture 2023, 101, 82–89. [Google Scholar] [CrossRef] [PubMed]
- Krishnaprasad, P.R.; Gowtham, Y.; Shah, H. Comparison of Radiological Parameters to Predict Adult Acquired Flatfoot in the Indian Population. Muscles Ligaments Tendons J. 2024, 14, 301–305. [Google Scholar] [CrossRef]
- Oerlemans, L.N.T.; Peeters, C.M.M.; Munnik-Hagewoud, R. Foot orthoses for flexible flatfeet: A systematic review and meta-analysis. BMC Musculoskelet. Disord. 2023, 24, 16. [Google Scholar] [CrossRef] [PubMed]
- Drake, C.; Whittaker, G.A.; Kaminiski, M.R.; Chen, J.; Keenan, A.M.; Rathleff, M.S.; Robinson, P.; Landorf, K.B. Medical imaging for plantar heel pain: A systematic review and meta-analysis. J. Foot Ankle Res. 2022, 15, 4. [Google Scholar] [CrossRef] [PubMed]
- McNally, E.G.; Shetty, S. Plantar Fascia: Imaging Diagnosis and Guided Treatment. Semin. Musculoskelet. Radiol. 2010, 14, 334–343. [Google Scholar] [CrossRef] [PubMed]
- Miranda, F.C.; Castro, A.A.; Yosshimura, F.B.; Godoy Santos, A.L.; Barrows Santos, C.; Rosemberg, L.A.; Taneja, A.K. Imaging Features of Plantar Vein Thrombosis: An Easily Overlooked Condition in the Differential Diagnosis of Foot Pain. Diagnostics 2024, 14, 126. [Google Scholar] [CrossRef] [PubMed]
- Yamada, A.F.; Crema, M.D.; Nery, C.; Baumfeld, D.; Mann, T.S.; Skaf, A.Y.; Fernandes, A.C.R. Second and Third Metatarsophalangeal Plantar Plate Tears: Diagnostic Performance of Direct and Indirect MRI Features Using Surgical Findings as the Reference Standard. Musculoskelet. Imaging 2017, 209, 101–108. [Google Scholar] [CrossRef] [PubMed]
| Disclaimer/Publisher’s Note: The statements, opinions and data contained in all publications are solely those of the individual author(s) and contributor(s) and not of MDPI and/or the editor(s). MDPI and/or the editor(s) disclaim responsibility for any injury to people or property resulting from any ideas, methods, instructions or products referred to in the content. |
© 2025 by the authors. Licensee MDPI, Basel, Switzerland. This article is an open access article distributed under the terms and conditions of the Creative Commons Attribution (CC BY) license (https://creativecommons.org/licenses/by/4.0/).


