Proceeding Paper

Molding Characteristics and Impact Strength of Polypropylene with Different Numbers of Recycling Cycles †

1
Department of Mechanical and Computer-Aided Engineering, Feng Chia University, Taichung 40724, Taiwan
2
Department of Ph.D. Program of Mechanical and Aerospace Engineering, Feng Chia University, Taichung 40724, Taiwan
*
Author to whom correspondence should be addressed.
Presented at the 2024 IEEE 6th Eurasia Conference on IoT, Communication and Engineering, Yunlin, Taiwan, 15–17 November 2024.
Eng. Proc. 2025, 92(1), 88; https://doi.org/10.3390/engproc2025092088
Published: 29 May 2025
(This article belongs to the Proceedings of 2024 IEEE 6th Eurasia Conference on IoT, Communication and Engineering)

Abstract

We analyzed the changes in the molding properties of polypropylene (PP) resin in the process of recycling after multiple plasticization, injection, and crushing processes. We also explored the changes in the material properties and characteristics with the ASTM-D256 impact test specimen and the number of recycling cycles. After the material is injected and crushed, it is recycled to produce the material required for re-injection, and a pressure sensor is installed at the nozzle position to observe the effects of material properties and impact characteristics in recycling. Injecting and pulverizing PP several times results in looser molecular spacing, increasing the fluidity of the material. After several recycling cycles, the fluidity of the material gradually decreased. Its crystallinity fluctuated depending on the crystallinity and crystallization rates. Recycled PP materials in various molding processes were influenced by melt temperature, screw speed, back pressure, and injection speed, which also affected nozzle pressure and strength. As the melt temperature increased, the effect on the nozzle pressure and impact strength became more evident.

1. Introduction

Due to increasing environmental awareness, the proportion of recycled materials in the molding process is gradually increasing. Aside from environmental concerns, the use and addition of recycled materials reduce the amounts of raw materials used and lower the costs of raw materials. However, it is necessary to understand the molding characteristics of plastic materials used in product processing (e.g., flow characteristics, pressure changes, and temperature changes) to maintain a stable quality of product molding. Therefore, it is necessary for industry players and researchers to study the physical changes and molding characteristics of recycled materials. Aurrekoetxea et al. produced recycled materials by implementing a recycling process after manufacturing products with polypropylene, observing the effects caused by changes in chemical structure, melt viscosity, crystallization behavior, and tensile strength [1]. The grinding and recycling of polypropylene cause the breakage of the molecular chain, which reduces melt viscosity while presenting a higher crystallization rate. Meanwhile, the yield stress and Young’s modulus increase with the number of recycling cycles. In the shear melting and plasticization process of injection molding machines, molecular chains are affected by pressure and shear, which influence the breakage of molecular chains and shorter chains, alter the mechanical properties of molded products, and affect product quality. Using polypropylene as the recycled material and mold cavity pressure sensors, Huang et al. [2]. conducted injection molding experiments and estimated the cavity melt pressure and viscosity index after different numbers of recycling cycles. As the number of recycling cycles increased, the raw materials exhibited a high melt index, melt flow characteristics, melt peak area, crystallinity, crystallization rate, and crystallization temperature. By monitoring the real-time changes in cavity pressure and calculating the viscosity index, the influence of flow characteristics and quality changes on recycled materials was observed. Recycled materials in the manufacturing phase and the influence of the proportion of recycled materials added were analyzed by investigating the correlation between the use of recycled materials and product quality in terms of mold cavity pressure and temperature sensor information [3,4,5,6,7,8,9]. The relationships between the change in nozzle pressure, melt flow characteristics, and mechanical properties influence the multiple cycles that raw materials go through, including melt plasticizing → injection → recycling and grinding.
We investigated the effect of the repeated molding and grinding of plastic materials in the injection molding process by observing the changes and correlation of the molding characteristics of plastic materials. The melt flow rate (MFR) and thermal properties of recycled materials were simultaneously measured and analyzed. Through impact specimen molding experiments and tests, we also explored the changes in nozzle pressure, viscosity index, and impact strength. The number of recycling cycles increased from the plasticization to the filling phase. The process parameters included melt temperature, screw speed, back pressure, and injection speed. The results of this study offer a reference for mold manufacturers and researchers investigating the molding characteristics and mechanical properties of recycled materials.

2. Methods

2.1. Material

The polymer used in this study was polypropylene (PP, YUNGSOX PP-1040) manufactured by Formosa Plastics Corporation in Taipei, Taiwan. This material has excellent heat resistance, robust rigidity, and high impact and chemical resistance. PP is commonly used for the manufacturing of toys, electrical appliances, and household goods.

2.2. Mold and Molded Specimen

The mold used in this study was paired with a removable core, as illustrated in Figure 1. The specifications included ASTM D256 impact specimens, with dimensions of 63 × 12.7 × 3 mm (width × length × height) for the notched specimen (Izod notched specimen).

2.3. Injection Molding Machine

We used a 60-ton toggle-type injection molding machine (CLF-60TX) produced by Chuan Lih Fa (CLF) Machinery Works Co., Ltd., Tainan, Taiwan. Its injection unit has a screw diameter of 30 mm, a maximum injection rate of 115 cm3/s, and a maximum injection pressure of 2951 kg/cm2, and its hydraulic system is controlled by a servo motor (D662-4013, MOOG Inc., New York, NY, USA), ensuring stable injection and plasticizing quality with a precise monitoring system.

2.4. Plastic Crusher

The plastic grinder was manufactured by Best Success Industrial Co., Ltd., Taichung, Taiwan, model TGP-2622 3HP. The grinding diameter is 230 mm, with an internal knife configuration that includes 2 fixed blades and 6 rotating blades. The dimensions of the machinery are 10,000 × 7200 × 14,900 mm, with a maximum horsepower of 3.

2.5. Experiments

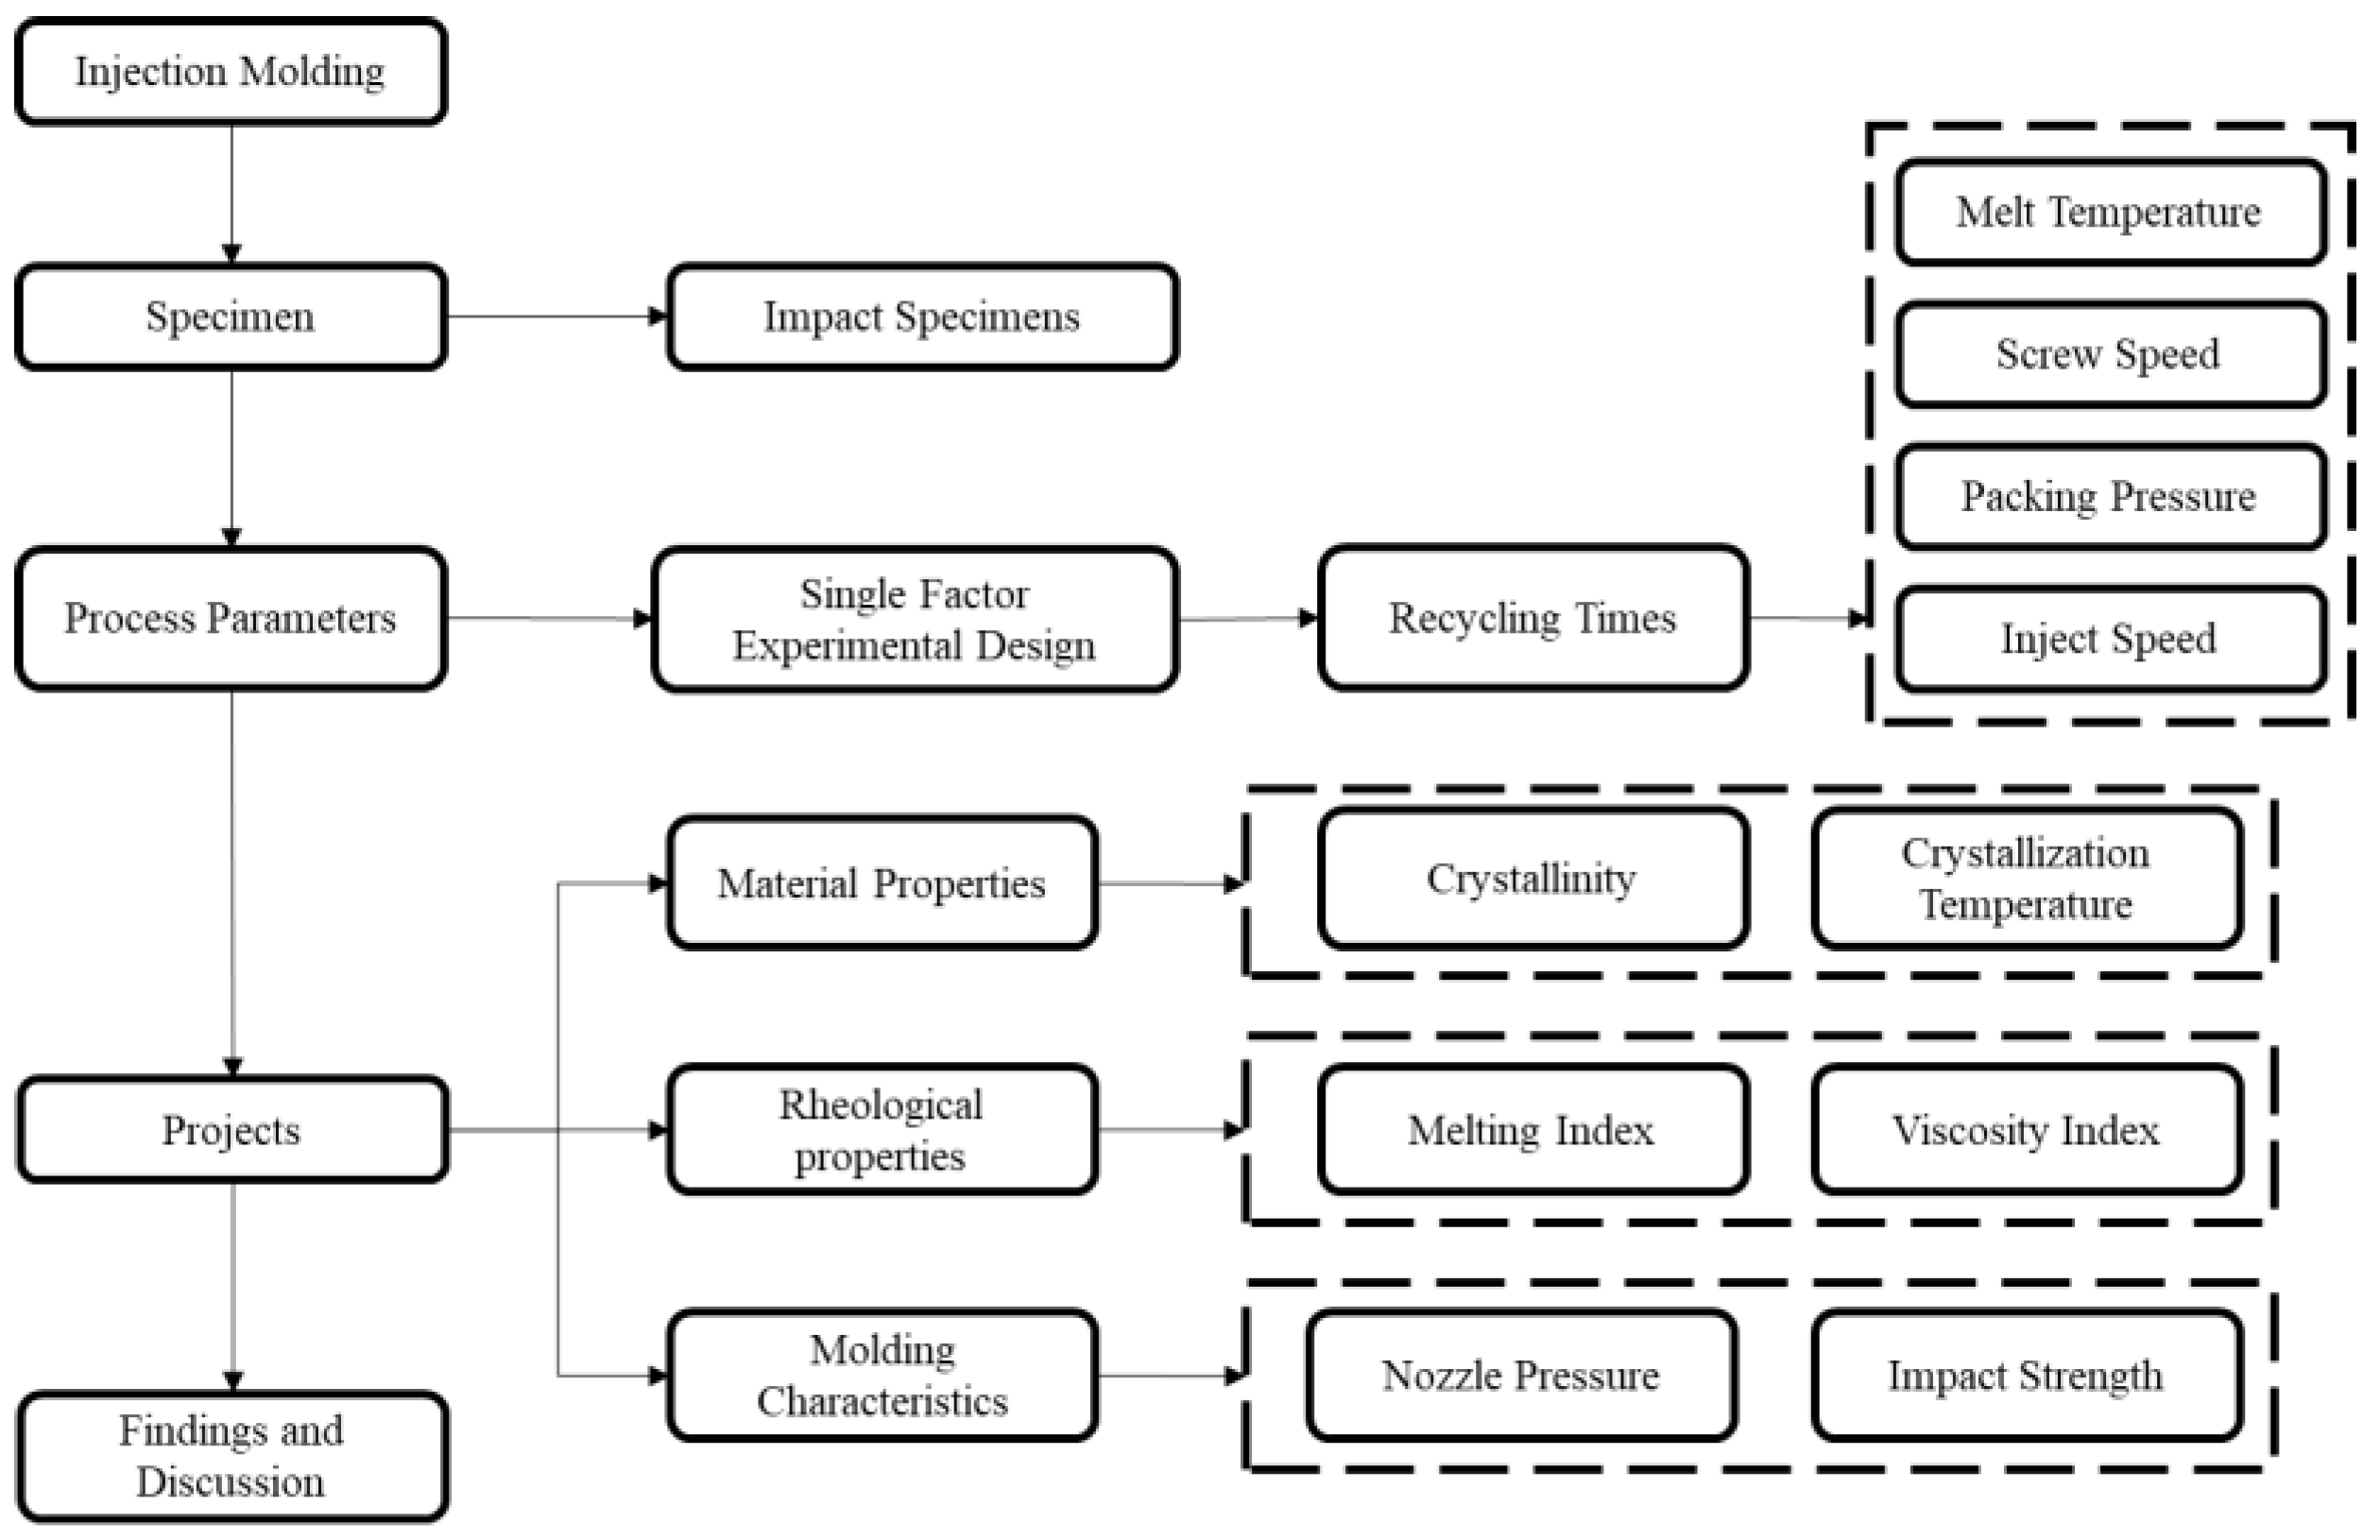
PP was used as the molding material in multiple cycles of melt plasticizing → injection → recycling and grinding (with a maximum of five recycling cycles) to conduct impact tests. Its characteristics in the injection molding process, viscosity, and impact strength were analyzed. The design of experiments (DOE) was used to plan the experiment. Systematic analysis was conducted in a two-phase experiment, as shown in Figure 2. The first phase involved injection molding of plastic materials through fixed molding parameters at different recycling frequencies (recycling frequencies: 0, 1, 2, 3, 4, and 5). The physical properties of the plastic materials (melt index and crystallinity) were explored, and the molding characteristics (nozzle pressure, viscosity index, and impact strength) were observed.
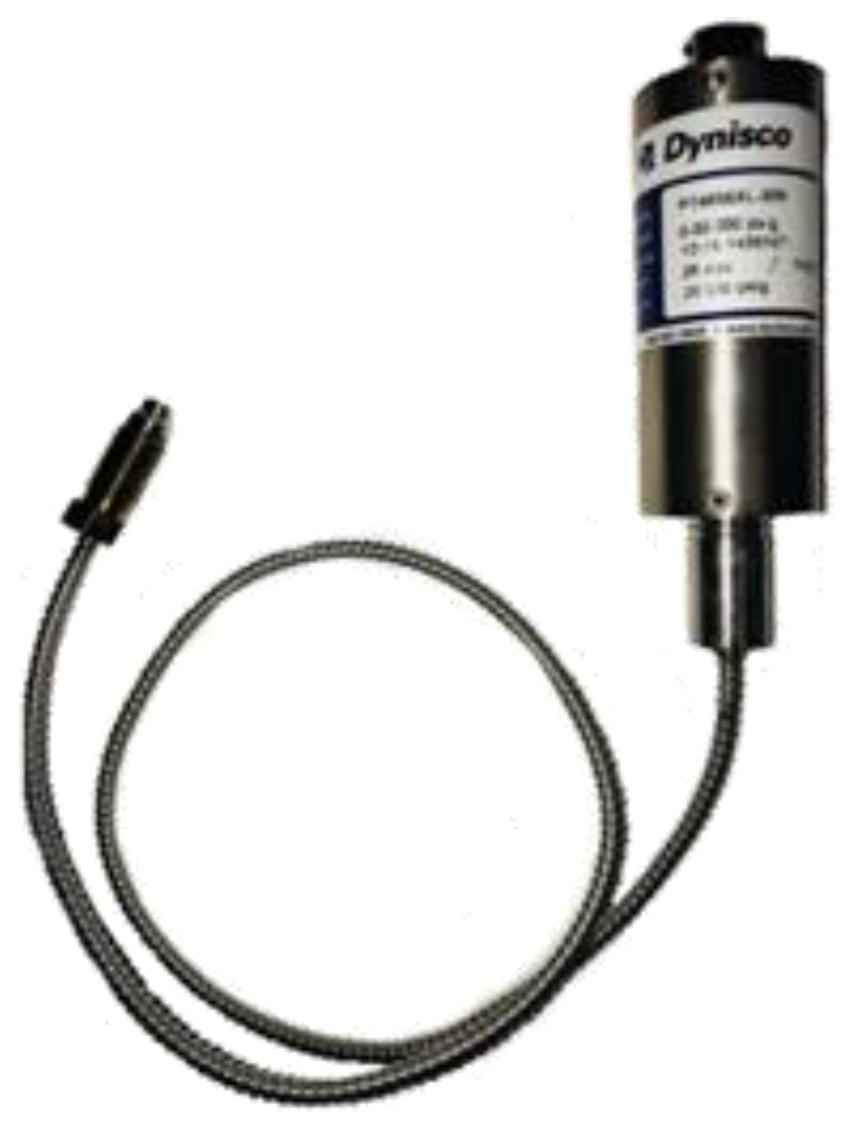
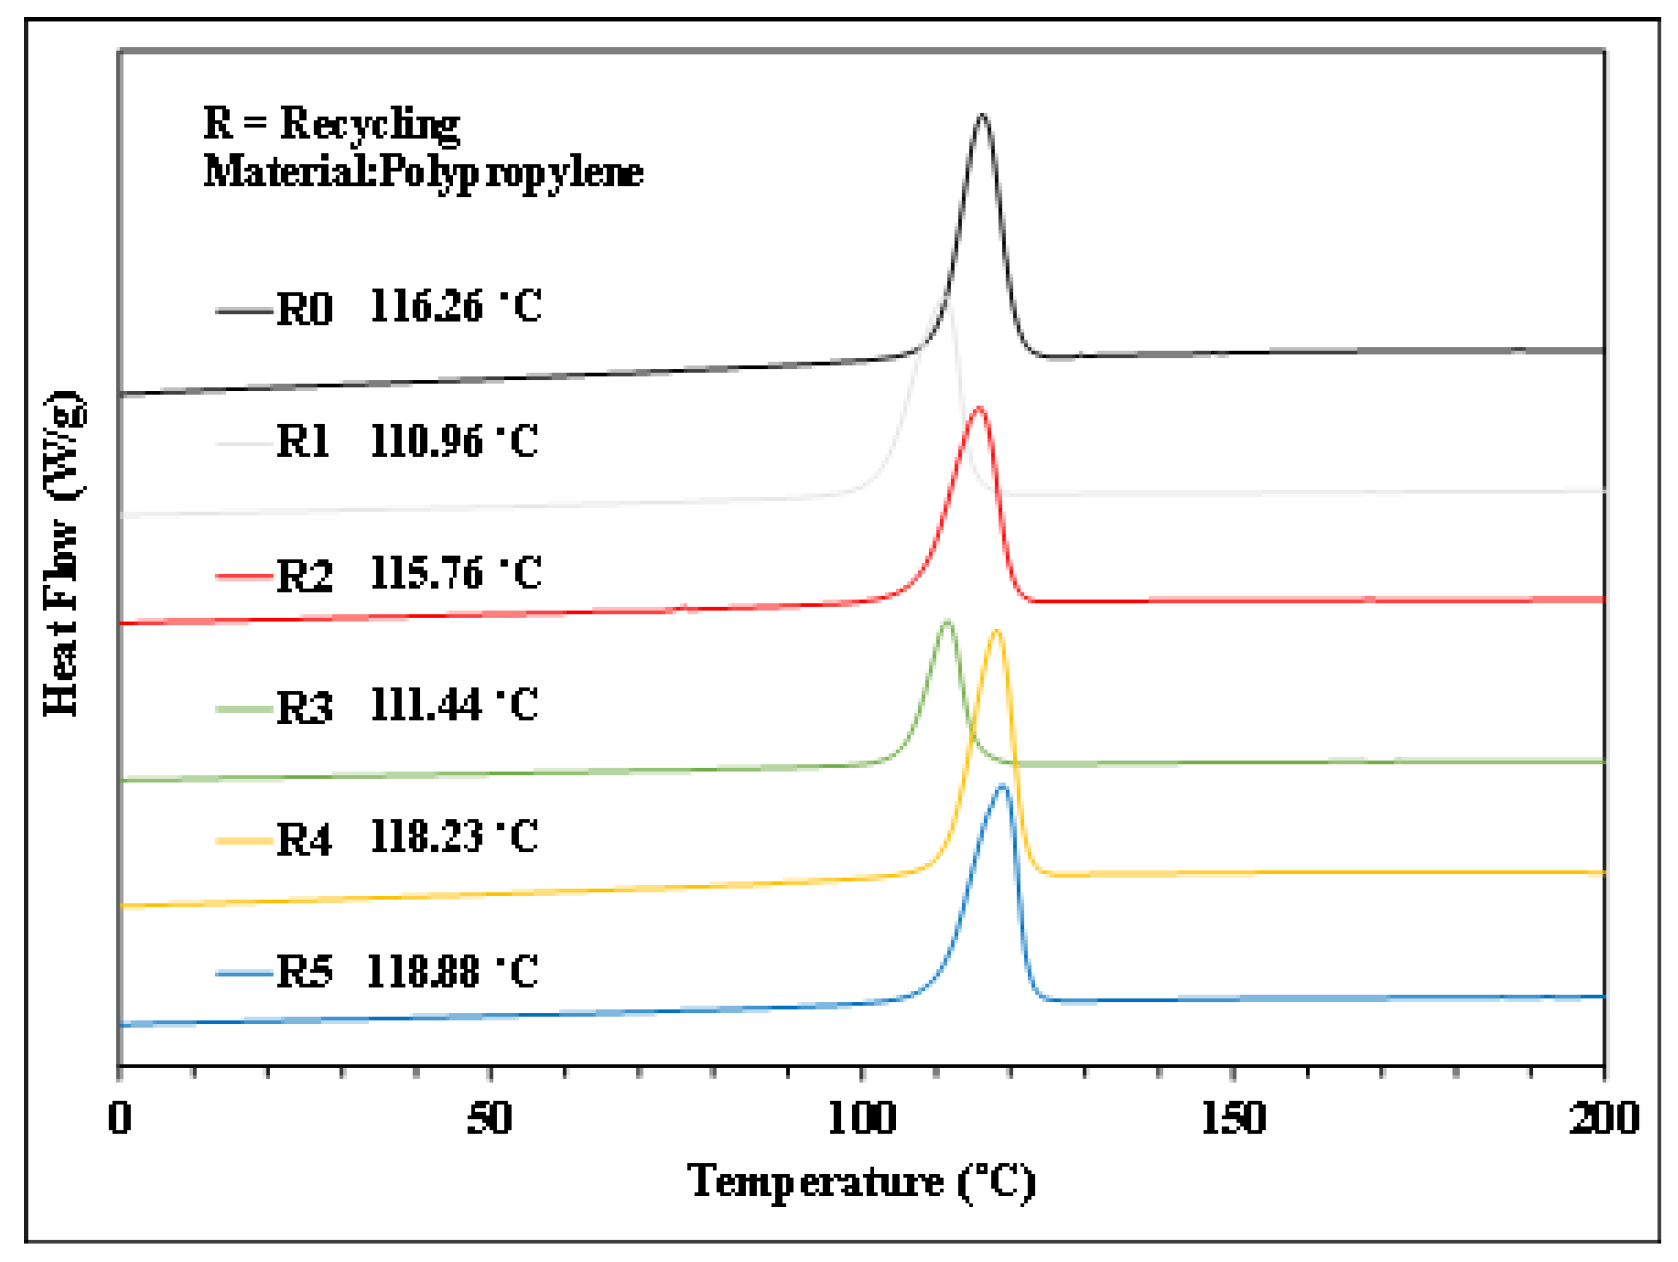
Table 1 shows the parameter design in the first phase of the experiment. The melt flow index of plastic materials with different recycling times was estimated using a melt flow index testing machine (manufactured by Cometech Testing Machines Co., Ltd., Taichung, Taiwan, model QC-652S). According to the temperature and load specifications outlined in ASTM D1238, the flow mass and volume of the PP in a molten state were measured for a specified time, and their melt flow rate (MFR) was calculated. In measuring the crystallinity of plastic materials with different numbers of recycling cycles, a modulated differential scanning calorimeter (DSC, model MDSC2920, manufactured by TA Instruments, New Castle, DE, USA) was used to measure recycled materials after different numbers of recycling cycles. The heat output was measured using a heat flux detector, and the changes in thermal flow were recorded over time. DSC was measured at a heating rate of 10 °C/min. After reaching 200 °C, it was maintained for 3 min, then cooled at a rate of 10 °C/min. The enthalpy changes were measured, and crystallinity was calculated for the analysis of recycled plastic properties. To understand the molding characteristics of recycled plastic products, a nozzle pressure sensor was installed at the nozzle position of the injection machine to measure the changes in the melt pressure of the recycled plastic in the injection molding process. A pressure sensor (model PT4656XL-30M, manufactured by Dynisco, Franklin, MA, USA) was also used (Figure 3). The relationship between the viscosity index (VI) of the molten adhesive and product molding characteristics indicated that the viscosity index reflected the molding pressure required for plastic raw materials during the filling and molding process [10,11,12,13]. This index was used in the development of parameter adjustment. We used Equation (1) to calculate the viscosity index, where Scrpos is the screw position and Pmelt is the melt pressure.
Viscosity   Index Injection = S c r p o s   1 S c r p o s   2 P m e l t ( t ) d t
The viscosity index was calculated using the area under the pressure from the starting screw position of injection to the position of the velocity/pressure switchover point. Figure 4 shows a schematic diagram of the viscosity index calculation method for the injection process (blue region) (Figure 4). For the molding and testing of impact specimens of PP with different numbers of recycling cycles, an electronic impact tester (model QC-639S, manufactured by Cometech Testing Machines Co., Ltd., Taichung, Taiwan.) was used to measure impact strength. The results from the first phase of the experiments were used to establish appropriate process parameters for subsequent experiments. The process conditions are shown in Table 1. Melt-pressure fluctuations were monitored using sensors positioned at the nozzle. The impact strength of the molded specimens was also measured to investigate the correlations between nozzle pressure and impact strength variations in response to alterations in molding parameters for PP undergoing various recycling cycles.

3. Results and Discussion

PP was used as the molding material to measure the physical properties of plastic materials (melt flow index and crystallinity) and investigate molding characteristics (nozzle pressure, viscosity index, and impact strength) after different numbers of recycling cycles. Figure 5, Figure 6, Figure 7, Figure 8, Figure 9, Figure 10, Figure 11, Figure 12, Figure 13 and Figure 14 present the results of the first phase of the experimental study.
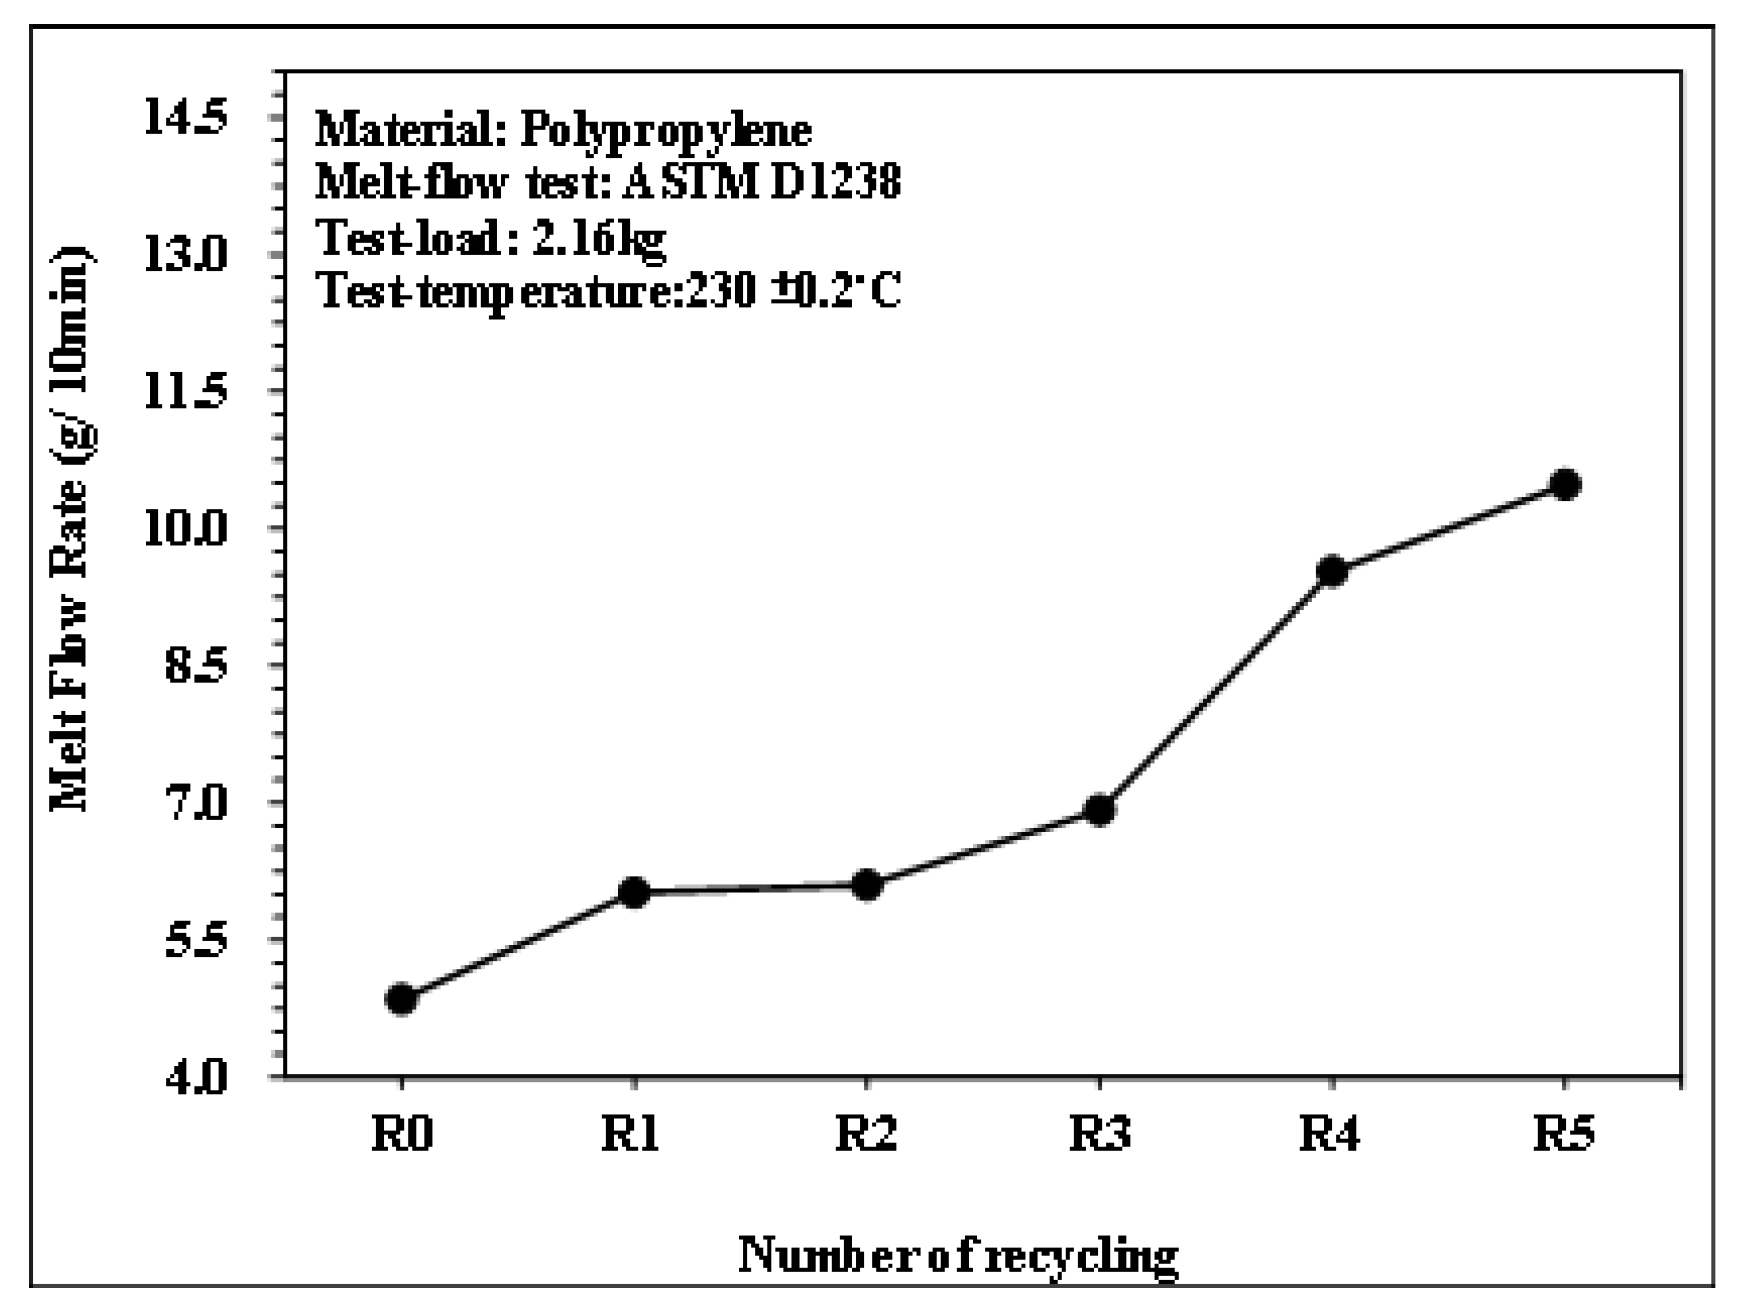
Figure 5 illustrates the melt flow index of PP under different numbers of recycling cycles, measured using the melt flow index testing machine. As the number of recycling cycles increased, the melt flow index of the polypropylene raw material also increased. When PP undergoes shear stress and heating, filling flow processes in melt plasticizing → injection → recycling and grinding cause damage to the molecular chains and decrease molecular weight, improving the fluidity of the material.
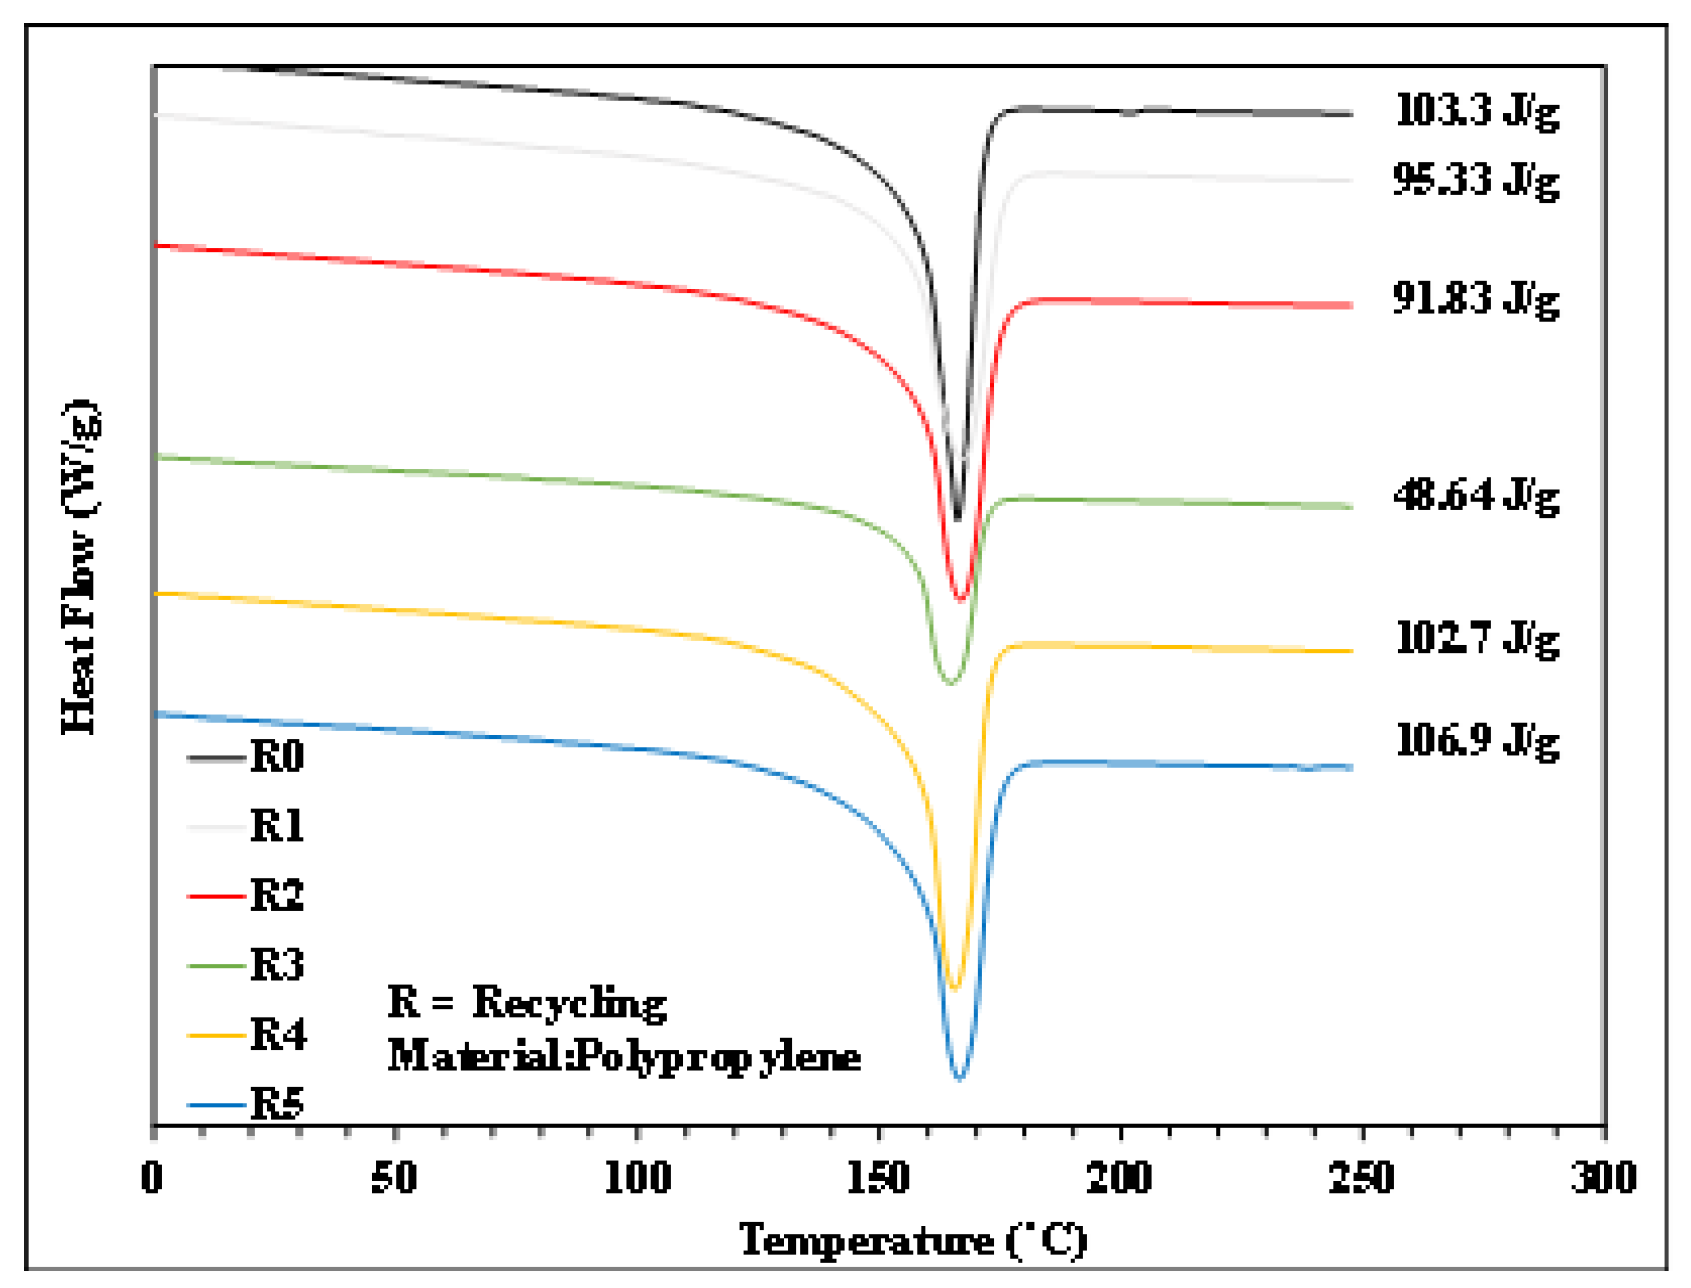
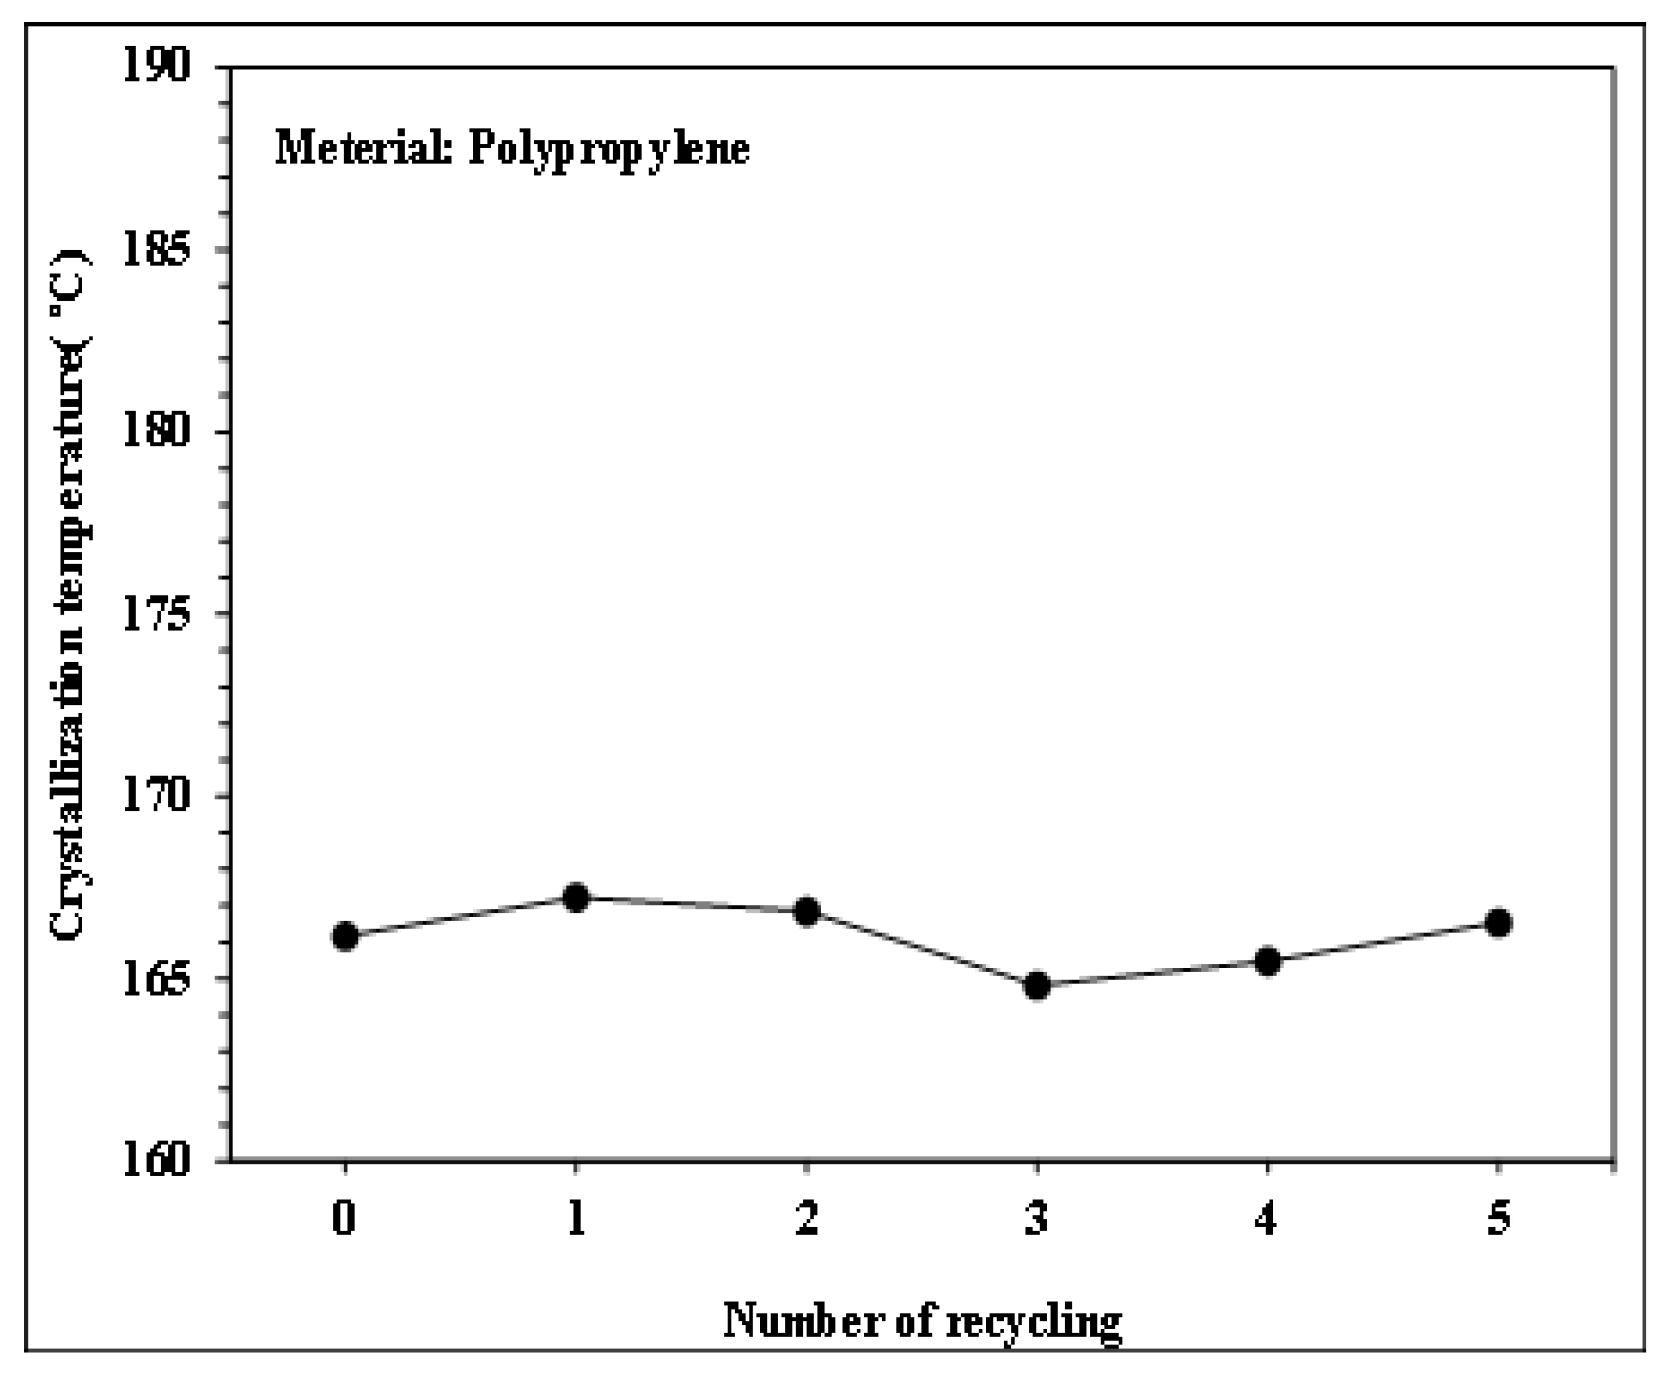
Figure 6, Figure 7, Figure 8 and Figure 9 show the results of thermal analysis for PP after different numbers of recycling cycles, including the DSC heating/cooling curves and the trend analysis of crystallinity and crystallization temperature changes. The testing results indicate that the crystallinity and crystallization temperature of the plastic raw material changed over the course of the multiple cycles of melt plasticizing → injection → recycling. The viscosity index and impact strength changed under a single molding condition, as shown in Figure 10, Figure 11, Figure 12, Figure 13 and Figure 14.
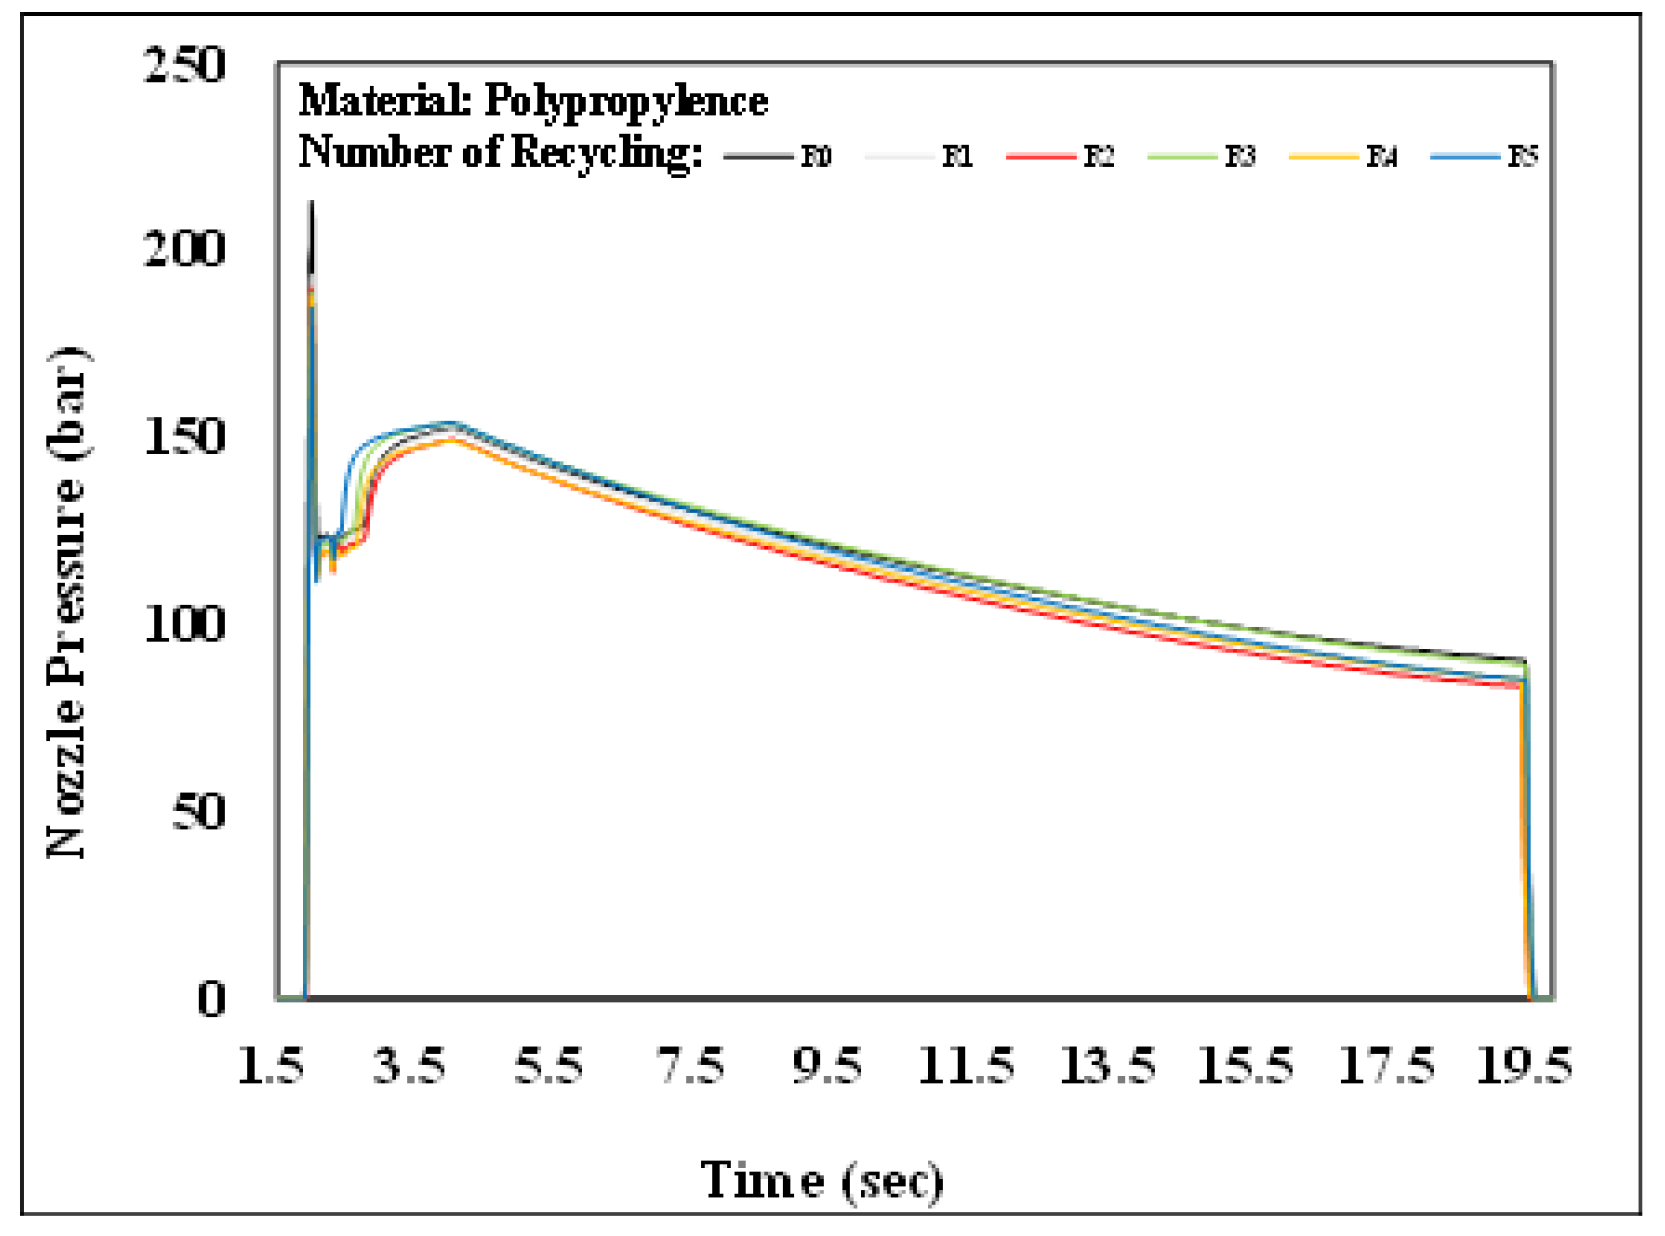
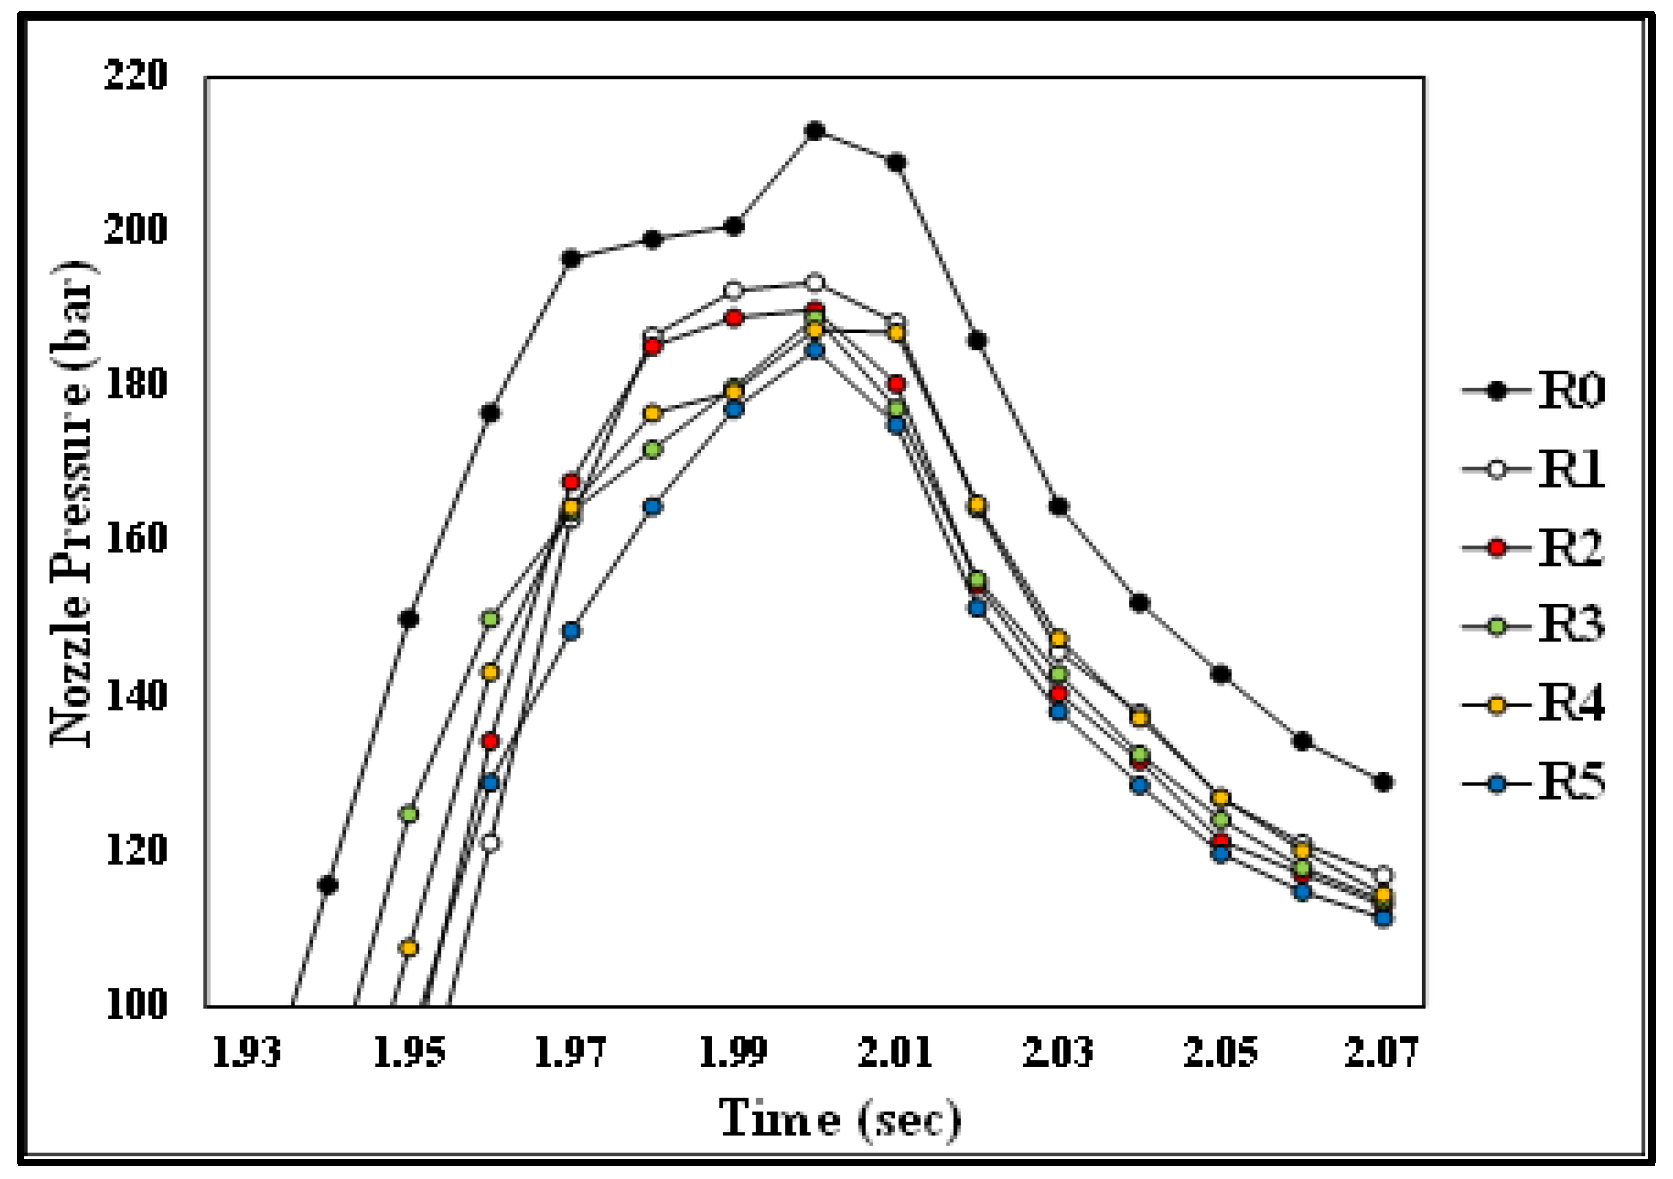
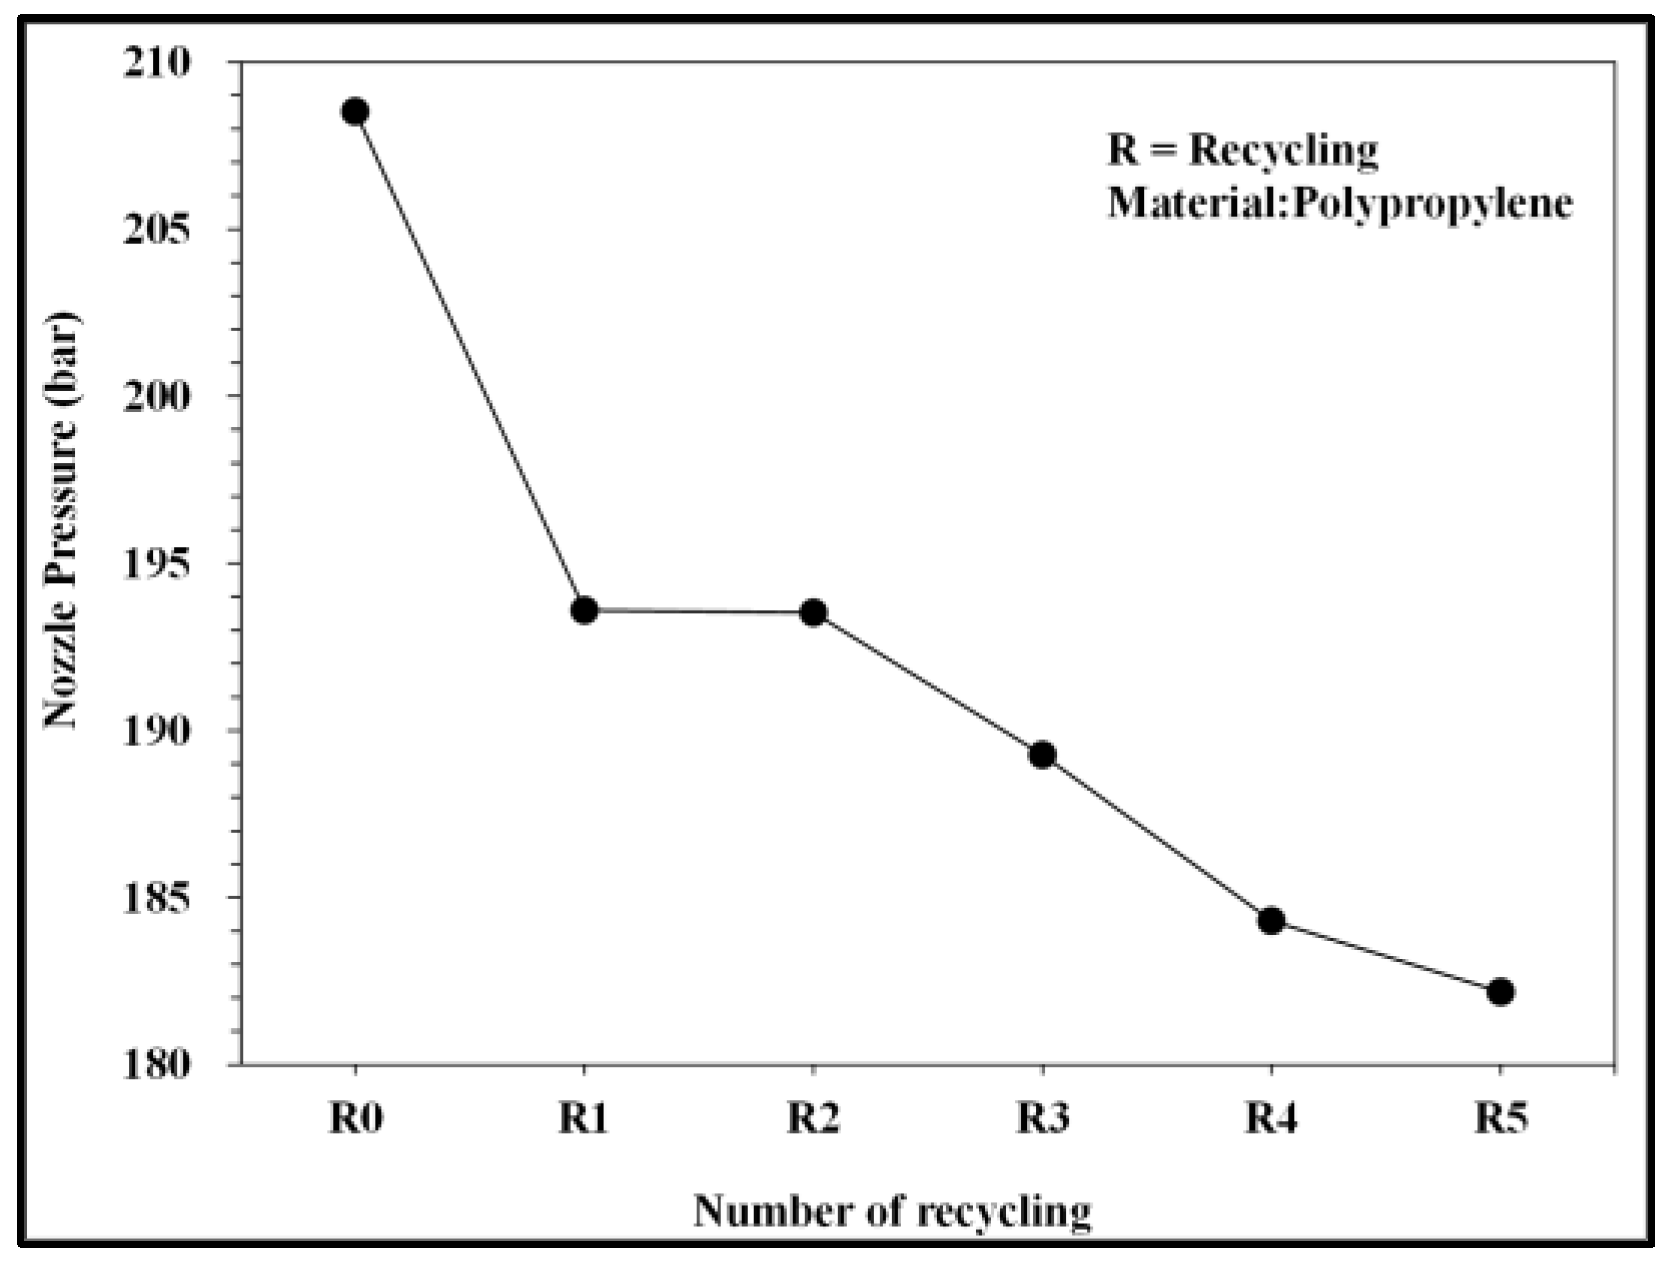
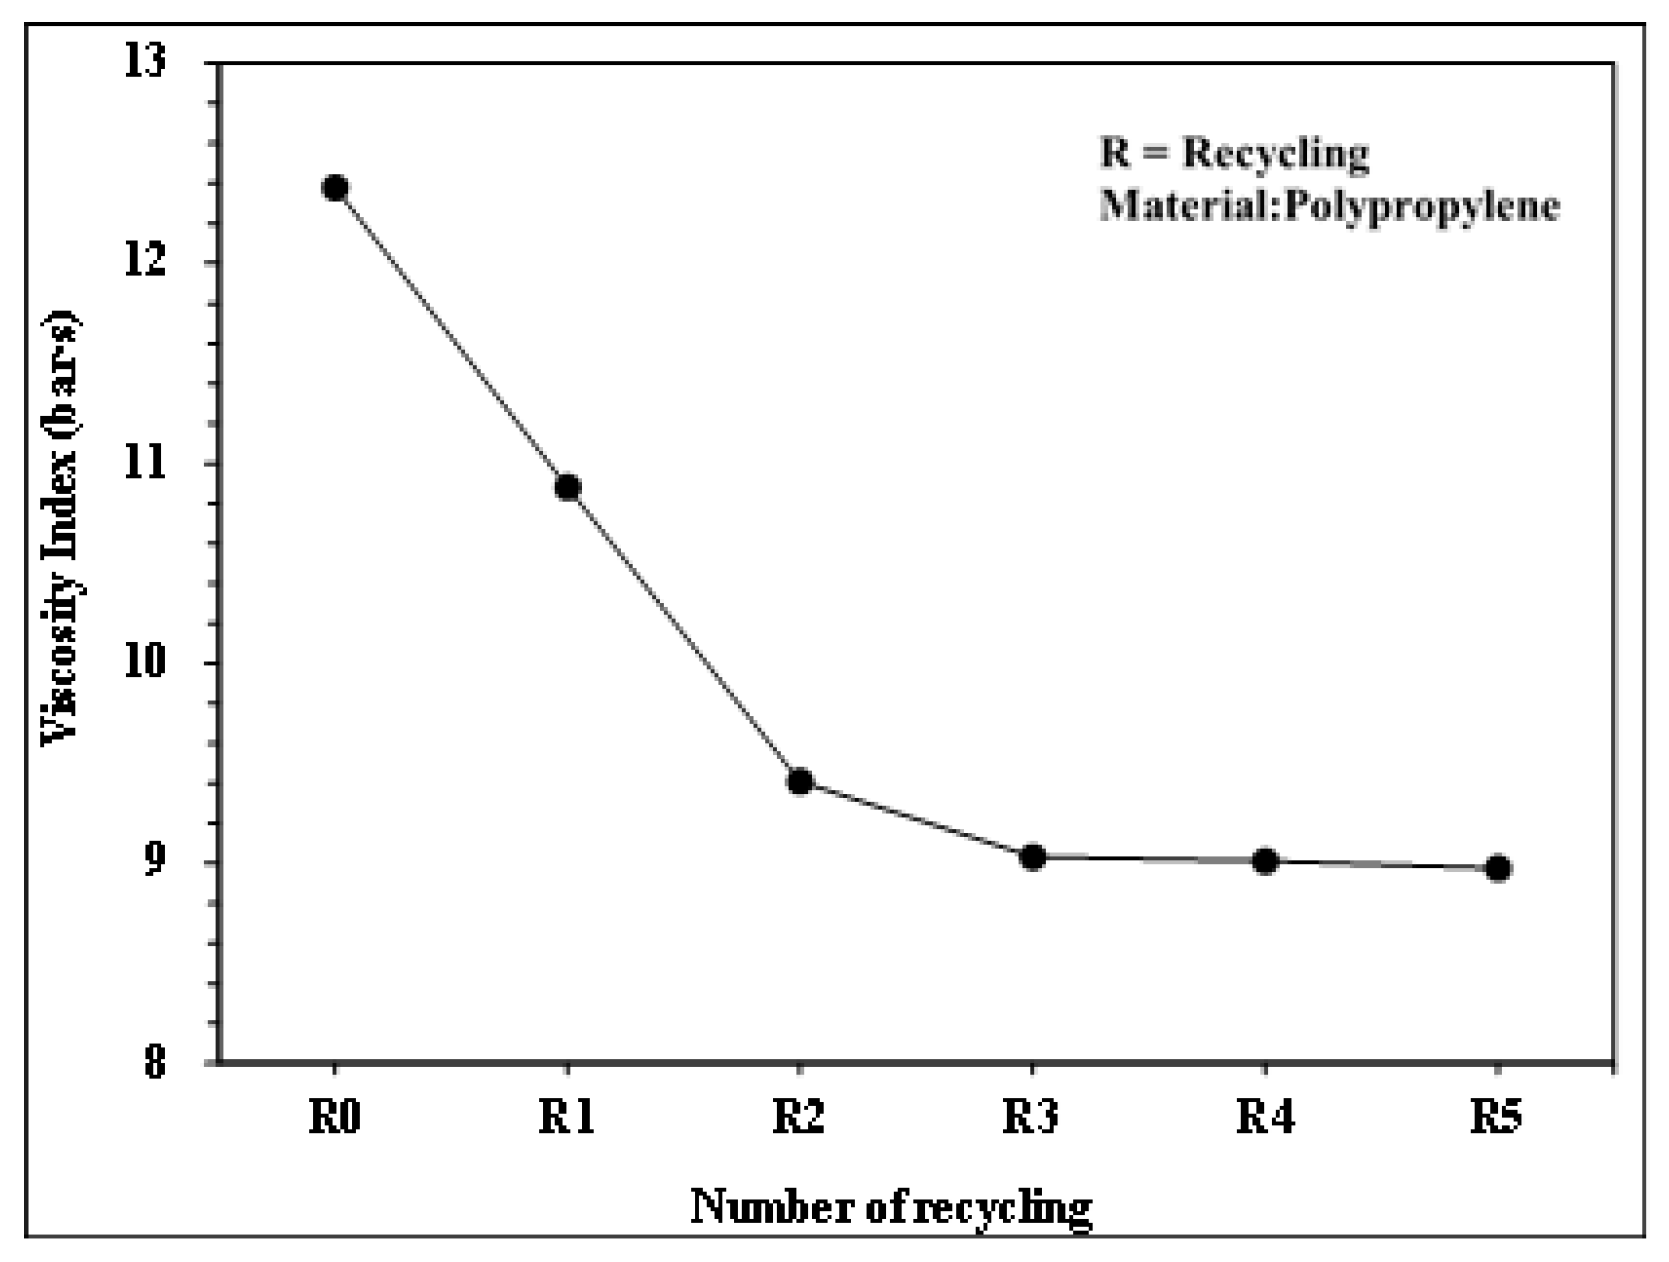
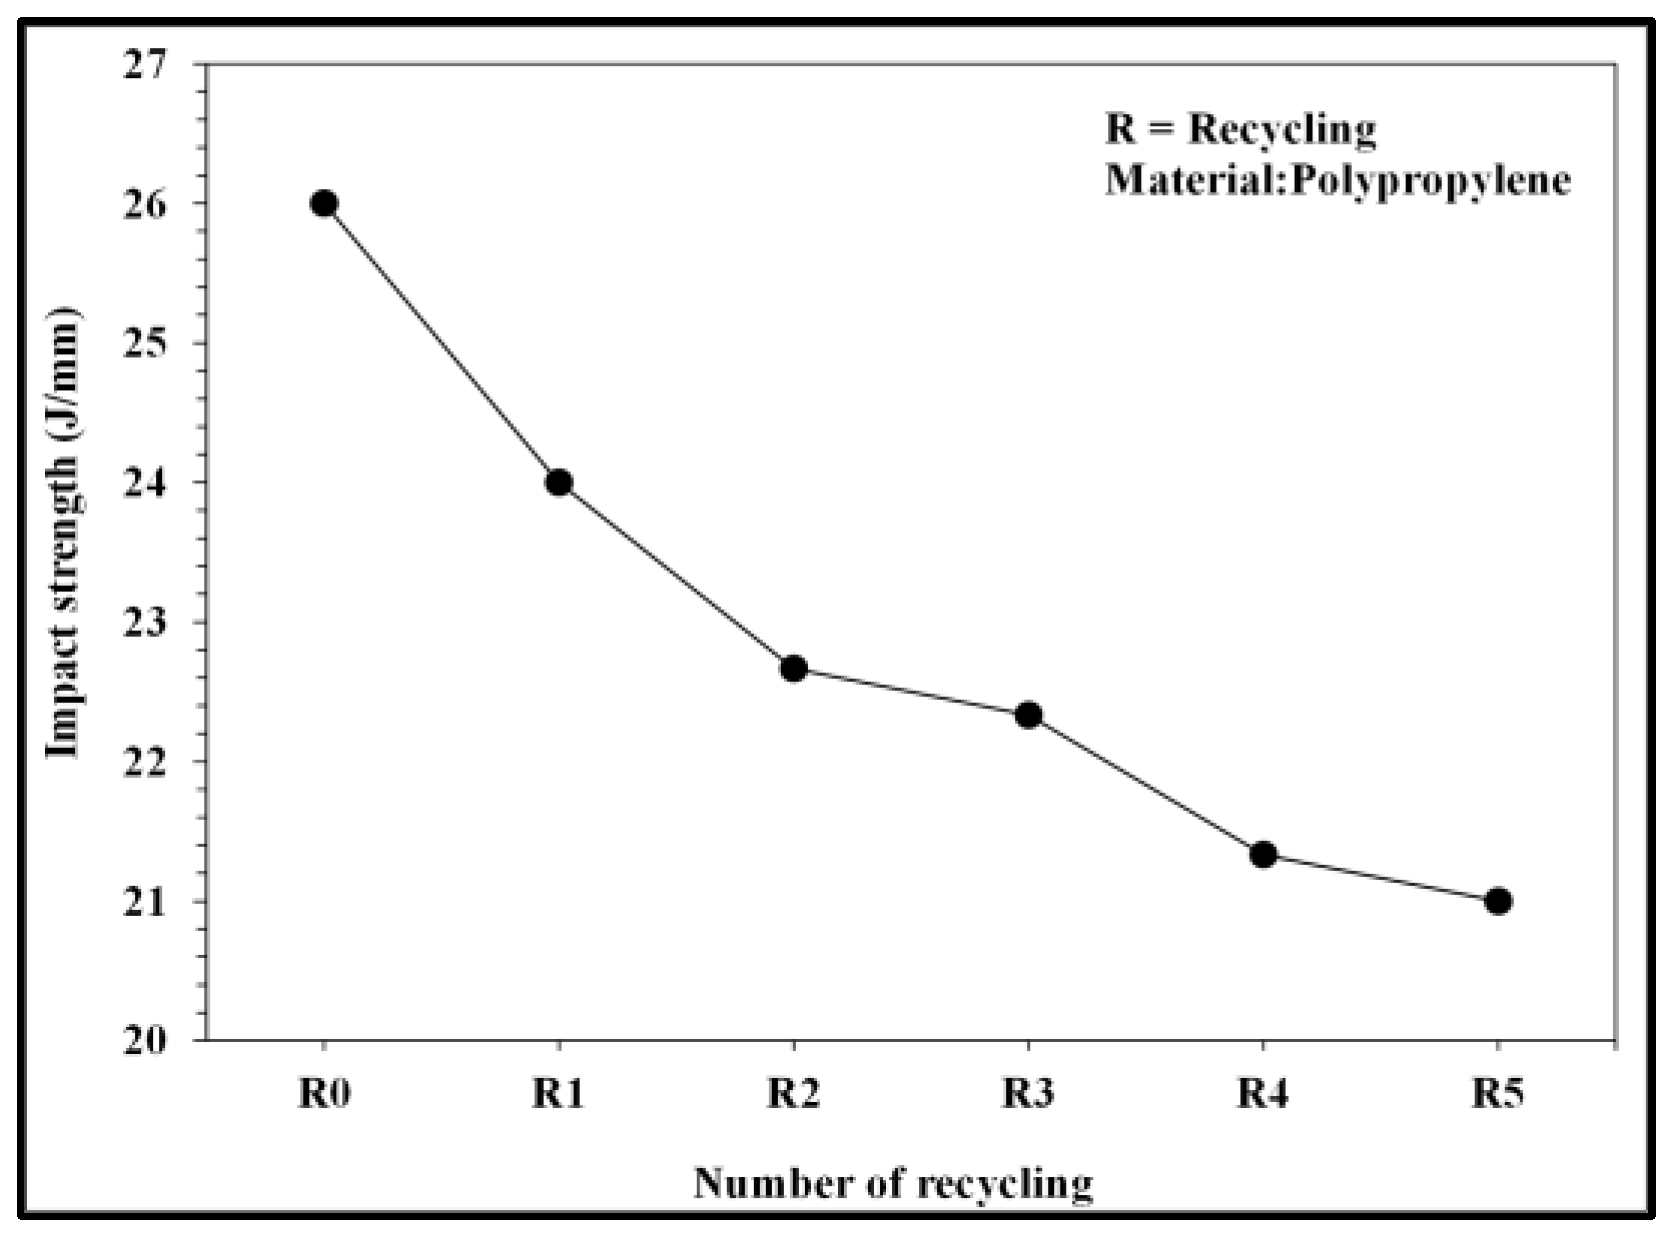
Figure 10 and Figure 11 present the pressure curve of the nozzle in plastic molding with different numbers of recycling cycles. The changes in the nozzle pressure and its peak values (Figure 12) indicated that the peak value of nozzle pressure gradually decreased as the number of recycling cycles increased. As the plastic material is recycled, ground, and injected multiple times, its molecular structure changes. Correspondingly, the flow resistance of recycled PP decreases, reducing the thrust required to fill the melted material into the mold. After the number of recycling cycles reached four, the changes in nozzle pressure gradually became smaller, consistent with the trend observed in the melt index. Figure 13 illustrates the changes in the viscosity index of the PP with different numbers of recycling cycles. As the number of recycling cycles increased, the flowability improved, decreasing the required machine pressure and the viscosity index. Figure 14 displays the impact strength of molded plastic test pieces after different numbers of recycling cycles. The impact strength of the molded plastic was affected as the numbers of recycling cycles increased. Therefore, it is critical to determine the changes in process conditions as they affect the molding characteristics of recycled PP and the quality of the products.
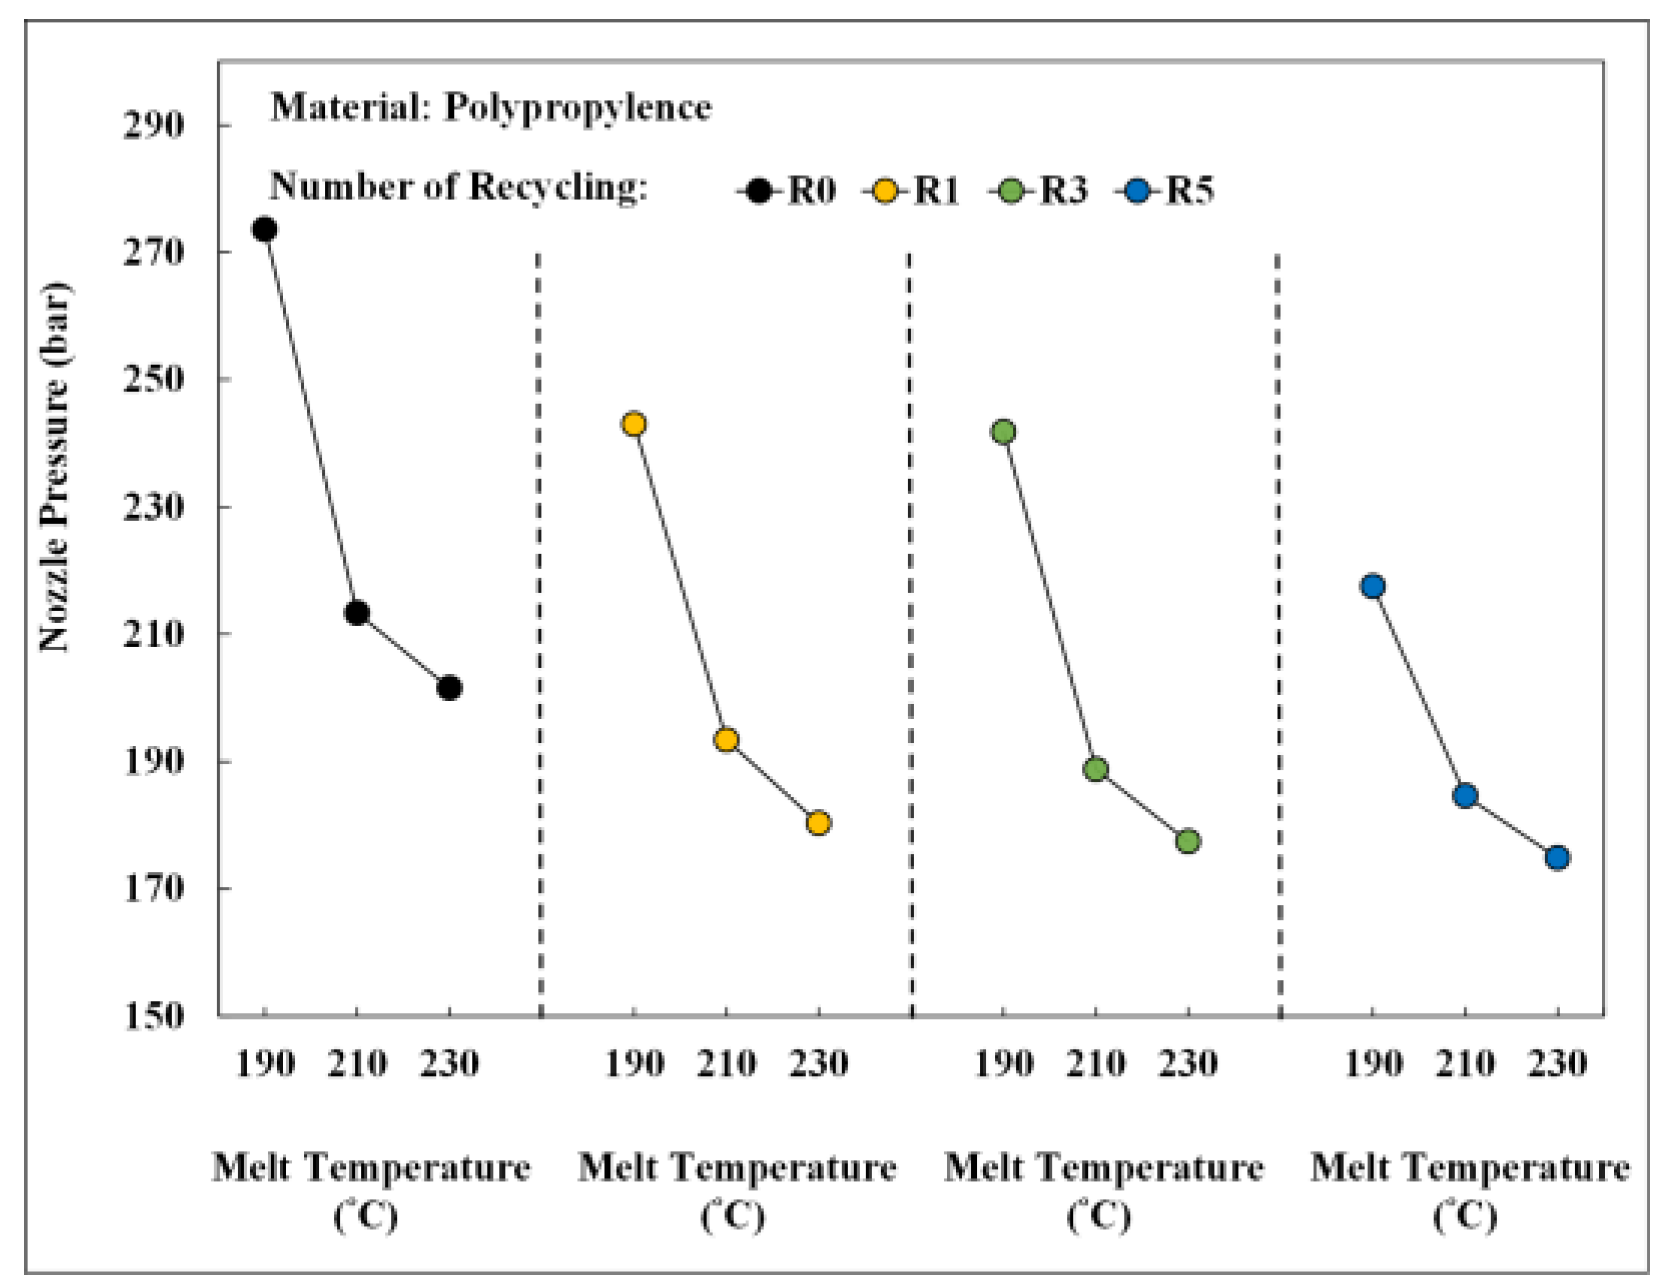
In the second phase of experiments, different process conditions were investigated to assess the molding properties and impact strength of recycled PP. Figure 15 shows the changes in nozzle pressure peak values in different recycling cycles as the melt temperature changes. As the melt temperature increased, the nozzle pressure peak value decreased, demonstrating that temperature affected the fluidity of the material. As the number of recycling cycles increased, the peak pressure gradually decreased, indicating the thrust required for plastic injection molding.
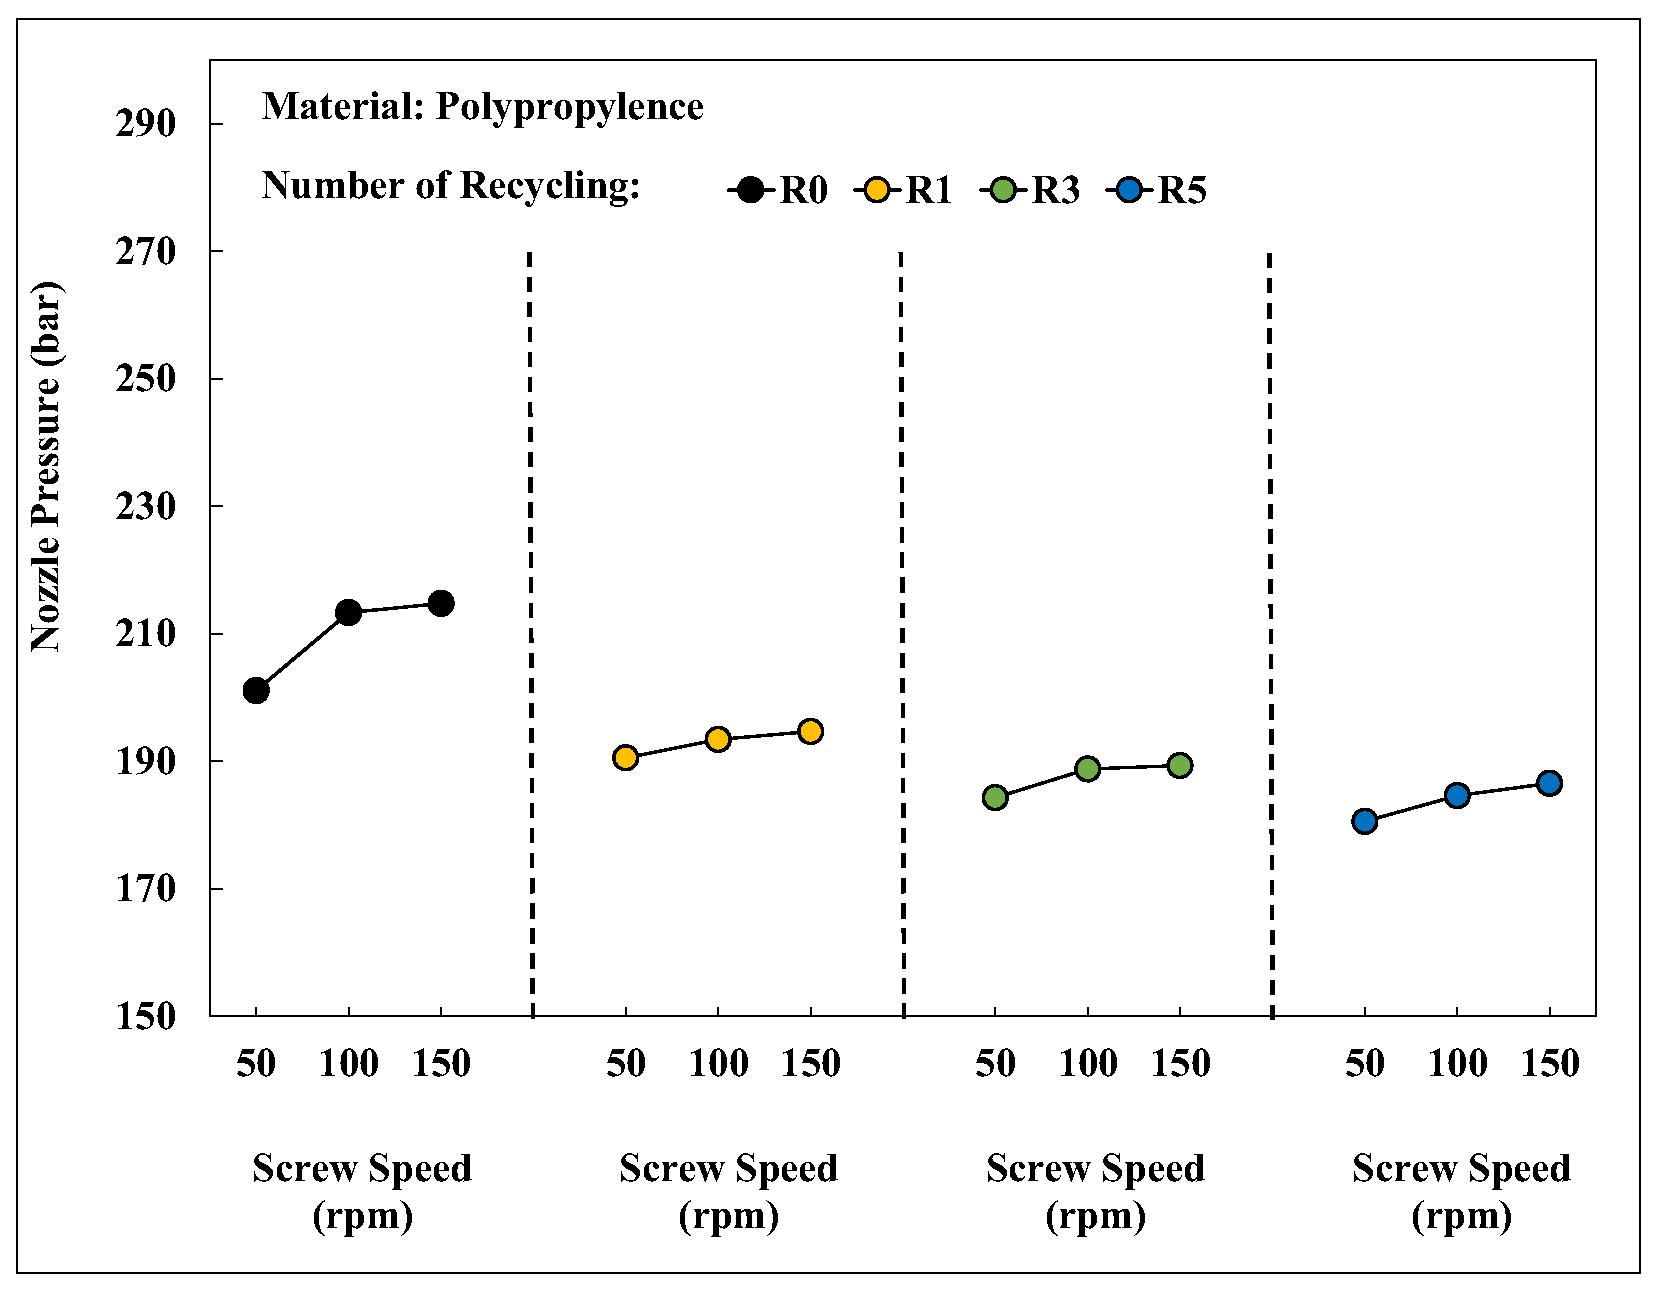
Figure 16 depicts the changes in the nozzle pressure peak value of PP after different numbers of recycling cycles at different screw speeds. An increase in screw speed increased the nozzle pressure peak value. The higher the screw speed, the greater shear of the material. This increased the plastic temperature and barrel pressure, which is reflected in the higher measured nozzle pressure.
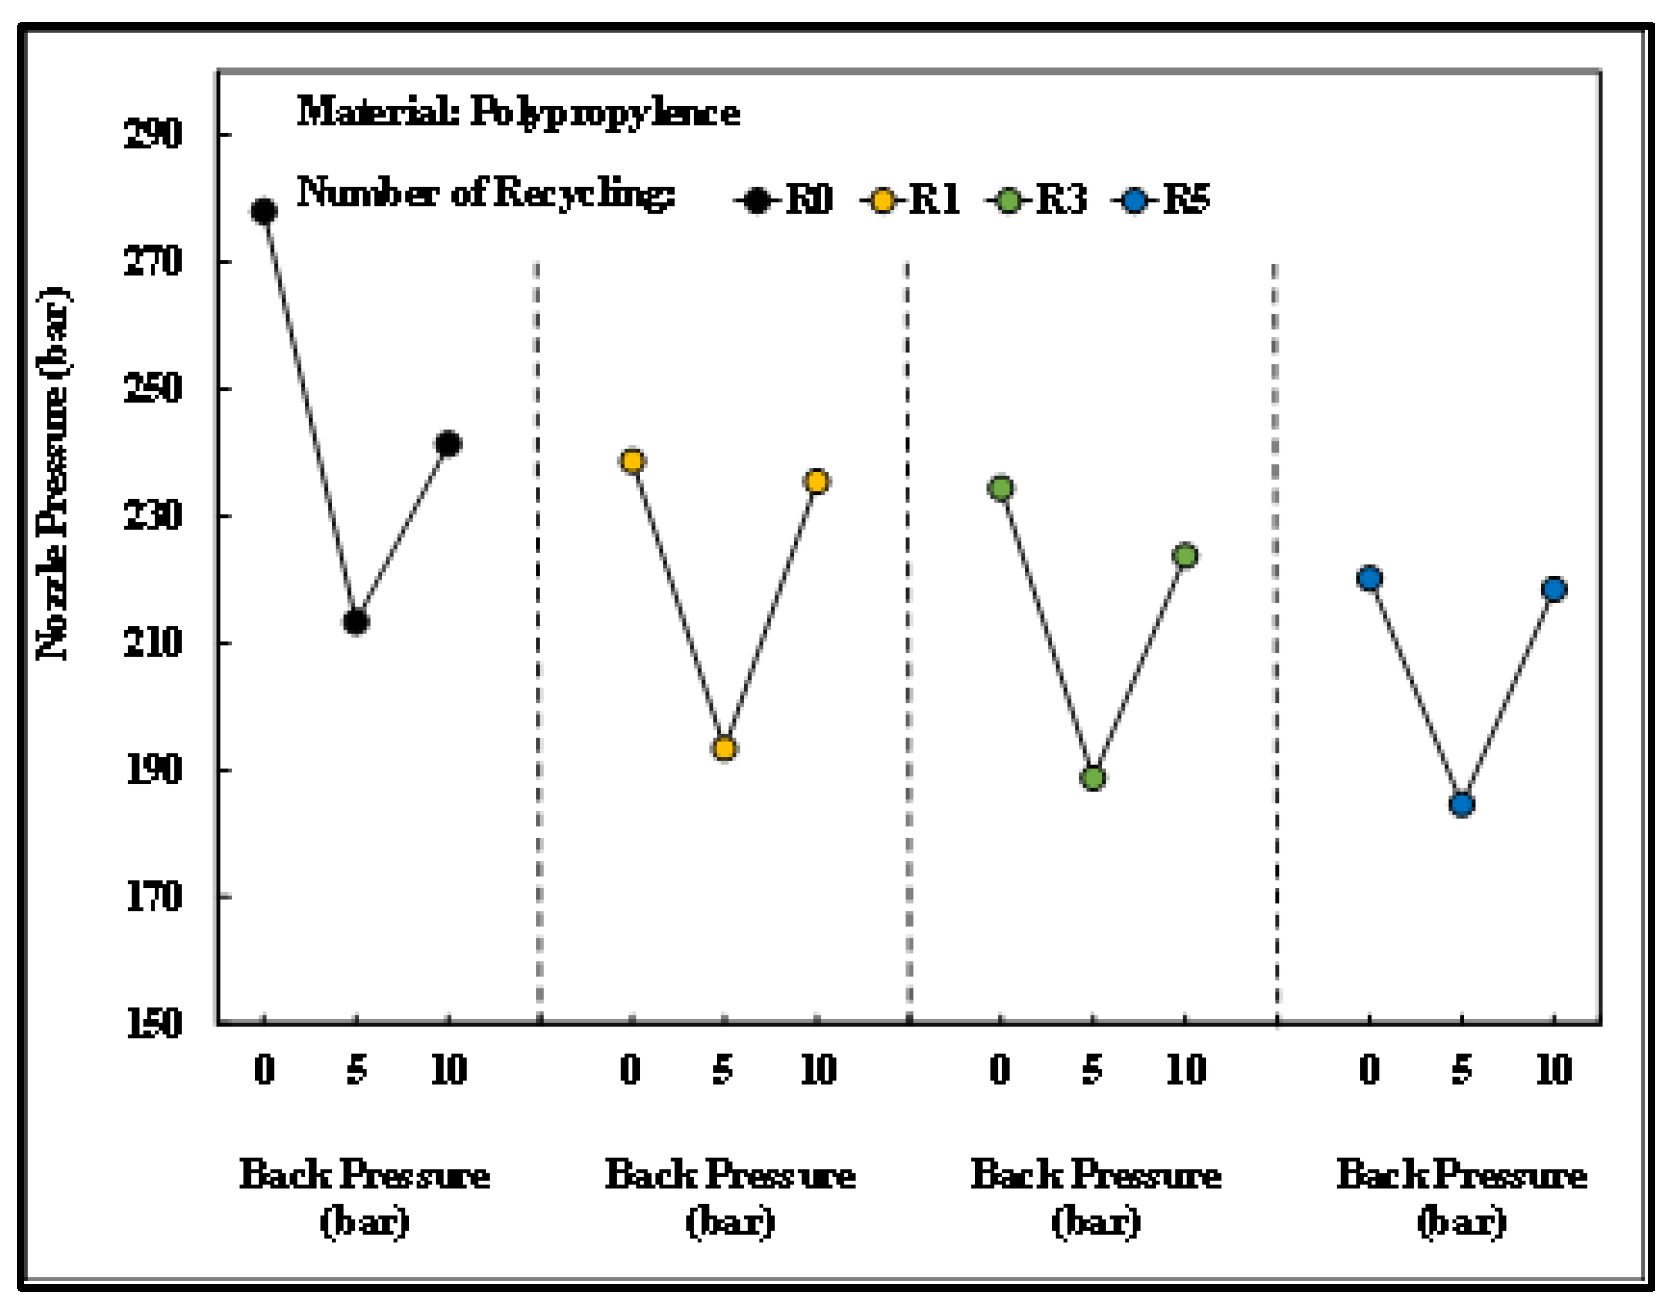
Figure 17 depicts the changes in the nozzle pressure peak value of PP after different numbers of recycling cycles under different back pressures. As back pressure increased, the pressure peak value decreased before it increased. This suggests that the less stable physical properties of the recycled plastic materials increased the barrel pressure in the plasticizing phase without back pressure. This resulted in higher nozzle pressure peak values. When the back pressure was raised to 10 bar, the raw material experienced higher shear force in the plasticizing phase. As a result, the melted and plasticized material became densely compacted, increasing the force needed for molding and a inducing rise in the peak nozzle pressure.
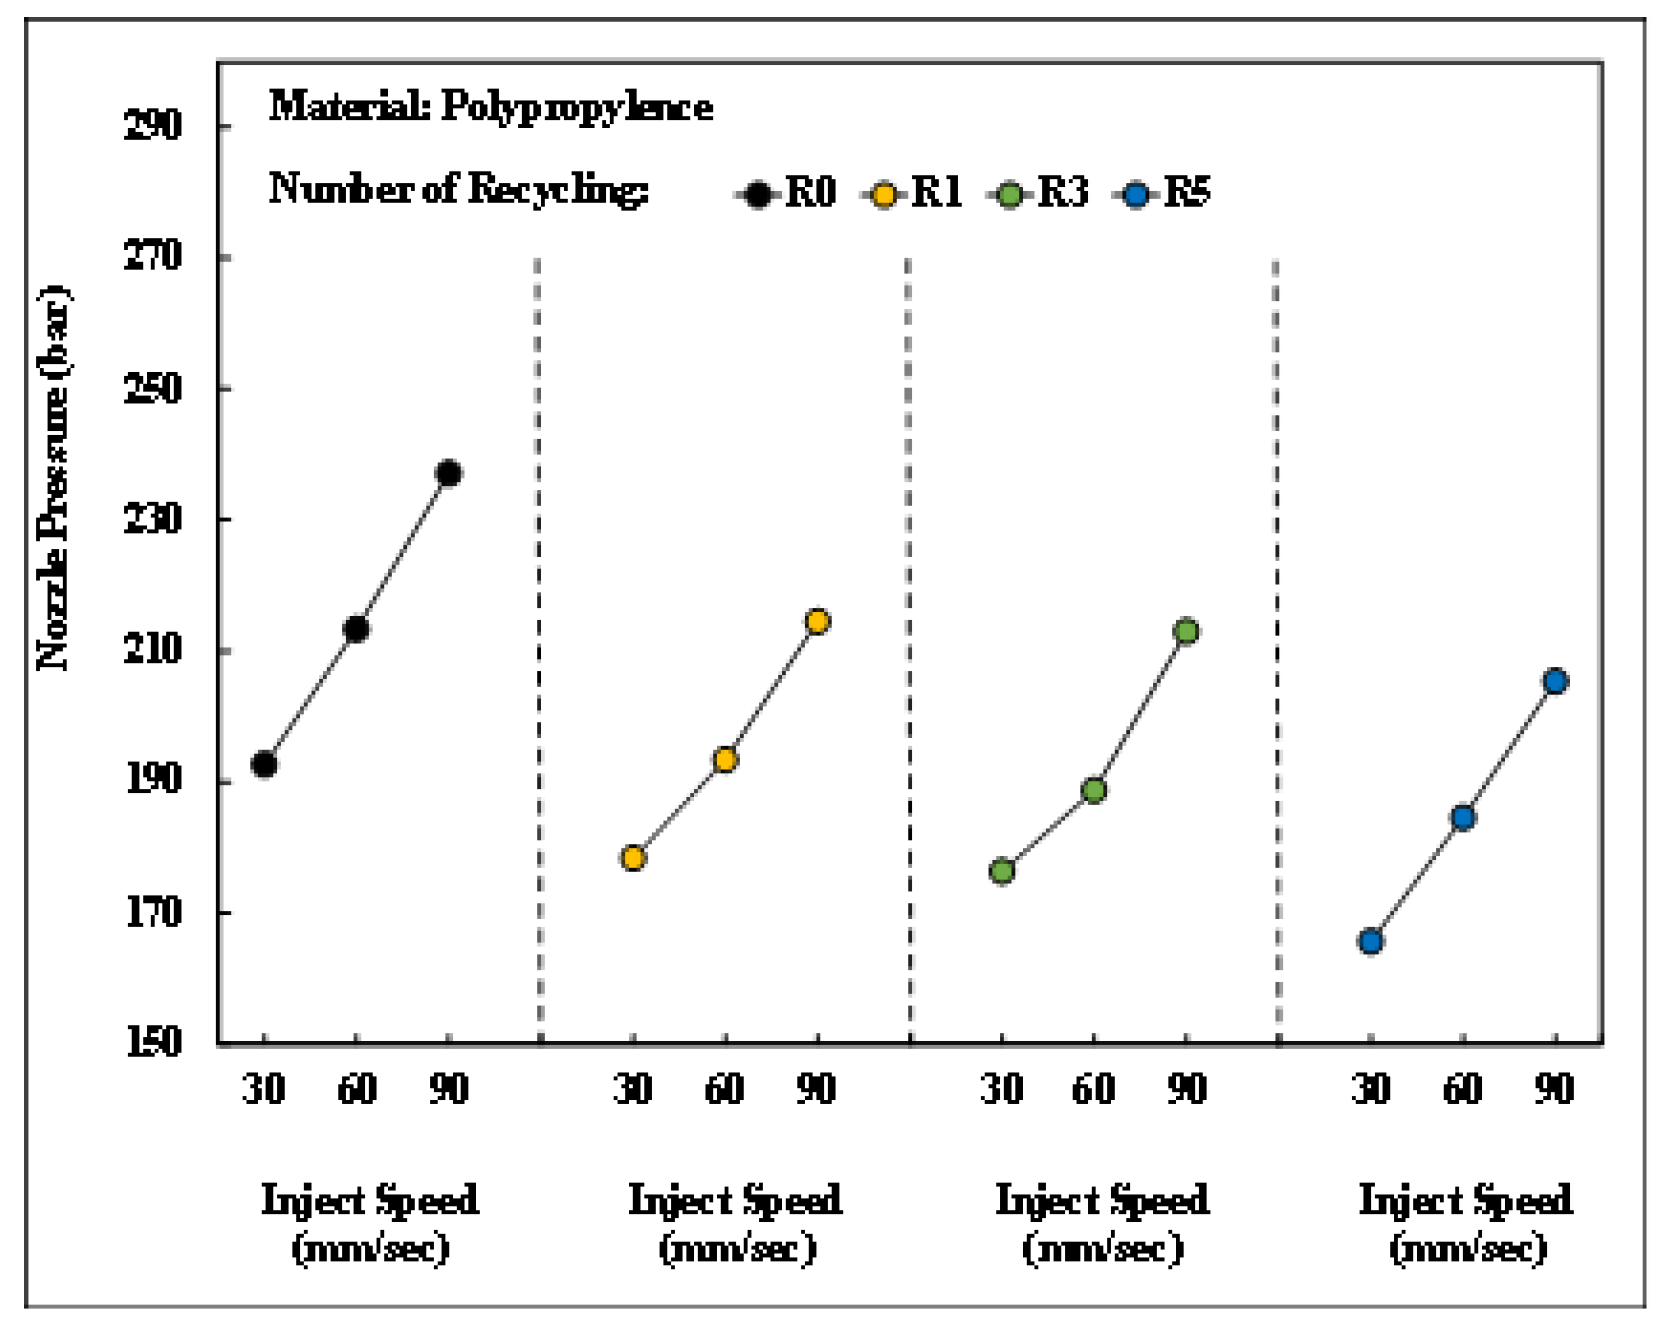
Figure 18 depicts the changes in the nozzle pressure peak value of PP after different numbers of recycling cycles under different injection speeds. As the injection speed increased, the corresponding nozzle pressure peak also increased. This was attributed to the higher injection speed required to overcome the flow resistance of the melt under an adequate injection pressure, thereby leading to larger nozzle pressure peak values.
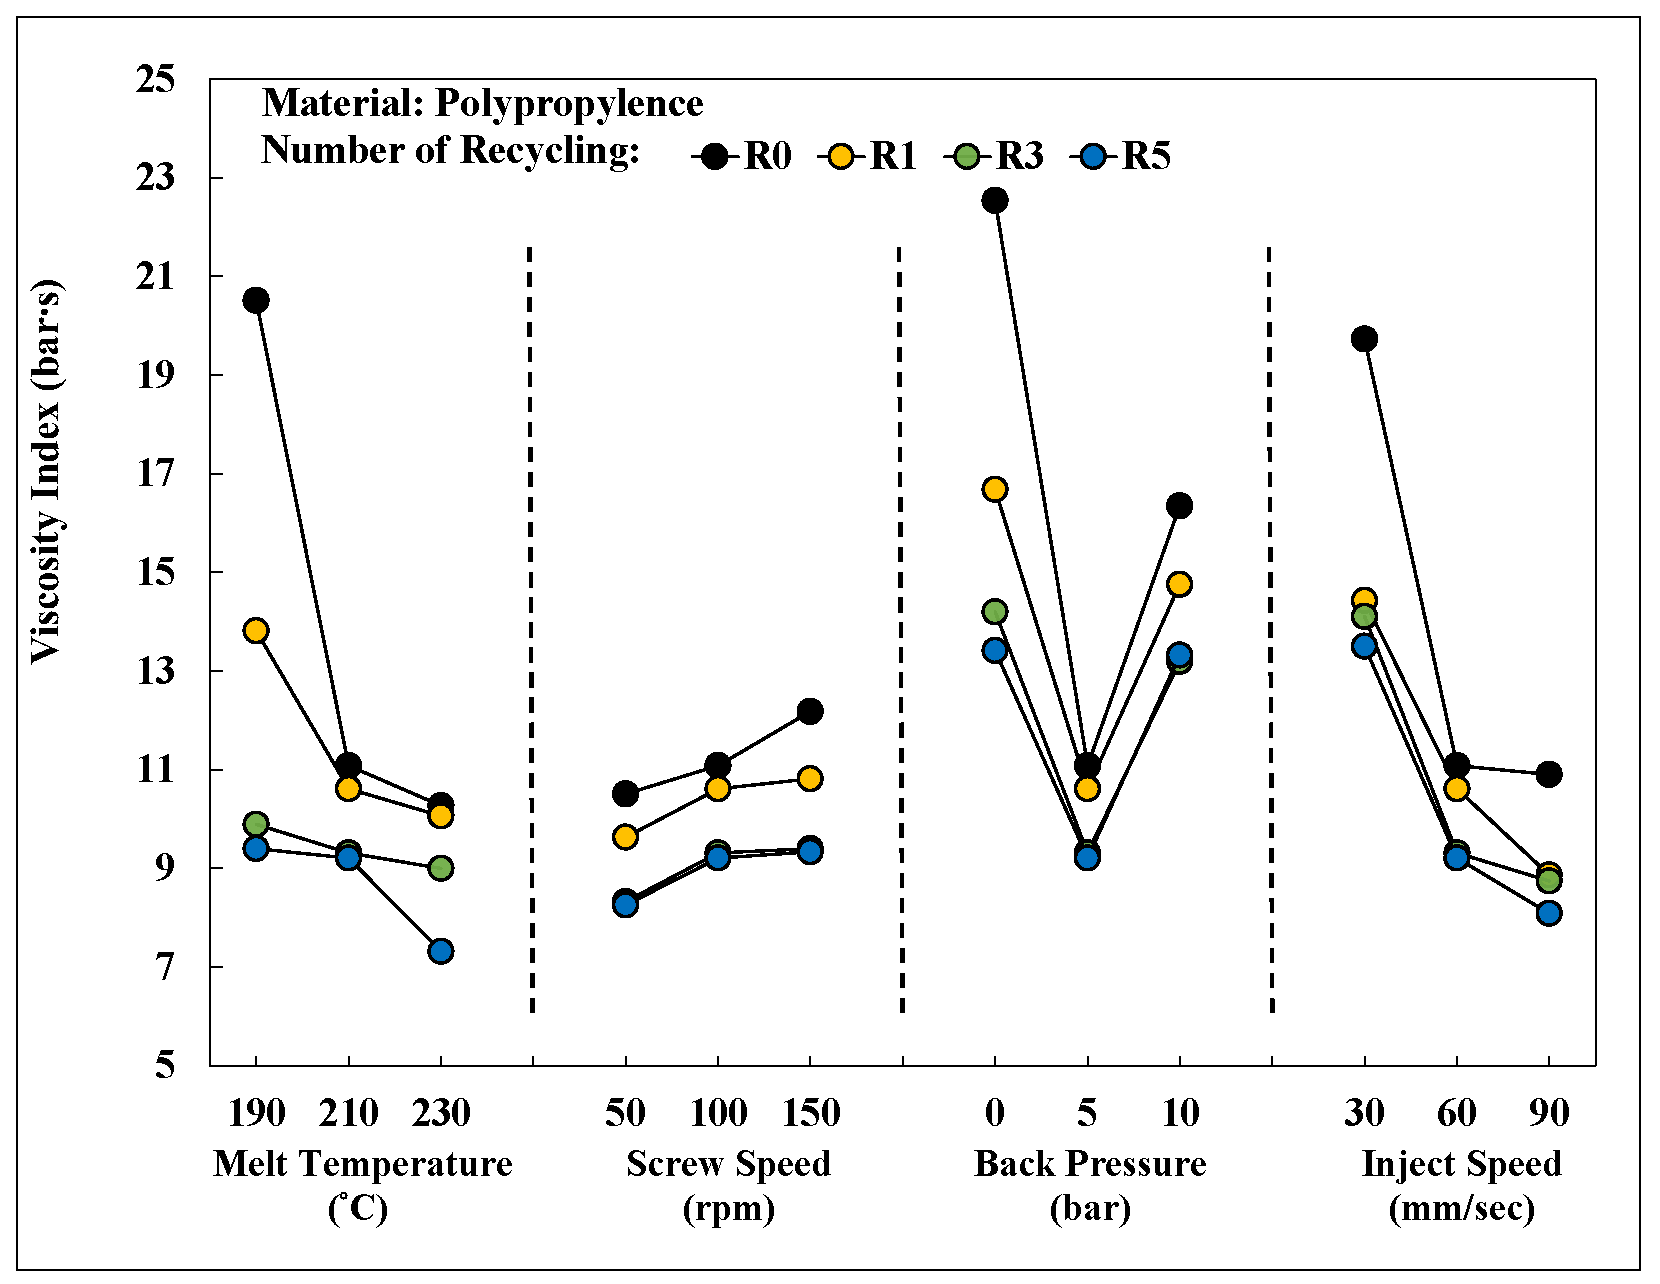
Figure 19 shows an integrated chart of the viscosity index of PP after different numbers of recycling cycles under various process conditions. The observed viscosity index changes across different process conditions show this index was significantly influenced by changes in melt temperature, screw speed, back pressure, and injection speed. A positive correlation between the molding conditions and the viscosity index was observed.
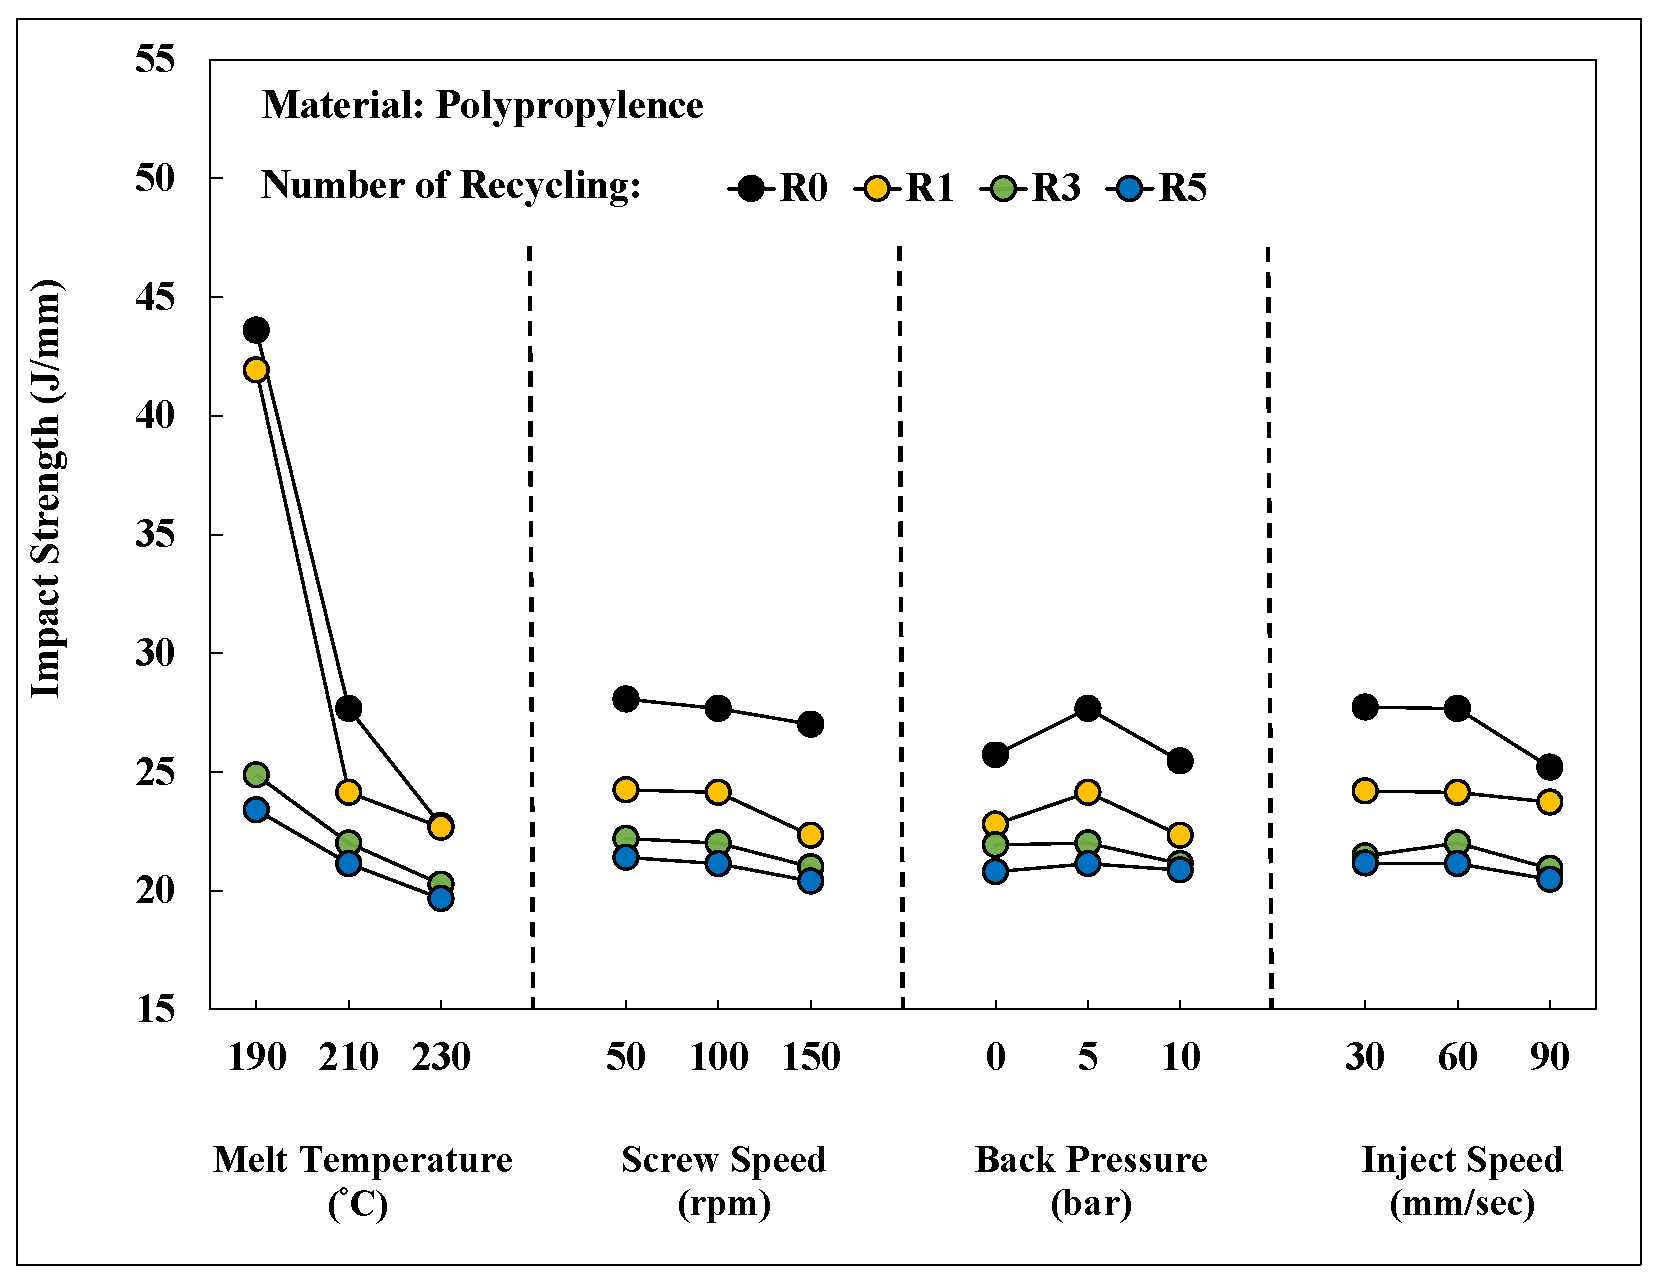
Figure 20 shows an integrated chart illustrating the changes in the impact strength of PP after different numbers of recycling cycles under various process conditions. The melt temperature influenced the impact strength and there were marginal changes in the impact strength in molded PP after three recycling cycles. Thus, the stability of molding characteristics and product quality were obtained after three recycling cycles.

4. Conclusions

An in-depth investigation of the effects of PP recycling on the viscosity of the injection melt and the impact strength of finished products was conducted in this study. The melt flow indexes of PP after different numbers of recycling cycles and their thermal properties were examined to analyze the changes in the material properties of recycled PP. Real-time melt pressure was measured using a pressure sensor affixed to the injection machine nozzle. The variations in the molding pressure of recycled PP during the molding process were monitored and analyzed. The results provide information on changes in molding characteristics and their effect on the impact strength of recycled PP. As the number of plastic recycling cycles increased, the melt flow index increased. The melt flow index was stabilized when the number of recycling cycles exceeded three. After multiple cycles of melt plasticizing → injection → recycling and grinding, the crystallinity and crystallization temperature of the raw PP were also affected. As the number of recycling cycles increased for the molded plastic, the impact strength of the product increased. The viscosity index of PP after different numbers of recycling cycles increased due to changes in melt temperature, screw speed, back pressure, and injection speed. A positive correlation between the molding conditions and the impact strength was observed, indicating that the melt temperature influenced the impact strength the most. The impact strength changes in molded plastic after different numbers of recycling cycles (in particular, three cycles) and under different process conditions. The results suggest that the material after three recycling cycles is a crucial reference for assessing molding characteristic stability and product quality in terms of impact strength.

Author Contributions

Conceptualization, Y.-K.W., H.-S.P., J.-C.L., H.-M.Z. and K.-F.L.; data curation, Y.-K.W., K.-F.L. and J.-C.L.; investigation, Y.-K.W., K.-F.L., H.-S.P. and H.-M.Z.; methodology, H.-S.P. and Y.-K.W.; project administration, H.-S.P.; supervision, H.-S.P.; validation, K.-F.L.; writing—original draft, Y.-K.W., J.-C.L. and H.-M.Z.; writing—review and editing, H.-S.P., H.-M.Z. and J.-C.L. All authors have read and agreed to the published version of the manuscript.

Funding

This research received no external funding.

Institutional Review Board Statement

Not applicable.

Informed Consent Statement

Not applicable.

Data Availability Statement

The data presented in this study are available upon request from the corresponding author.

Conflicts of Interest

The authors declare no conflicts of interest.

References

  1. Aurrekoetxea, J.; Sarrionandia, M.A.; Urrutibeascoa, I.; Maspoch, M.L. Effects of recycling on the microstructure and the mechanical properties of isotactic polypropylene. J. Mater. Sci. 2001, 36, 2607–2613. [Google Scholar] [CrossRef]
  2. Huang, P.-W.; Peng, H.-S. Number of Times Recycled and Its Effect on the Recyclability, Fluidity and Tensile Properties of Polypropylene Injection Molded Parts. Sustainability 2021, 13, 11085. [Google Scholar] [CrossRef]
  3. Hou, H.-Y. A Study on the Properties of Repeated Recycle Polypropylene. Master’s Thesis, National Kaohsiung University of Science and Technology, Kaohsiung, Taiwan, 2010. [Google Scholar]
  4. Hsu, B.-A. A Study of Relationships Between Physical Properties of Polypropylene Plastic and Its Reprocessed Cycle with Various Blending Ratios. Master’s Thesis, National Kaohsiung University of Science and Technology, Kaohsiung, Taiwan, 2017. [Google Scholar]
  5. Kuo, C.-Y. An Evaluation on the Physical Properties of Recycled High Density Polyethylene Plastic. Master’s Thesis, National Kaohsiung University of Science and Technology, Kaohsiung, Taiwan, 2008. [Google Scholar]
  6. Lin, C.-D. Online Monitoring the Products Quality by Measuring Cavity Pressure During Injection Molding. Master’s Thesis, National Kaohsiung University of Science and Technology, Kaohsiung, Taiwan, 2010. [Google Scholar]
  7. Lu, W.-Y. Application of Cavity Pressure Monitoring Technology to Improve the Differential Shrinkage of Injection Products. Master’s Thesis, National Kaohsiung University of Science and Technology, Kaohsiung, Taiwan, 2014. [Google Scholar]
  8. Liou, G.-Y.; Cheng, F.-J.; Su, W.-J.; Hwang, S.-J.; Peng, H.-S.; Chu, H.-Y. Nozzle Pressure and Clamping Force Based Injection Molding Process Parameter Optimization and Adaptive Process Quality Control. In Proceedings of the 2022 25th International Conference on Mechatronics Technology (ICMT), Kaohsiung, Taiwan, 18–21 November 2022; pp. 1–4. [Google Scholar]
  9. Liew, K.-F.; Peng, H.-S.; Huang, P.-W.; Su, W.-J. Injection Barrel/Nozzle/Mold-Cavity Scientific Real-Time Sensing and Molding Quality Monitoring for Different Polymer-Material Processes. Sensors 2022, 22, 4792. [Google Scholar] [CrossRef] [PubMed]
  10. Lee, M.-R. A Cavity Pressure Based Quality Control Method for Injection Molding. Master’s Thesis, National Kaohsiung University of Science and Technology, Kaohsiung, Taiwan, 2003. [Google Scholar]
  11. Su, P.-L. Measurement of Cavity Pressure and Investigation on Manufacturing Characteristics of an Injection Molding Process. J. Chung Chou Inst. Technol. 2002, 16, 117–126. [Google Scholar]
  12. Tseng, C.-C. A Novel Methodology for Online Quality Monitoring during Injection Molding. Master’s Thesis, National Kaohsiung University of Science and Technology, Kaohsiung, Taiwan, 2018. [Google Scholar]
  13. Kruppa, S.; Holzinger, G.P. In Situ Characterization of Polymer Melt and Molded Part Quality; KraussMaffei Technologies GmbH: Munich, Germany, 2013. [Google Scholar]
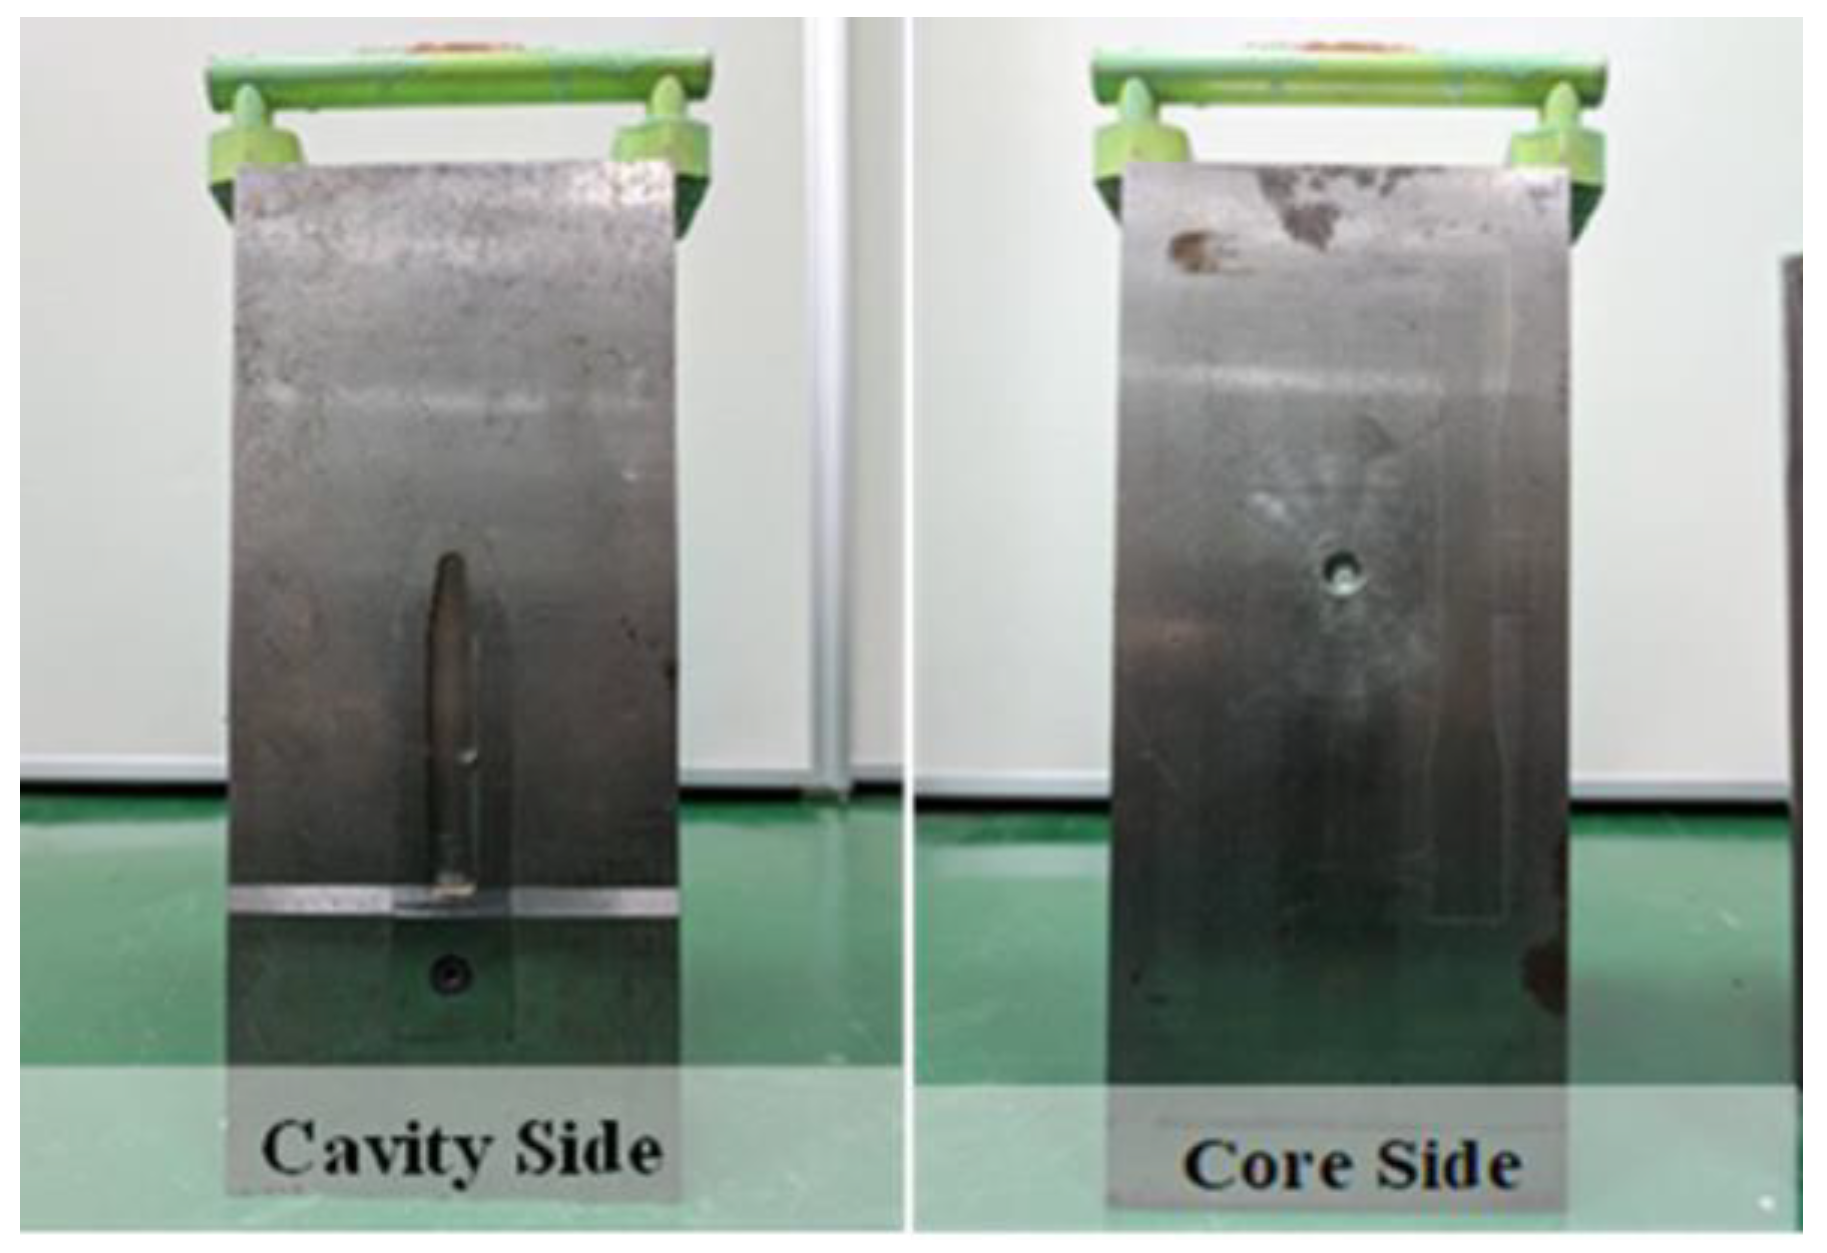
Figure 1. Core of a removable impact specimen.
Engproc 92 00088 g001
Figure 2. Experimental flow chart.
Engproc 92 00088 g002
Figure 3. Dynisco nozzle pressure sensor.
Engproc 92 00088 g003
Figure 4. Schematic diagram of the viscosity index calculation method.
Engproc 92 00088 g004
Figure 5. MFR of PP with different recycling times.
Engproc 92 00088 g005
Figure 6. Heating trend of PP with different numbers of recycling cycles.
Engproc 92 00088 g006
Figure 7. Cooling trend of PP with different numbers of recycling cycles.
Engproc 92 00088 g007
Figure 8. Crystallinity trend of PP with different numbers of recycling cycles.
Engproc 92 00088 g008
Figure 9. Effect of number of recycling cycles on the crystallization temperature of PP.
Engproc 92 00088 g009
Figure 10. Nozzle pressure history over time with different numbers of recycling cycles.
Engproc 92 00088 g010
Figure 11. Partial amplification of nozzle pressure due to the number of recycling cycles.
Engproc 92 00088 g011
Figure 12. Relationship between number of recycling cycles and nozzle pressure.
Engproc 92 00088 g012
Figure 13. Relationship between number of recycling cycles and viscosity index.
Engproc 92 00088 g013
Figure 14. Relationship between number of recycling cycles and impact strength.
Engproc 92 00088 g014
Figure 15. Relationship between melt temperature and nozzle pressure peaks under different numbers of recycling cycles.
Engproc 92 00088 g015
Figure 16. Relationship between screw speed and nozzle pressure peaks after different numbers of recycling cycles.
Engproc 92 00088 g016
Figure 17. Relationship between back pressure and nozzle pressure peaks after different numbers of recycling cycles.
Engproc 92 00088 g017
Figure 18. Relationship between injector speed and nozzle pressure peaks after different numbers of recycling cycles.
Engproc 92 00088 g018
Figure 19. Viscosity index after different numbers of recycling cycles for process elements.
Engproc 92 00088 g019
Figure 20. Impact strength after different numbers of recycling cycles for process elements.
Engproc 92 00088 g020
Table 1. Factors and process parameters.
NO.Injection Speed (mm/sec)Back Pressure (bar)Screw Speed (rpm)Melt Temperature (°C)
1305100210
2605100210
3905100210
4600100210
56010100210
660550210
7605150210
8605100190
9605100230
Disclaimer/Publisher’s Note: The statements, opinions and data contained in all publications are solely those of the individual author(s) and contributor(s) and not of MDPI and/or the editor(s). MDPI and/or the editor(s) disclaim responsibility for any injury to people or property resulting from any ideas, methods, instructions or products referred to in the content.