Abstract
We implemented a robust framework for diabetes prediction, leveraging a diverse array of machine learning algorithms. Through an analysis of diabetes-related characteristics, we identified the most accurate classifier. Diverse algorithms were tested to compare their accuracies with the complexities of data: K-nearest neighbors (KNN), random forest (RF), support vector machine (SVM), logistic regression (LR), Naïve Bayes (NB), and decision tree (DT). The decision tree algorithm demonstrated the best accuracy in predicting diabetes.
1. Introduction
Diabetes mellitus (DM) is characterized by inadequate insulin production or an ineffective response to insulin. DM elevates blood glucose levels and causes hypertension, hypothyroidism, chronic obstructive pulmonary disease (COPD), coronary artery disease (CAS), and chronic kidney disease (CKD) as complications. Timely identification and appropriate care are essential for effective management and patient improvement with DM, particularly when the complications overlap. Diabetes, marked by impaired blood sugar regulation, is a growing global concern with prevalence projected to double by 2035, highlighting the critical need for early detection and intervention.
Diabetes is categorized into type 1 (T1D) and type 2 (T2D). T1D affects individuals younger than 30 years old, presenting symptoms such as increased thirst, frequent urination, and elevated blood glucose levels. T1D necessitates insulin therapy. In contrast, T2D is prevalent in middle-aged and older adults, often linked to obesity, hypertension, and other health conditions, T2D can be managed by lifestyle changes and medications.
According to estimates from the World Health Organization (WHO), 422 million people worldwide have diabetes, with the majority in low-income countries. The population with DM is projected to grow to 490 million by 2030. Diabetes affects people globally, but especially in Canada, China, and India.
To find the best method to predict diabetes, we compared the machine learning classification methods K-nearest neighbors (KNN), random forest (RF), support vector machine (SVM), logistic regression (LR), Naïve Bayes (NB), and decision tree (DT). We evaluated the accuracies of these algorithms in diabetes prediction, and the performance of each algorithm was compared. Using data mining and artificial intelligence (AI), the pivotal role of advanced methods in mitigating the impact of diabetes and enhancing patient outcomes was confirmed in this study.
2. Types of Diabetes
2.1. T1D
T1D is referred to as “juvenile diabetes” or “insulin-dependent diabetes”. It is caused by an autoimmune reaction that destroys the pancreatic cells responsible for insulin production. This reduces insulin levels, impairing blood sugar regulation. Due to the challenges in predicting T1D in its early stages, reliable computer models are crucial for identifying at-risk individuals and enabling early interventions.
2.2. T2D
T2D is also known as “insulin-independent diabetes” or “adult-onset diabetes” and is caused by insulin resistance or insufficient insulin production by the pancreas. Its prevalence is associated with lifestyle. Data mining is vital to identify trends and risk factors for its development. Early detection of T2D is essential to recommend healthy lifestyle choices and implement effective prevention strategies.
2.3. Gestational Diabetes
Gestational diabetes is identified during pregnancy and is characterized by elevated blood sugar levels in women without a prior history of diabetes. The body becomes unable to produce sufficient insulin during pregnancy. Insulin is a key hormone in regulating blood sugar levels, and its inadequate production during pregnancy leads to gestational diabetes (Figure 1).
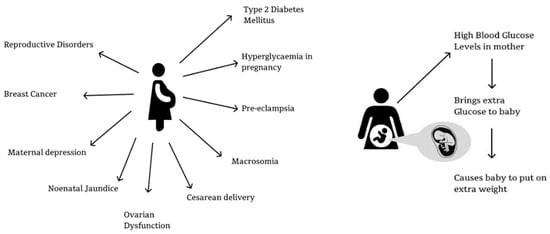
Figure 1.
Gestational diabetes mellitus.
Gestational diabetes poses risks to the mother and the unborn child, potentially leading to complications during pregnancy and childbirth. Pregnant females with gestational diabetes face an increased likelihood of preeclampsia, requiring interventions such as cesarean sections. Additionally, infants with gestational diabetes might experience macrosomia, leading to delivery complications and an elevated risk of future T2D. Managing gestational diabetes involves monitoring blood sugar levels, adjusting diet, and engaging in regular exercise, and in several cases, insulin or medications are required. Continued monitoring post-pregnancy is crucial, with regular diabetes screenings recommended due to the heightened risk of developing T2D later in life.
During pregnancy, physiology is intricately regulated by placental growth hormone (PGH) and human placental lactogen (HPL), both of which are crucial for fetal growth and maternal metabolic functions. HPL, also known as human chorionic somatomammotropin, enhances lipolysis and insulin resistance in the mother, providing a continuous energy supply for fetal development. Elevated levels of HPL in gestational diabetes can exacerbate insulin resistance, complicating blood glucose management. PGH, another key placental hormone, plays a significant role in fetal tissue growth, and variations in its levels during gestational diabetes may contribute to macrosomia, which affects labor and delivery. Monitoring HPL and PGH levels in pregnant individuals with gestational diabetes is essential for assessing both maternal and fetal metabolic states. Customized treatment plans, including tailored dietary recommendations and medication dosages, need to be developed based on the hormone levels to ensure optimal outcomes for the mother and the child. Comprehensive prenatal care and regular glucose monitoring are critical in managing gestational diabetes, as they enable healthcare professionals to effectively intervene and support positive pregnancy outcomes by addressing the complex interactions between HPL, PGH, and maternal–fetal physiology.
3. Methodology
We used multiple machine learning algorithms for diabetes prediction and evaluated the results to identify the most accurate classifier.
3.1. Data Description
The dataset used in this study comprised 768 records, each containing nine attributes, with one attribute designated as the outcome. A total of 268 cases were classified as “tested positive,” indicating diabetes, while 500 cases were labeled as “tested negative,” signifying the absence of diabetes. Variables encompassed the number of pregnancies, blood pressure, glucose levels, skin thickness, insulin levels, body mass index (BMI), age, and potentially any pedigree function associated with diabetes [1]. These characteristics are essential for finding trends and estimating the risk of diabetes in the dataset’s members.
To analyze this dataset and find correlations between the different features and the chance of a patient testing positive for diabetes, statistical analysis, machine learning algorithms, or other data analysis techniques were used. Developing predictions to support the early identification and treatment of diabetes improves healthcare and treatment approaches.
3.2. Data Visualization
3.2.1. Count Plot
Count plots provide an overview of the machine learning model’s performance in detecting diabetes. The alignment of bars offers information on the model’s predictive accuracy [2]. The similarity of the actual and predicted data indicates the model’s effectiveness in accurately identifying cases of diabetes. The count plot serves as a clear and informative visualization of the model’s performance, highlighting its capability of accurate predictions. Figure 2 shows the distribution of predicted diabetes cases compared with the actual diabetes cases in our dataset.
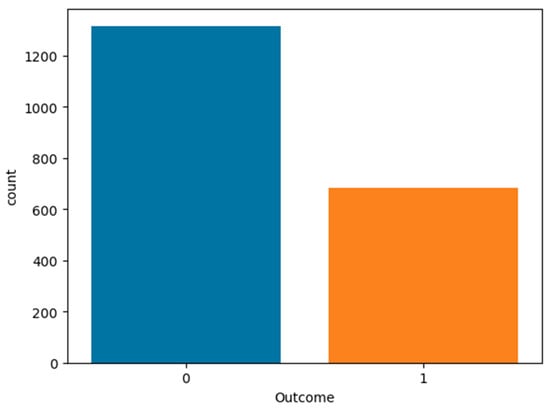
Figure 2.
Count plot.
3.2.2. Histogram
In diabetic prediction, a histogram is used to outline the distribution of predicted diabetes cases alongside the actual occurrences (Figure 3).
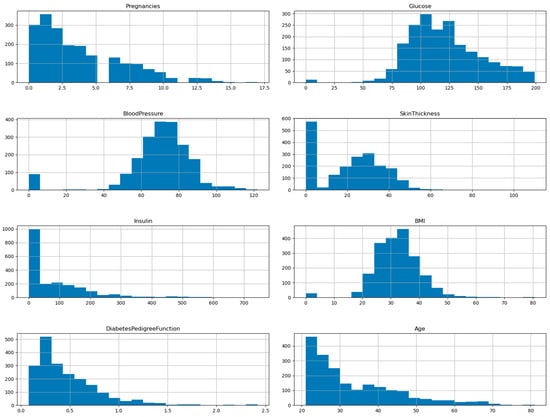
Figure 3.
Histogram.
3.2.3. Scatterplot
Diabetes levels are plotted against predicted values to show the model’s performance. High accuracy is indicated by the points’ diagonal alignment (Figure 4).
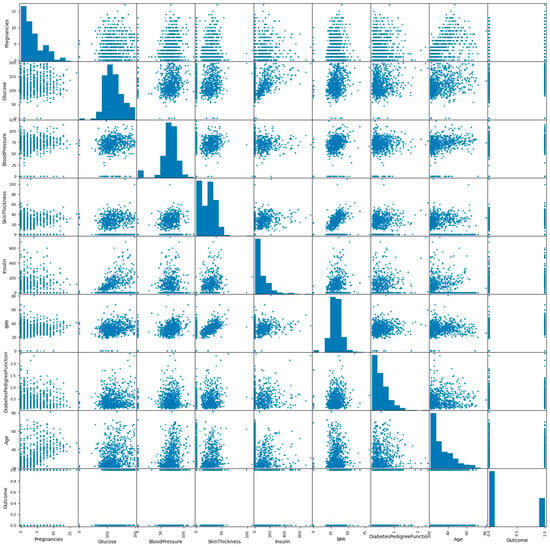
Figure 4.
Scatterplot.
3.2.4. Pair-Plot
A pair-plot enables the visual exploration of the relationships between multiple variables (Figure 5).
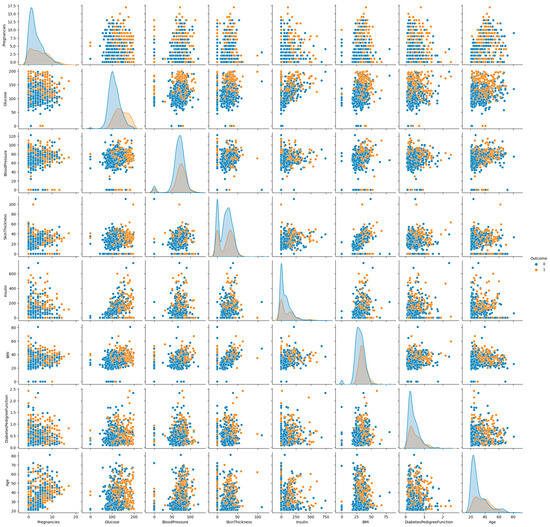
Figure 5.
Pair-plot.
3.2.5. Heatmap
To explore correlations in the diabetes prediction model, a heatmap is used. Strong correlations indicated by darker squares are used to select features and model improvement (Figure 6).
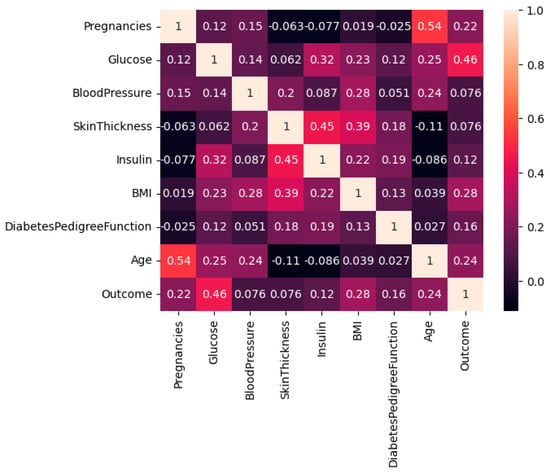
Figure 6.
Heatmap.
3.3. Pre-Processing Data
Data preparation is critical in applying machine learning techniques as it directly impacts the accuracy and efficiency of prediction. Although the Indian Diabetes dataset does not contain missing values, certain features have zero values that lack meaningful significance. To address this, we normalized the data and replaced the zero values with the mean values to present diabetic patients [3]. Following the normalization of the Pima Indians Diabetes dataset, 70% of the data was allocated for training and validation, while the remaining 30% was for testing (Table 1). The model was developed using the Python 3.12 programming language (Figure 7).

Table 1.
Dataset description.
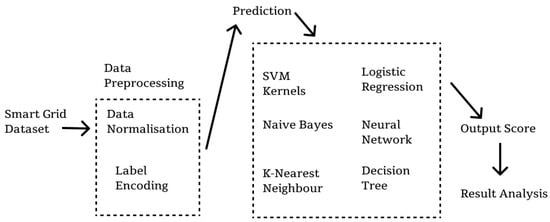
Figure 7.
The proposed model in this study.
3.4. Classification Algorithms
We applied machine learning to categorize the dataset with features including pregnancy, glucose levels, blood pressure, skin thickness, insulin, BMI, pedigree, and age. Additionally, we derived two new features through exploratory data analysis. We employed KNN, RF, SVM, LR, NB, and DT algorithms [4]. A diabetic individual was defined as an object with blood pressure exceeding 80 and glucose levels surpassing 105. Notably, the DT algorithm achieved the highest accuracy of 99.75% when utilizing these features.
3.4.1. KNN
KNN is a nonlinear supervised machine learning technique that classifies objects in the input space using closeness. It addresses regression and classification problems and operates in a learning process, where data generalization is deferred until after classification. To determine the class of an element not present in the training set, the KNN classifier identifies the k nearest elements in the training set to the unknown element, based on the shortest distance. These k elements, referred to as KNNs, have their classes verified, and the most frequent class is assigned to the unknown element [5]. The KNN classification technique demonstrated an accuracy of 80.25% in this study, indicating its effectiveness in correctly identifying instances. With a precision of 82%, it accurately classified diabetic patients. Its recall of 77% reflected its ability to capture a significant proportion of actual positive cases. These metrics underscore the reliability and balanced performance of KNN in classification tasks.
3.4.2. RF
RF is a straightforward machine learning technique that often produces excellent results even without fine-tuning its hyperparameters. RF constructs decision trees in an ensemble. The RF algorithm exhibited an accuracy of 98.0%, highlighting its high precision in correctly identifying instances. It showed a precision of 79%, indicating the accurate classification of diabetic patients. The recall was 86%, underscoring its effectiveness in capturing a substantial proportion of diabetics [6]. These metrics emphasize the robust and well-balanced performance of RF in classification tasks.
3.4.3. SVM
SVM is a supervised machine learning model introduced by Vapnik and Chervonenkis in 1963. SVM identifies the optimal hyperplane that best separates examples of different classes. This classifier finds the hyperplane and maximizes the margin between different classes, while simultaneously ensuring that the margin between the hyperplane and the nearest points in each class (support vectors). The minimum distance from a class to the hyperplane reflects the separation between the class instances and the boundary [7]. SVM shows an accuracy of 78.75%, reflecting its capability to correctly classify instances. The precision was 74%, implying the correct identification of positive predictions, and the recall was 74%, indicating its effectiveness in capturing a significant portion of actual positive cases. These metrics highlight the balanced and dependable performance of SVM in classification.
3.4.4. DT
DT is used for classification and regression tasks. The DT model utilizes a tree-like structure to classify instances based on feature attributes, effectively handling both nominal and numerical features. DT uses a top-down approach to partition the dataset recursively, splitting nodes based on the most informative attributes. DT showed an exceptional accuracy of 99.75% and underscored its high precision in classifying instances correctly. The precision was 82% showing that DT accurately identified diabetic patients. The recall was 81%, showing its ability to capture a substantial proportion of actual positive cases. These metrics underscore the robust and high-performing nature of DT in classification.
3.4.5. NB
NB is a widely used probabilistic classification algorithm in machine learning for its simplicity and efficiency, particularly in text classification and spam detection. In diabetes classification, NB calculates the probability of a given data point belonging to diabetic or non-diabetic classes based on features such as age, BMI, skin thickness, insulin, glucose, blood pressure, pregnancy, and pedigree. The algorithm uses Bayes’ theorem to compute the probability of each class and the likelihood of observing these feature values given each class, assigning the class with the highest probability as the predicted outcome. NB showed an accuracy of 77.5% in classifying instances correctly. The precision was 84% showing strong accuracy in identifying positive predictions. The recall was 86%, highlighting its effectiveness in capturing a significant portion of actual positive cases. These metrics emphasize the balanced and reliable nature of Naïve Bayes in classification tasks [8,9].
3.4.6. LR
LR is a popular linear classification method that models the relationship between one or more independent variables such as age, BMI, and glucose levels and a binary dependent variable such as diabetic or non-diabetic status. LR effectively handles binary and multiclass classification. It showed an accuracy of 77.5%, indicating its proficiency in classifying cases. With a precision and recall of 85%, LR accurately identified diabetic patients. Its metrics highlight the reliability of LR in classification.
4. Results
We tested various classification algorithms to forecast diabetes onset. A diabetic individual was defined as having a blood pressure exceeding 80 and a glucose level surpassing 105, criteria determined using exploratory data analysis to extract additional features from the dataset [10]. The predictive models incorporated features such as pregnancy, glucose, blood pressure, skin thickness, insulin, BMI, pedigree, and age, all meticulously documented within the dataset. We utilized various classification algorithms, including KNN, RF, SVM, LR, NB, and DT. The additional blood pressure threshold of 80 as a marker of diabetes was refined for prediction to enhance accuracy.
Table 2 presents the outcomes of the diverse classification methods using the newly extracted features and available features [11]. The RF classifier was the most effective, achieving an accuracy of 98.0%, and precision, recall, and F1-score metrics of 82, 77, and 85%, respectively. The KNN classifier presented an accuracy, precision, recall, and F1-score of 98, 79, 86, and 80%, respectively. These results underscore the efficacy of the RF and KNN in diabetes prediction, affirming their robustness [12,13,14].

Table 2.
Comparison of various classification techniques using both the two newly extracted features and all available features.
5. Conclusions
We tested various diabetes prediction models with machine learning algorithms, subsequently scrutinizing the outcomes to identify the optimal classifier with the highest accuracy. Various algorithms extracted novel features from the dataset to enhance performance. The efficiency of RF and KNN algorithms was verified in terms of efficiency and accuracy. DT showed an accuracy of 75%, underscoring its predictive capabilities for diabetes diagnosis and prognosis.
Author Contributions
Conceptualization, S.R.; methodology, K.J. and H.-K.S.; software, K.J.; writing—original draft preparation, S.R.; writing—review and editing, H.-K.S., W.-K.K., M.M., B.S. and K.S. All authors have read and agreed to the published version of the manuscript.
Funding
This research was funded by Smart Machinery and Intelligent Manufacturing Research Center, National Formosa University, Taiwan.
Institutional Review Board Statement
Not applicable.
Informed Consent Statement
Not applicable.
Data Availability Statement
No new data were created or analyzed in this study. Data sharing is not applicable to this article.
Conflicts of Interest
The authors declare no conflicts of interest.
References
- Lonappan, A.; Bindu, G.; Thomas, V.; Jacob, J.; Rajasekaran, C.; Mathew, K.T. Diagnosis of diabetes mellitus using microwaves. J. Electromagn. Waves Appl. 2007, 21, 1393–1401. [Google Scholar] [CrossRef]
- Kang, H. The prevention and handling of missing data. Korean J. Anesthesiol. 2013, 64, 402–406. [Google Scholar] [CrossRef] [PubMed]
- Iancu, I.; Mota, M.; Iancu, E. Method for the analysing of blood glucose dynamics in diabetes mellitus patients. In Proceedings of the 2008 IEEE International Conference on Automation, Quality and Testing, Robotics, Cluj-Napoca, Romania, 22–25 May 2008; pp. 458–463. [Google Scholar] [CrossRef]
- Robertson, G.; Lehmann, E.D.; Sandham, W.; Hamilton, D. Blood glucose prediction using artificial neural networks trained with the AIDA diabetes simulator: A proof-of-concept pilot study. J. Electr. Comput. Eng. 2011, 2011, 681786. [Google Scholar] [CrossRef]
- Soni, M.; Varma, S. Diabetes prediction using machine learning techniques. Int. J. Eng. Res. Technol. 2020, 9, 482–485. [Google Scholar]
- Sarwar, M.; Kamal, N.; Hamid, W.; Shah, A. Diabetes prediction using machine learning. In Proceedings of the International Conference on Automation and Computing (ICAC), Newcastle upon Tyne, UK, 6–7 September 2018; World Health Organization (WHO): Geneva, Switzerland, 2018. [Google Scholar]
- Zhou, Z. Machine Learning; Tsinghua University Press: Beijing, China, 2016; pp. 121–139, 298–300. [Google Scholar]
- Li, H. Statistical Learning Methods; Tsinghua University Press: Beijing, China, 2012; Chapter 7; pp. 95–135. [Google Scholar]
- Qin, J.; He, Z.S. A SVM face recognition method based on Gabor-featured key points. In Proceedings of the 2005 International Conference on Machine Learning and Cybernetics, Guangzhou, China, 18–21 August 2005; Volume 8, pp. 5144–5149. [Google Scholar]
- Joshi, T.N.; Chawan, P.M. Diabetes prediction using machine learning techniques. Int. J. Eng. Res. Appl. 2018, 8, 9–13. [Google Scholar]
- Parashar, A.; Burse, K.; Rawat, K. A comparative approach for Pima Indians diabetes diagnosis using LDA, support vector machine, and feed-forward neural network. Int. J. Adv. Res. Comput. Sci. Softw. Eng. 2014, 4, 378–383. [Google Scholar]
- Al Helal, M.; Chowdhury, A.I.; Islam, A.; Ahmed, E.; Mahmud, M.S.; Hossain, S. An optimization approach to improve classification performance in cancer and diabetes prediction. In Proceedings of the 2019 International Conference on Electrical, Computer and Communication Engineering (ECCE), Cox’s Bazar, Bangladesh, 7–9 February 2019; pp. 1–5. [Google Scholar]
- Dataset: Pima Indians Diabetes. UCI Machine Learning Repository. Available online: https://archive.ics.uci.edu/dataset/34/diabetes (accessed on 10 April 2025).
- Manikandan, M.; Vijayakumar, P. Improving the Performance of Classifiers by Ensemble Techniques for the Premature Finding of Unusual Birth Outcomes from Cardiotocography. IETE J. Res. 2021, 69, 1734–1744. [Google Scholar] [CrossRef]
Disclaimer/Publisher’s Note: The statements, opinions and data contained in all publications are solely those of the individual author(s) and contributor(s) and not of MDPI and/or the editor(s). MDPI and/or the editor(s) disclaim responsibility for any injury to people or property resulting from any ideas, methods, instructions or products referred to in the content. |
© 2025 by the authors. Licensee MDPI, Basel, Switzerland. This article is an open access article distributed under the terms and conditions of the Creative Commons Attribution (CC BY) license (https://creativecommons.org/licenses/by/4.0/).