1. Introduction
Dance is an artistic movement with precision, coordination, and expressive qualities. Traditional methods of dance evaluation depend on the subjective judgment and experience of judges [
1]. However, the inherent variability in the interpretation of movements and performances of judges makes scores vulnerable to inconsistency and subjectivity. As a result, the development of an objective and accurate automated evaluation system is mandated.
Therefore, we have developed an automated dance evaluation system based on the analysis of human joint points. The rapid advancements in image recognition technology enable the capturing of dancers’ movement data through human joint point detection and a comprehensive analysis of their movements. To ensure an accurate assessment of a dancer’s performance, the model incorporates two primary evaluation metrics: the area score and the angle score. The area score is calculated by measuring the polygonal area formed by the dancer’s joints to reflect the relative distances and positional changes of the joints throughout the movement. Conversely, the angle score is marked based on the angular changes between joints which are an indicator of the accuracy and coordination of the movements.
To enhance the objectivity and precision of the evaluation outcomes, these two score types undergo a weighting process before the final evaluation result is generated. The weighting mechanism takes into account the significance of various movement characteristics, ensuring a comprehensive and accurate assessment of the dancer’s overall performance. To establish an efficient and precise automated dance evaluation system, this innovative methodology is used, addressing the subjectivity inherent in traditional manual evaluations and providing a scientific foundation for dance training and competitions. The model can be applied to other human movement analyses, such as sports and rehabilitation. The model presents a novel technological approach to movement analysis and assessment.
In this article,
Section 2 describes the collected database.
Section 3 introduces the pre-processing methods of alignment. The scoring methods are described in
Section 4 and the experimental results are presented in
Section 5.
2. Data
The video data used in this research was obtained from dance performances by students at Taipei First Girls High School. Each recording features a sequence of 24 musical beats for 10 s. To improve the accuracy of subsequent analyses and prevent distractions, the background was kept minimal, and uniformity in the dancers’ postures, body proportions, and positioning across all recordings was maintained. Each video begins with the dancer in a preparatory standing position for the first 8 beats and concludes with a final pose for an additional 8 beats. This standardized format was created to ensure consistency in aligning the start and end of each performance and the dancer’s movements and positioning within the frame. The uniformity in all videos was kept for precise motion analysis.
3. Music
The inconsistencies found in the starting points of different videos directly impact the results and accuracy of subsequent analyses. To ensure comparisons in a consistent time reference, a method for alignment based on audio signal analysis was used, which differs from previous data processing methods [
2].
We analyzed the audio signals of the videos frame by frame to detect the first non-zero amplitude frame in the music signal and designated that frame as the starting point of the video. This method ensures that all videos commence at the same point in the musical rhythm, and comparison errors caused by variations in shooting start times are minimized.
After determining the starting frame of the videos, the model extracts and aligns the dancer’s joint position data. It retrieves the corresponding range of joint position data segments based on the identified starting frame. These aligned data segments were used for subsequent movement analysis and scoring. The precision of data alignment directly influences the accuracy of angle calculations and the overall scoring results. Therefore, a unified alignment of video data was ensured for accurate, fair, and consistent evaluations of the subsequent steps and improved reliability and effectiveness of the overall evaluation process.
4. Scoring Method
The score of the total area was calculated based on the polygons formed by the dancer’s body joints. Each joint position represents the dancer’s posture during a specific movement, and the lines connecting these joints create a polygon. As the dancer’s movements change, the area of this polygon varies. By monitoring these area changes, the dancer’s stability during movements is assessed. For instance, when the dancer’s posture is consistent and accurate, the area fluctuation becomes small; conversely, unstable movements lead to larger area variations. Therefore, the total area score reflects the dancer’s overall stability throughout the performance.
Secondly, scoring the total angle involves more than just comparing angular changes between joints. We have developed a specialized formula to address angular differences for a precise evaluation of the dancer’s movements. The formula does not merely process the angle differences. A projection transformation is employed to convert the angular differences into corresponding scores. This approach enables various angular variations to align with distinct score ranges. To create distinctions between minor and significant angular differences, the model detects subtle changes in the dancer’s performance accurately.
For instance, when the angular difference is small, the model assigns a high score, indicating that the dancer’s movements closely follow the standard. Conversely, as the angular difference increases, the score decreases, reflecting the deviation of the dancer’s movements from the standard. This non-linear projection formula mitigates the ambiguity of basic and simple angular difference calculations. By employing this method, the score of the total angle accurately reflects the dancer’s performance across various movements and provides sufficient differentiation for detailed comparisons among multiple dancers.
The formula allows the model to accurately evaluate movements with significant angular changes, while effectively distinguishing minor angular deviations. This method enhances the accuracy of scoring the total angle and the system’s evaluation capabilities, facilitating a comprehensive analysis of complex movements and their variations. In addition, the method is used to evaluate dance movements precisely and scientifically.
These two metrics enable a comprehensive and quantifiable evaluation of dance movements. A dancer’s movement data are automatically converted into values. The metrics also offer a scientific foundation for assessing a dancer’s performance. The scores of the total area and angle complement each other, allowing for a multi-dimensional evaluation. Technical accuracy and the dancer’s stability and movement consistency are also evaluated by integrating these two indicators. The evaluation system proposed in this research can be used to accurately assess the dancer’s performance with scientifically supported data.
4.1. Total Area
The score of the total area is a metric for evaluating a dancer’s stability during movement. By monitoring changes in joint positions, the total area is scored. As the dancer performs movements, the coordinates of the joints form a series of polygons. The variations in the sizes of these polygons present the area score in each frame. We calculate the area data for each frame of the dancer’s movements and normalize it to calculate an overall area score, which reflects the dancer’s stability and control during motion.
To accurately compute the area, we employ the convex hull algorithm [
3]. This algorithm identifies the smallest convex polygon that encompasses all points within a given set through multi-level calculations and outputs the resulting measure for the area of the polygons. A property of the convex hull is that any line segment drawn between two points of the polygon remains entirely contained. This algorithm is widely applied in computational geometry, image processing, and machine learning due to its effectiveness and precision in handling geometric structures involving multiple points.
Table 1 presents the scores for various body parts corresponding to key points. The score for each body part is calculated based on specific criteria, including areas such as the hands, legs, and spine. This scoring method improves the accuracy of evaluating the performance of each body part.
4.2. Total Angle
The calculation of the angle score is based on the angular changes among three joints. The angular changes during the performance are observed and compared in the reference video to estimate angular differences. These angular differences are then processed using a non-linear function to scores. In the overall assessment, the angle score is a crucial measure for evaluating the accuracy of the dancer’s movements. This metric is determined by the angular variations between the three joints (
Table 2). By comparing the dancer’s actual angular changes with the standard angular differences, angular differences are scored using non-linear functions (1) and (2). This process enables the evaluation of the dancer’s movement precision, which are the quantitative basis for overall scoring.
where
a represents the result of taking the square root of two divided by the variation of each joint,
ad denotes the magnitude of the angular change, and
b is a parameter used to adjust the score. This adjustment ensures that as the angular difference approaches 0, the score approaches 100.
The non-linear function emphasizes smaller angular differences resulting in higher scores, while larger angular differences significantly lower the score. In movement precision, … represent the total angle scores of the joints.
5. Results and Discussion
The predicted scores aligned with the actual scores (
Figure 1). The model effectively captured the upward trajectory of the actual scores, demonstrating its predictive accuracy. However, in certain areas of lower scores, the model’s predicted ability was significantly lower. This discrepancy suggests that the model’s learning effectiveness in these regions was inadequate. Furthermore, even in the higher score range, while the model traced changes, there were still discrepancies between the predicted and actual scores, indicating room for improvement. The root mean square error (RMSE) was 13.12, indicating that the model’s overall prediction performance was satisfactory [
4]. However, significant deviations were also observed. The model effectively scored accurate dance movements. However, the prediction was not accurate for dance movements with deviations. The model also showed a limitation in managing outliers. To further enhance the model’s generalization, it is necessary to expand the dataset or implement a sophisticated outlier handling algorithm to improve the model’s predictive ability.
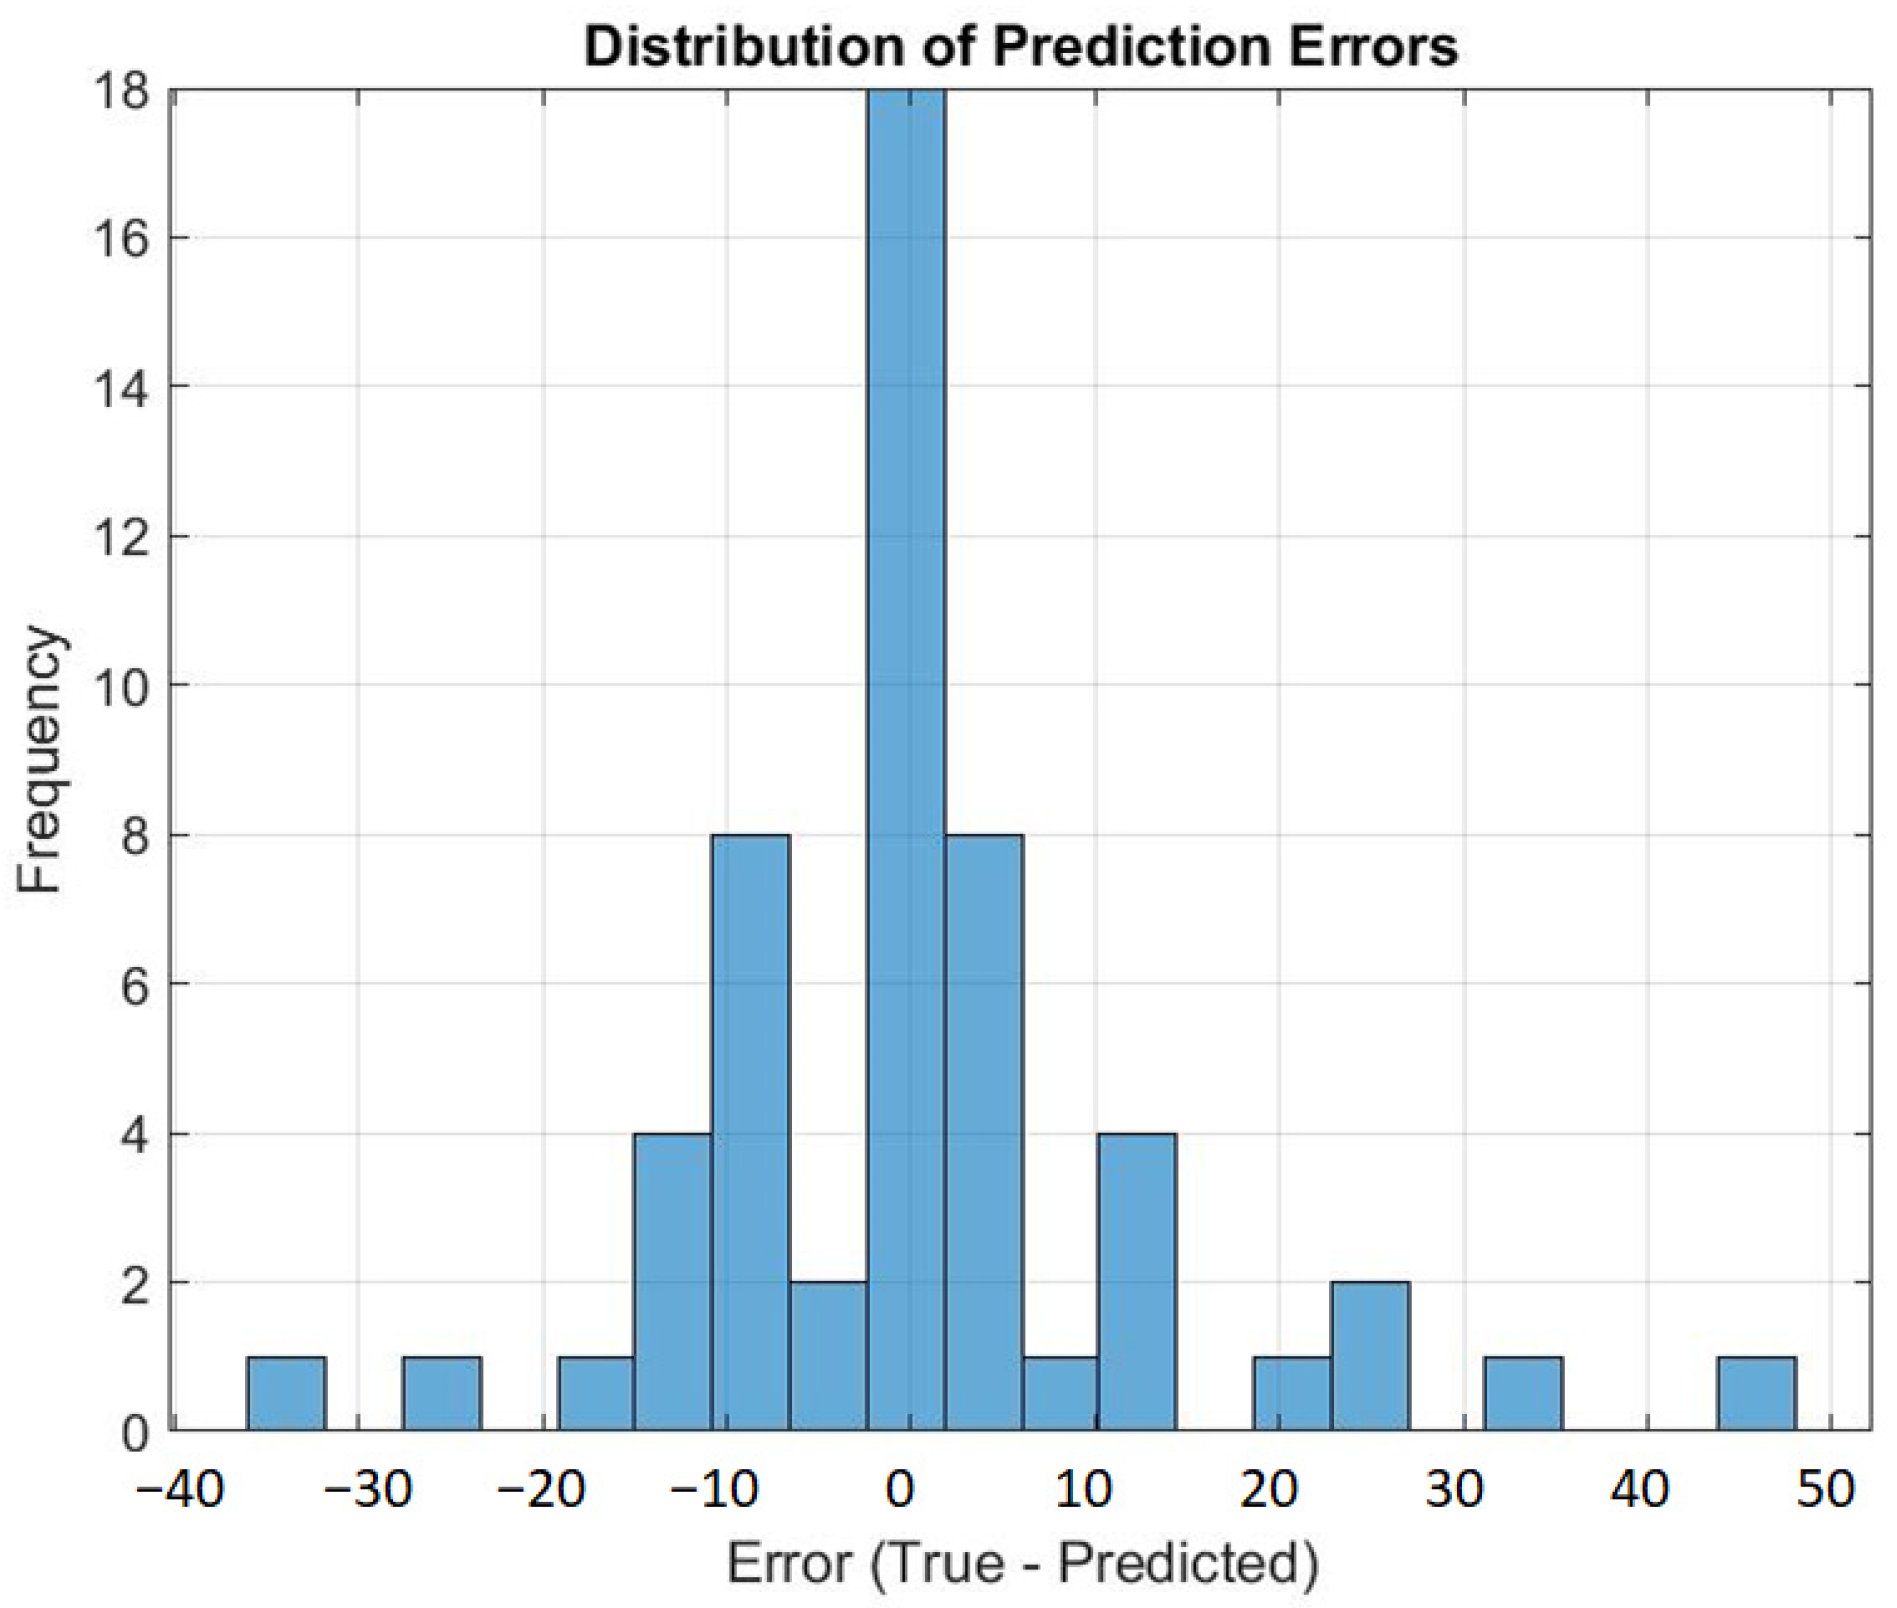
Figure 2 illustrates the distribution of prediction errors in the dance scoring system. The system’s predictive capability was stable. Most prediction errors were concentrated around zero, suggesting that the model accurately assessed the dancer’s posture, and the predicted results coincided with the actual scores. This high accuracy underscores the system’s performance in posture recognition and evaluation. A few samples exhibited larger errors, which necessitates enhancement, particularly when scoring complex or extreme dance postures. These outliers need to be optimized by the system’s algorithm to manage a wider range of scores effectively.
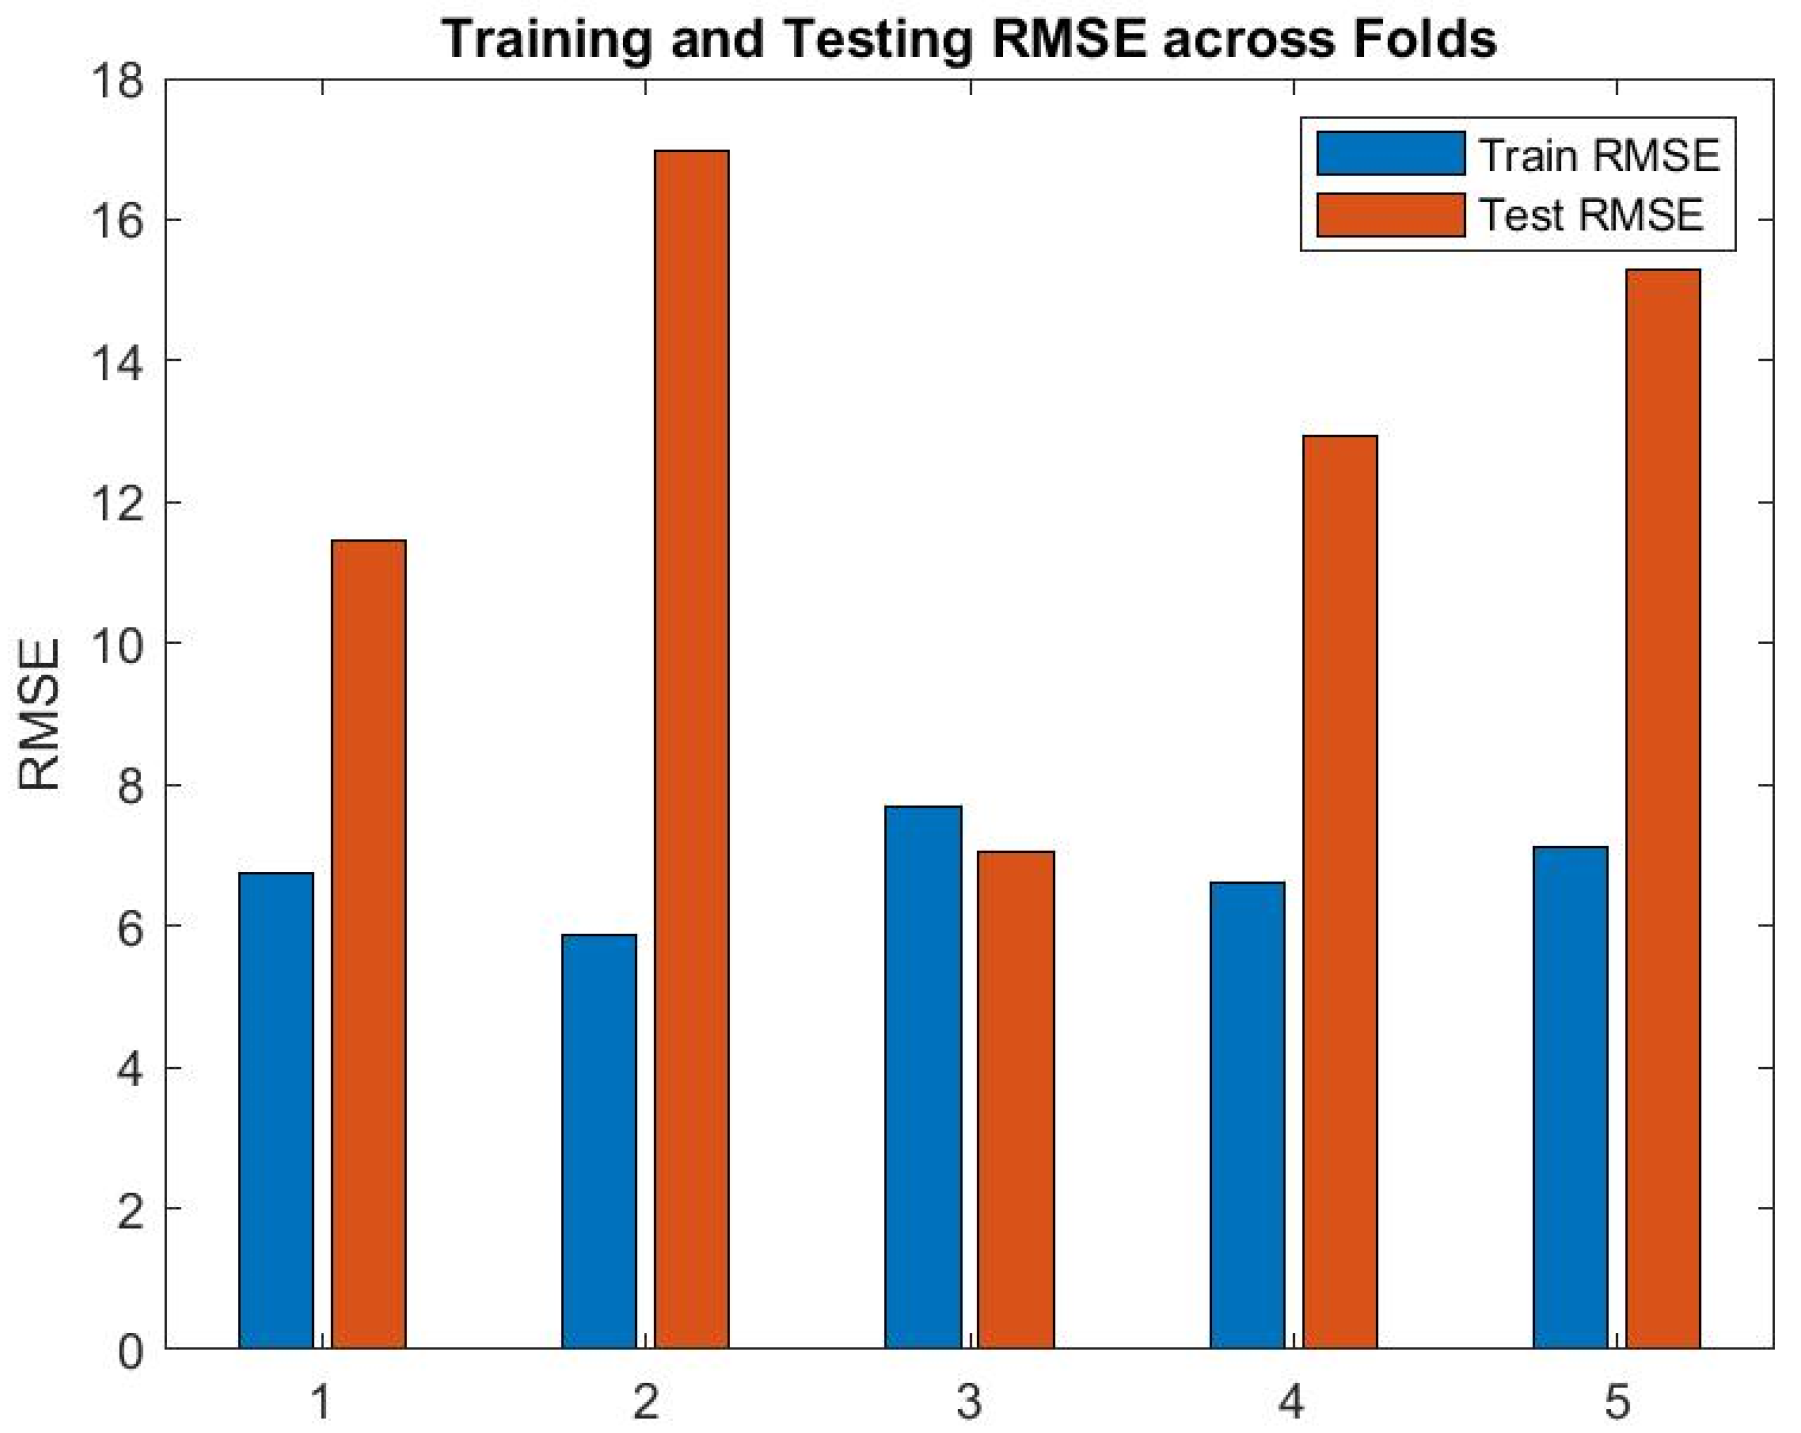
RMSEs in training and testing in the 5-fold cross-validation process [
5] are presented in
Figure 3. The small difference between the RMSE in testing and training indicates that the model exhibited strong generalization capabilities and effectively managed unseen dance data. The model maintained stable performance across various folds and diverse dance movements. Although RMSEs in testing at the second and fifth folds were slightly higher than those in training, the system’s robustness was maintained in various data distributions. Overall, these results confirmed that the model evaluated dance performances stably and accurately.
6. Conclusions
The developed dance posture analysis model exhibited a significant level of stability and minimized prediction errors. The majority of the errors clustered around zero, suggesting that the model accurately evaluated a dancer’s postures and movements with the predicted scores close to the actual scores. This underscores the system’s effectiveness in posture recognition and assessment. Further refinement of the model for scoring intricate or extreme dance postures, even with large prediction errors, reduces the observed large prediction errors. Through algorithm optimization, the model can accommodate a broader range of dance posture variations. The results from the 5-fold cross-validation revealed a negligible difference between RMSEs in testing and training. The model was confirmed for robust generalization capabilities as it effectively predicted the scores of dance performance across different postures and movements. It also successfully adapted to various types of dance movement data. Although the RMSE in testing was higher than that in training in the second and fifth folds, the system’s adaptability and flexibility for diverse data distributions were validated. The stability and accuracy of the model in evaluating dance performances allow it to be used in various applications.
Author Contributions
Conceptualization, B.-Z.L. and J.-J.D.; methodology, B.-Z.L. and J.-J.D.; software, C.-J.F. and H.-H.J.; validation, C.-J.F. and H.-H.J.; formal analysis, B.-Z.L. and J.-J.D.; investigation, C.-J.F. and H.-H.J.; resources, C.-J.F. and H.-H.J.; data curation, C.-J.F. and H.-H.J.; writing—original draft preparation, B.-Z.L.; writing—review and editing, J.-J.D.; visualization, B.-Z.L. and J.-J.D.; supervision, J.-J.D.; project administration, J.-J.D.; funding acquisition, J.-J.D. All authors have read and agreed to the published version of the manuscript.
Funding
This research was funded by the National Science and Technology Council, Taiwan, under the contract of MOST 110-2221-E-002-092-MY3.
Institutional Review Board Statement
Not applicable.
Informed Consent Statement
Not applicable.
Data Availability Statement
No new data were created.
Conflicts of Interest
The authors declare no conflict of interest.
References
- Ortega, B.P.; Olmedo, J.M.J. Application of motion capture technology for sport performance analysis. Retos Nuevas Tend. Educ. Física Deporte Recreación 2017, 32, 241–247. [Google Scholar]
- Lee, H.Y.; Yang, X.; Liu, M.Y.; Wang, T.C.; Lu, Y.D.; Yang, M.H.; Kautz, J. Dancing to music. In Proceedings of the NIPS’19: 33rd International Conference on Neural Information Processing Systems, Vancouver, BC, Canada, 8–14 December 2019; pp. 1–11. [Google Scholar]
- Barber, C.B.; Dobkin, D.P.; Huhdanpaa, H. The quickhull algorithm for convex hulls. ACM Trans. Math. Softw. 1996, 22, 469–483. [Google Scholar] [CrossRef]
- Hodson, T.O. Root mean square error (RMSE) or mean absolute error (MAE): When to use them or not. Geosci. Model Dev. Discuss. 2022, 15, 5481–5487. [Google Scholar] [CrossRef]
- Rodriguez, J.D.; Perez, A.; Lozano, J.A. Sensitivity analysis of k-fold cross validation in prediction error estimation. IEEE Trans. Pattern Anal. Mach. Intell. 2009, 32, 569–575. [Google Scholar] [CrossRef] [PubMed]
| Disclaimer/Publisher’s Note: The statements, opinions and data contained in all publications are solely those of the individual author(s) and contributor(s) and not of MDPI and/or the editor(s). MDPI and/or the editor(s) disclaim responsibility for any injury to people or property resulting from any ideas, methods, instructions or products referred to in the content. |
© 2025 by the authors. Licensee MDPI, Basel, Switzerland. This article is an open access article distributed under the terms and conditions of the Creative Commons Attribution (CC BY) license (https://creativecommons.org/licenses/by/4.0/).


