Proceeding Paper

Proportion of Fly Ash in Producing Roller-Compacted Concrete †

1
Department of Civil Engineering, National Chung Hsing University, Taichung 40227, Taiwan
2
Department of Construction Engineering, Chaoyang University of Technology, Taichung 413310, Taiwan
*
Author to whom correspondence should be addressed.
Presented at the 2024 IEEE 6th International Conference on Architecture, Construction, Environment and Hydraulics, Taichung, Taiwan, 6–8 December 2024.
Eng. Proc. 2025, 91(1), 5; https://doi.org/10.3390/engproc2025091005
Published: 10 April 2025

Abstract

Roller-compacted concrete (RCC) is designed with consideration for construction machinery capabilities, offering benefits such as rapid construction and cost-efficiency. Therefore, RCC is appropriate for large-scale concrete projects such as gravity dams. Due to its lower cement content and heat of hydration, RCC also saves energy. In this study, the compressive strength properties and mixing ratio of RCC were investigated through experiments and the results were compared with those of traditional concrete (ordinary Portland cement, OPC). In the same water–cement ratio, RCC uses less binder but achieves a higher compressive strength than OPC. Furthermore, for a strength of 210 kg/cm2 at 28 days, water–binder ratios of 0.5 and 0.6 with 50 and 30% fly ash replacement rates were experimented with. The two ratios showed similar performance and economic advantages with the RCC cement content ranging from 80 to 150 kg/m3. RCC with fly ash is a cost-effective and efficient solution for large-scale projects.

1. Introduction

Infrastructure construction is crucial for a nation’s economic development, and concrete is the most common material used for it. To meet diverse needs, various types of concrete have been developed, but their basic composition includes coarse and fine aggregates, cement, and water. Due to differences in construction conditions, structural requirements, and types of concrete, appropriate types of concrete are used to satisfy engineering properties and construction demands. For sustainable development, the development of new materials and resource recycling is significant.
Roller-compacted concrete (RCC) is a no-slump concrete that is simple, quick, and economical to use and appropriate for prolonged construction periods due to rainy and humid conditions [1]. According to the American Concrete Institute (ACI Committee 207.5R-11), RCC needs to be compacted by roller compaction using a vibratory roller in an unhardened state. RCC has a high coarse aggregate content and lower cement content. Freshly mixed RCC has sufficient strength to support the vibratory roller. RCC enhances the compressibility and flexural strength of concrete [2].
The difference between RCC and traditional concrete (OPC) is consistency. RCC is extremely dry. After mixing, it resembles uncompressed base material. For necessary compaction, a vibratory roller is required. Therefore, RCC must have sufficient consistency to support the roller’s weight and prevent the equipment from sinking during compaction [3,4]. RCC also has a low mortar content to fill the voids between aggregate particles. This reduces the amount of cement required compared with OPC and lowers the heat generated from hydration; therefore, cooling equipment is not necessary. These properties make RCC appropriate for large concrete projects. In paving, RCC can be transported using dump trucks or conveyors and then spread and compacted with bulldozers and vibratory rollers. After compaction, the next layer can be paved immediately, enabling rapid construction and shorter project timelines [5,6].
RCC and OPC differ in consistency and workability. RCC is much drier, with slump values ranging from 0 to 25 mm and VC values of 5–32 s, depending on its dryness. In contrast, OPC has higher workability, with slump values ranging from 25 to 175 mm and VC values of 0–5 s, making it more fluidic and easier to use (Table 1).
RCC is produced using economically available materials to satisfy compaction requirements. Its properties depend on structural application, location, and design specifications. The RCC mix design is based on the Soil Approach (Lean RCC Method, Simplified Soils Method) and Concrete Approach (High-Paste Method, Japanese RCD Method, US Army Corps of Engineers Method) [7,8].
The grading and mix ratio of coarse and fine aggregates significantly influence the properties of RCC. It is required to ensure that the voids in the aggregates are filled with the paste. An inadequate rolling energy or insufficient paste volume in RCC results in excessive voids within the concrete. Well-designed aggregates significantly reduce void volume. The grading of fine aggregates is related to the paste demand and compaction properties of RCC. Accordingly, ACI 325.10R provides a typical grading range for RCC pavement (RCCP). By increasing the amount of material passing the #200 sieve (75 μm), voids between aggregates are reduced. Canada permits the use of up to 8% of aggregates passing the #200 sieve, while the U.S. Bureau of Reclamation allows for 15% to enhance the surface characteristics of RCC [9,10].
For the RCC dam (RCCD), materials passing the #200 sieve range from 2 to 8%, with a maximum of 10%. Fine materials fill voids in the concrete, improving its density and creating a more uniform surface layer to reduce permeability. However, excessive fine materials decrease workability and require more water, which leads to a high water–cement ratio and reduced strength [9,10, 11]. Table 2 presents the grading ranges for RCCD and RCCP.

2. Experiments

Mixing Ratio

The mixing ratios used in this study were referred from ACI 211.3R, and the following ratios were used in the experiment [2,9,10].
  • Water–cementitious material ratio.
    The target design strength (f’c) was interpolated to determine the water–cementitious material ratio of W/(C + P).
  • Minimum paste volume (Pv).
    For mass concrete, Pv ≈ 0.38; for surface mixtures, Pv ≈ 0.46.
  • Absolute volume of coarse aggregate (Vca).
  • Volume of cement–sand mortar (Vm).
    Assuming an air content of 2%, a unit concrete volume of 1 was used as (1):
    Vm = Cv × 0.98 − Vca
  • Volume of cement paste (Vp).
Vp = Vm × Pv
  • Volume of fine aggregates (VFA).
VFA = Vm × (1 − Pv)
  • Water volume (Vw).
Vw = Vp × [(C + P)W ÷ (1 + (C + P)W)]
  • Cement volume (Vc)
Vc = Vw ÷ [(W ÷ (C + P)) + (1 + C ÷ P)]
  • Volume of mineral admixtures (VF).
VF = Vc × (P ÷ C)
  • Material volumes to weights.
Each material volume was multiplied by its specific gravity to calculate the weight of each material.
RCC was designed for use with rollers, following the guidelines provided in ACI 211.3. We employed the no-slump concrete method, utilizing lower quantities of cementitious materials, a reduced water content, and larger coarse aggregate sizes. The mixture design, material properties, and the process of producing RCC were as follows.
  • Material properties.
    The specific gravity of cement was 3.15, the specific gravity of fly ash was 2.08, and the specific gravity of coarse aggregate (SSD) was 2.64.
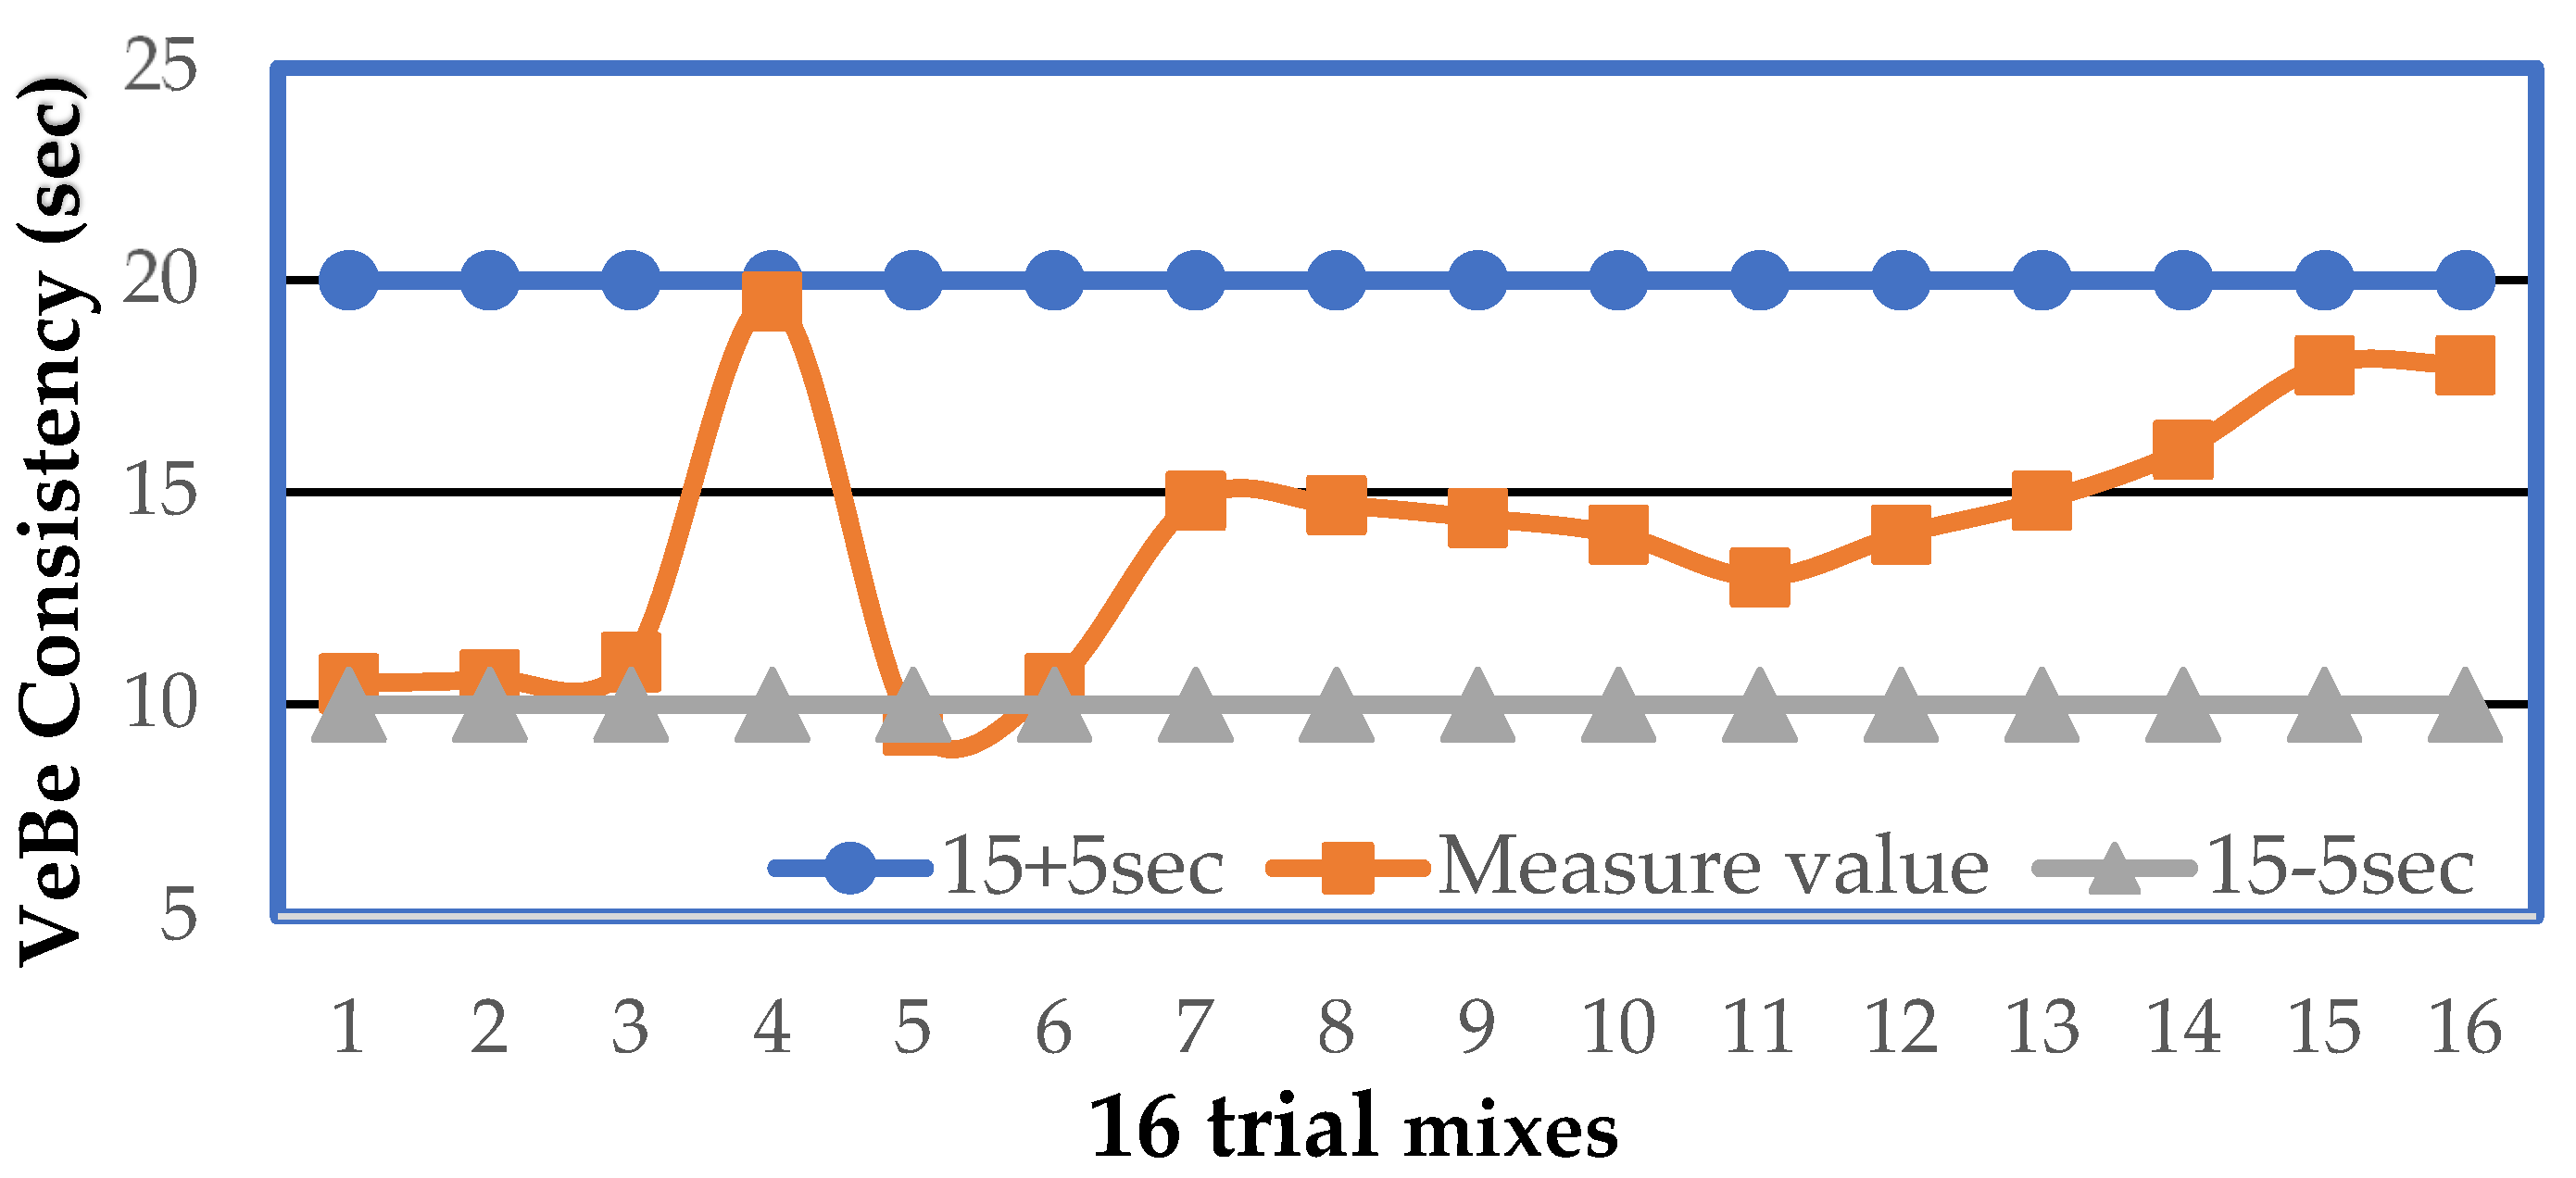
  • Design conditions.
    The VC value was 15 ± 5 s, the air content was 3%, and the ratio of sand (S/A) was 30%.
  • The fixed water volume was 120 kg/m3.
  • Cement and fly ash contents.
    The water–cementitious ratio was 0.4, the weight of cement was 120/0.4 = 300 kg, the weight of fly ash (30%) was 300 × 30% = 90 kg, and the weight of cement was 300 − 90 = 210 kg.
  • Absolute volume of aggregates.
    Va+s = 1 − Vair − Vw − Vc − Vf  = 1 3 100 120 1000 210 3.15 × 1000 90 2.08 × 1000 = 0.74 .
    Vs = 0.74 × 0.3 (S/A) = 0.22 Ws = 0.22 × 2.64 × 1000 = 580 kg.
    Va = 0.74 − 0.22 = 0.52 Wa = 0.52 × 2.64 × 1000 = 1373 kg.
  • Mix proportions per m3 of roller-compacted concrete.
    Cement: 210 kg, fly ash: 90 kg, fine aggregate: 580 kg, coarse aggregate: 1373 kg, and water: 120 kg.
    The mixing ratio is presented in Table 3.

3. Results and Discussion

3.1. VeBe Consistency Test [5,7,11]

RCC is a dry, non-slump concrete of which workability cannot be assessed using the traditional slump test method. Instead, the VB test is used to determine its consistency. The ideal VC value for on-site RCC must be 20 ± 10 s, whereas it must be adjusted to 15 ± 5 s for the mixture. The VB test is the most appropriate method for measuring the consistency of dry and hard concrete. In the experiment, a vibrating compaction process was used to cover the surface of the concrete with a thin layer of paste, and the time taken was measured as the VC value. The VC values of 16 mixing ratios satisfied the workability requirements (Figure 1), and appropriate mix designs were selected based on these results.

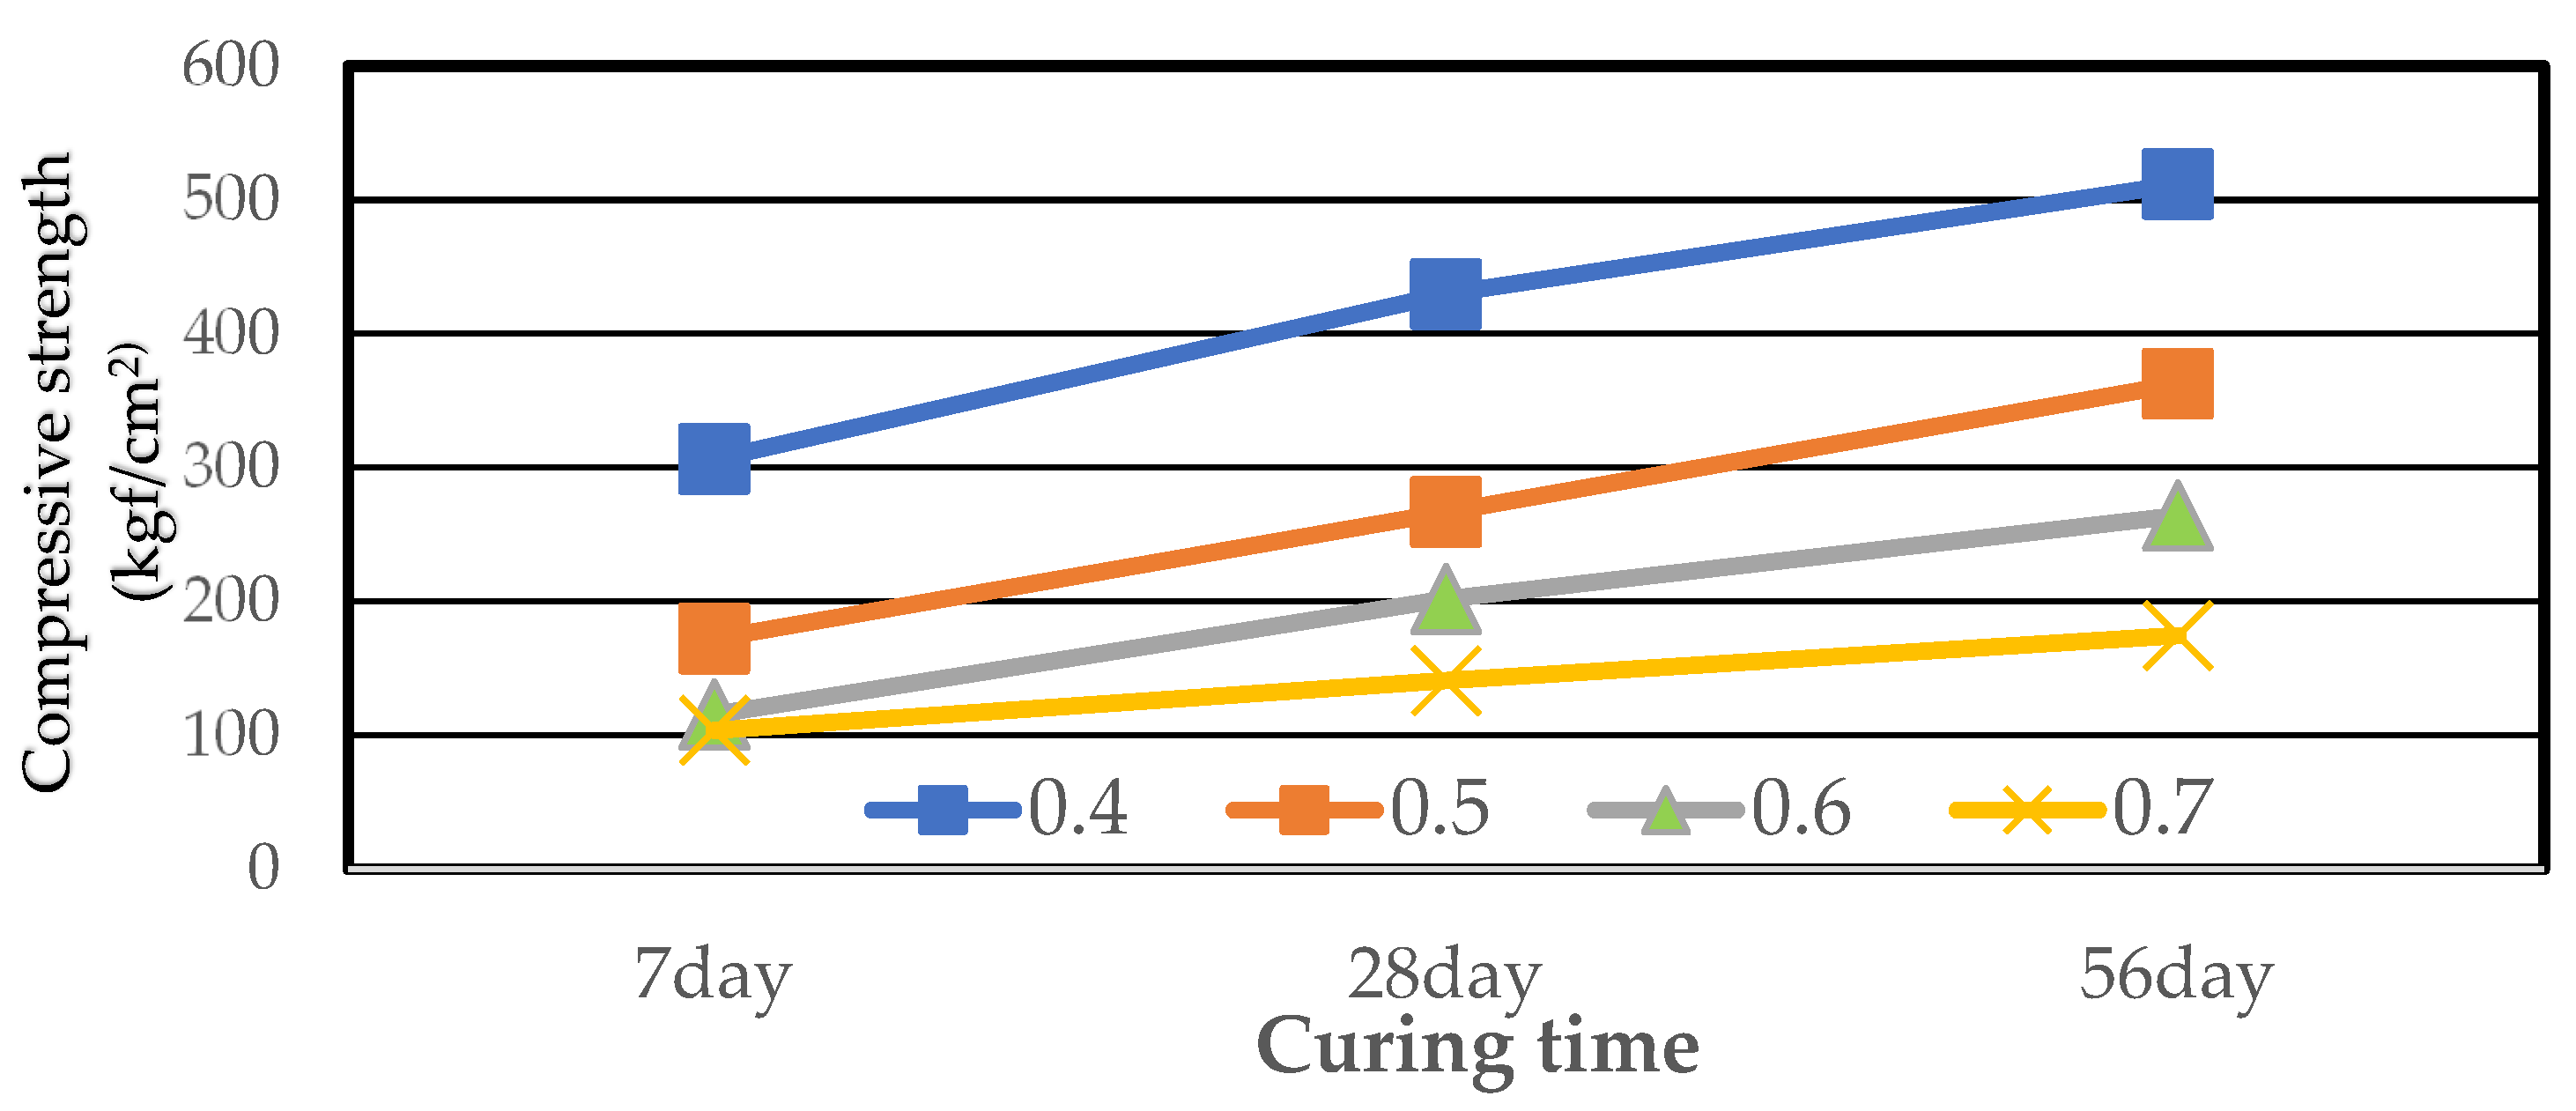
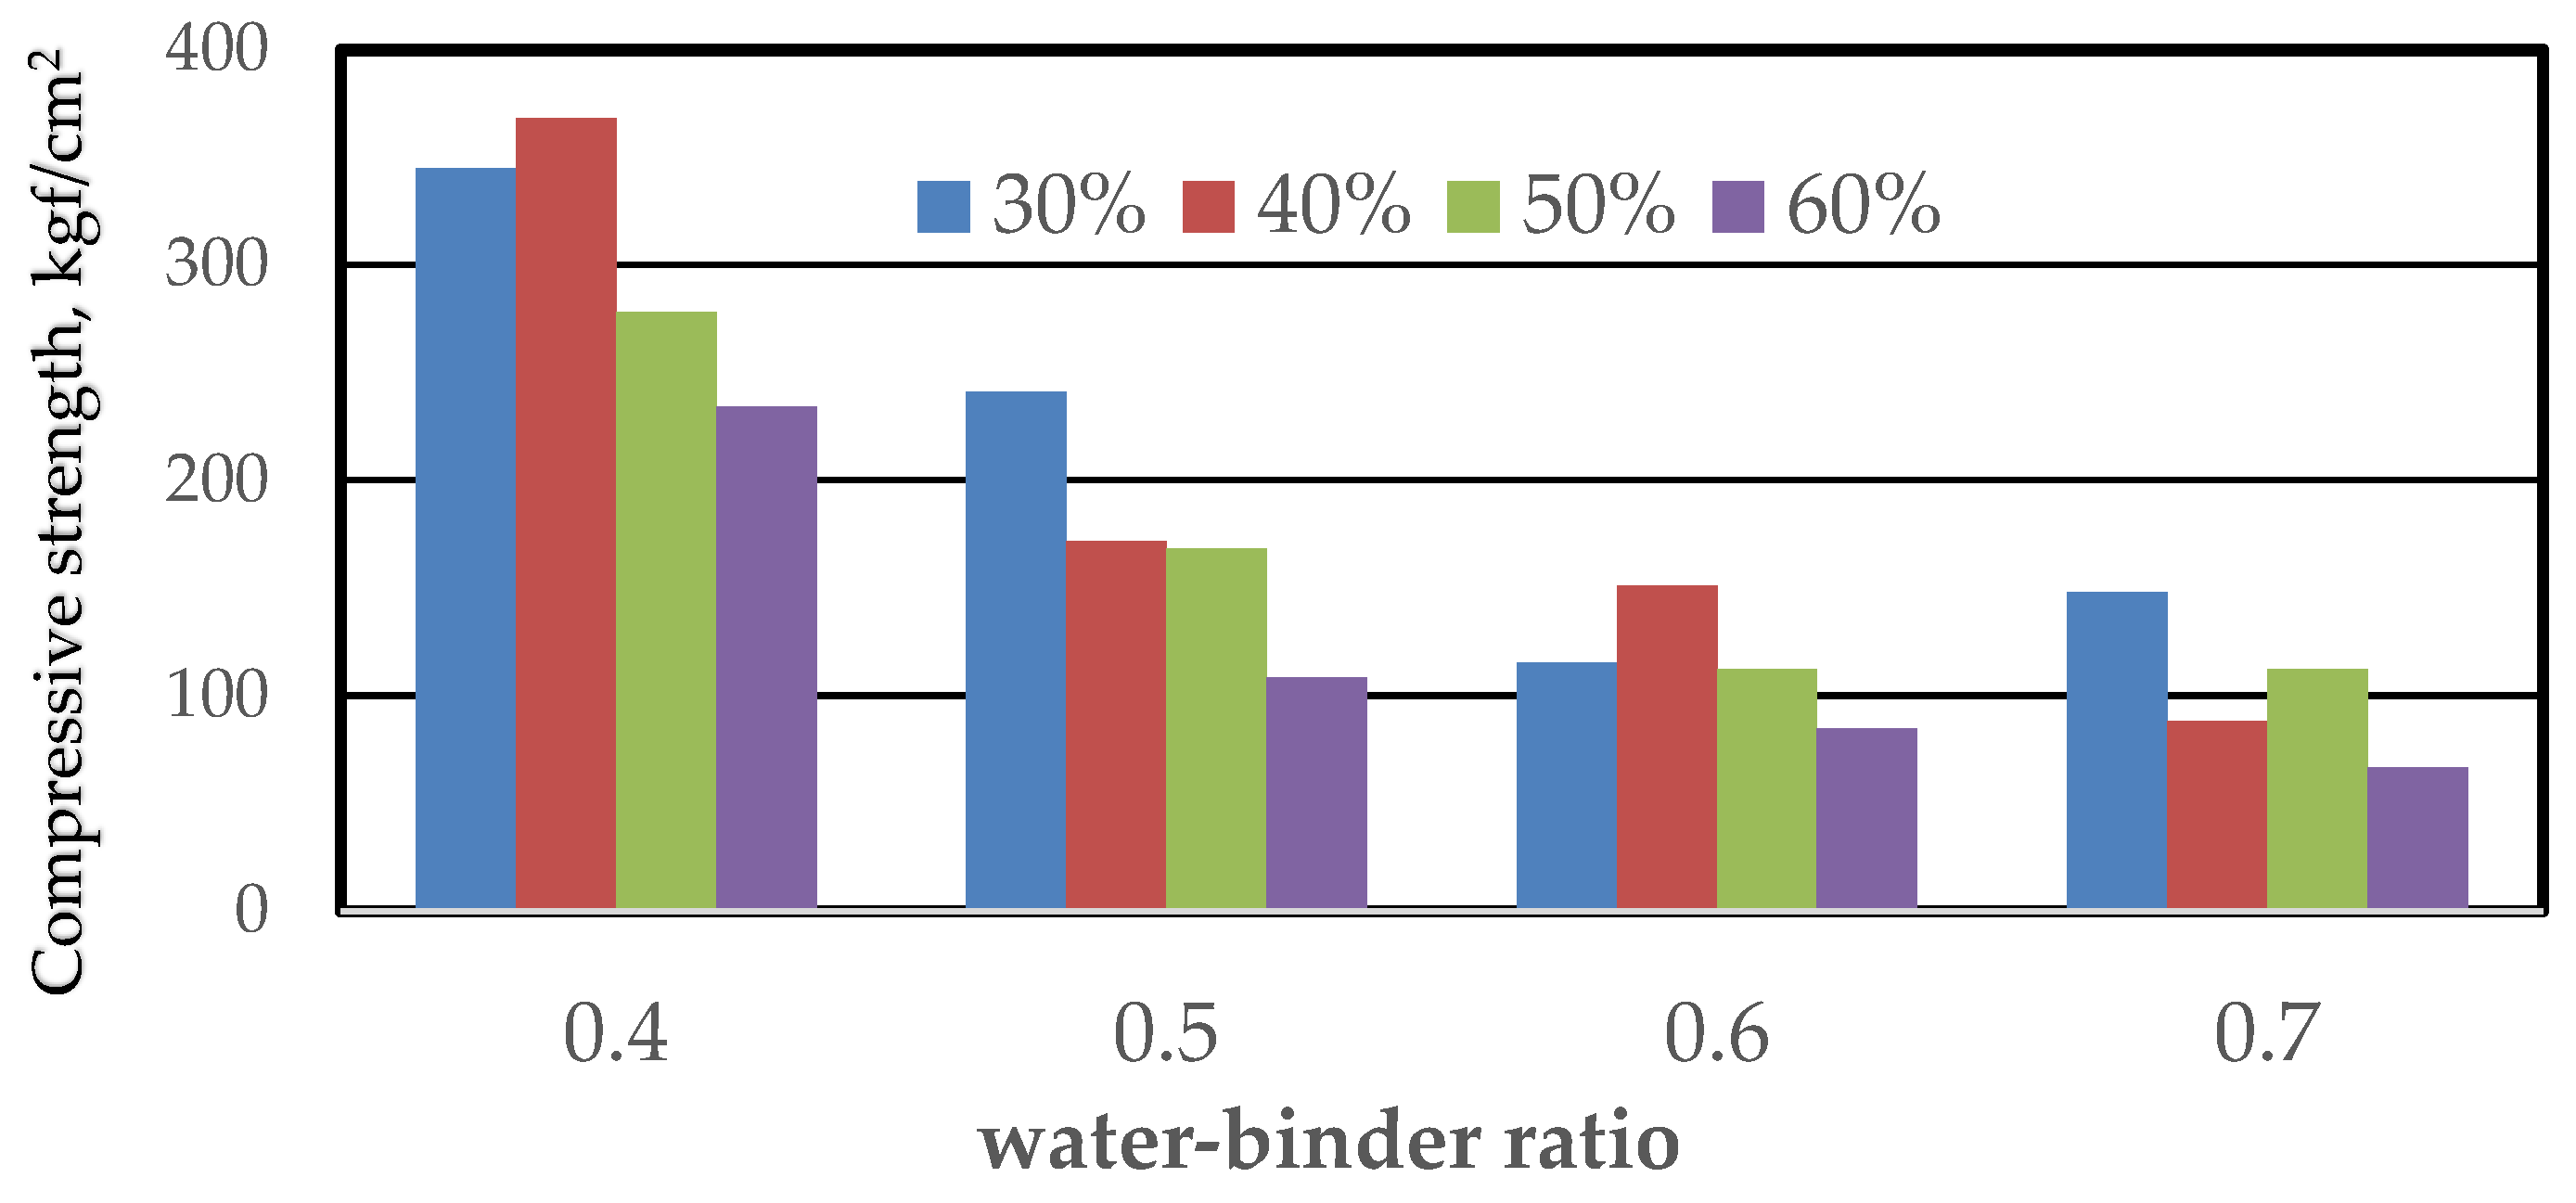
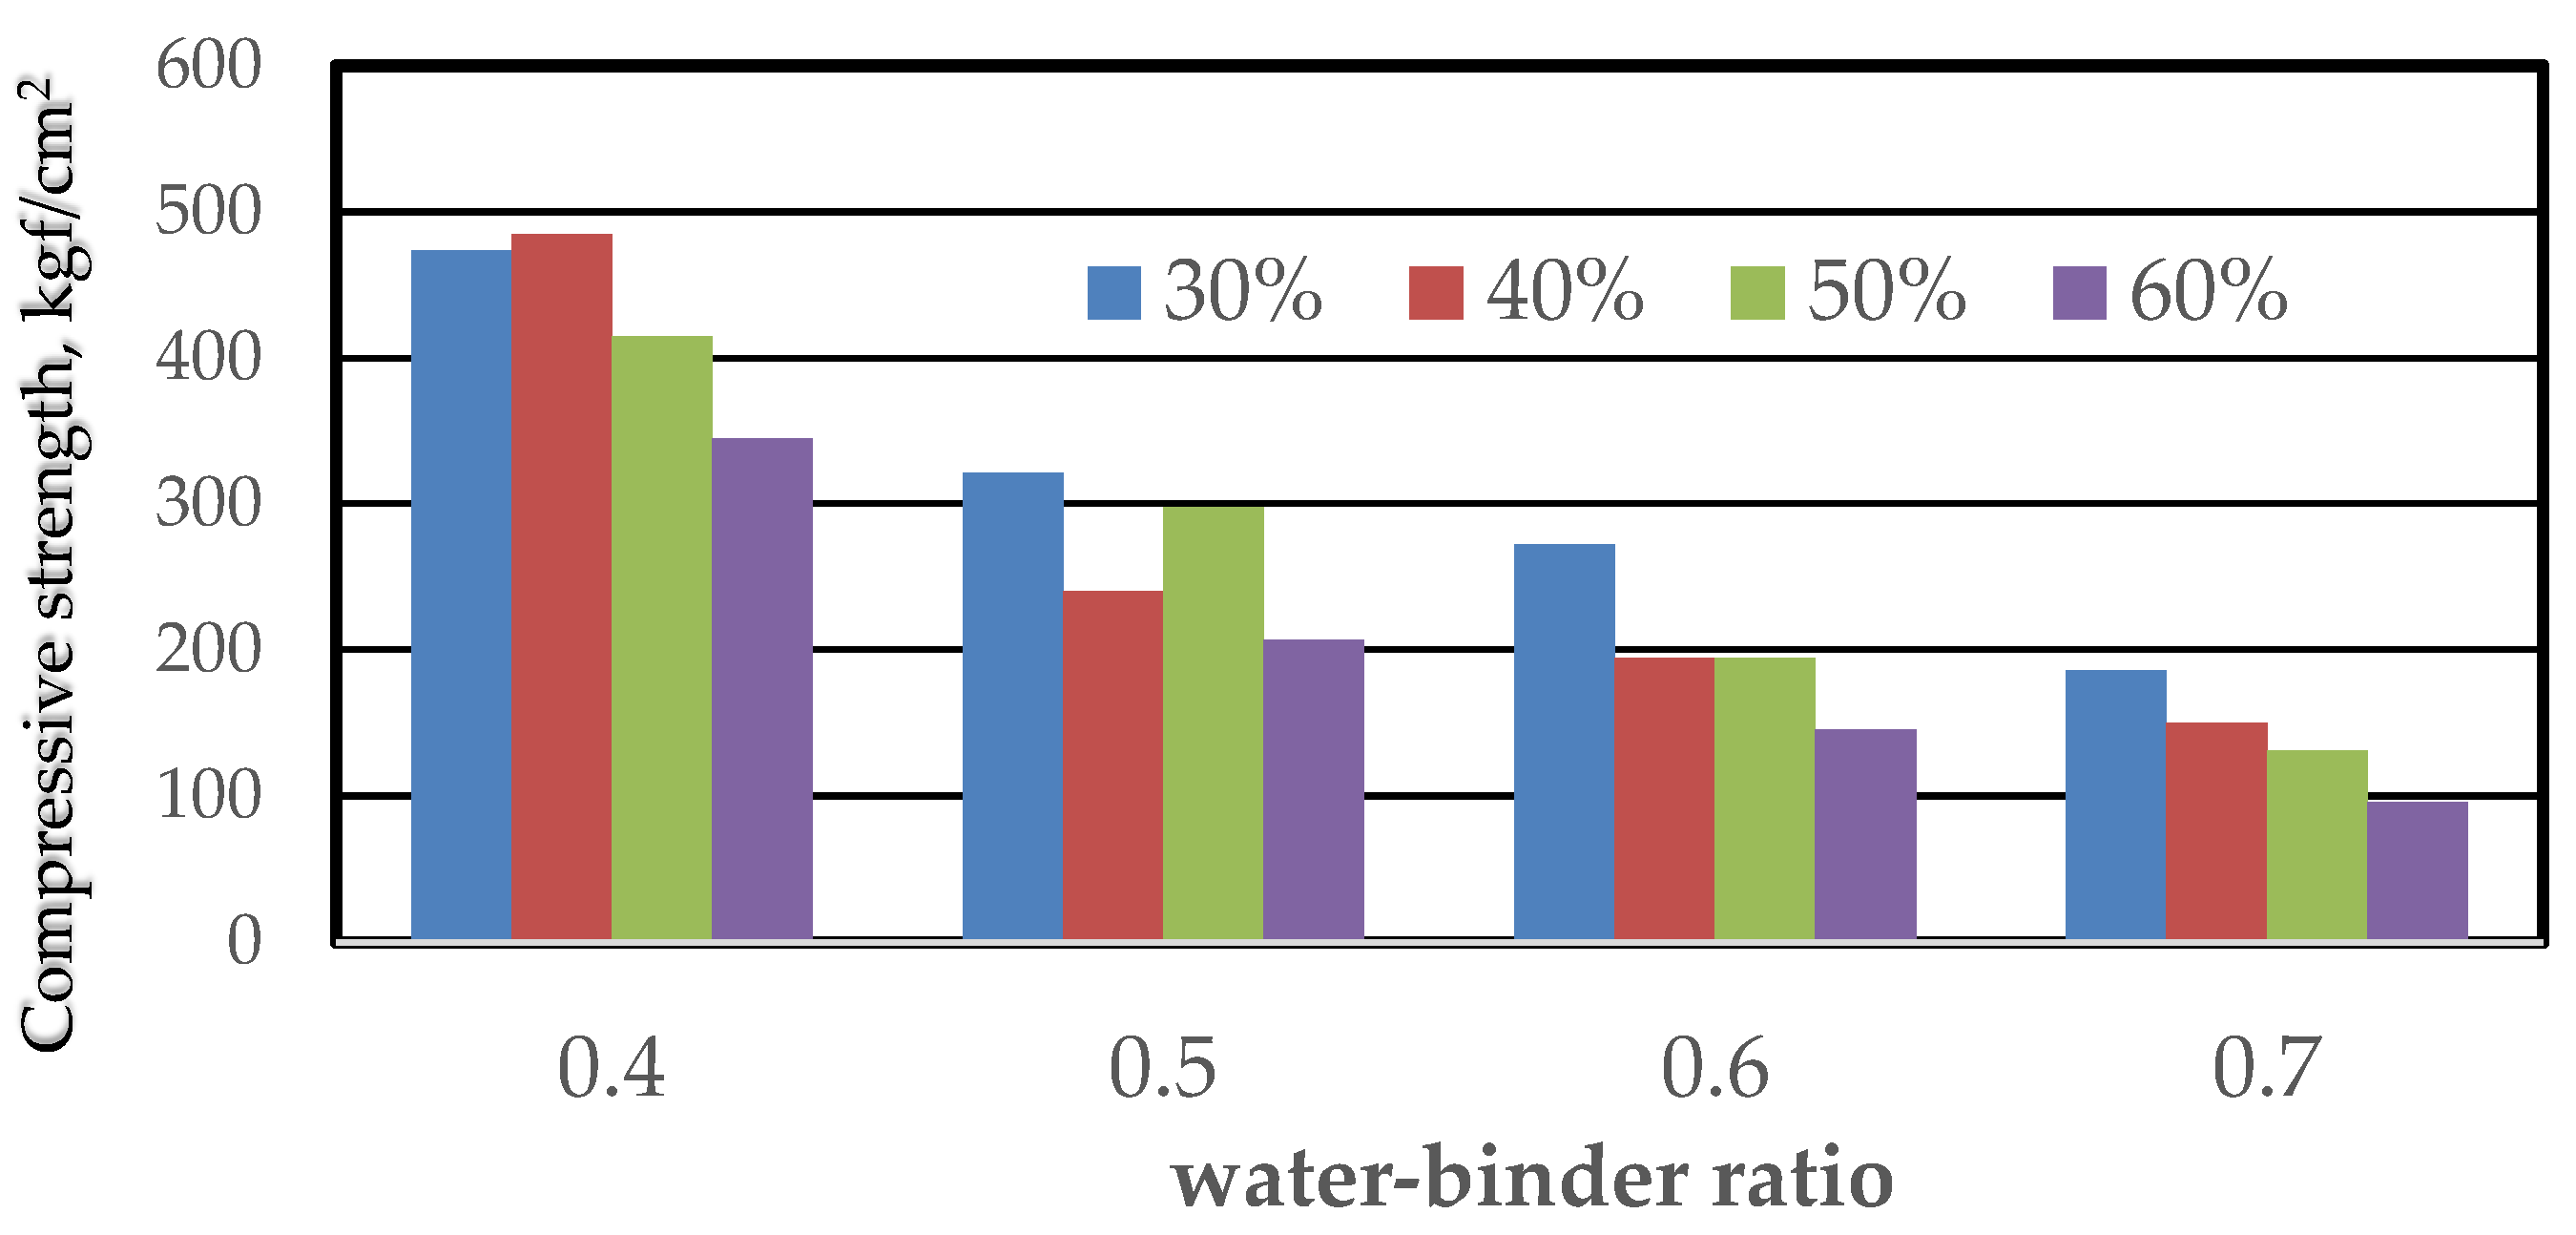
3.2. Compressive Strength Test

Compressive strength is a key property of RCC. We evaluated the compressive strength of RCC based on the water–cement ratio, sand ratio, coarse aggregate replacement with 8 mm stone, and fly ash replacement. The method used was CNS 1232, using cylindrical molds. The samples were tested at 7, 28, and 56 days using a universal testing machine to calculate compressive strength.

3.2.1. Water–Cement Ratio

The experiment was conducted for water–cement ratios of 0.4, 0.5, 0.6, and 0.7. A low ratio resulted in higher compressive strength (Figure 2). The ratio of 0.4 allowed for a target strength of 210 kgf/cm2 at 28 days, while the ratio of 0.5 turned out to be economical in terms of production costs. The ratio of 0.6 was also available for construction.

3.2.2. S/A

We experimented with sand ratios of 30, 32, 34, and 36%. The sand ratio of 32% enabled the best balance of strength and workability with a target strength of 210 kgf/cm2.

3.2.3. Coarse Aggregate Replacement with Stone Material

Coarse aggregates were replaced with stone materials with a size of 8 mm at rates of 30, 35, 40, and 45%. The replacement rate of 35% yielded the best results on the 56th day.

3.2.4. Fly Ash Replacement

RCC was tested with fly ash replacement rates of 30, 40, 50, and 60%. The replacement of 30% allowed for the highest early and late strength (Figure 3). Higher replacement rates slowed early strength development and showed little improvement in late strength. The mixture with a water–cement ratio of 0.5 and fly ash replacement ratio of 60% achieved a strength of 210 kgf/cm2 on the 56th day (Figure 4 and Figure 5).
RCC with fly ash uses less cement and more coarse aggregates, resulting in less energy consumption and CO2 emissions compared to OPC (Table 4). It offers better durability, lower maintenance needs, and a smaller carbon footprint. In contrast, OPC requires more cement and energy, emits more CO2 emissions, and requires frequent maintenance.

4. Summary

The mixing ratio for RCC was explored by adopting OPC rules in this study to achieve zero slump and using the roller. Fly ash turned out to be able to replace conventional materials to improve strength, reduce hydration heat, and lower production costs while minimizing cracking. Aggregate particle sizes were selected to ensure a dense gradation, and the S/A ratio and VC value were adjusted for quality control. The water–cement ratio, S/A ratio, coarse aggregates, and fly ash replacement improved RCC’s properties and compressive strength. The highest strength was achieved with a water–cement ratio of 0.4, S/A ratio of 32%, coarse aggregate replacement ratio of 35%, and fly ash content of 30%. The ratio allows for the most economical result and makes RCC appropriate for high-strength applications.
For a 28-day target strength of 210 kgf/cm2, the best mixture is made with a water–cement ratio of 0.5 or 0.6 and a fly ash content of 30 or 60%. This mixture saves 5% of the production costs. On the 56th day, all mixtures showed a higher strength than 140 kgf/cm2, with the highest strength achieved by water–cement ratios of 0.5 and 0.6. A water–cement ratio of 0.4 achieved 581 kgf/cm2, which is appropriate for early strength and special structures. When replaced with 60% fly ash, the production costs were lowest. The VC values served as a useful reference for evaluating the workability of RCC for roller compaction operations.

Author Contributions

Conceptualization, H.-J.C.; methodology, H.-J.C.; software, validation, S.-F.C.; formal analysis, S.-F.C.; investigation, H.-J.C.; resources, data curation, writing—original draft, preparation, S.-F.C.; writing—review and editing, visualization, supervision, project administration, M.-G.L.; funding acquisition, M.-G.L. All authors have read and agreed to the published version of the manuscript.

Funding

This research received no external funding.

Institutional Review Board Statement

Not applicable.

Informed Consent Statement

Not applicable.

Data Availability Statement

We will ensure that the Data Availability Statement is provided accordingly.

Conflicts of Interest

The authors declare no conflict of interest.

References

  1. Mehta, P.K.; Monteiro, P.J.M. Concrete: Microstructure, Properties, and Materials, 4th ed.McGraw-Hill Education: New York, NY, USA, 2014. [Google Scholar]
  2. Report on Roller-Compacted Mass Concrete; ACI 207.5R-11; American Concrete Institute: Farmington Hills, MI, USA, 2011.
  3. Portland Cement Association. Roller-Compacted Concrete for Dams; Portland Cement Association: Skokie, IL, USA, 2009. [Google Scholar]
  4. Abdel-Halim, M.A.; Al-Omari, M.A.; Iskender, M.M. Rehabilitation of the Spillway of Sama EI—Serhan Dam in Jordan, Using RCC. Eng. Struct. 1999, 21, 497–506. [Google Scholar] [CrossRef]
  5. Selvam, M.; Debbarma, S.; Singh, S.; Shi, X. Utilization of alternative aggregates for roller compacted concrete pavements—A state-of-the-art review. Constr. Build. Mater. 2022, 317, 125838. [Google Scholar] [CrossRef]
  6. Macias, A. RCC (RCC) for Pavement Construction. Concr. Int. 2011, 33, 37–42. [Google Scholar]
  7. Meyer, C. RCC: Design and Construction; ASCE Press Collection: Reston, VA, USA, 2006. [Google Scholar]
  8. Saluja, S.; Kaur, K.; Goyal, S. Achievement of RCC Incorporating GGBS by Using Soil Compaction Approach. In Lecture Notes in Civil Engineering; Springer: Singapore, 2024; Volume 371. [Google Scholar]
  9. State-of-the-Art Report on Roller-Compacted Concrete Pavements; ACI 325.10R; American Concrete Institute: Farmington Hills, MI, USA, 2011.
  10. Guide to Roller-Compacted Concrete Pavements; ACI 327R-14; American Concrete Institute: Farmington Hills, MI, USA, 2015.
  11. Hesami, S.; Modarres, A.; Soltaninejad, M.; Madani, H. Mechanical properties of RCC pavement containing coal waste and lime stone powder as partial replacement of cement. Constr. Build. Mater. 2016, 111, 625–636. [Google Scholar] [CrossRef]
Figure 1. VC values of 16 mixes measured by VB consistency test.
Engproc 91 00005 g001
Figure 2. Relationship between water–binder ratio and compressive strength of RCC.
Engproc 91 00005 g002
Figure 3. Relationship between fly ash replacement rate and compressive strength on 7th day.
Engproc 91 00005 g003
Figure 4. Relationship between fly ash replacement rate and compressive strength on 28th day.
Engproc 91 00005 g004
Figure 5. Relationship between fly ash replacement rate and compressive strength on 56th day.
Engproc 91 00005 g005
Table 1. Consistency and workability of different types of concrete.
KERRYPNXPropertySlump (mm)VC Value (s)
RCCExtremely Dry18–32
Very Dry and Hard10–18
Dry and Hard0–255–10
OPCStiff Plastic25–503–5
Plastic75–1000–3
Flowable150–175
Table 2. Grading range of RCCD and RCCP.
Sieve NumberPassing Percentage (%)
RCC DamRCC PavementOPC
3 in98–100
2 ½ in98–99
2 in86–96
1 ½ in75–90
1 in63–77
¾ in56–69100
3/8 in43–5360–85100
No.433–4340–6095–100
No.825–3535–5580–100
No.1619–2920–4050–85
No.3014–2415–3525–60
No.5020–188–2010–30
No.1006–136–182–10
No.2004–102–8
Table 3. Mixing ratio of RCC mixtures (kg/m3).
No.W/CWaterCementFly AshStone1Stone2Stone3Sand
10.4012021090477477409584
2180120428428460619
3150150381381507654
4120180336336550687
50.5012014496419419559598
646872375375613642
796144456456391671
8120120413413445715
90.60120100100390390638608
1080120412412549646
1114060438438472695
1212080456456391733
130.7012068103466466502615
148586490490420658
1510269375375613702
1612051398398530746
Table 4. Comparison between RCC and ordinary Portland cement (OPC).
TypeRCCOPC
Aggregate SizeUses more coarse aggregates with less surface area, requiring less cement.
Requires less cement (about 10–20% less), with similar water–cement ratio.
Reduced mixing and transport time, less vibration during compaction, lower energy consumption.
Lower CO2 emissions due to less cement usage (approximately 10–15% reduction).
Longer lifespan, lower maintenance frequency, less need for repairs.
Can further reduce CO2 emissions through alternative materials like fly ash and slag.
Lower carbon footprint, especially when cement usage is reduced.
Uses more fine aggregates, requiring more cement.
Cement UsageUses more cement.
Energy Consumption
in Production
Requires more mixing, transport, and vibration, resulting in higher energy consumption.
CO2 EmissionsHigher CO2 emissions due to greater cement demand.
Durability of ConstructionHigher maintenance frequency, more indirect energy consumption.
Potential for Carbon
Emission Reduction
Overall Carbon Footprint
Although alternative materials are used, CO2 emissions are harder to significantly reduce.
Higher carbon footprint due to high cement consumption.
Disclaimer/Publisher’s Note: The statements, opinions and data contained in all publications are solely those of the individual author(s) and contributor(s) and not of MDPI and/or the editor(s). MDPI and/or the editor(s) disclaim responsibility for any injury to people or property resulting from any ideas, methods, instructions or products referred to in the content.

