
Planning and Strategies for Expansion of Irrigation Services in Mountainous Areas: A Case Study of Nantou County in Taiwan †

 ,
, 
Abstract
1. Introduction
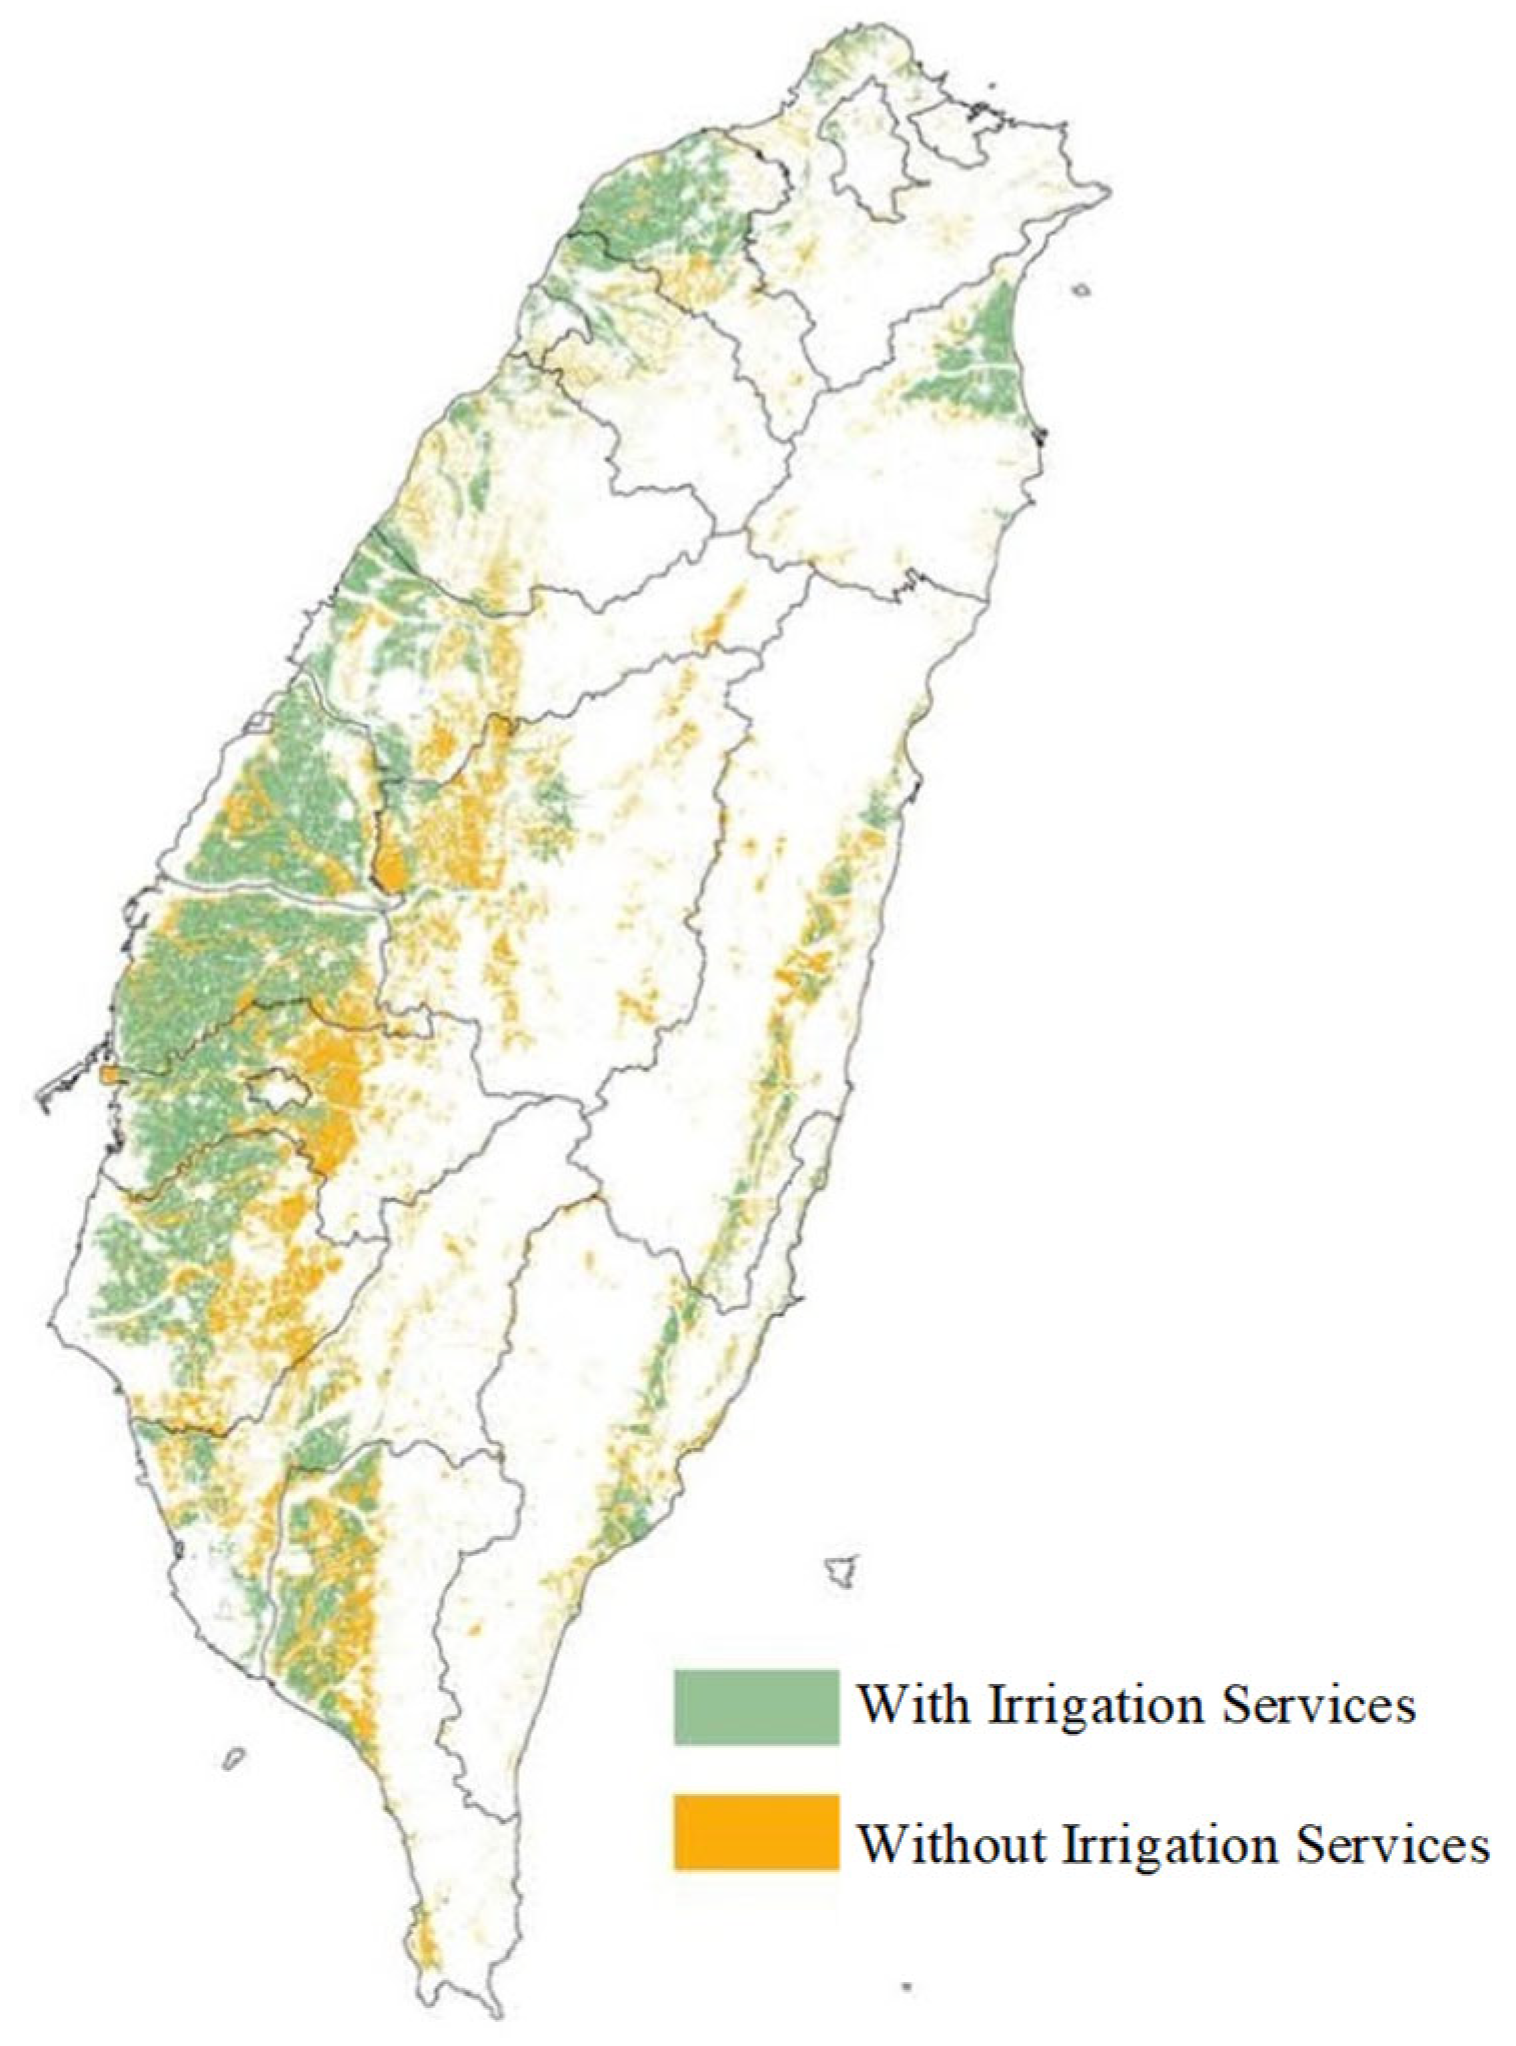
Expansion of Irrigation Services
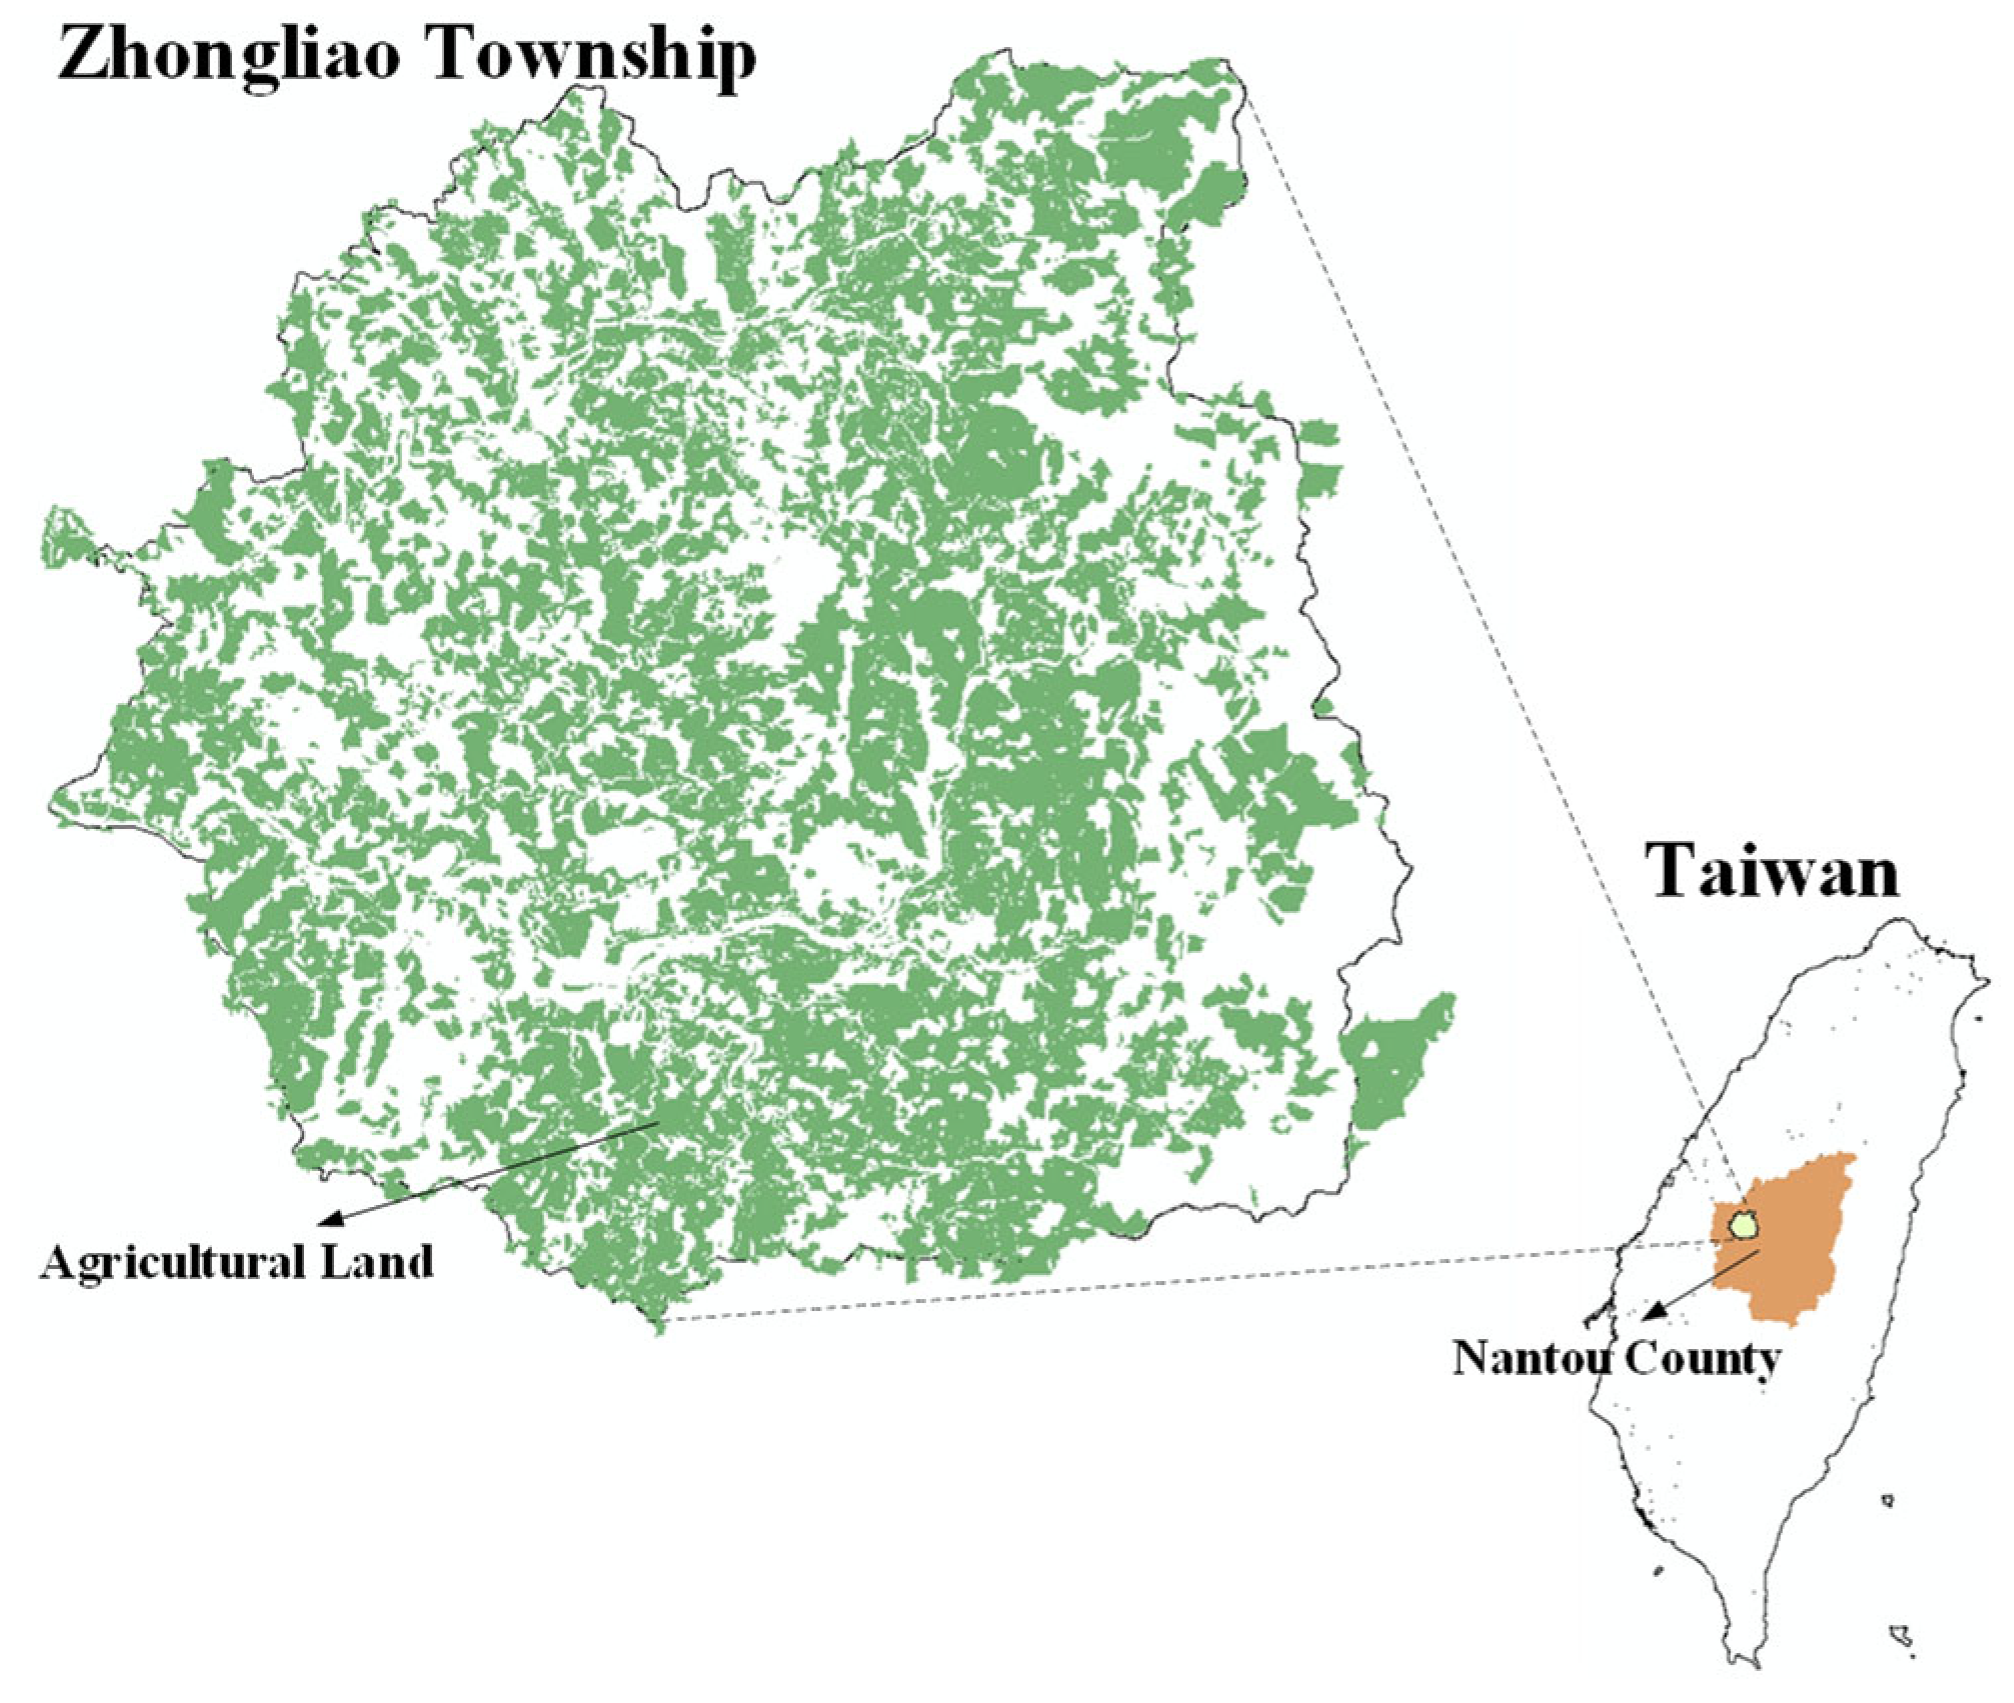
2. Study Area
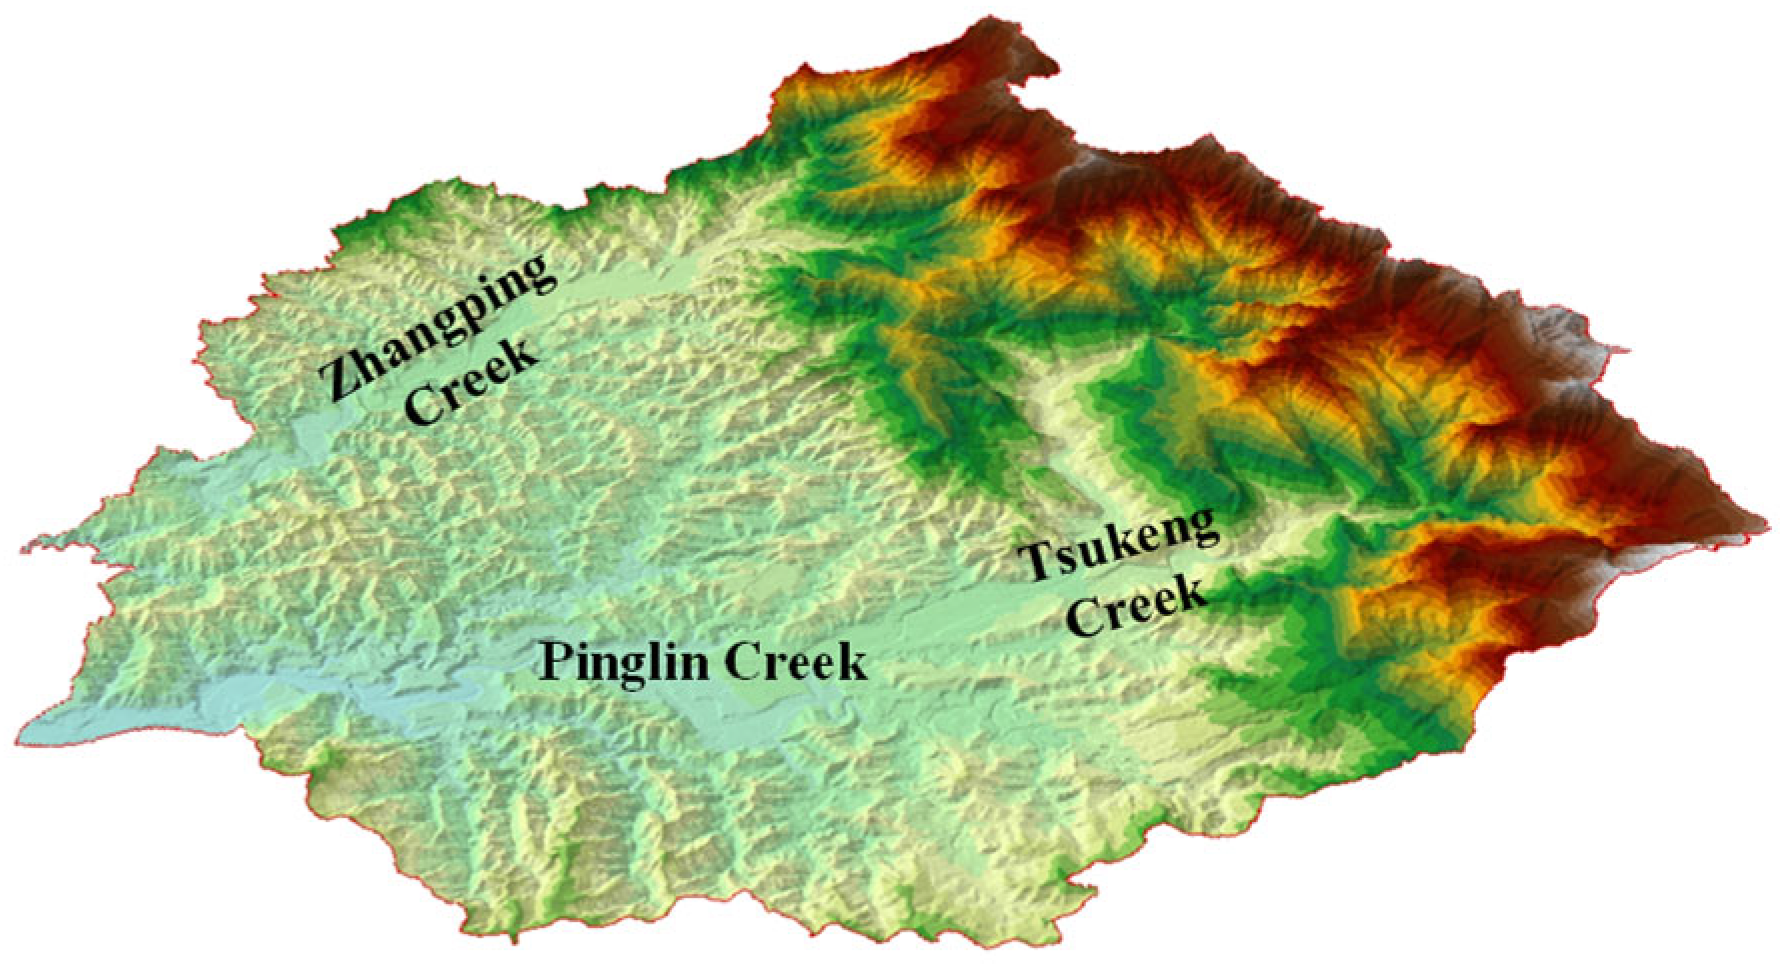
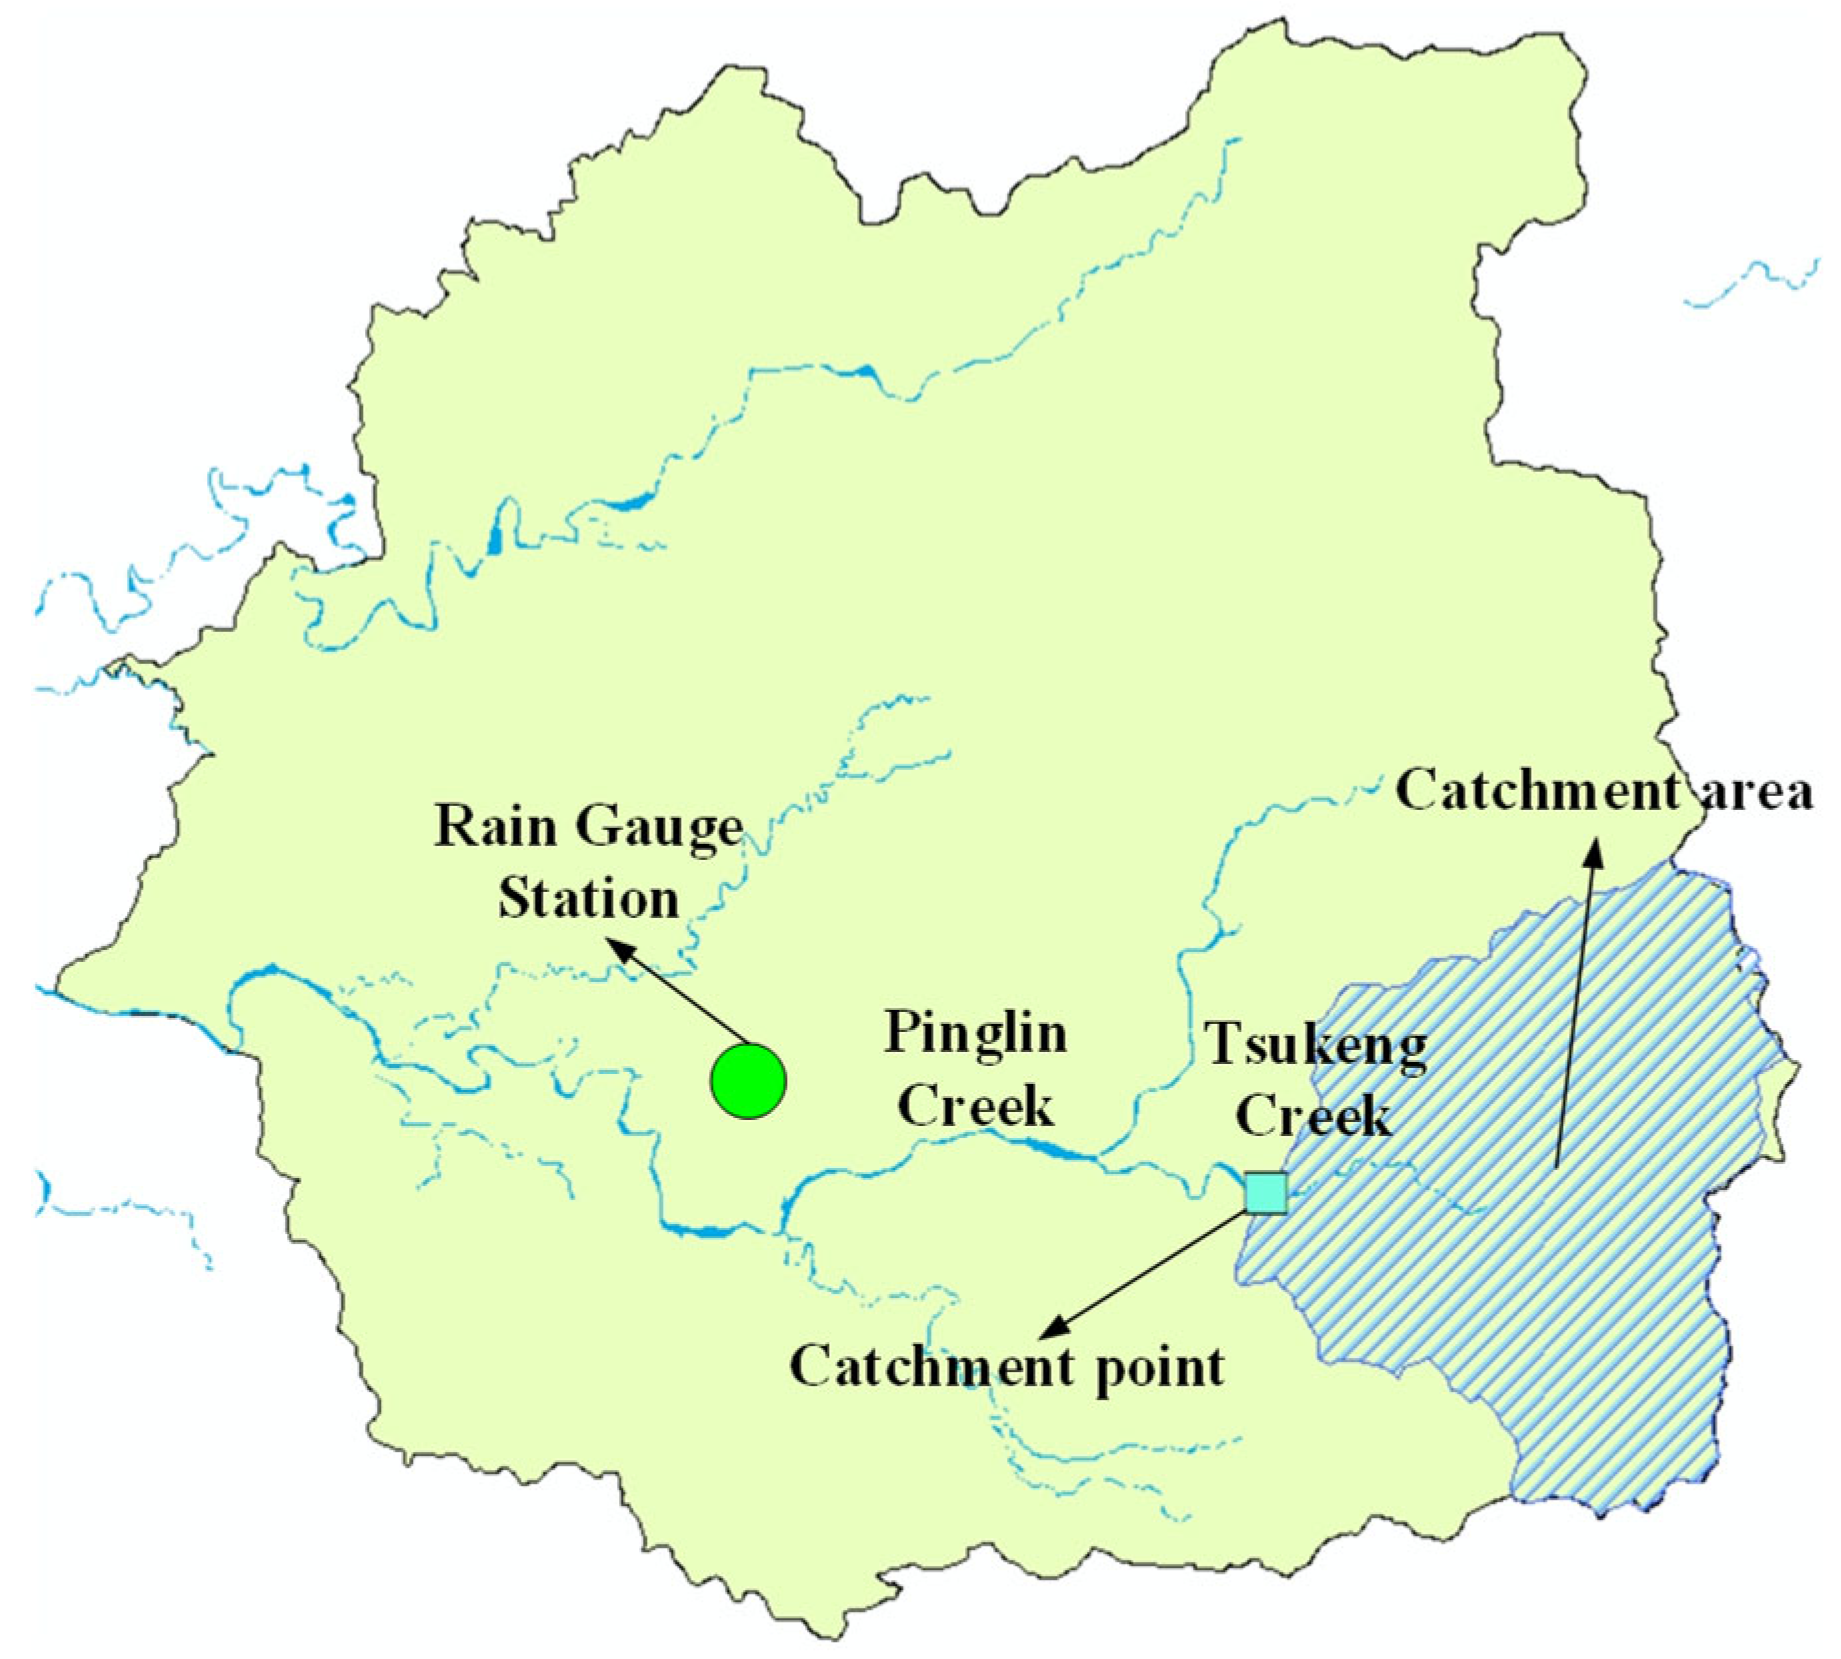
2.1. Geographic and Hydrological Characteristics of the Study Area
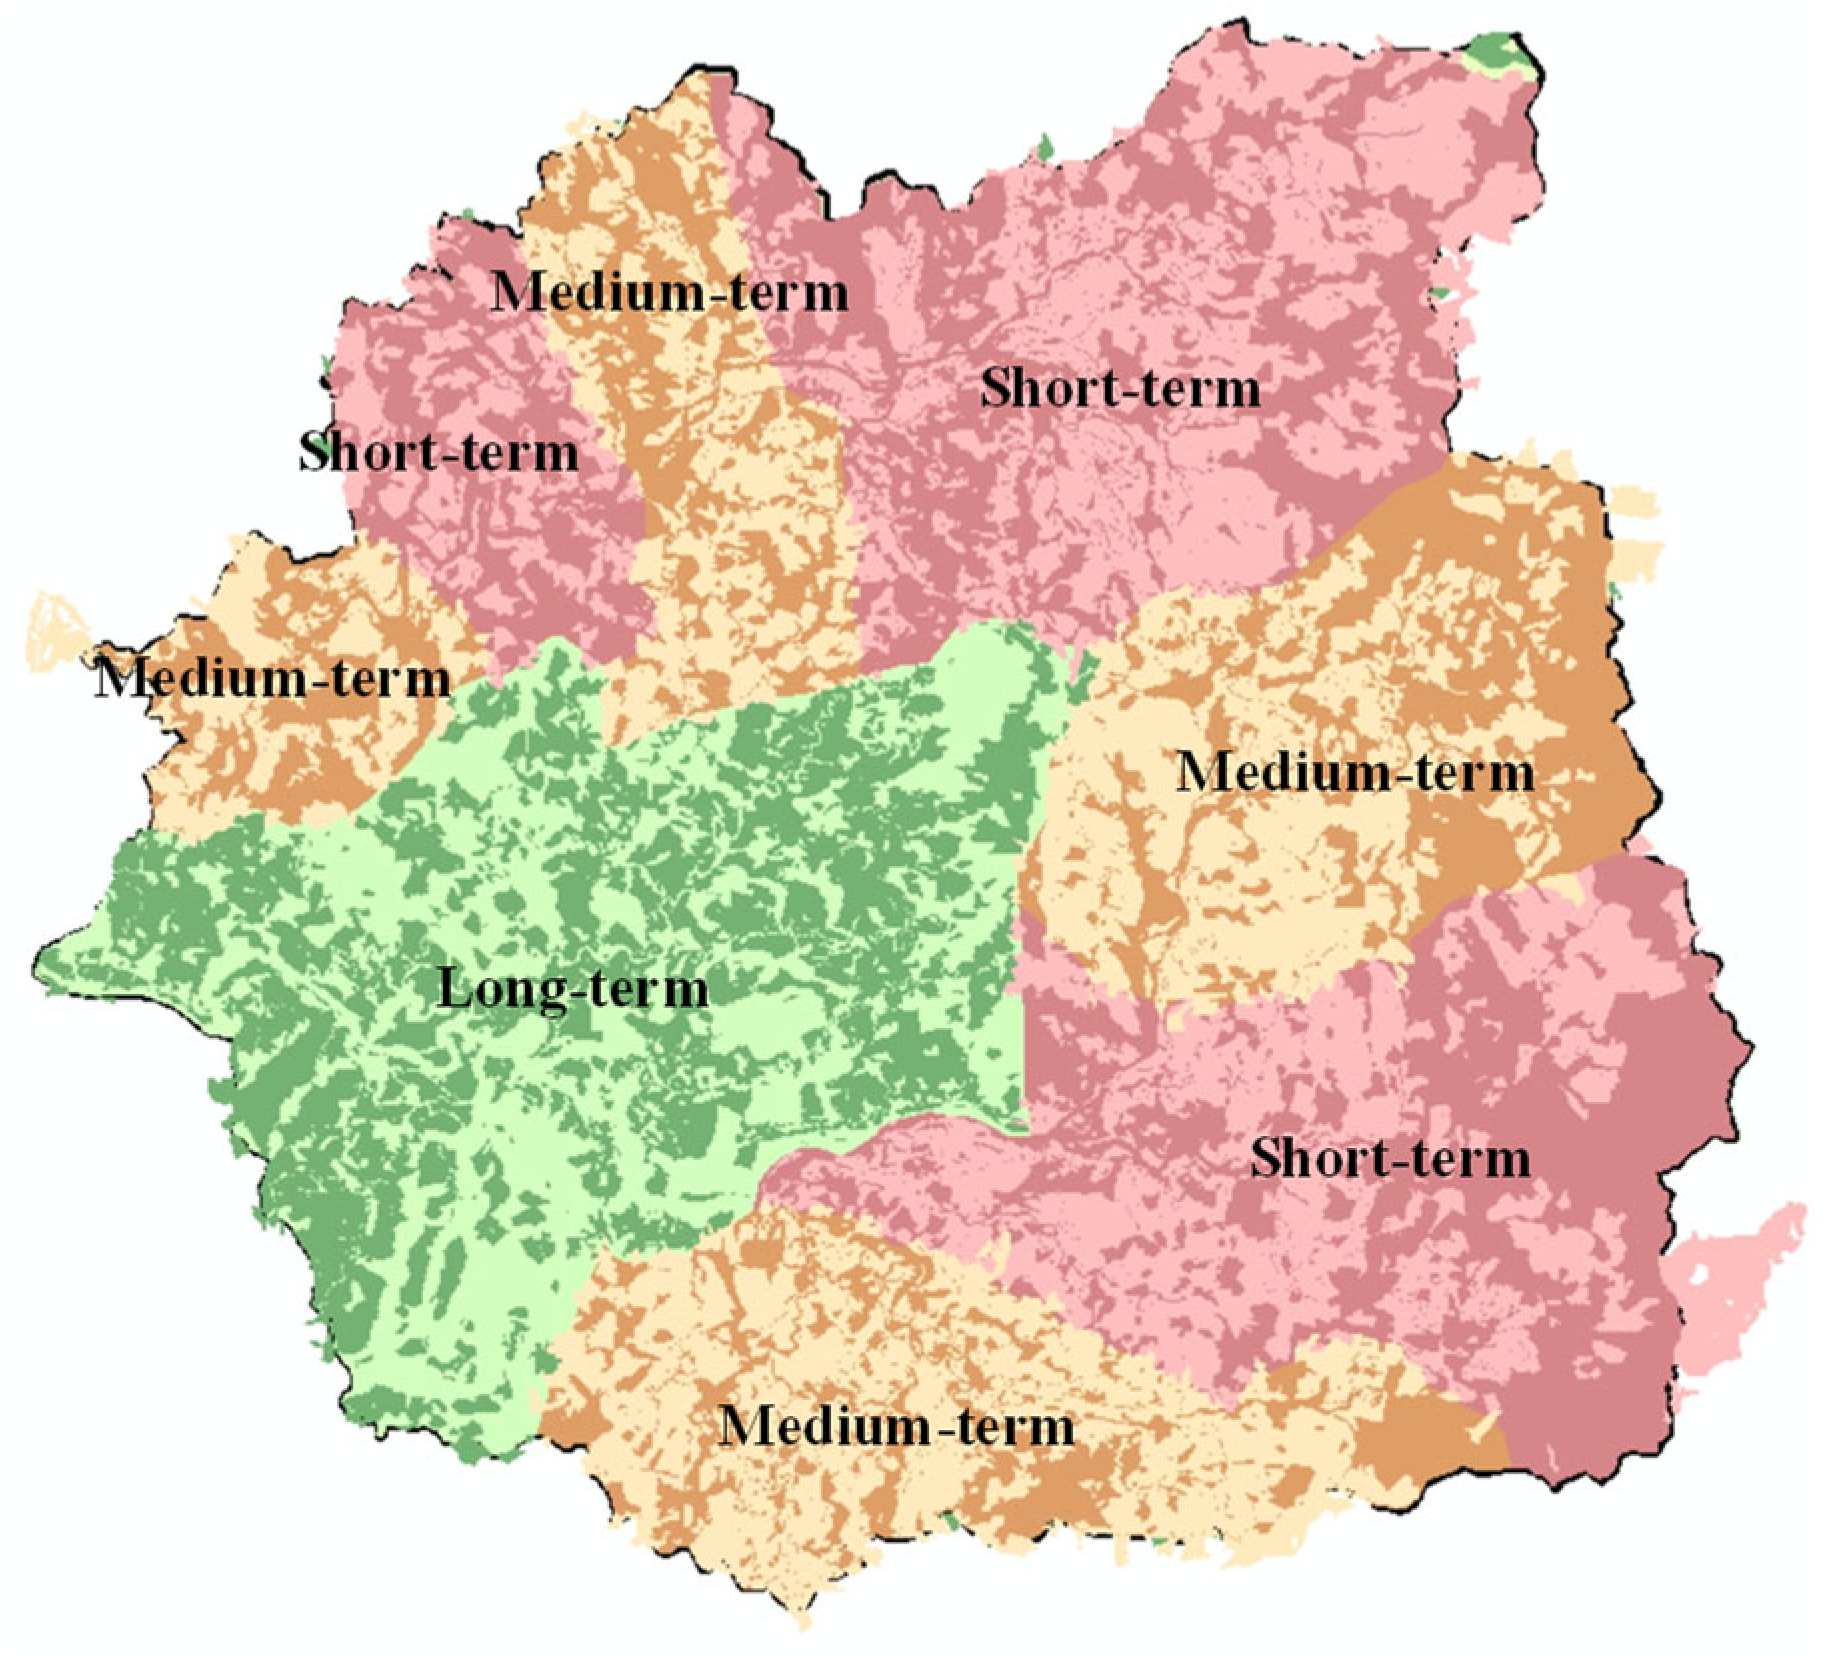
2.2. Planning and Phased Implementation
3. Potential Water Sources and Supply Capacity
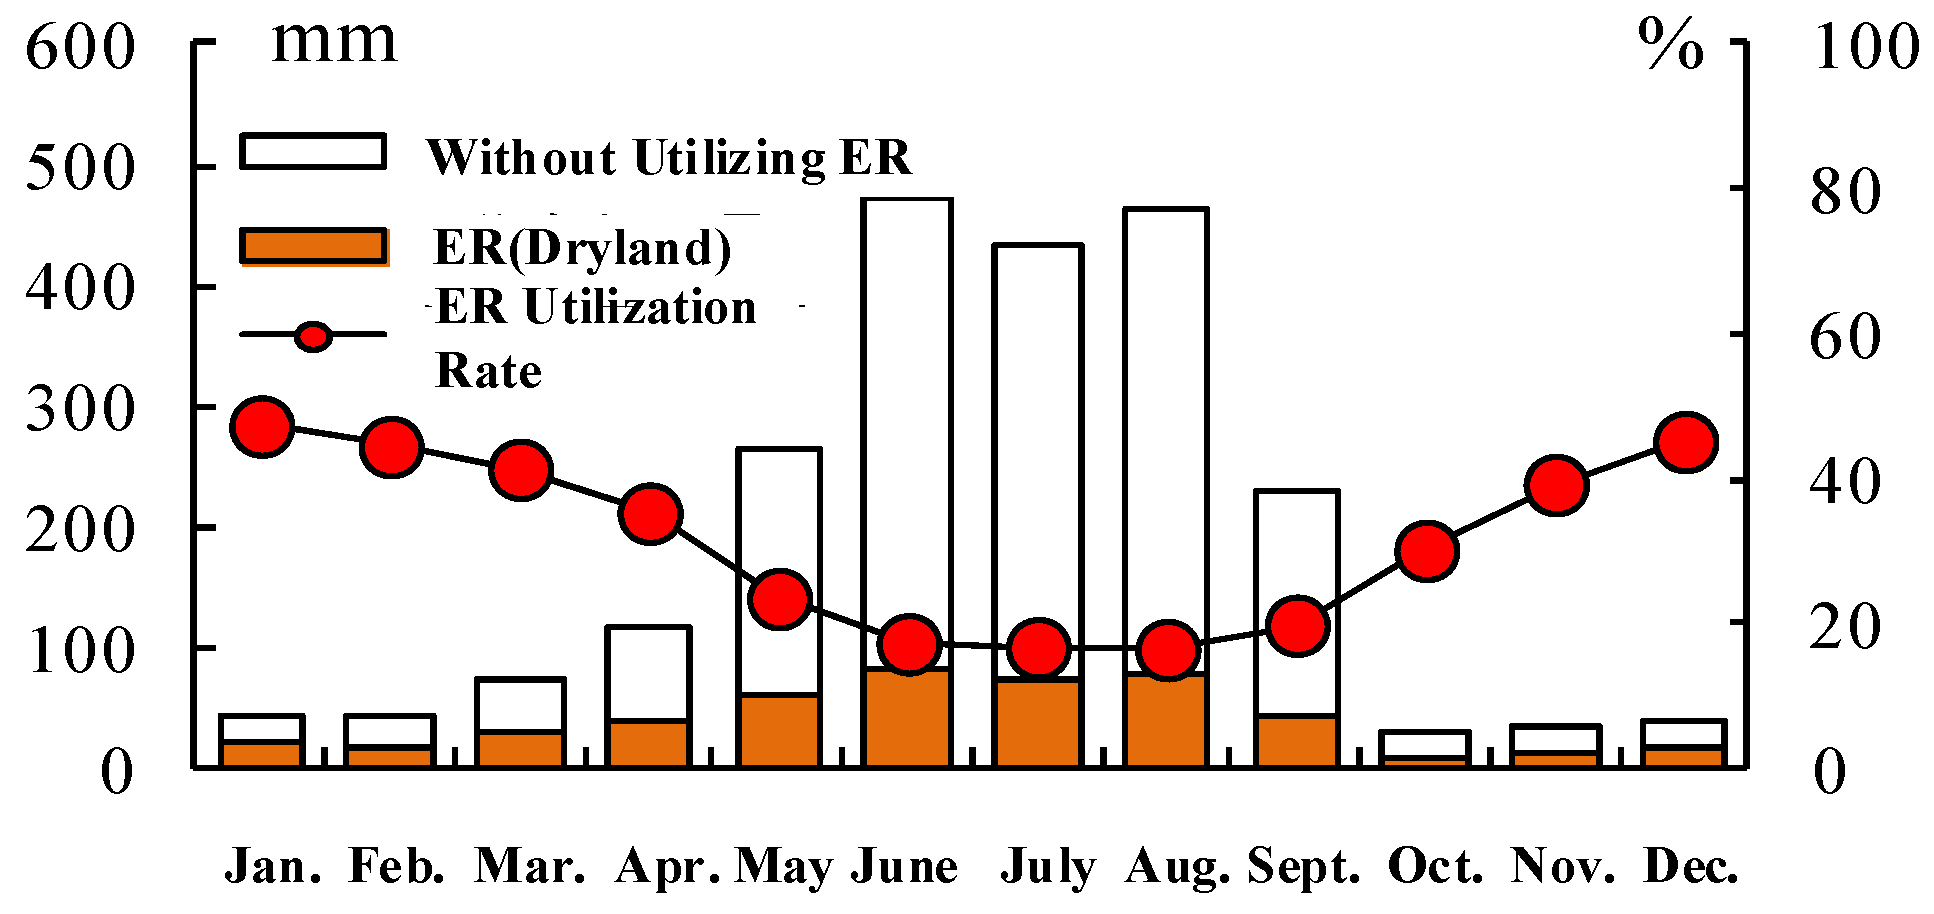
3.1. Assessment of Potential Surface Water
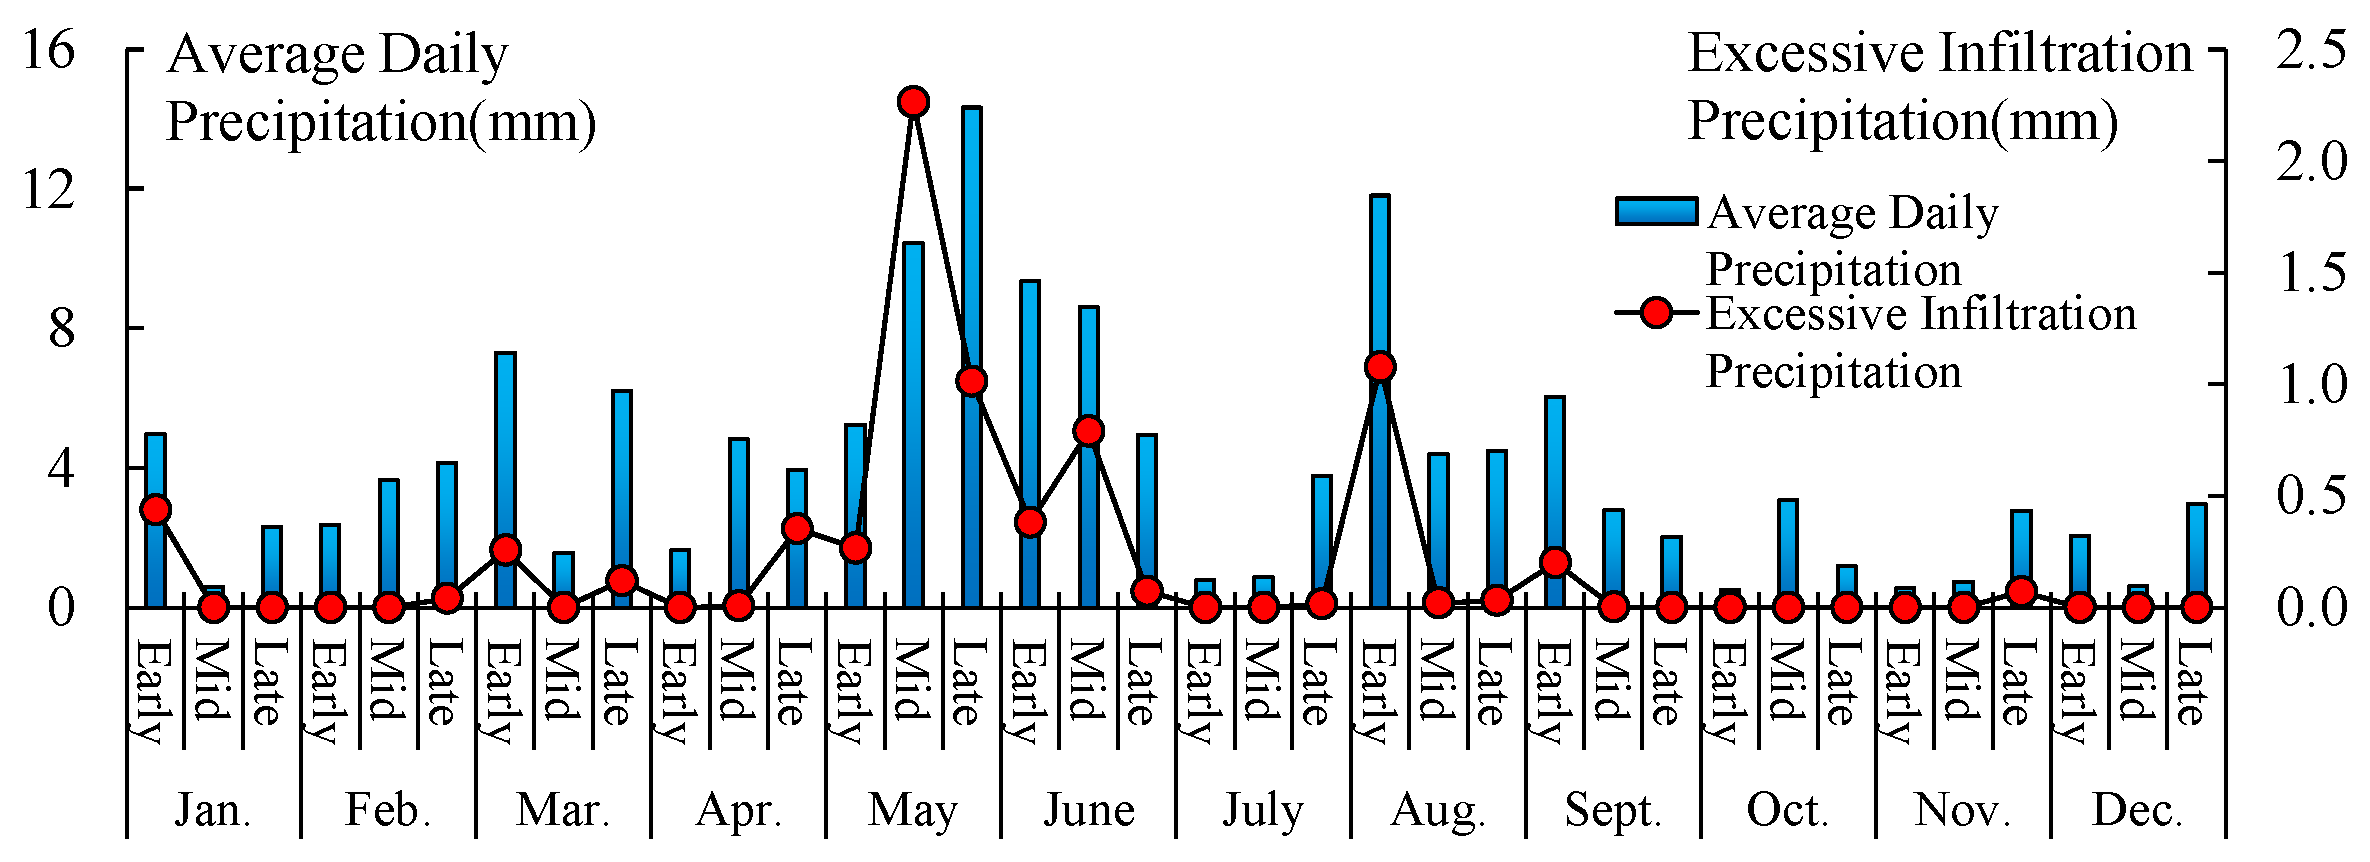
3.2. Precipitation Potential
3.3. Other Potential Water Resources
4. Water Requirement Analysis
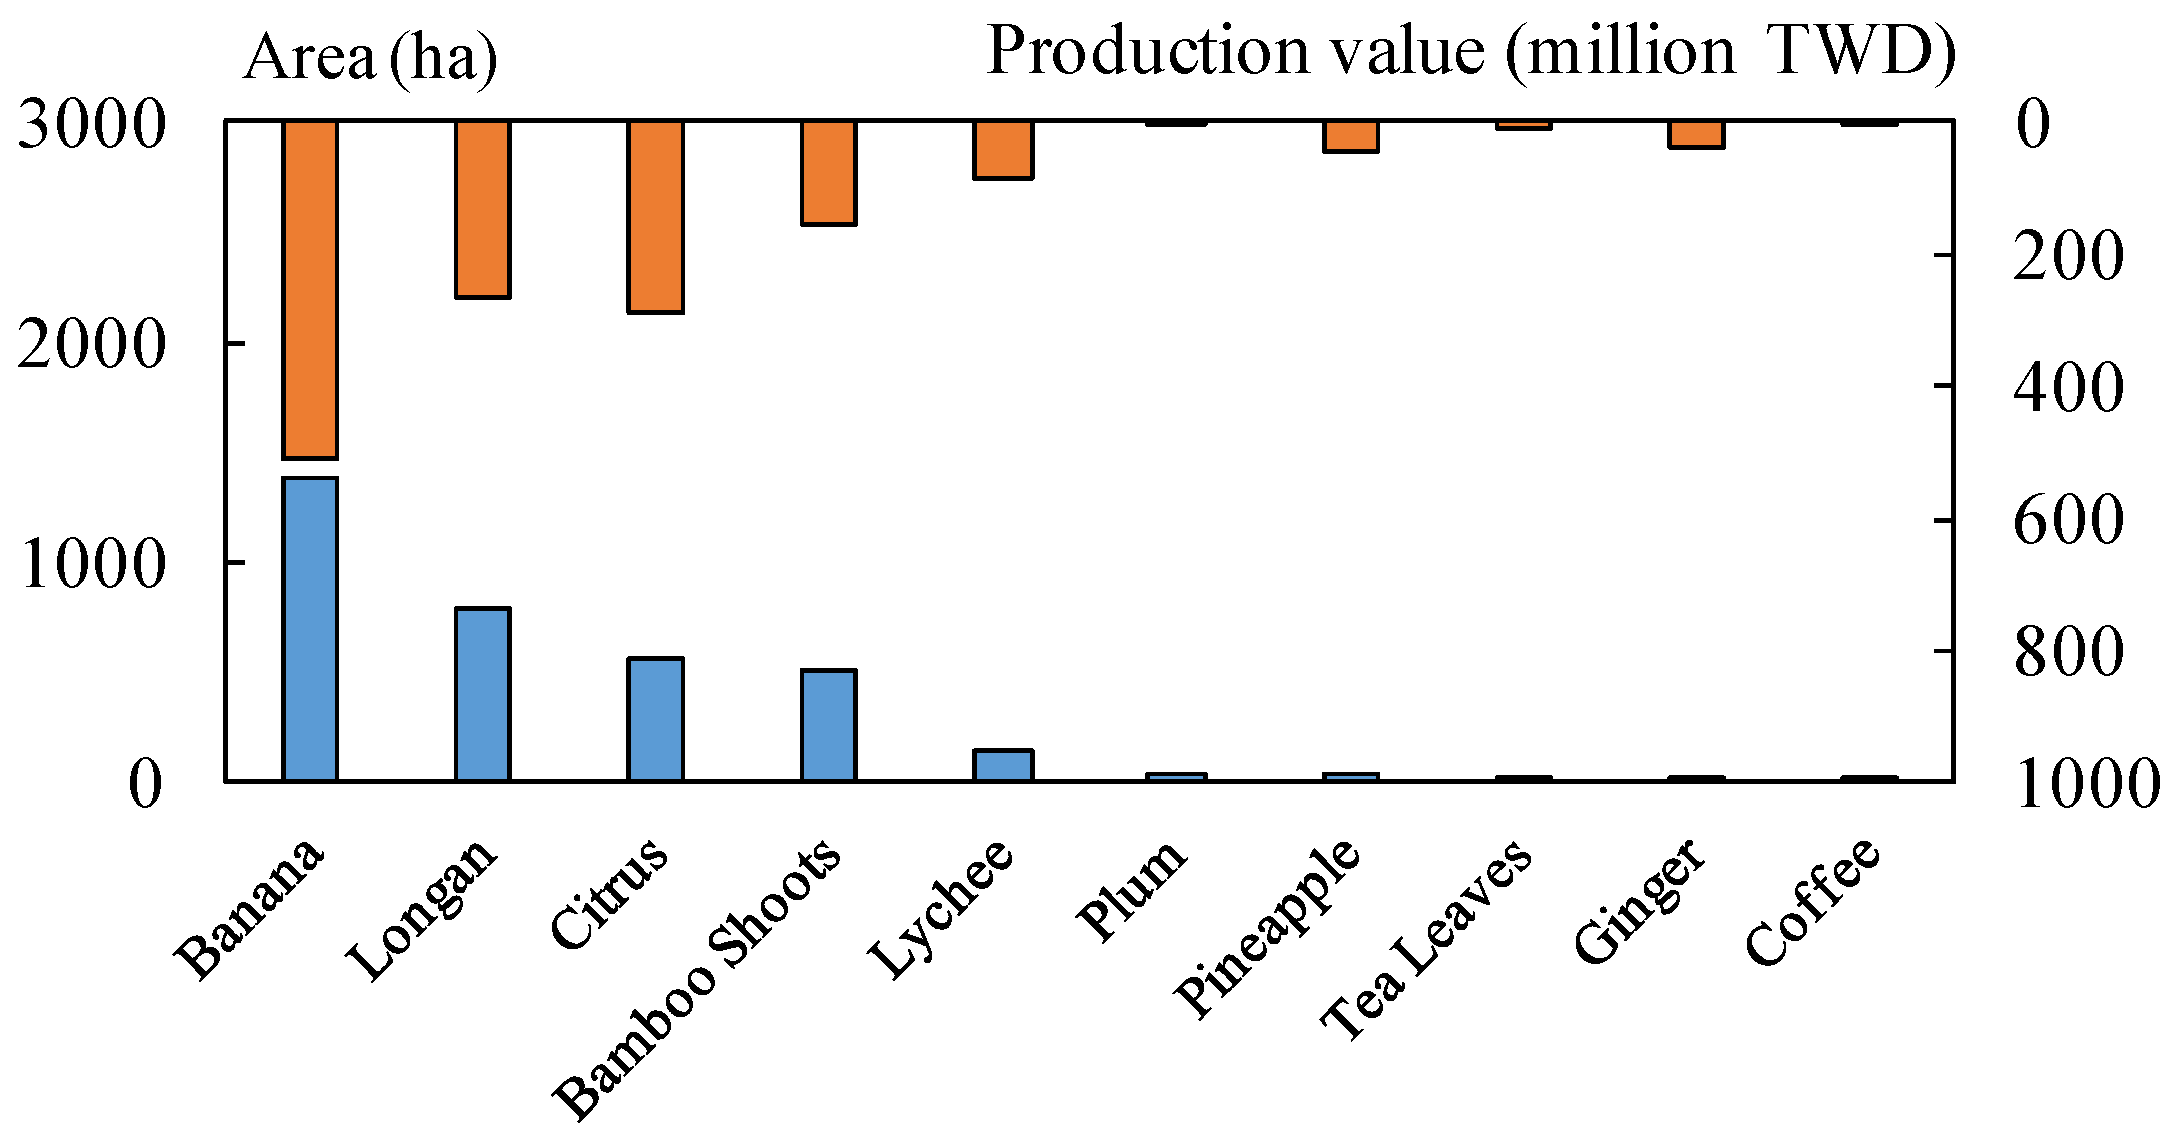
Crop Water Requirements
5. Reliability Analysis of Water Supply and Demand
5.1. Exceedance Probability Method
5.2. Water Supply Rate
5.2.1. Irrigable Area and Water Supply Reliability
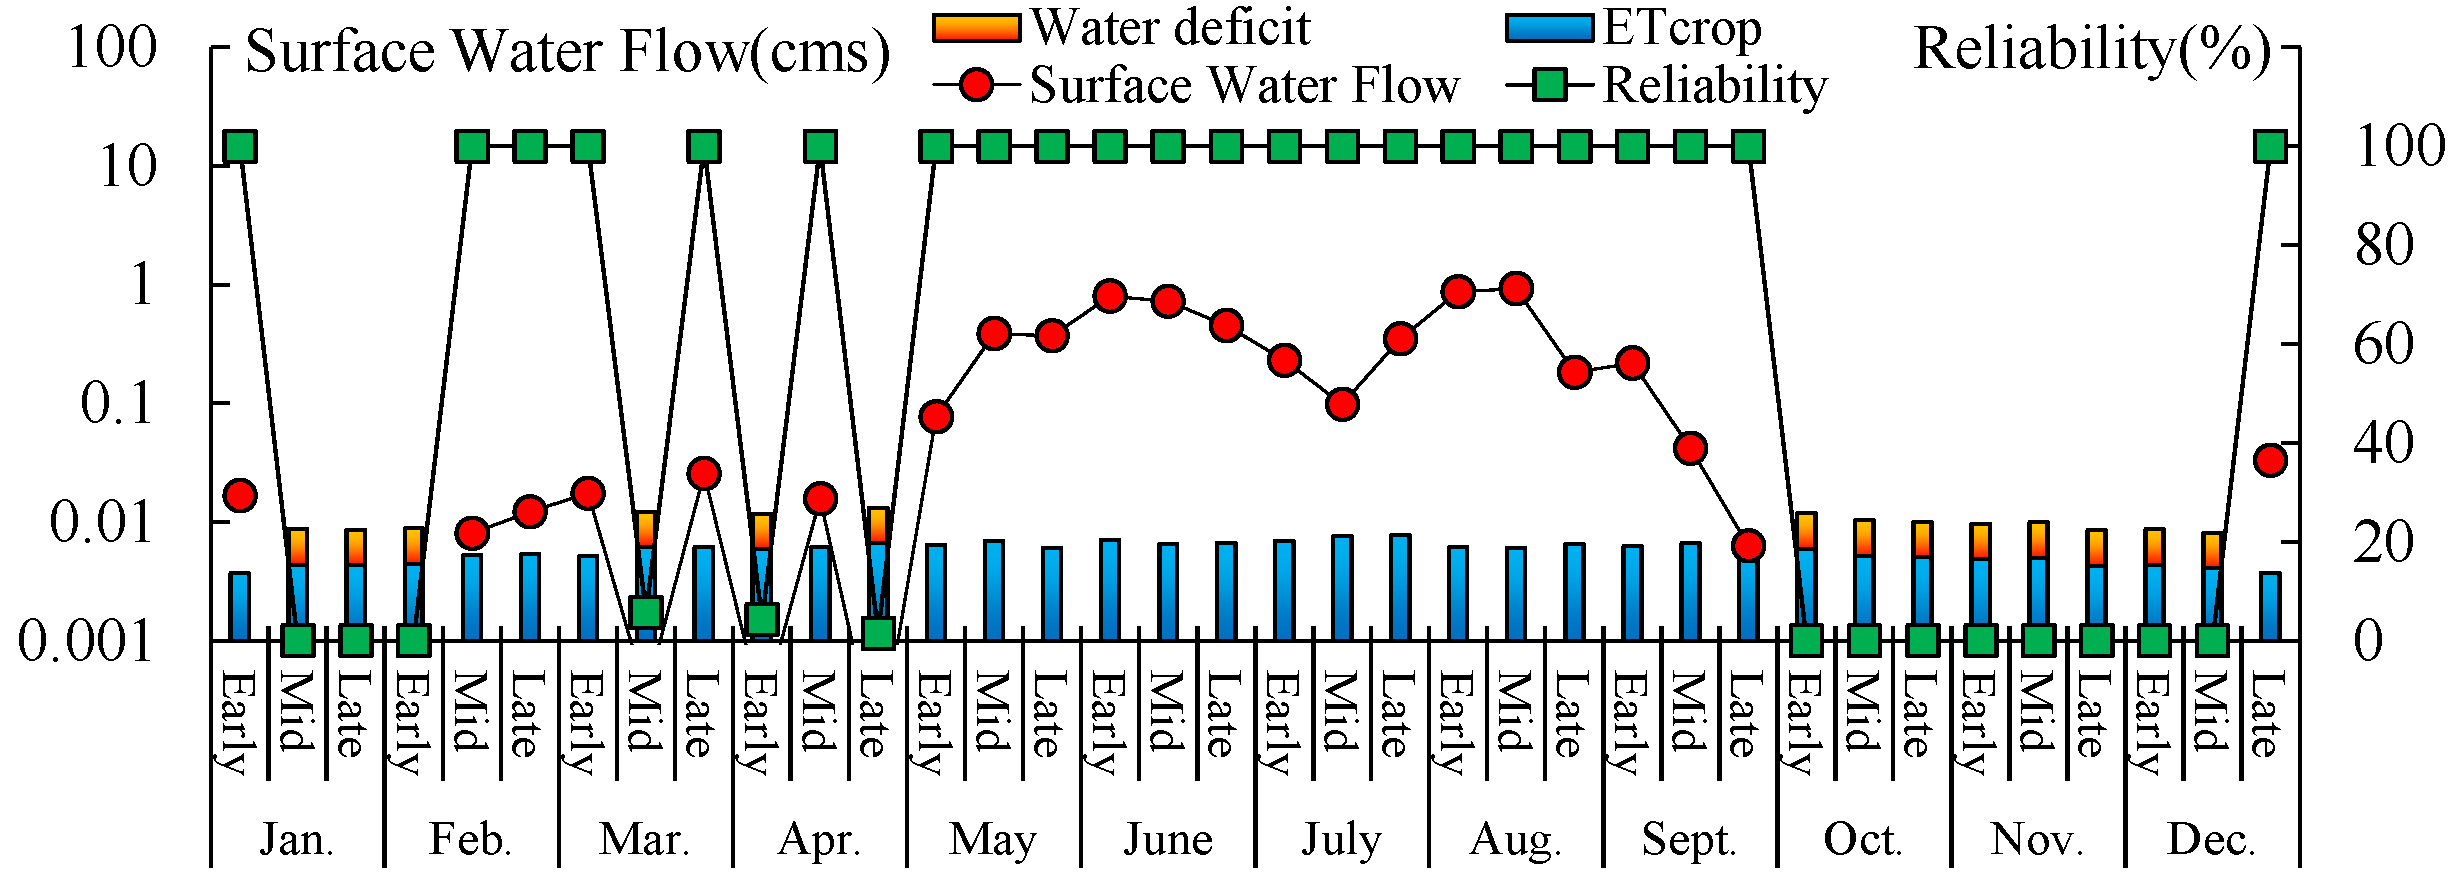
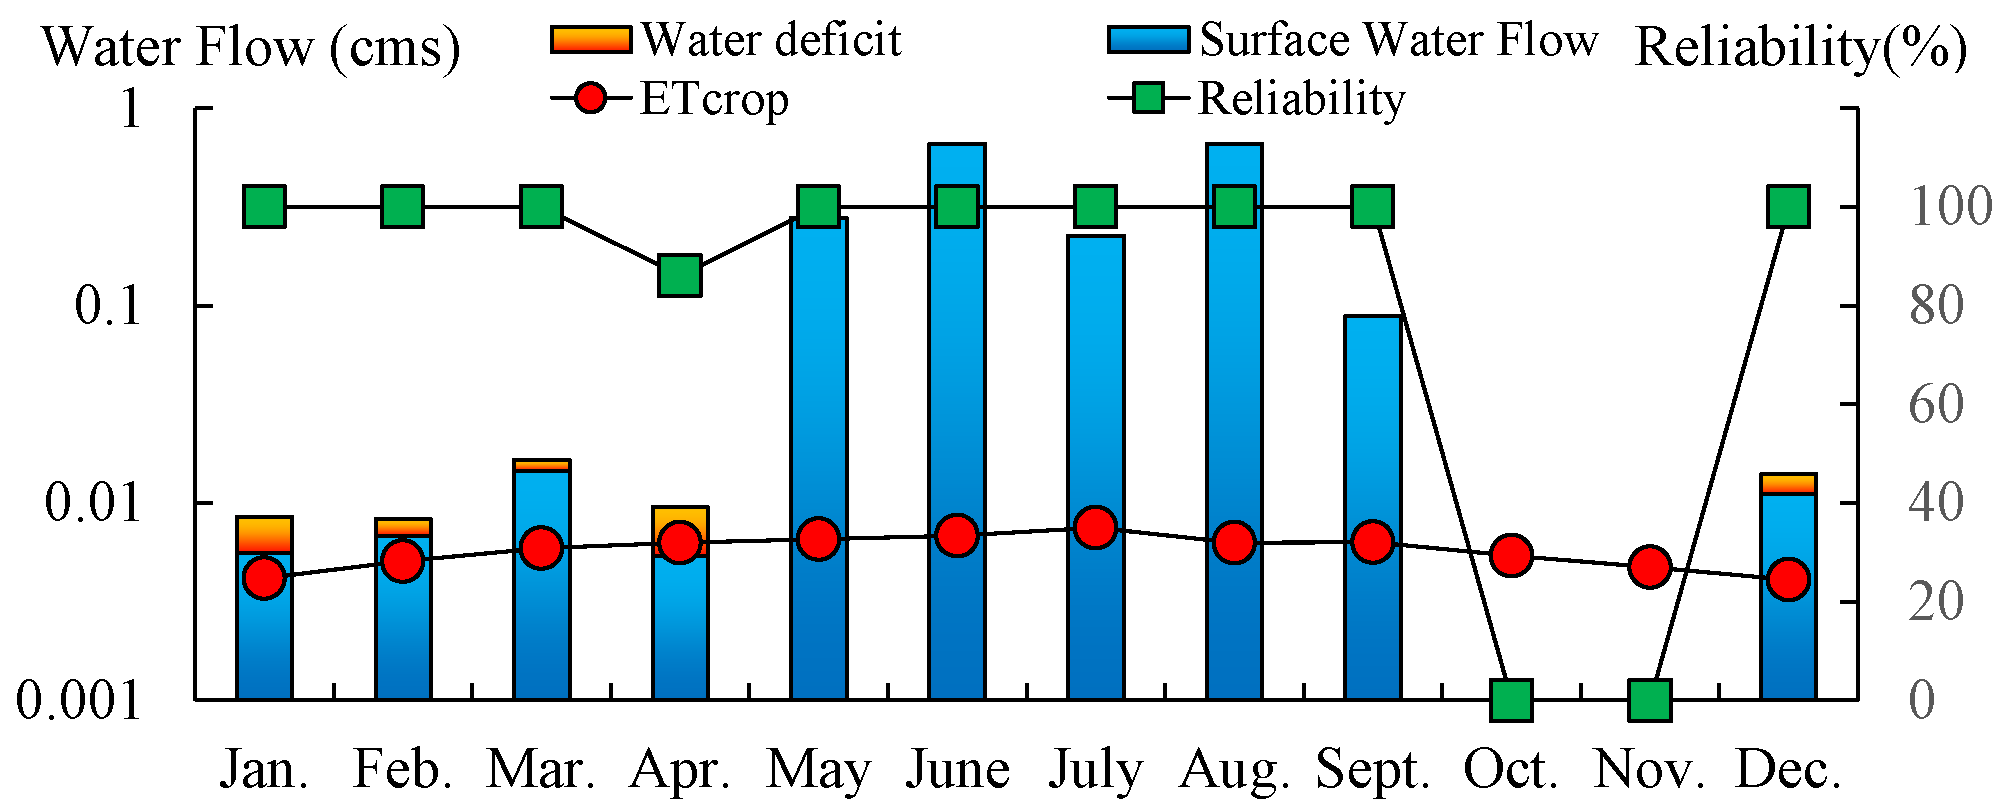
5.2.2. Rainfall, Crop Water Requirement, and Water Supply
6. Irrigation Service Strategies and Feasibility Assessment
6.1. Planning
6.2. Review of Regulations and Procedures
6.3. Feasibility of Plans
6.4. Review and Recommendations
6.4.1. Model I
6.4.2. Model II
7. Conclusions
Author Contributions
Funding
Institutional Review Board Statement
Informed Consent Statement
Data Availability Statement
Conflicts of Interest
References
- Chen, F.W. Facing the Challenges of the Water Scarcity Crisis—Strategies for Water Resources Management in Taiwan. Agric. World 2021, 456, 6–18. [Google Scholar]
- Nantou County Government. Performance Evaluation Report for Phase I Project of Bagua Mountain Facility Ex-pansion; Nantou County Government: Nantou, Taiwan, 2014. (In Chinese)
- AERC (Agricultural Engineering Research Center). Evaluation and Planning on Agricultural Excess Water Utilization of Bai-len Canal in Taichung County; AERC-Research Report; AERC (Agricultural Engineering Research Center): Taoyuan, Taiwan, 2005. [Google Scholar]
- AERC (Agricultural Engineering Research Center). Assessment and Planning of Expanding Baileng Canal Irrigation Area in Xinshe District, Xiecheng Village, Touko Mountain Area; AERC-Research Report; AERC (Agricultural Engineering Research Center): Taoyuan, Taiwan, 2020. [Google Scholar]
- CRRB (Central Region Resource Branch, Water Resources Agency of the Ministry of Economic Affairs). Review of Water Source Utilization in Tongxiao Area; CRRB (Central Region Resource Branch, Water Resources Agency of the Ministry of Economic Affairs): Taichung City, Taiwan, 2006.
- DWRT (Department of Water Resources). Investigation and Planning of Irrigation Canals, and Development of Subsequent Maintenance and Management Measures in High Yang and Low Yang Irrigation Areas; DWRT (Department of Water Resources): Taoyuan, Taiwan, 2018. [Google Scholar]
- Huang, H.C. Taiwan Farmers’ Almanac, Revised 3rd Edition, Volume II: Perennial Fruit Trees.Banana; Council of Agriculture, Executive Yuan: Taipei, Taiwan, 2005; pp. 9–18.
- TARI (Taiwan Agricultural Research Institute, Ministry of Agriculture). Good Agricultural Practice for Longan (TGAP); TARI (Taiwan Agricultural Research Institute, Ministry of Agriculture): Taichung City, Taiwan, 2020.
- NCU (National Chiayi University). Good Agricultural Practice for Citrus (TGAP); NCU (National Chiayi University): Chiayi, Taiwan, 2020. [Google Scholar]
- LKAFT (Liu-Kung Agriculture Foundation). Cultivation and Management of Green Bamboo Shoot; LKAFT (Liu-Kung Agriculture Foundation): Taipei, Taiwan, 1996. [Google Scholar]
- TDARES (Taoyuan District Agricultural Research and Extension Station, Ministry of Agriculture). Good Agricultural Practice for Bamboo Shoots (TGAP); TDARES (Taoyuan District Agricultural Research and Extension Station, Ministry of Agriculture): Taoyuan, Taiwan, 2007.
- TBRS (Tea and Beverage Research Station, Ministry of Agriculture). Good Agricultural Practice for Tea (TGAP); TBRS (Tea and Beverage Research Station, Ministry of Agriculture): Taoyuan, Taiwan, 2007.
- USDA SCS (USDA-Soil Conservation Service). National Engineering Handbook. Section 4. Hydrology; USDA-SCS: Washington, DC, USA, 1985. [Google Scholar]
- Ponce, V.; Hawkins, R. Runoff Curve Number: Has It Reached Maturity. J. Hydrol. Eng. 1996, 1, 11–19. [Google Scholar] [CrossRef]
- Hayes, G.I.; Buell, J.H. Water and Our Forests: Trees Also Need Water at the Right Time and Place, Yearbook of Agriculture; USDA: Washington, DC, USA, 1955; pp. 219–228. [Google Scholar]
- USDA. Irrigation Water Requirements, Technical Release 21; USDA Soil Conservation Service: Washington, DC, USA, 1967. [Google Scholar]
- Obreza, T.A.; Pitts, D.J. Effective Rainfall in Poorly Drained Microirrigated CitrusOrchards. Soil Sci. Soc. Am. J. 2002, 66, 212–221. [Google Scholar] [CrossRef]
- Rahman, M.M.; Islam, M.O.; Hasanuzzaman, M. Study of Effective Rainfall for Irrigated Agriculture in South-Eastern Part of Bangladesh. World J. Agric. Sci. 2008, 4, 453–457. [Google Scholar]
- Chen, S. A study on Water Management and Effective Rainfall in the Taoyuan Region of Taiwan. Ph.D. Dissertation, Hokkaido University, Sapporo, Japan, 1989. [Google Scholar]
- Chen, F.W. Assessing Climate Change on Effective Rainfall for Agricultural Water Management. Ph.D. Dissertation, Department of Bioenvironmental Systems Engineering, National Taiwan University, Taipei, Taiwan, 2013. [Google Scholar]
- Liu, Z.D.; Duan, A.W.; Xiao, J.F.; Liu, Z.G. Research Progress on Calculation Methods of Effective Rainfall in Growing Period on Dry Crop. J. Irrig. Drain. 2007, 26, 27–30. [Google Scholar]
- Kassam, A.; Smith, M. FAO Methodologies on Crop Water Use and Crop Water Productivity; Expert meeting on crop water productivity. Paper No. CWP-M07; FAO: Rome, Italy, 2001. [Google Scholar]
- Doorenbos, J.; Pruitt, W.O. Guidelines for Predicting Crop Water Requirements; FAO Irrigation and Drainage Paper 24; FAO: Rome, Italy, 1973. [Google Scholar]
- So, M. Applied Hydrology; Department of Soil and Water Conservation, National Chung Hsing University: Taichung, Taiwan, 1992. (In Chinese) [Google Scholar]


| Category | Banana | Longan | Citrus | Bamboo Shoots | Tea Leaves |
|---|---|---|---|---|---|
| January | ● | ● | ● | ||
| February | ● | ● | ● | ||
| March | ● | ● | ● | ||
| April | ● | ● | ● | ||
| May | ● | ● | ● | ||
| June | ● | ● | ● | ● | |
| July | ● | ● | ● | ● | |
| August | ● | ● | |||
| September | ● | ● | |||
| October | ● | ● | |||
| November | ● | ● | |||
| December | ● | ● |
| Month | Longan | Citrus | Banana | Bamboo Shoots | ||||
|---|---|---|---|---|---|---|---|---|
| * | ** | * | ** | * | ** | * | ** | |
| Jan. | 50.7 | 29.9 | 51.9 | 31.1 | 67.2 | 46.4 | 116.1 | 95.3 |
| Feb. | 55.5 | 35.9 | 56.9 | 37.3 | 73.6 | 54.0 | 127.1 | 107.5 |
| Mar. | 71.9 | 40.8 | 73.7 | 42.6 | 95.3 | 64.2 | 164.6 | 133.5 |
| Apr. | 74.2 | 32.7 | 76.0 | 34.5 | 98.3 | 56.8 | 169.8 | 128.3 |
| May | 79.5 | 17.5 | 81.4 | 19.4 | 105.4 | 43.4 | 182.0 | 120.0 |
| June | 80.7 | 0.0 | 82.7 | 0.6 | 107.0 | 24.9 | 184.8 | 102.7 |
| July | 91.3 | 18.4 | 93.5 | 20.6 | 121.0 | 48.1 | 209.0 | 136.1 |
| Aug. | 77.0 | 0.5 | 78.9 | 2.4 | 102.1 | 25.6 | 176.4 | 99.9 |
| Sept. | 74.6 | 28.8 | 76.4 | 30.6 | 98.9 | 53.1 | 170.7 | 124.9 |
| Oct. | 65.9 | 56.0 | 67.5 | 57.6 | 87.3 | 77.4 | 150.9 | 141.0 |
| Nov. | 55.9 | 41.9 | 57.3 | 43.3 | 74.1 | 60.1 | 128.0 | 114.0 |
| Dec. | 49.8 | 32.8 | 51.0 | 34.0 | 66.0 | 49.0 | 114.1 | 97.1 |
Disclaimer/Publisher’s Note: The statements, opinions and data contained in all publications are solely those of the individual author(s) and contributor(s) and not of MDPI and/or the editor(s). MDPI and/or the editor(s) disclaim responsibility for any injury to people or property resulting from any ideas, methods, instructions or products referred to in the content. |
© 2025 by the authors. Licensee MDPI, Basel, Switzerland. This article is an open access article distributed under the terms and conditions of the Creative Commons Attribution (CC BY) license (https://creativecommons.org/licenses/by/4.0/).
Share and Cite
Chen, F.-W.; Tan, Y.-W.; Lin, H.-T.; Cho, Y.-C.; Chang, Y.-T.; Chiang, L.-C. Planning and Strategies for Expansion of Irrigation Services in Mountainous Areas: A Case Study of Nantou County in Taiwan. Eng. Proc. 2025, 91, 17. https://doi.org/10.3390/engproc2025091017
Chen F-W, Tan Y-W, Lin H-T, Cho Y-C, Chang Y-T, Chiang L-C. Planning and Strategies for Expansion of Irrigation Services in Mountainous Areas: A Case Study of Nantou County in Taiwan. Engineering Proceedings. 2025; 91(1):17. https://doi.org/10.3390/engproc2025091017
Chicago/Turabian StyleChen, Feng-Wen, Yun-Wei Tan, Hsiu-Te Lin, Yu-Chien Cho, Ya-Ting Chang, and Li-Chi Chiang. 2025. "Planning and Strategies for Expansion of Irrigation Services in Mountainous Areas: A Case Study of Nantou County in Taiwan" Engineering Proceedings 91, no. 1: 17. https://doi.org/10.3390/engproc2025091017
APA StyleChen, F.-W., Tan, Y.-W., Lin, H.-T., Cho, Y.-C., Chang, Y.-T., & Chiang, L.-C. (2025). Planning and Strategies for Expansion of Irrigation Services in Mountainous Areas: A Case Study of Nantou County in Taiwan. Engineering Proceedings, 91(1), 17. https://doi.org/10.3390/engproc2025091017