Abstract
Electric vertical take-off and landing vehicles introduce challenges in powertrain design with short but high peak loads and low-load phases over longer periods of time during wing-borne flight. In this paper, three powertrain topologies are analyzed for a tilt-rotor urban air mobility vehicle with an expected entry into service after 2030. The powertrains are studied on the level of preliminary sizing for the design mission of the vehicle. The three powertrain topologies studied and compared are battery-only, fuel cell-only and a hybrid of the two energy sources. Parameter studies on the gearbox transmission ratio, the design point of the fuel cell system as well as the degree of hybridization were carried out. The combination of fuel cell and battery was found to be most beneficial in terms of mass when the fuel cell is sized for slightly more than cruise power. In flight phases with higher power requirements, the batteries would provide the additional boost.
1. Introduction
Urban air mobility (UAM) vertical take-off and landing (VTOL) vehicles, often referred to as air taxis, aim to enable an alternative transport mode for the future. Most of the vehicles in development in this category have an electric powertrain in common [1,2,3]. The requirements for a powertrain of such a vehicle are challenging, with short but very high peak loads for the hover phases and longer but significantly lower power loads for the wing-based flight phases. Therefore, various design choices can have a strong impact on the viability and feasibility of such a concept. The selection of a suitable energy source or the power distribution between sources are two of those critical design considerations. Different options, such as battery-electric, hydrogen fuel cells (FCs) and hybrid-electric configurations each offer unique advantages, but also raise specific challenges.
Powertrain topologies for UAM vehicles were also the focus of prior research. Donateo and Ficarella [4] analyzed powertrains for a generic UAM vehicle. They looked at battery-electric and parallel hybrid-electric powertrains as combinations of turboshaft engines and electric motors powered by batteries. FCs were not considered. Hagag and Jäger [5] analyzed six different powertrain architectures for multirotor UAM vehicles for different flight profiles. Here, a hybrid with a small fraction of battery power and a larger fraction of internal combustion engine power performed best. Powertrains with an FC and a battery were also analyzed but did not perform as well. They also concluded that these results may change for different VTOL configurations. Palaia et al. [6] developed a sizing methodology and used it to design and compare tilt-wing UAM vehicles with battery-electric powertrains only. In a study by Thomas et al. [7], four different powertrain topologies for an UAM application were compared over the same mission. The topologies were combinations of a turboshaft engine with a generator and/or batteries to power electric motors. The hybrid outperformed the other options under some circumstances. Again, an FC was not considered.
In this paper, different topologies of electric powertrains are analyzed for a tilt-rotor UAM vehicle, which is being designed in the DLR-internal project VIRLWINT [8]. The topologies differ in the energy hybridization between batteries and hydrogen-powered fuel cell systems (FCSs). All powertrain variants were sized and evaluated for the same design point and mission. The technology level for the vehicle is projected to the year 2030. For the different topologies, the influence of factors such as a gearbox, the design point of the FCSs, and the degree of hybridization were analyzed. Finally, one powertrain configuration for this vehicle is presented that combines all previous results to achieve an improved powertrain design.
2. Method
2.1. Tilt-Rotor Vehicle
All powertrains were designed for one tilt-rotor UAM vehicle concept, with its Top-Level Aircraft Requirements (TLARs) listed in Table 1. The reference aircraft for the vehicle design was the Joby S4 [2]. The TLARs for this study were derived from potential UAM air taxi application cases, previously examined in detail by Ratei et al. [9].

Table 1.
Top-level aircraft requirements and specifications.
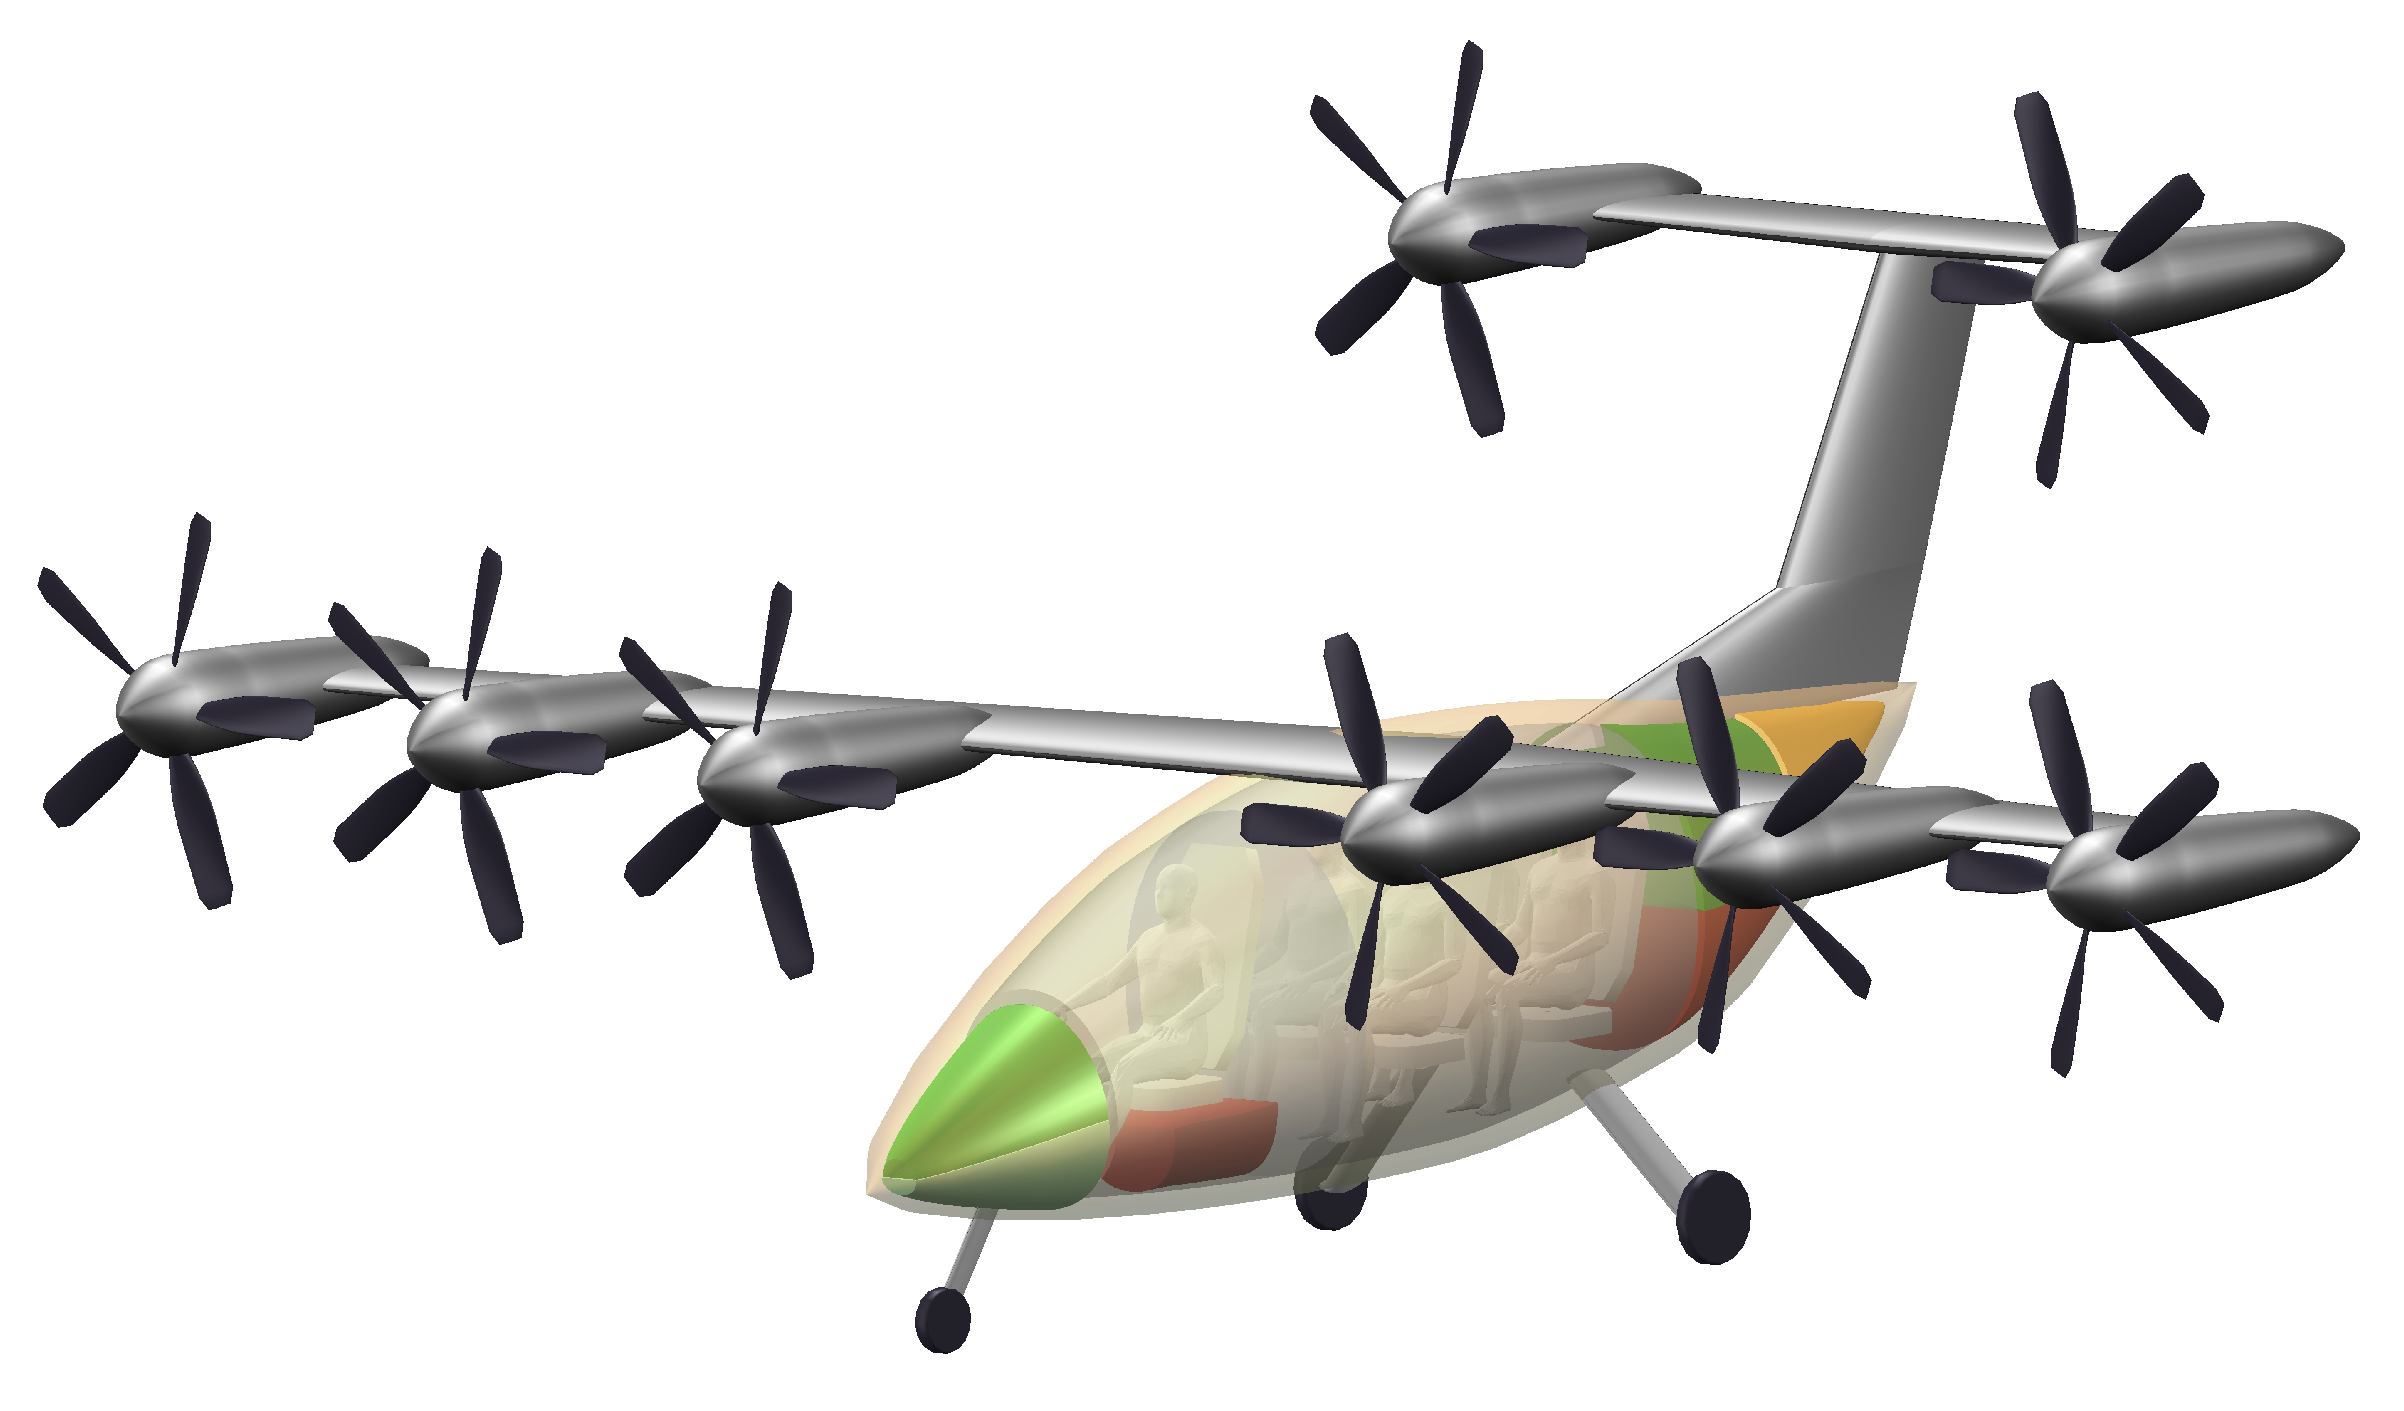
A graphical representation of the vehicle can be found in Figure 1. The vehicle requirements target an entry into service after 2030 and include VTOL capability for the vehicle, adherence to EASA’s SC-VTOL maximum take-off mass limits (<3175 kg), and the ability to operate within 15.3 m × 15.3 m × 6.1 m infrastructure constraints. Highly automated flight operations should be possible with the vehicle as well as taxiing without external devices.

Figure 1.
Tilt-rotor vehicle, overall dimensions = 7.7 m × 13.9 m × 5.1 m (length × width × height).
The conceptual vehicle design process, based on the initial TLARs, defines overall specifications, geometry, and performance using a methodology tailored for UAM applications. This approach integrates detailed design outputs, refining vehicle concepts through collaboration across powertrain and propeller design disciplines. This iterative process led to the preliminary vehicle concept that is presented here, with final design pending additional high-fidelity simulations. Additional information on the vehicle’s preliminary design process can be found in Schade et al. [8].
In this current iteration, the vehicle is sized at a Maximum Take-off Mass (MTOM) of 2334 kg, allocating 1020 kg for the powertrain. If the powertrain mass changes, as will be the case for the different powertrains analyzed in this study, the overall aircraft design would change as well with sizing effects. The different powertrain masses calculated within the studies in this paper are therefore not final and only allow for relative comparisons.
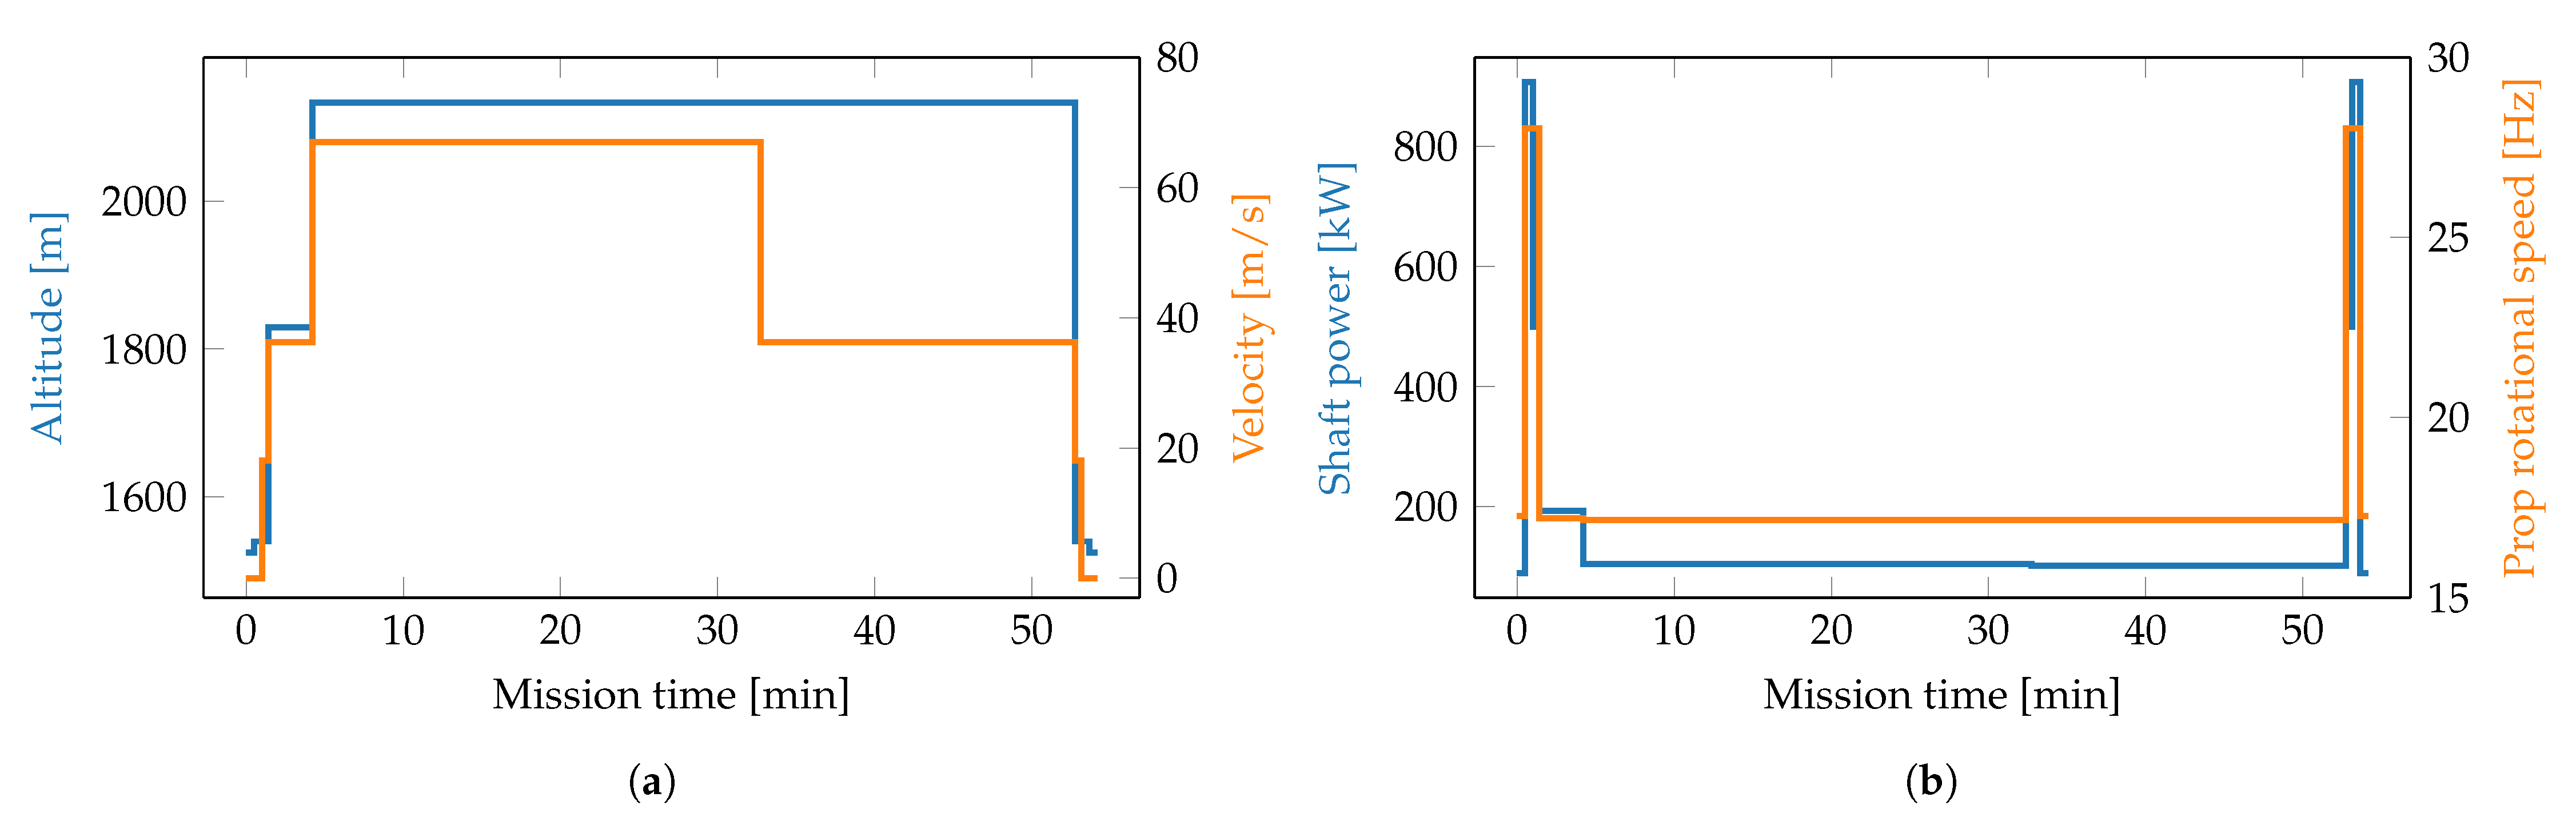
The most important parameters of the mission for the powertrain sizing—namely, altitude, velocity, shaft power profile and propeller rotational speed—are depicted in Figure 2 and Figure 3. The mission starts with a short taxi phase at low power, followed by the vertical take-off with maximum power of just above 905 kW and rotational speed of about 1700 rpm. In the subsequent transition phase, the vehicle’s velocity increases, while the power decreases to 500 kW. Afterwards, the aircraft climbs in wing-borne flight to cruise altitude. Cruise and loiter are the longest phases with lower power requirements of around 100 kW and a rotational speed of 1000 rpm. The mission ends with another transition and hover phase for vertical landing and finally a short taxi phase.
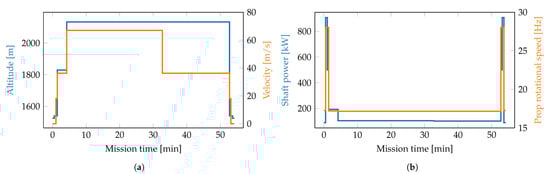
Figure 2.
Mission parameters: (a) Altitude and velocity. (b) Power and prop rotational speed.
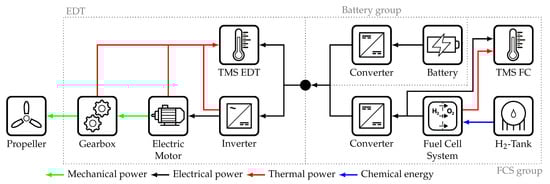
Figure 3.
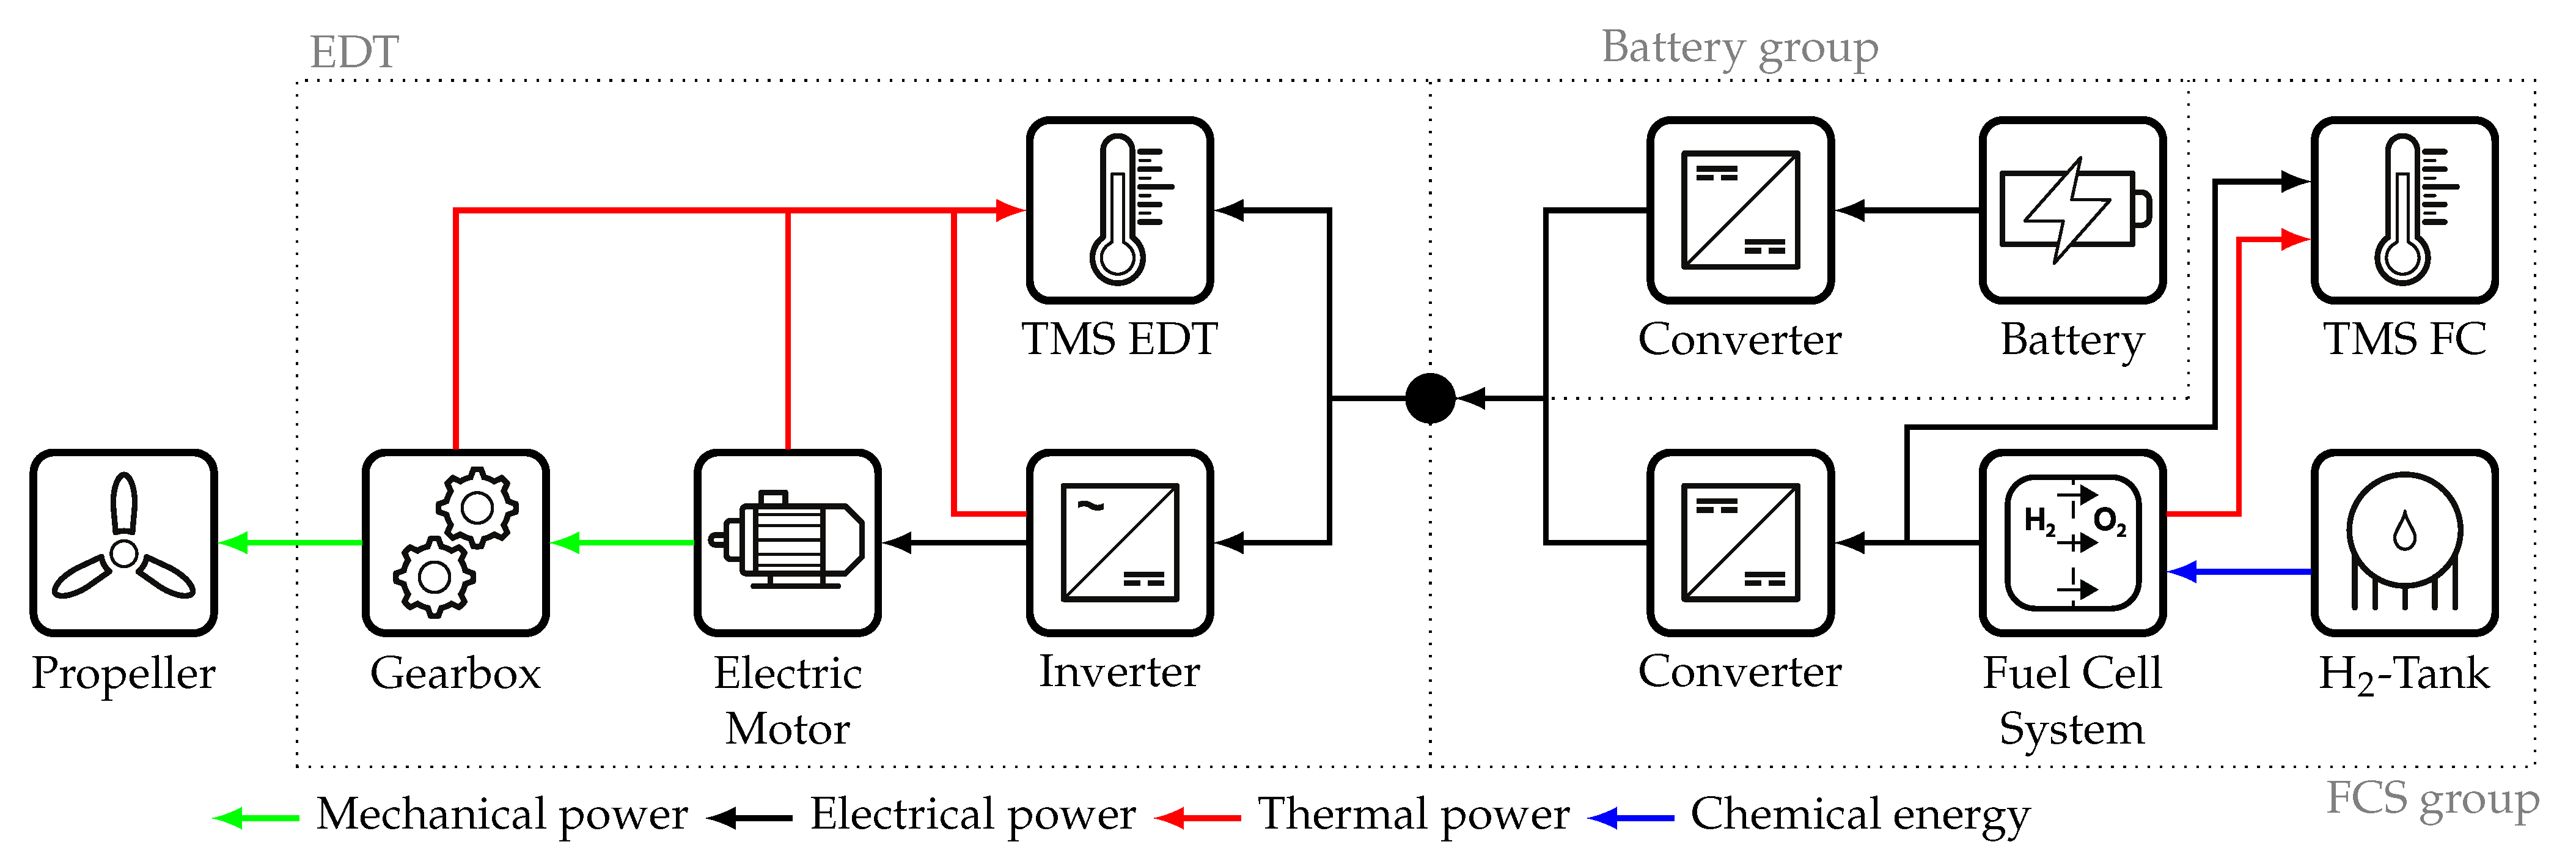
Powertrain architectures and components. Adapted from Schade et al. [8].
2.2. Powertrain Modelling
An overview of all the components modeled within the powertrain options is shown in Figure 3. The load side of the propulsion system architecture is the electric drive train (EDT). It remains constant for all architectures investigated in this study. It was sized based on the design point with the most demanding power requirement during the mission, the vertical take-off flight phase, as can be seen in Figure 2b. The components within the EDT had their own liquid-based thermal management system (TMS). The energy source options for the EDT are the battery group and/or the FCS group. The models used for calculating the performance and masses of the individual components were previously described by Ludowicy et al. [10]. The only changes were in the projected technology level and in the battery model, where the underlying basic cell curves were exchanged for curves representing a higher power output cell, allowing for higher discharge c-rates [11]. For 2030 technology, the following assumptions for the mass calculations were used: For electric motors, 13.2 kW/kg [12], assumed for 7600 rpm; for power electronics, 13.8 kW/kg [13], for matching conditions; and for the batteries, an energy density of 391 Wh/kg [14]. In comparison, high-power cells usually reach lower-energy densities than high-energy cells, based on which battery energy density projections are usually carried out. Therefore, using this value for the high-power cell model is very optimistic.
The hybrid powertrains were designed by sizing the FCS for a certain net electric power calculated with the degree of hybridization (DoH) as defined in Equation (1), where is the electric power the EDT requires in its design point.
During the mission, a peak power shaving operating strategy was used. Therefore, the FCS is utilized throughout the entire mission and the batteries are used only when the required power exceeds what the FCS can deliver. After the power from the battery and TMS group across the whole mission is calculated, the hydrogen consumption is summed up, and the tanks are sized. The batteries are sized based on their final power profile.
3. Results
3.1. Baseline Powertrains
Two baseline powertrains were sized first: one battery-only and one FC-only powertrain. These were the starting points for the parameter studies presented in the following sections. The mass results for these two powertrains are listed in Table 2. The EDT components were exactly the same for both, as to be expected as they were sized for the same mission and design point and the EDT is independent of the energy sources.
Table 2.
Baseline powertrain mass splits.
The total powertrain mass for the battery-only variant was about 1200 kg. The largest share was for the batteries with nearly 50%. The electric motors were the next largest contributor with around 20%. In this design, the electric motor model yielded a power-to-weight ratio of only 3.82 kW/kg, significantly lower than the 13.2 kW/kg used for the calibration of the motor mass calculation. The effect was caused by the low propeller rotational speeds the motors were designed for as there were no gearboxes in this configuration.
The FC-only powertrain weighed 1354.19 kg and was about 13% heavier than the battery variant. The FCS, its TMS, and the hydrogen, including the tank, were significantly heavier than the battery and its converter for the same overall energy demand. Note the proportion of the FCS and its TMS, where the TMS adds another 80% of the FCS mass. The pure energy for this powertrain, on the other hand, was only 7.9 kg of hydrogen plus 80.72 kg for a 350 bar pressure tank for storage, highlighting the difference in energy density between batteries and hydrogen, even when taking the tank and the conversion efficiencies of the FC into account.
Based on these baseline powertrains, several input parameters were varied in the following studies. If not mentioned otherwise, only the specific parameter was changed; all other values were set back to the values used for the baseline configurations.
3.2. Gearbox Study
In the first parameter study, a gearbox was introduced to the battery-only powertrain to increase the motor rotational speed and its transmission ratio was varied. From the results presented in Figure 4a, it can be observed that a ratio of around 0.125, or an eightfold increase in motor rotational speed in comparison to the propeller rotational speed, yielded the lightest overall powertrain. A mass breakdown of this configuration is listed in Figure 4b.
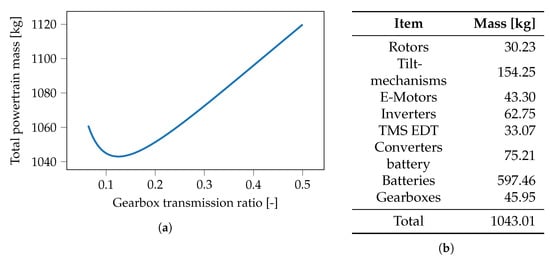
Figure 4.
Results gearbox study: (a) Overall powertrain mass over gearbox transmission ratio. (b) Lightest powertrain with a gearbox mass split.
Gearboxes with a total mass of about 46 kg were added, but the motor mass decreased from over 235 kg to only about 43 kg, losing over 80% of the mass. Taking the gearboxes into account too, a combined change from 235 kg to less than 90 kg for motors and gearboxes can be seen, which is still a decrease of over 60% in mass. The higher rotational speed and lower torque at the motor result in lower currents and allow for a more lightweight design, yielding a power-to-weight ratio of nearly 21 kW/kg.
The inverters also decreased in mass with a reduction in current to the motors, although not as significant as the motors themselves, with only a reduction of just above 35%. On the downside of these changes, the motor and inverter lost some efficiency in their operation due to higher switching losses. Higher losses result in a larger TMS, increasing its mass as well. Furthermore the higher losses have to be offset by carrying more energy in the first place, increasing the battery mass by 26.5 kg or about 4.6%.
Overall, the lightest powertrain with a gearbox weighed just over 1043 kg and was therefore nearly 13% lighter than the powertrain without a gearbox. The best combination of a gearbox with a transmission ratio of about 0.125 will be used in the powertrain design based on combined results presented later.
3.3. FC-Only Parameter Study
Two very influential parameters for the FCS group design are the fuel cell oversizing factor and the heat exchanger (HEX) efficiency within the FCS TMS [15]. The OF determines the size of the FCS and the operating regime of the FCS on the cell polarization curve, while the HEX efficiency influences the HEX size, mass, and the air mass flow that is pushed through the TMS and therefore its parasitic power consumption. Both were analyzed together in a 2D parameter study, as there is a strong dependency, as stated by Link et al. [15].
The results of the study for the overall powertrain mass are depicted in Figure 5a. An optimum was found at an of 1.65 (baseline value 2.0) and 0.59 for the HEX efficiency (baseline value 0.65) with an overall powertrain mass of 1337 kg. The mass split for this combination is listed in Figure 5b. In comparison to the baseline FC powertrain the mass decreased by only 1.27% and the powertrain was still significantly heavier than the baseline battery-based option. With the lower FCS OF, the FCS mass decreased at the cost of less efficient cells, which caused an increase in TMS mass and hydrogen consumption. The slightly lower HEX eff counters the effect of increased TMS mass slightly but also at the cost of a lower efficiency and an increase in hydrogen consumption. But as the additional hydrogen mass to offset these losses is small, the overall effect was still beneficial.
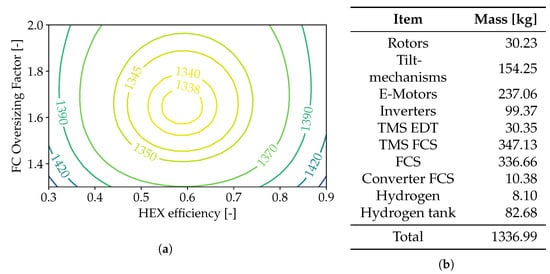
Figure 5.
Results FC-only parameter study: (a) Overall powertrain mass [kg] over FC OF and FCS TMS HEX efficiency. (b) Best FC only powertrain mass split.
3.4. Hybrid Powertrain Study
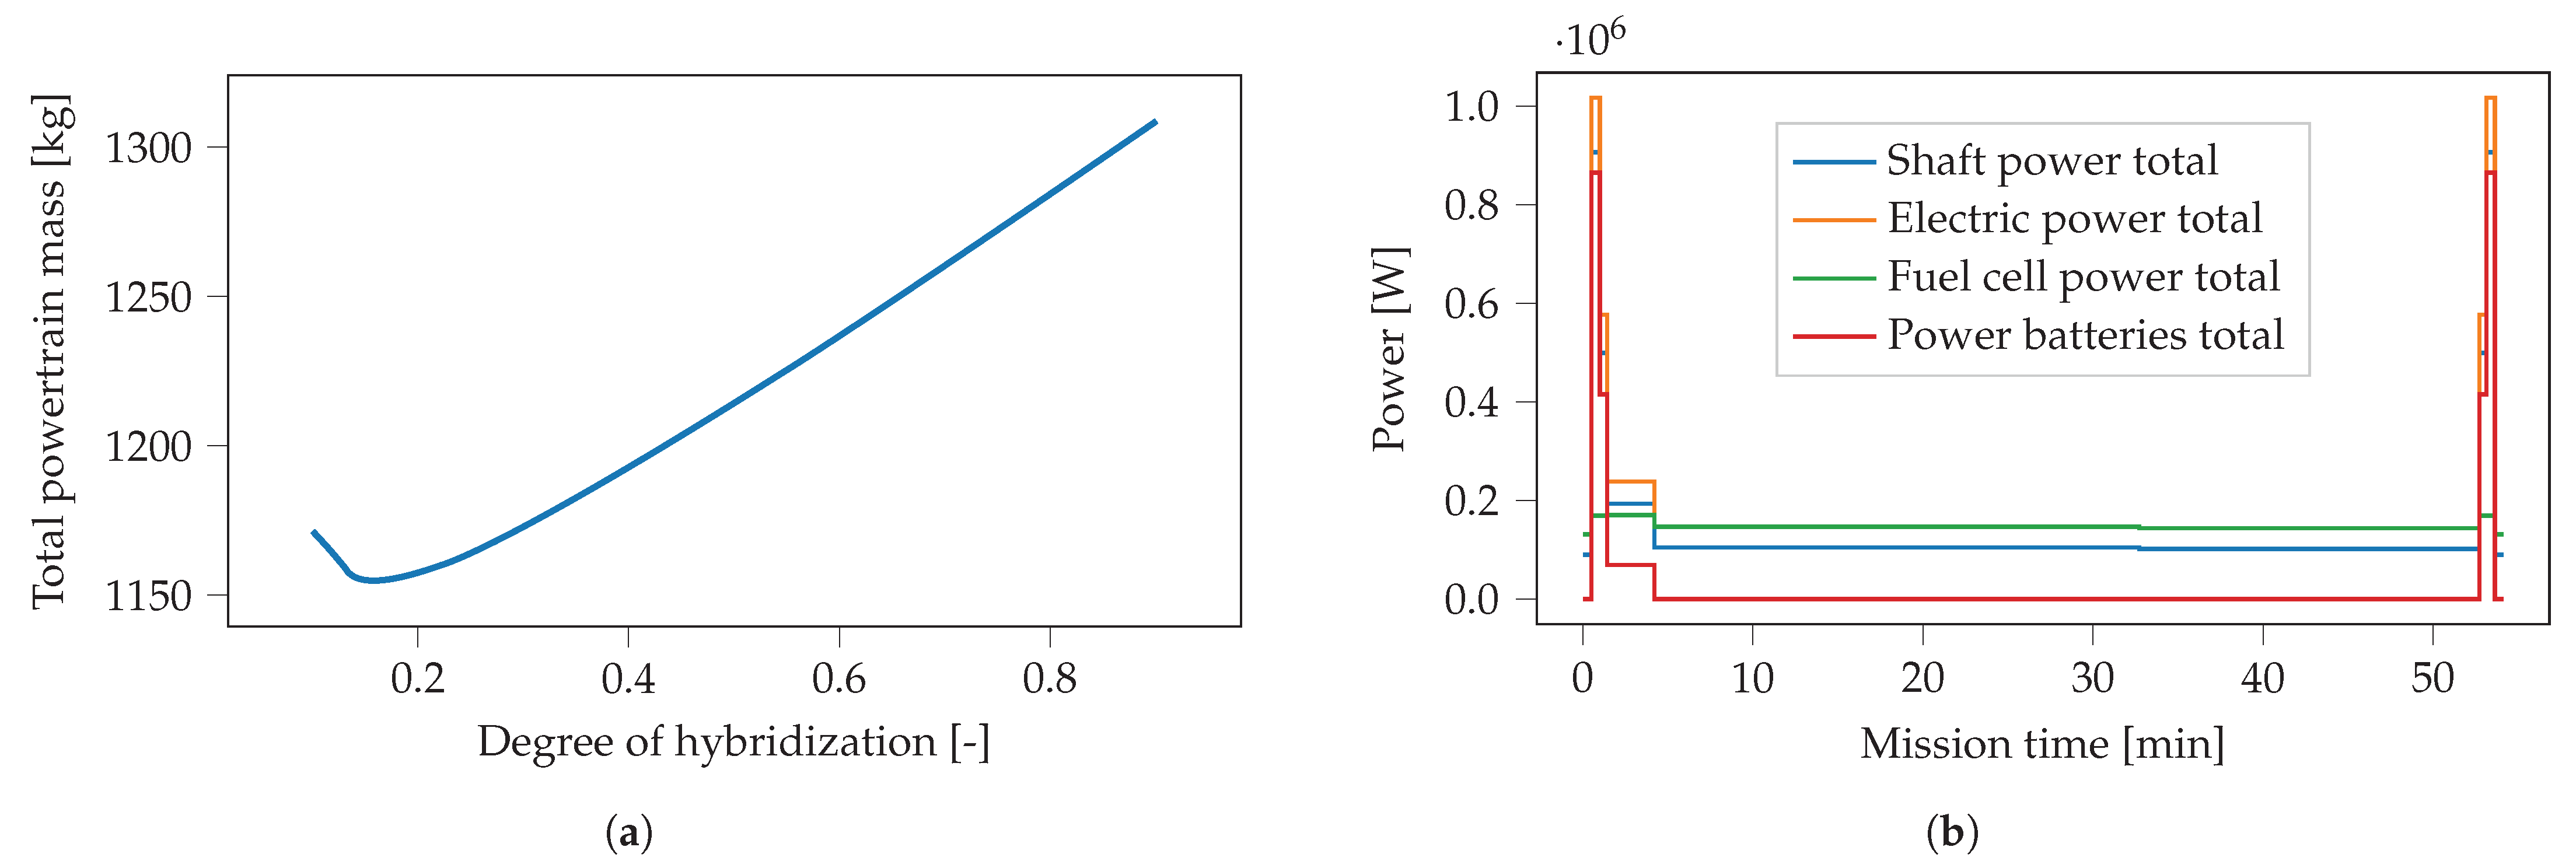
In a third study, the hybrid powertrain was analyzed. The only parameter varied from the two baseline powertrains was the DoH, as described in Section 2.2. The results of the overall powertrain mass for DoH values between 0.1 and 0.8 are shown in Figure 6a. The results for values of zero and one are the two baseline powertrains, the battery-only powertrain (0), and the FC-only powertrain (1). For values between 0.1 and about 0.4, the hybrid powertrain was lighter than the previously lightest baseline combination with a battery only. A minimum was achieved for a degree of hybridization of about 0.165 with a powertrain mass of 1154 kg, about 3.6% lighter than the baseline battery-only variant. In this case, the powertrain has only a rather small FCS in comparison to the electric power necessary for the design point, where most of the power must still come from the batteries.
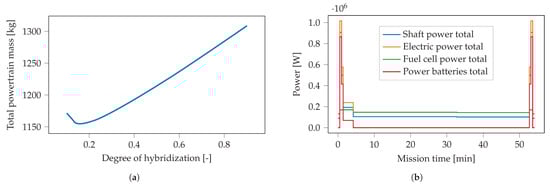
Figure 6.
Results hybrid powertrain study: (a) Powertrain mass results over degree of hybridization. (b) Power splits over mission for best hybrid.
Figure 6b depicts the total shaft power, total electric power, and the share coming from the batteries and the FCS over the whole mission for this lightest hybrid powertrain. The total electric power during the longest phases of the mission, cruise and loiter, was solely covered by the FCS, while no power has to come from the batteries. The FCS was able to deliver slightly higher power, as can be seen in the climb phase at around three minutes, but it already has to be supported by the batteries in this phase. This split of power allows for the best utilization of both energy systems. The batteries were used for short high-power requests only and do not have to carry all the energy for the flight, while the FCS could be significantly downsized in comparison to the FC-only powertrain and was run at a nearly constant load over the whole course of the mission, taxi phases at the beginning and end excluded, utilizing the high-energy density of hydrogen.
The mass split for the best hybrid powertrain is listed in Table 3. The batteries, in comparison to the battery-only powertrain, lost about 45% of their mass and a small FCS was present, plus periphery, but only about a fifth the size and mass of the systems for the FC-only powertrain. The hydrogen consumption of this hybrid powertrain, on the other hand, was slightly higher than for the FC-only powertrain.
Table 3.
Best hybrid powertrain mass split.
In looking only at the mission energy, or area under the power curves, where for the FC only powertrain all energy must have come from hydrogen, while for the hybrid, only a share of this energy came from the FCS and therefore hydrogen, this seems contrary at first. The effect is caused by the part load behaviour of an FC, which increases its efficiency the lower the load. As the FCS for this hybrid was only sized for just above cruise power, its always running at the relatively low efficiency for a high load. For the FC-only powertrain, the FCS was designed to deliver the peak power during the vertical take-off and landing phases. During cruise and loiter, the load was drastically lower; hence, it runs at a significantly higher efficiency at this relatively low load. The effect of this high efficiency during low-power phases offsets the additional energy that must come from hydrogen for the higher-power phases, as the share of cruise and loiter in total mission energy is rather large.
3.5. Combined Results of Powertrain Architecture
In a final calculation, all results from the previous studies were combined into one powertrain. A hybrid utilizing a gearbox with an adapted FCS OF and HEX efficiency yielded a total powertrain mass of only 988 kg, nearly 18% lower than the lightest baseline powertrain (batteries only) with 1197 kg. The exact mass split is listed in Table 4. The EDT part was exactly the same as for the best powertrain from the gearbox study. The energy system masses were slightly higher than for the best powertrain from the hybrid study, which is the same effect as with the battery mass in the gearbox study; because of the higher rotational speeds and frequencies, the components of the EDT were a little less efficient.
Table 4.
Combined results of powertrain mass split.
4. Discussion and Conclusions
This paper analyzed electric powertrains for a tilt-rotor UAM vehicle and its design mission. The vehicle was described and the powertrain modelling was presented. A baseline battery-only powertrain was sized to be at about 1200 kg. Increasing the motor rotational speed with the addition of a gearbox with an optimal transmission ratio of 1:8 decreased the powertrain mass for the battery-only version by 13%. An FC-only powertrain with optimal FC size and heat exchanger efficiency for its liquid-based TMS was significantly heavier at 1336 kg. The hybrid powertrain configuration was the lightest when a degree of hybridization was chosen, where batteries were only used for peak power shaving. Overall, the powertrain combining the findings from the studies on gearbox transmission ratio, fuel cell oversizing factor, and heat exchanger efficiency, as well as degree of hybridization, resulted in only 988 kg of mass, which is 18% lighter than the initial battery-only baseline and lighter than the base vehicle design for the powertrain mass.
However, it is important to note the limitations of this study. All parameter studies presented here were based on requirements from the aircraft design with an assumed powertrain mass of 1020 kg. Feeding the results back to the aircraft design, the requirements would change with powertrain masses that deviate from the initial assumption. A lighter powertrain leads to a lighter vehicle, which translates to lower power requirements. This in turn would reduce the size and mass of the powertrain and vice versa for a heavier powertrain—a typical snowball effect in aircraft sizing. Additionally, the change within the battery model to a higher power battery cell curve within the model while keeping the technology assumption for the battery energy density is very optimistic. Furthermore, an active thermal management system for the batteries should be included within the powertrains in future calculations, as the batteries are discharged at high c-rates.
Future work will focus on addressing the limitations of this study and exploring further improvements. A key area of research will be the coupling of aircraft and powertrain design tools to allow for comparisons of fully converged powertrain and vehicles configurations. This will enable a more comprehensive understanding of the relationships between powertrain design, vehicle design, and overall performance. By addressing these knowledge gaps, we can move closer to developing more efficient and effective powertrains for UAM vehicles.
Author Contributions
Conceptualization, J.L. and P.R.; methodology, J.L.; software, J.L.; validation, J.L.; formal analysis, J.L.; investigation, J.L.; resources, J.L. and P.R.; data curation, J.L.; writing—original draft preparation, J.L. and P.R.; writing—review and editing, J.L., P.R. and S.d.G.; visualization, J.L. and P.R.; supervision, S.d.G.; project administration, S.d.G.; funding acquisition, S.d.G. All authors have read and agreed to the published version of the manuscript.
Funding
This research received no external funding.
Institutional Review Board Statement
Not applicable.
Informed Consent Statement
Not applicable.
Data Availability Statement
The data presented in this study are available on request from the corresponding author.
Conflicts of Interest
The authors declare no conflict of interest.
References
- Archer Aviation Inc. Archer Midnight. Available online: https://www.archer.com/aircraft (accessed on 27 August 2024).
- Joby Aviation. Joby S4. Available online: https://www.jobyaviation.com/ (accessed on 27 August 2024).
- Lilium GmbH. Lilium Jet. Available online: https://jet.lilium.com/ (accessed on 27 August 2024).
- Donateo, T.; Ficarella, A. A Methodology for the Comparative Analysis of Hybrid Electric and All-Electric Power Systems for Urban Air Mobility. Energies 2022, 15, 638. [Google Scholar] [CrossRef]
- Hagag, N.; Jäger, F. Evaluation of the Technical Value of Powertrain Systems to Enable Safe Performance-based Flight Guidance for Urban Air Mobility. In Proceedings of the 2023 IEEE/AIAA 42nd Digital Avionics Systems Conference (DASC), Barcelona, Spain, 1–5 October 2023; IEEE: Piscataway, NJ, USA, 2023; pp. 1–11. [Google Scholar] [CrossRef]
- Palaia, G.; Abu Salem, K.; Cipolla, V.; Binante, V.; Zanetti, D. A Conceptual Design Methodology for e-VTOL Aircraft for Urban Air Mobility. Appl. Sci. 2021, 11, 10815. [Google Scholar] [CrossRef]
- Thomas, G.L.; Chapman, J.W.; Hasseeb, H.; Fuzaro Alencar, J.; Sadey, D.; Csank, J. Multidisciplinary Systems Analysis of a Six Passenger Quadrotor Urban Air Mobility Vehicle Powertrain. In Proceedings of the AIAA Propulsion and Energy 2020 Forum, Reston, VI, USA, 24–26 August, 2020. [Google Scholar] [CrossRef]
- Schade, S.; Ludowicy, J.; Ratei, P.; Hepperle, M.; Rossignol, K.S.; de Graaf, S.; Geyer, T. Conceptual design of electrically-powered Urban Air Mobility vehicles for aeroacoustic studies. In Proceedings of the Deutscher Luft- und Raumfahrtkongress 2024, Hamburg, Germany, 30 September–2 October 2024. Manuscript submitted for publication. [Google Scholar]
- Ratei, P.; Naeem, N.; Prakasha, P.S. Development of an urban air mobility vehicle family concept by system of systems aircraft design and assessment. J. Phys. Conf. Ser. 2023, 2526, 012043. [Google Scholar] [CrossRef]
- Ludowicy, J.; Bahrs, V.J.; Staggat, M. Feasibility study for a medium-range regional aircraft retrofit with battery powered propulsion system. In Proceedings of the Aerospace Europe Conference 2023: 10th EUCASS and 9th CEAS, Lausanne, Switzerland, 9–13 July 2023. [Google Scholar] [CrossRef]
- Battery Design. Tesla 4680 Cell. Available online: https://www.batterydesign.net/tesla-4680-cell/ (accessed on 27 August 2024).
- Pastra, C.L.; Hall, C.; Cinar, G.; Gladin, J.; Mavris, D.N. Specific Power and Efficiency Projections of Electric Machines and Circuit Protection Exploration for Aircraft Applications. In Proceedings of the 2022 IEEE Transportation Electrification Conference & Expo (ITEC), Anaheim, CA, USA, 15–17 June 2022; IEEE: Piscataway, NJ, USA, 2022; pp. 766–771. [Google Scholar] [CrossRef]
- Hall, C.; Pastra, C.L.; Burrell, A.; Gladin, J.; Mavris, D.N. Projecting Power Converter Specific Power Through 2050 for Aerospace Applications. In Proceedings of the 2022 IEEE Transportation Electrification Conference & Expo (ITEC), Anaheim, CA, USA, 15–17 June 2022; IEEE: Piscataway, NJ, USA, 2022; pp. 760–765. [Google Scholar] [CrossRef]
- Tiede, B.; O’Meara, C.; Jansen, R. Battery Key Performance Projections based on Historical Trends and Chemistries. In Proceedings of the 2022 IEEE Transportation Electrification Conference & Expo (ITEC), Anaheim, CA, USA, 15–17 June 2022; IEEE: Piscataway, NJ, USA, 2022; pp. 754–759. [Google Scholar] [CrossRef]
- Link, A.; Ludowicy, J.; Staggat, M. Assessment of a Serial Cooling Concept for HTPEM Fuel Cell Systems for Aviation Applications. In Proceedings of the 33rd Congress of the International Council of the Aeronautical Sciences, Stockholm, Sweden, 4–9 November 2022. [Google Scholar]


Disclaimer/Publisher’s Note: The statements, opinions and data contained in all publications are solely those of the individual author(s) and contributor(s) and not of MDPI and/or the editor(s). MDPI and/or the editor(s) disclaim responsibility for any injury to people or property resulting from any ideas, methods, instructions or products referred to in the content. |
© 2025 by the authors. Licensee MDPI, Basel, Switzerland. This article is an open access article distributed under the terms and conditions of the Creative Commons Attribution (CC BY) license (https://creativecommons.org/licenses/by/4.0/).