
On-Line Process Monitoring for Aero-Space Components Using Different Technologies of Fiber Optic Sensors During Liquid Resin Infusion (LRI) Process †

 ,
,
Abstract
1. Introduction
2. Results
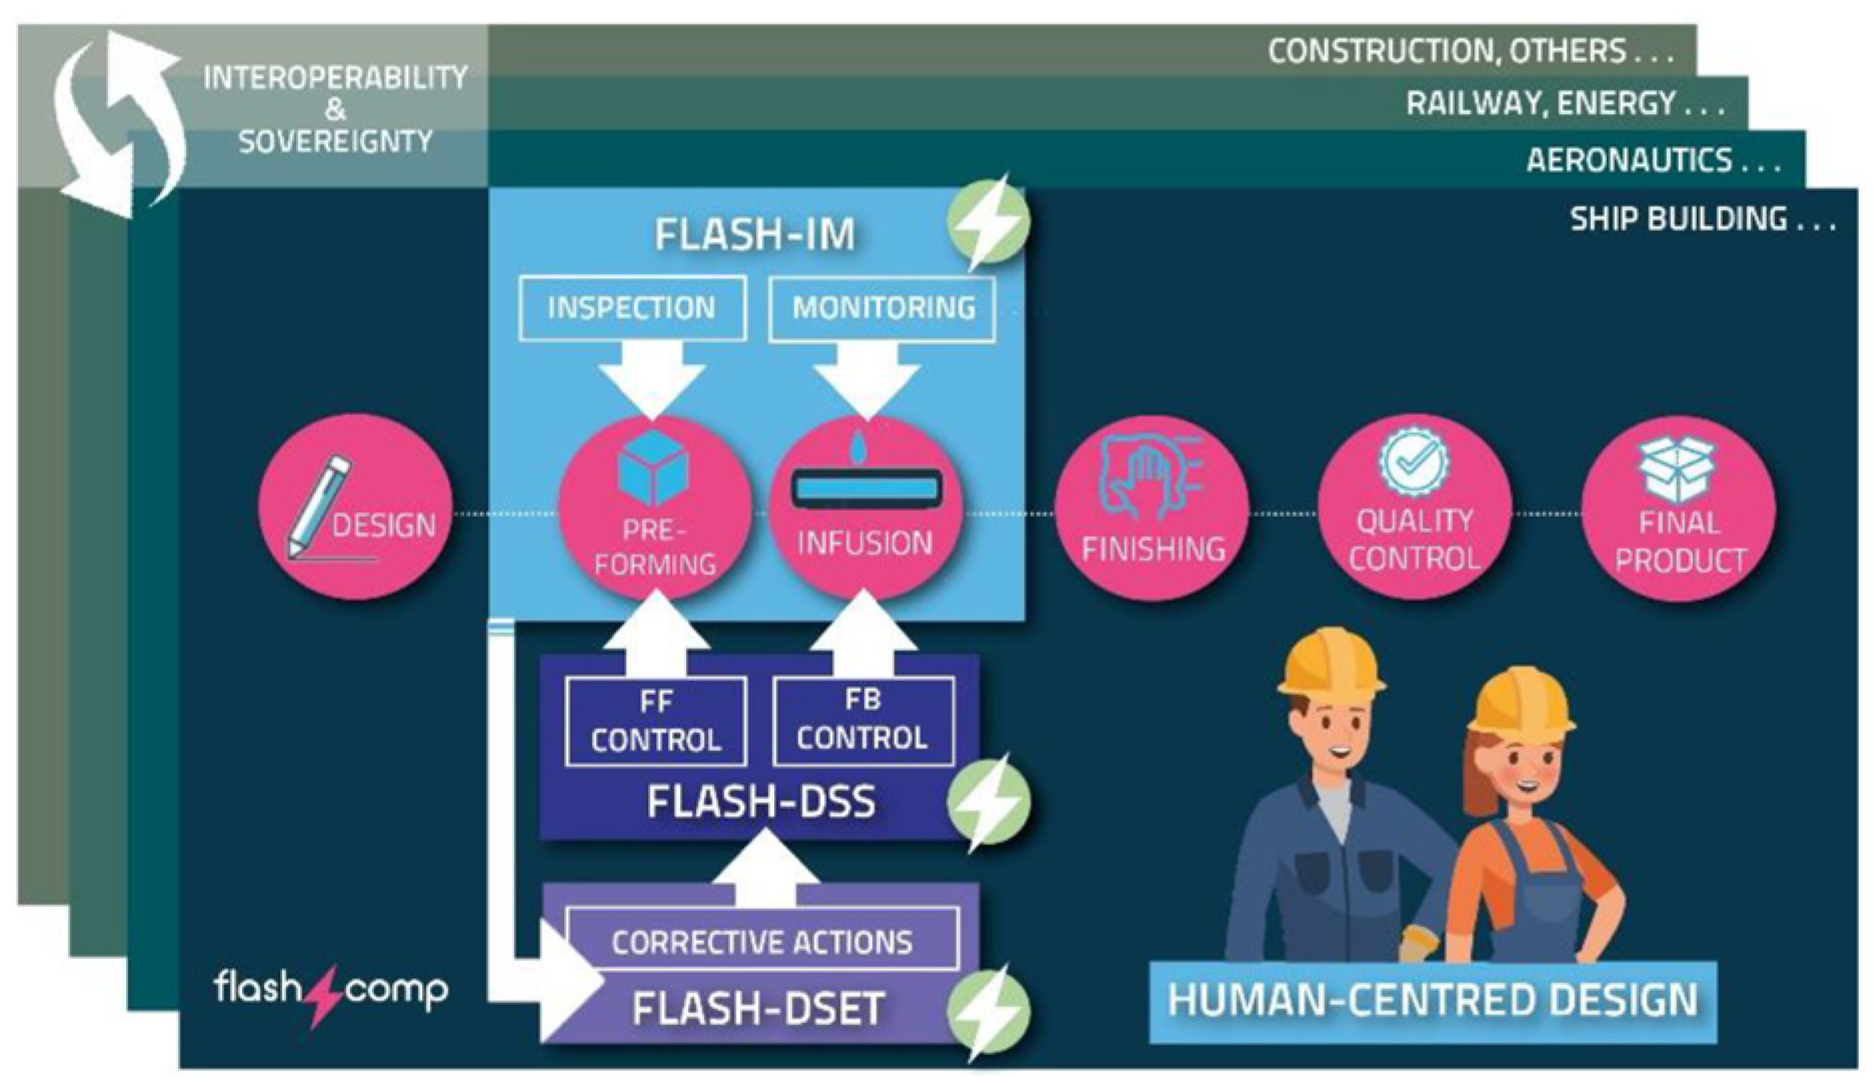
2.1. Background
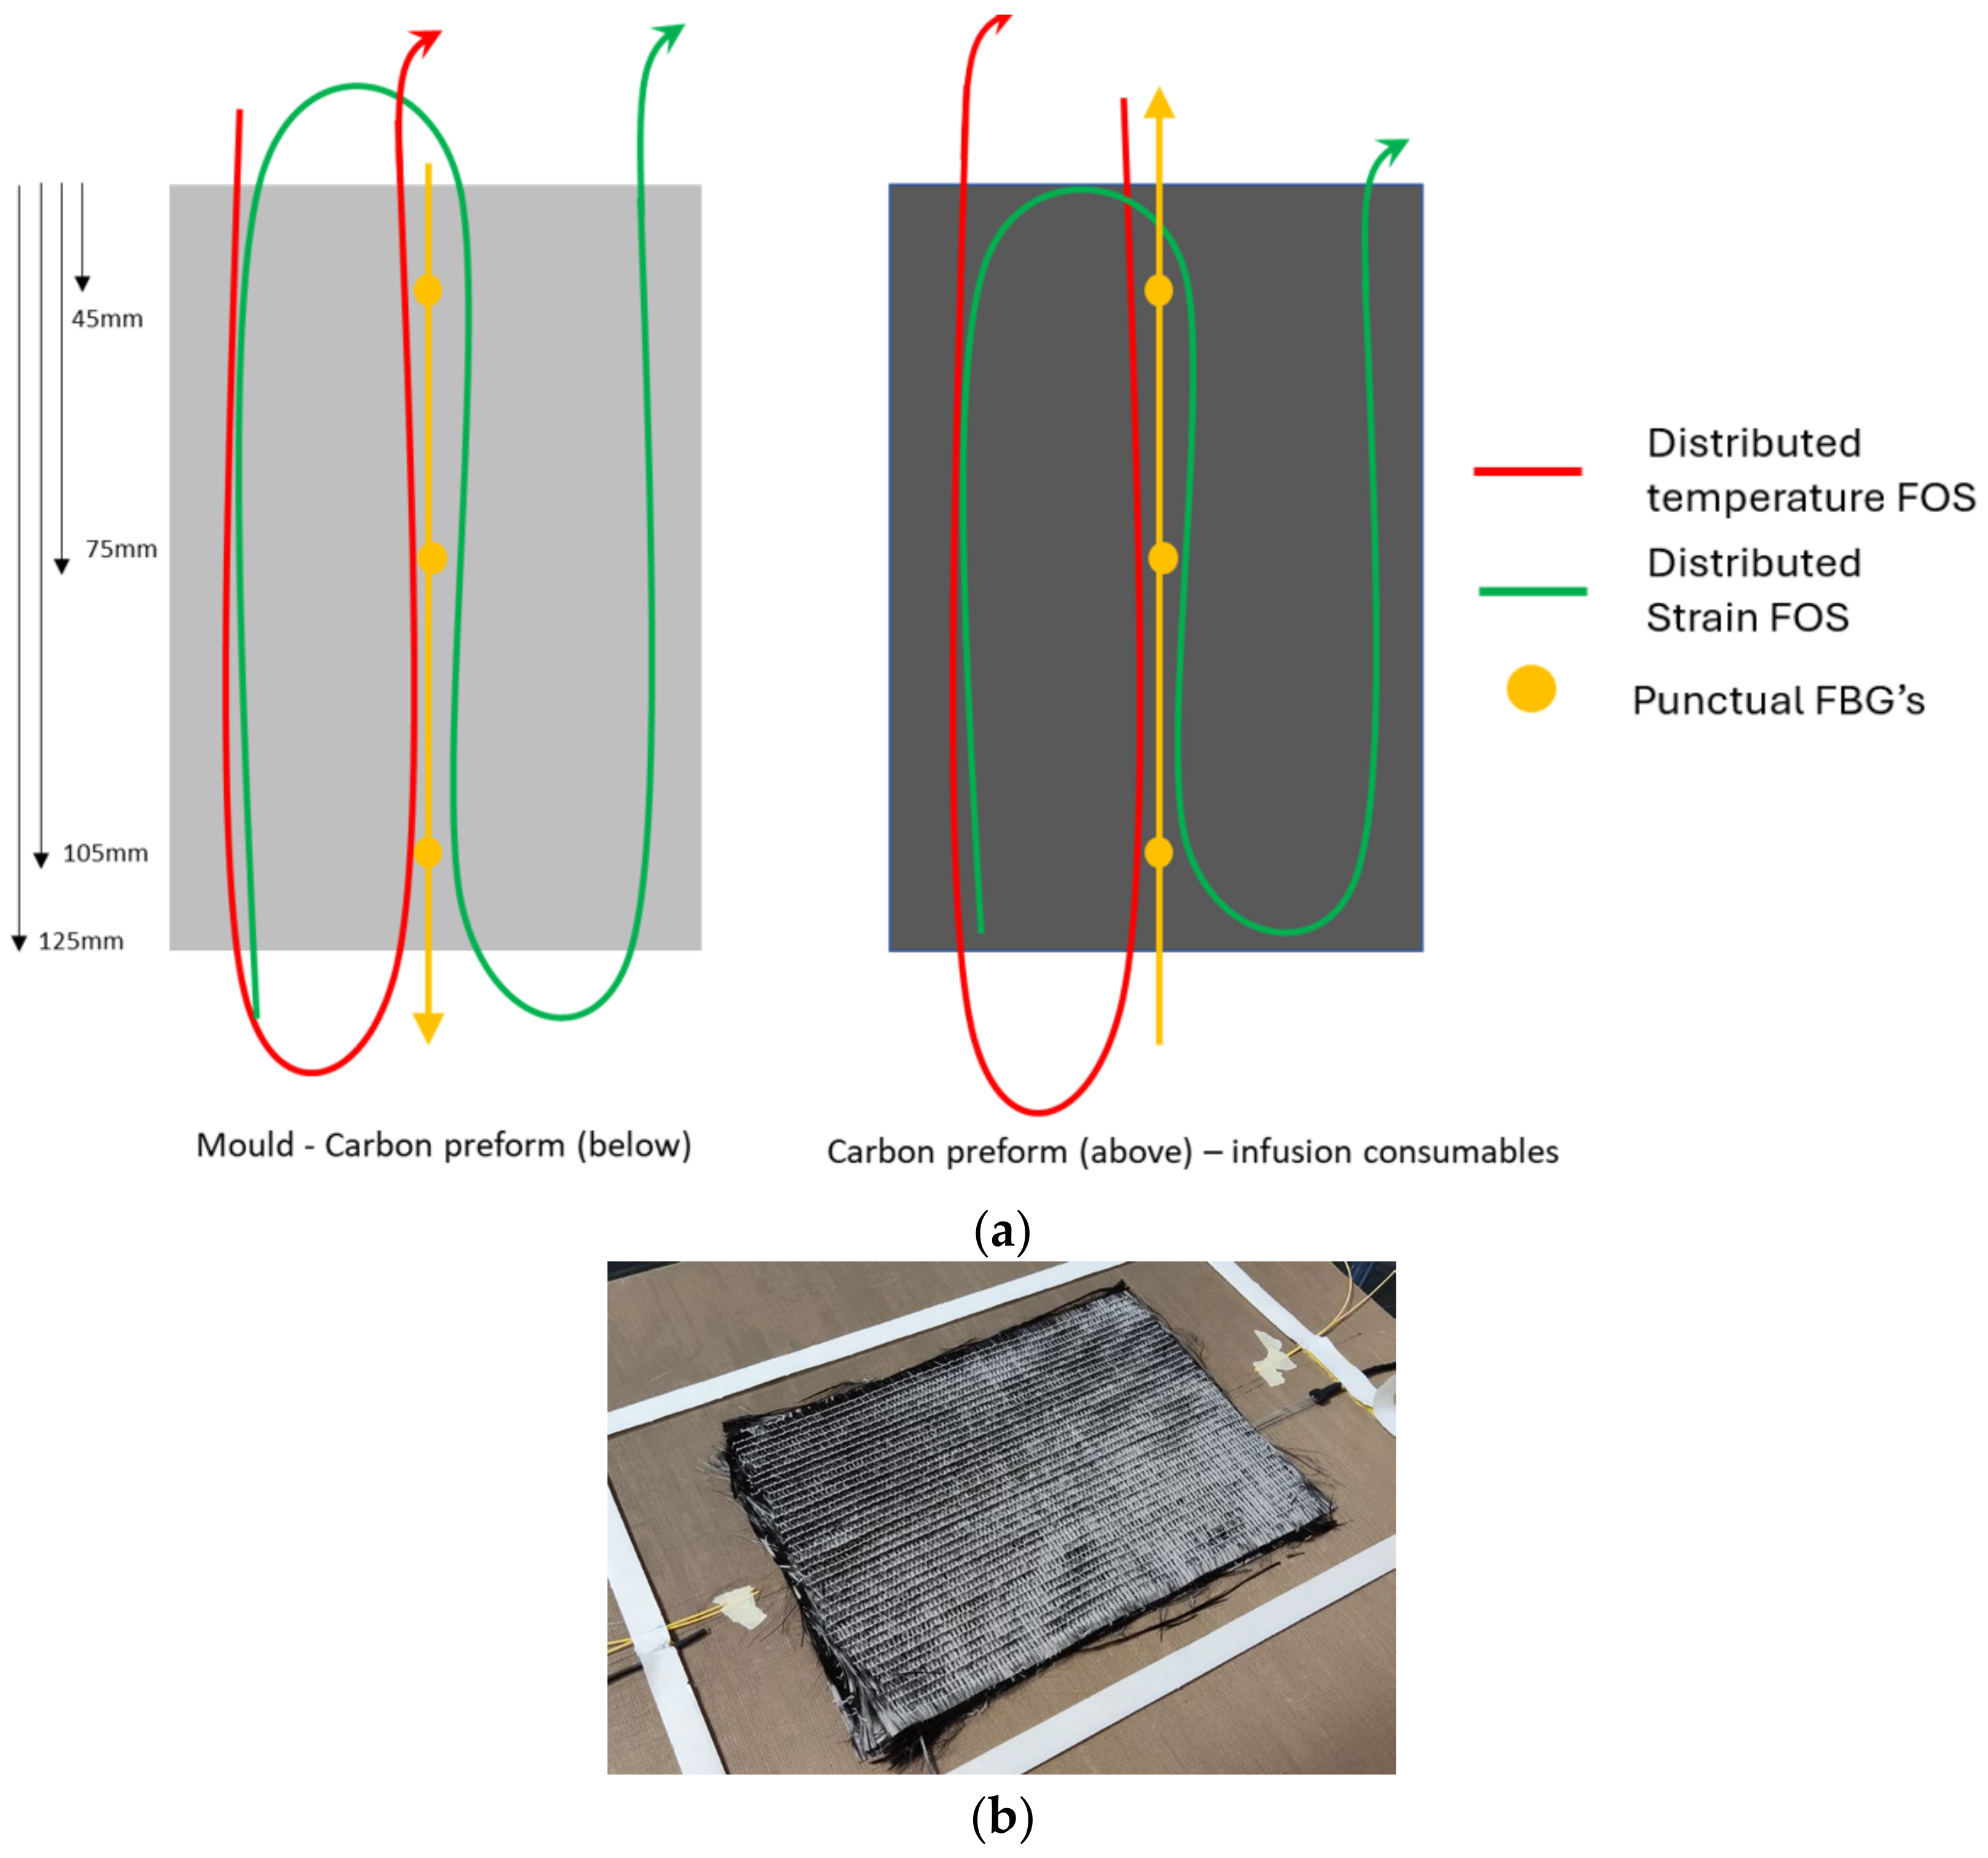
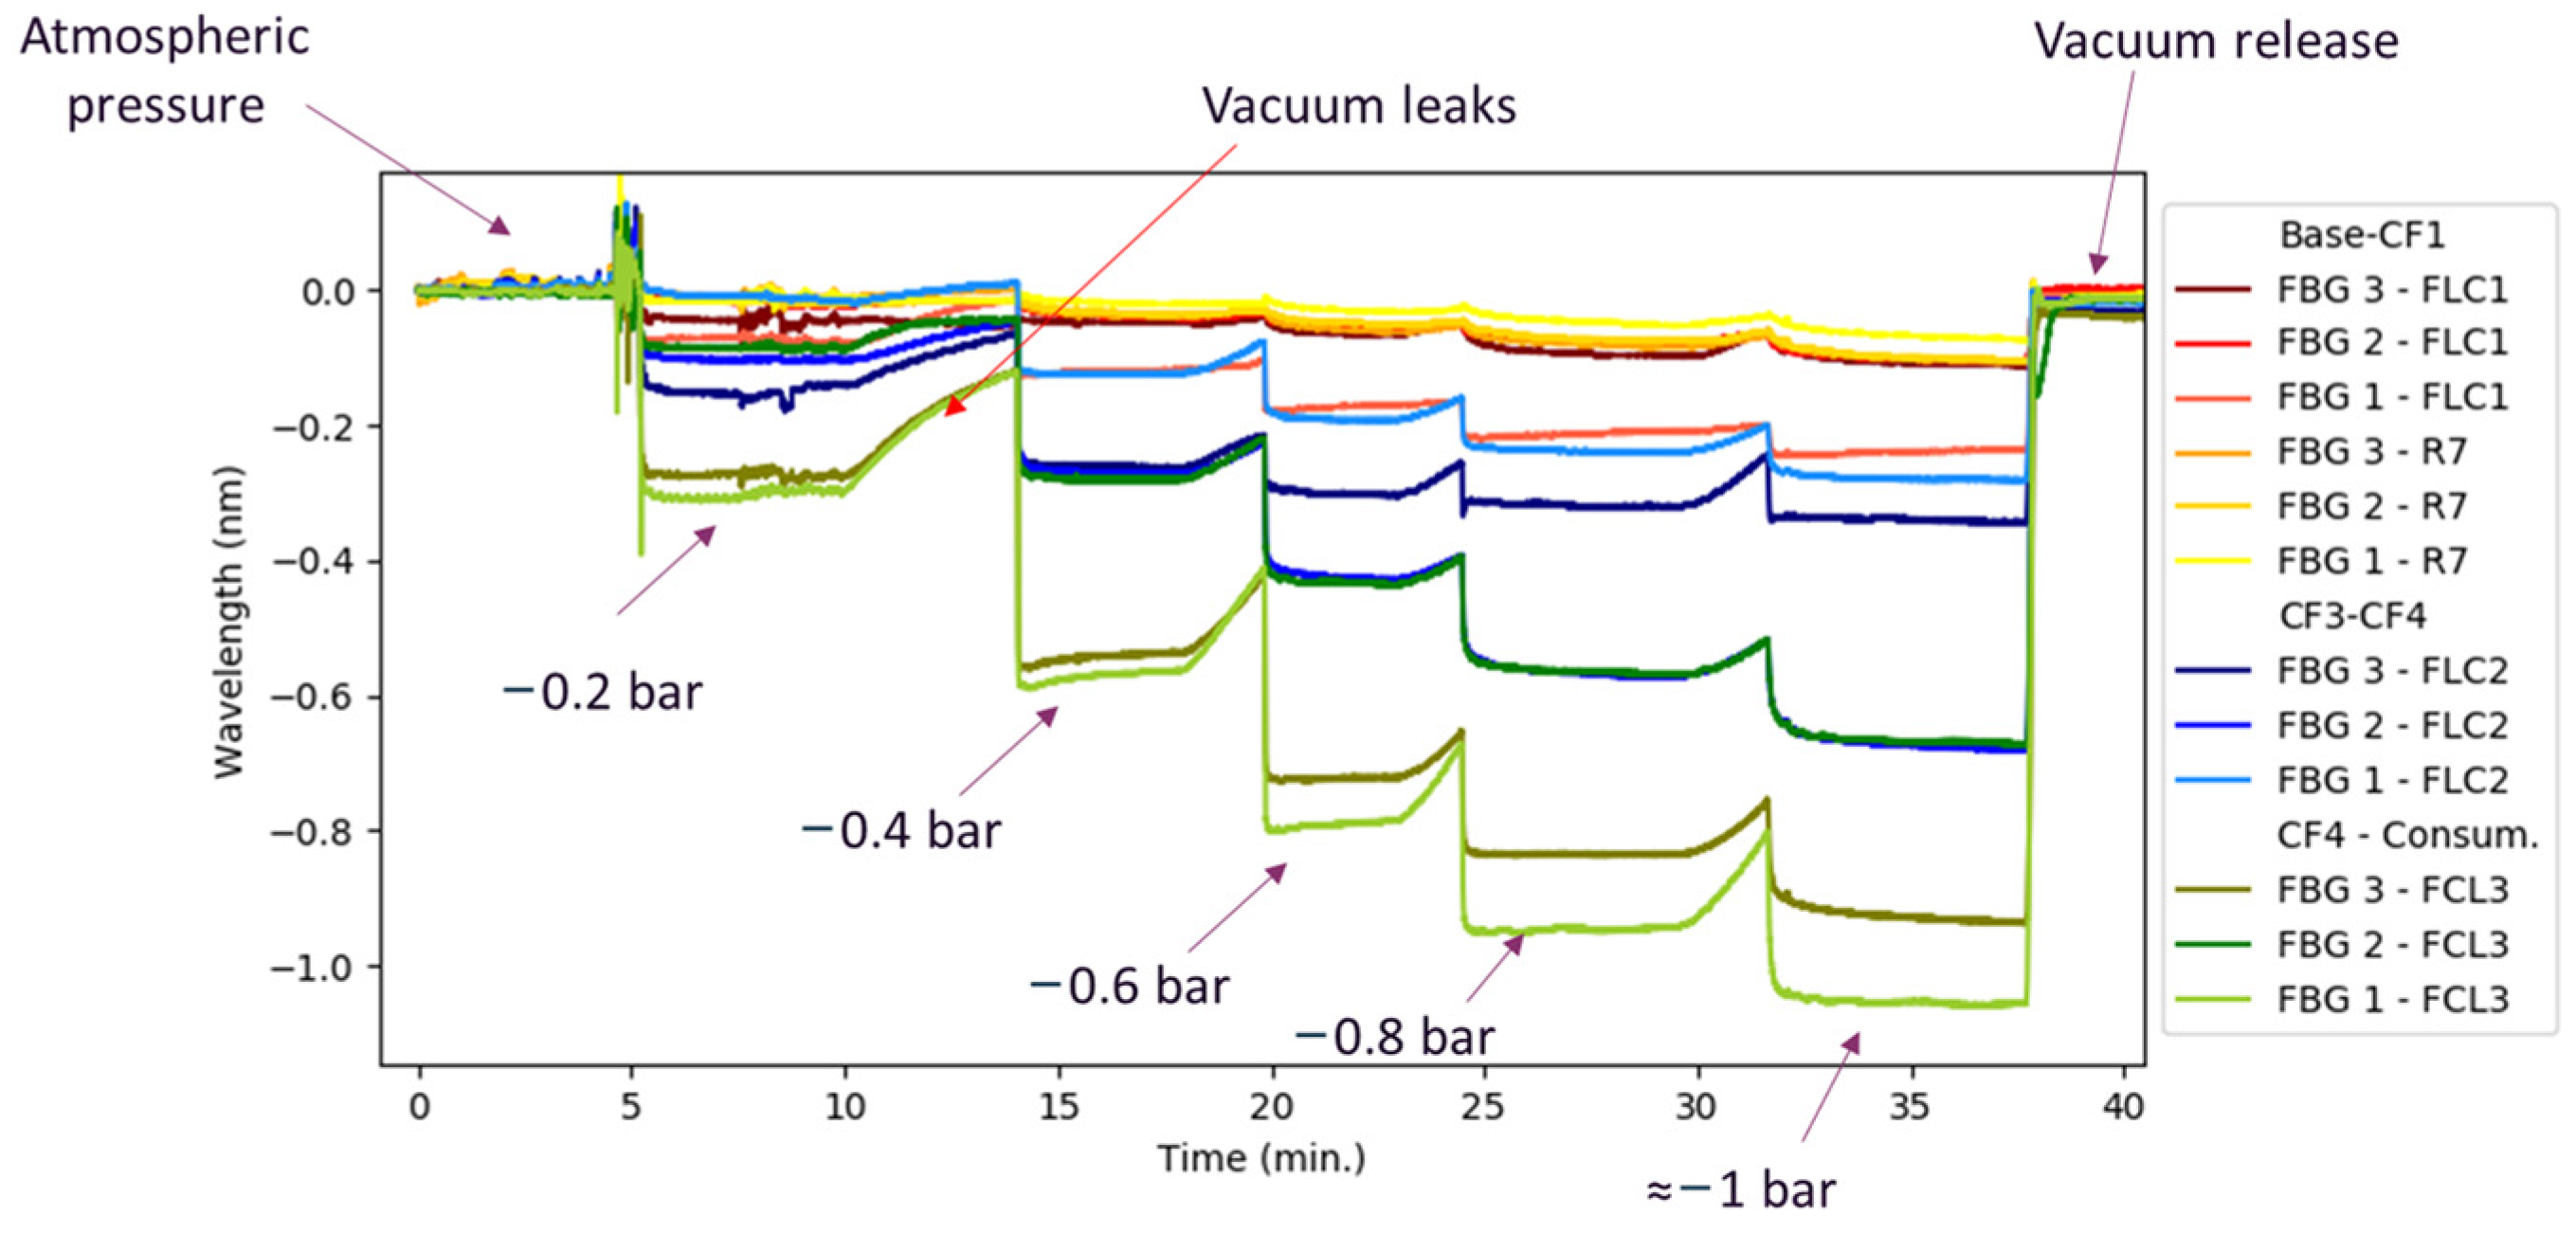
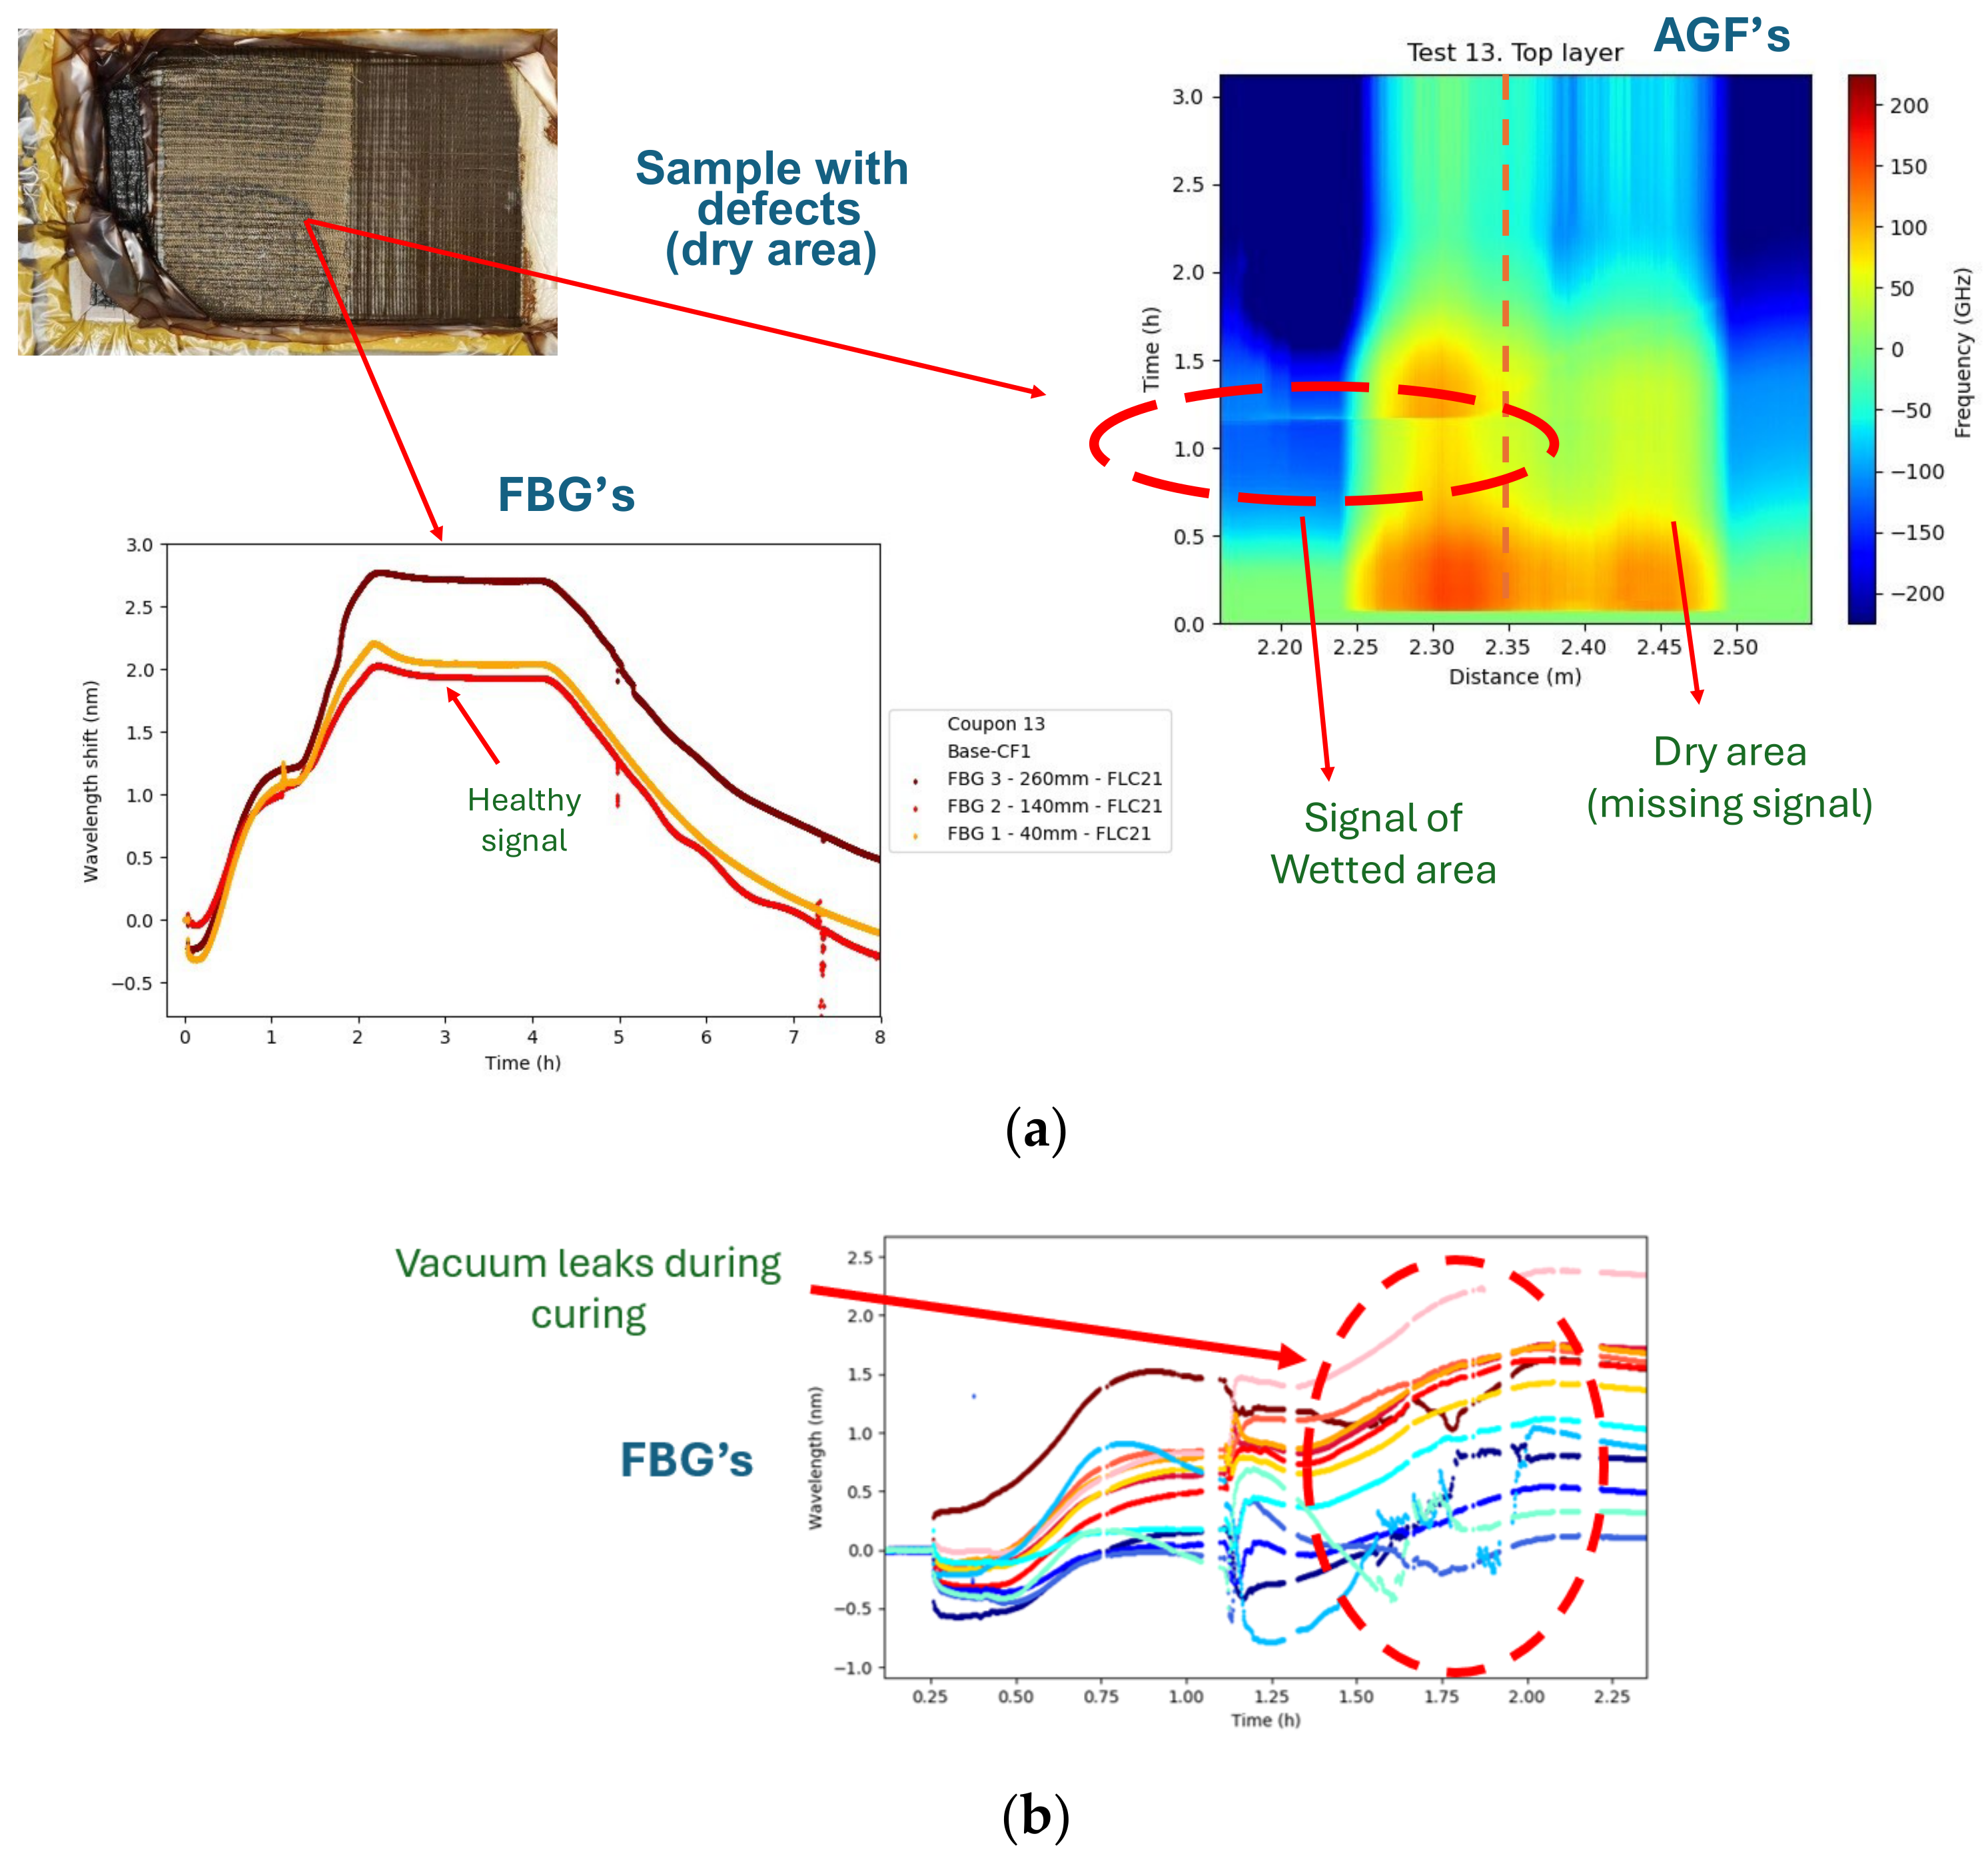
2.2. Use Case and Technical Developments
- One in direct contact with the tooling surface
- One in direct contact with the ancillary materials over the laminate
3. Concluding Remarks and Next Steps
Author Contributions
Funding
Institutional Review Board Statement
Informed Consent Statement
Data Availability Statement
Acknowledgments
Conflicts of Interest
References
- ReportLinker, Composites Market Size, Share & Trends Analysis Report by Product, by Resin, by Manufacturing Process, by End Use and Segment Forecasts, 2020–2027. Available online: https://www.globenewswire.com/news-release/2020/08/06/2074010/0/en/Composites-Market-Size-Share-Trends-Analysis-Report-By-Product-By-Resin-By-Manufacturing-Process-By-End-Use-And-Segment-Forecasts-2020-2027.html (accessed on 6 December 2024).
- Ramakrishnan, M.; Rajan, G.; Semenova, Y.; Farrell, G. Overview of fiber optic sensor technologies for strain/temperature sensing applications in composite materials. Sensors 2016, 16, 99. [Google Scholar] [CrossRef] [PubMed]
- Büyüköztürk, O.; Taşdemir, M.A.; Méndez, A.; Csipkes, A. Overview of Fiber Optic Sensors for NDT Applications. Nondestruct. Test. Mater. Struct. 2013, 6, 179–184. [Google Scholar] [CrossRef]
- Ye, X.W.; Su, Y.H.; Han, J.P. Structural Health Monitoring of Civil Infrastructure Using Optical Fiber Sensing Technology: A Comprehensive Review. Sci. World J. 2014, 2014, 652329. [Google Scholar] [CrossRef] [PubMed]
- Torre-Poza, A.; Pinto, A.M.R.; Grandal, T.; González-Castro, N.; Carral, L.; Rodríguez-Senín, E. Challenges of complex monitoring of the curing parameters in coupons for LRI manufacturing. Incas Bull. 2021, 13, 203–210. [Google Scholar] [CrossRef]
- FLASH-COMP—Flawless and Sustainable Production of Composite Parts Through a Human Centred Digital Approach. CORDIS. Available online: https://cordis.europa.eu/project/id/101058458/results/es (accessed on 29 November 2024).
- FLASH-COMP: Composite Manufacturing, Right First Time. Available online: https://flashcomp.eu.com/ (accessed on 29 November 2024).


| Parameter | FBG’s | AGF’s |
|---|---|---|
| Measurement type | Point sensors (spacing of 4 mm) | Distributed sensors: 1.2–25 mm spatial resolution |
| Acquisition frequency | 1–25 kHz | Up to 60 Hz |
| Price | 20–40 €/sensor | 80 €/m |
| FBG’s | AGF’s | |
|---|---|---|
| Advantages | Simple and reliable Sensitive to vacuum/pressure levels Sensitive to temperature changes Signals can be compared to traditional sensors (temperature, DC curing) | The fiber is sensitive in all the length (reduce amount sensors needed) Sensitive to vacuum pressure, temperature, resin arrival (estimation of dry zones and resin velocity) Possibility to analyze specific zones for process detailing |
| Disadvantages | Measurements at specific points (must be defined) to manufacture the fiber | Generation of big amounts of data (storage, treatment) Expensive compared to FBG’s |
Disclaimer/Publisher’s Note: The statements, opinions and data contained in all publications are solely those of the individual author(s) and contributor(s) and not of MDPI and/or the editor(s). MDPI and/or the editor(s) disclaim responsibility for any injury to people or property resulting from any ideas, methods, instructions or products referred to in the content. |
© 2025 by the authors. Licensee MDPI, Basel, Switzerland. This article is an open access article distributed under the terms and conditions of the Creative Commons Attribution (CC BY) license (https://creativecommons.org/licenses/by/4.0/).
Share and Cite
Cárdenas, C.B.; González, T.G.; Cascajero, A.N.; Rodríguez, M.R.; Lombera, R.R.; Alonso, P.R. On-Line Process Monitoring for Aero-Space Components Using Different Technologies of Fiber Optic Sensors During Liquid Resin Infusion (LRI) Process. Eng. Proc. 2025, 90, 5. https://doi.org/10.3390/engproc2025090005
Cárdenas CB, González TG, Cascajero AN, Rodríguez MR, Lombera RR, Alonso PR. On-Line Process Monitoring for Aero-Space Components Using Different Technologies of Fiber Optic Sensors During Liquid Resin Infusion (LRI) Process. Engineering Proceedings. 2025; 90(1):5. https://doi.org/10.3390/engproc2025090005
Chicago/Turabian StyleCárdenas, Cristian Builes, Tania Grandal González, Arántzazu Núñez Cascajero, Mario Román Rodríguez, Rubén Ruiz Lombera, and Paula Rodríguez Alonso. 2025. "On-Line Process Monitoring for Aero-Space Components Using Different Technologies of Fiber Optic Sensors During Liquid Resin Infusion (LRI) Process" Engineering Proceedings 90, no. 1: 5. https://doi.org/10.3390/engproc2025090005
APA StyleCárdenas, C. B., González, T. G., Cascajero, A. N., Rodríguez, M. R., Lombera, R. R., & Alonso, P. R. (2025). On-Line Process Monitoring for Aero-Space Components Using Different Technologies of Fiber Optic Sensors During Liquid Resin Infusion (LRI) Process. Engineering Proceedings, 90(1), 5. https://doi.org/10.3390/engproc2025090005