Abstract
This paper presents the results of a testbench regarding the effects of liquid water content in the turbine stage of a fuel-cell charging system. The testbench simulates the exhaust conditions of a PEM fuel cell to evaluate erosion potential in a single-stage aluminum turbine and assess the effectiveness of liquid water separators. Key factors such as changes in turbine geometry and performance were analyzed. Erosion influence to low-cycle fatigue potential is assessed via eigenfrequency measurements. Turbine stage-efficiency measurements are used to calculate the thermodynamic impact of erosion. Three-dimensional scanning, eigenfrequency measurements, and performance map calculations showed a 5.4% crater-to-blade thickness change, <0.6% frequency shift, and finally, a <0.1% change in efficiency, indicating that erosion remained at the incubation stage. Centrifugal separators showed superior performance compared to mesh types. The hardest aspect of the work was to minimize measurement error.
1. Introduction
This study examines the impact of liquid water in the exhaust of a PEM fuel cell on the turbine in a fuel-cell charging system, as well as the role of liquid water separators in shaping the turbine’s exhaust boundary conditions.
ICEs have historically powered modern society, finding use in transportation, power generation, and construction, but they emit harmful pollutants like VOCs, NOx, and COx [1]. The growing need for cleaner and more efficient alternatives has turned attention to fuel cells, particularly PEM and Solid Oxide fuel cells, which offer a viable replacement for ICEs in medium-to-large vehicles, auxiliary power units in aircraft, and stationary power-generation systems over 150 kW.
To increase their efficiency, fuel cells require compressed air on the cathode side, and adding a turbine stage further enhances system performance [2,3]. The optimal architecture for a PEM charging system combines a single-stage compressor and turbine, driven by a high-speed PM electric motor [4]. This design is favored for its thermal and dynamic stability [5,6]. The primary objective of this research is to define the turbine inlet-boundary conditions and quantify the effects of erosion, while evaluating the effectiveness of liquid water separators in mitigating this risk.
While erosion in radial or mixed-flow turbines is not well studied, the recent literature [7] and CFD analyses have begun to address this gap, helping to predict erosion patterns based on experimental data [8]. In this research, CFD models are used alongside experimental methods to assess erosion risk and identify affected areas. Due to the complexity of predicting erosion behavior, experimental validation is necessary. In the test setup described by the authors [9], liquid water is injected and atomized at the turbine inlet to induce specific particle distributions, and erosion is measured through 3D scanning, eigenfrequency measurements, and performance mapping.
Erosion behavior progresses through six stages: incubation, acceleration, maximum rate, deceleration, and terminal stage. During incubation, minimal erosion occurs, marked by slight surface roughness changes. The acceleration stage sees material removal increase, peaking at the maximum rate stage before deceleration begins, ultimately reaching a constant material removal rate in the terminal stage [10]. Key factors affecting erosion include impact speed, angle [11], droplet size [12], shape [11], and material properties [13]. Erosion in the chaotic environment of a radial turbine is highly sensitive to these environmental factors, with impacts between droplets or the surrounding environment altering final collision dynamics. Custom algorithms, tailored for each turbine design, are essential and based on experimental data [11].
Although the causes of erosion are well understood, accurate prediction still relies heavily on experimental data. Trends in material behavior under erosive conditions are documented in the literature [14], but calculating precise energy transfer during impacts remains a challenge [15]. Predictive algorithms and detailed calculations and procedures, while informed by historical data [11,16], must be experimentally validated due to the introduction of new materials and flow characteristics. Ultimately, experimental validation is crucial for verifying product performance and ensuring durability in real-world applications.
2. Materials and Methods
The analysis and testbench setup for this study is fully developed and explained in the authors’ previous work [9]. A general overview of a classical turbocharger is shown in Figure 1. A classical hot-gas testbench for investigations on classical turbochargers consists of two main control units. One for controlling the compressor operation point via the Compressor Back-Pressure Unit throttle valves, and one for controlling the turbine operation point via turbine inlet mass-flow and turbine inlet temperature, named the hot-gas generator. In addition, secondary equipment such as an Oil and Water Conditioning Unit, Suction Air Conditioning Unit and, finally, the test-cell Air Handling Unit are all needed to control the operation conditions for given testing specifications. For the experiments described in this paper, an electrical heater instead of a natural gas burner was used as the hot-gas generator. This allows the turbine inlet temperature to achieve the usual range of exhaust gas temperature found in PEM fuel-cell exhausts, of 70 °C. In Figure 1, the experimental setup is presented. A glass pipe before the turbine inlet is placed for visual inspection of the droplet content and formation, while the turbocharger and additional piping is present. The compressor and turbine flow paths is represented by the white arrows.
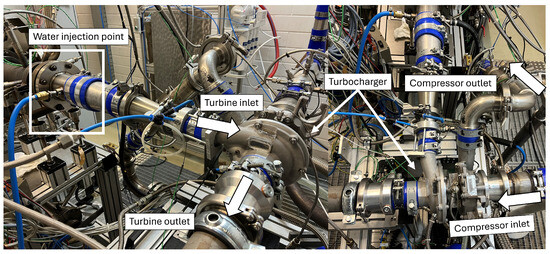
Figure 1.
Turbocharger erosion setup with camera and clear glass equipment.
To allow for investigations of erosion on the turbine wheel by water droplets, a water injection system was introduced between the hot-gas generator and the turbine stage. The injection unit was used to inject specific amounts of water and air into the flow by a two fluid nozzle. A more detailed description of the testbench setup is given in the authors’ previous work [9].
It is vital to mention that the original ETC [3] is not utilized in this research due to the high cost, extreme danger of high voltage, and the scarcity of the prototype unit. A modified classical turbocharger is used to accept the aluminium wheel of the ETC. This drastically increases safety and serviceability while reducing experimental costs.
Erosion can have huge system-level implications, for example, a decrease in efficiency or work gained through gas expansion, vibration instability, an inability to withstand overspeed or, ultimately, catastrophic failure. To identify other, not as easily identifiable implications, an existing failure mode and effects analysis FEA was used. Using this FEA, the three most important failure modes are determined as:
- (1)
- Reduced durability of TW via stress increase due to material removal or displacement indicated by 3D scanning.
- (2)
- Decreased durability of TW by altered dynamic behaviour.
- (3)
- Decrease in turbine efficiency.
Each aspect of the above can be investigated and quantified. Firstly, 3D scanning is used to generate a 3D file from the newly machined and later from the eroded turbine wheel. The dimensional error introduced via this method when accounting for the wheels’ size is a few microns. To cross-validate the measuring accuracy of the 3D scanner, a profile measuring instrument is used to capture the profile of the eroded areas of the wheel. The measured profile is then matched to the blade geometry measured from the scanner. The comparison between the turbine-wheel 3D geometry before and after the water erosion test was used to identify the first affected areas at which material was removed or displaced.
Secondly, the blade’s natural frequency (eigenfrequency) is directly linked to the geometry of the machined wheel. The wheel or blades are not fixed to allow for free vibration. Two of the blade eigenfrequencies are measured with a microphone and excited with a calibrated hammer (hammer test), with each frequency inspecting a different blade mode. Mode 1 is related to the trailing-edge vibration, while mode 2 is relevant to the leading-edge tip vibration. This test is completed five times to increase confidence in the results for each blade. Finally, all of the blades are excited to achieve a holistic result and also measure the differences in the wheel. After excitation, the data is post-processed via FFT with the peak indicating the eigenfrequency. The difference between modes provides us with the difference between the blade leading- and trailing-edge erosion, meaning that a shift in frequency is directly related to the integrity of the blade. There are no strict guidelines for the eigenfrequency, the only parameter that must be taken into account is that erosion should not move the eigenfrequency to the excitation range of system operation. In conclusion, the altering or weakening of the blade geometry is linked to the eigenfrequency change. Lastly, the turbine efficiency is determined by the ratio of the compressor power and turbine power [17], at 70 °C turbine inlet temperature.
For the liquid-water-separator characterization, the important testbench section is the hot-gas generator. The air and water experiments were completed in hot and cold conditions, meaning air and water-flow temperatures of 22 °C and 70 °C. The temperature of the main air-mass flow is controlled by electric heaters with an assortment of thermocouples measuring the temperature field downstream, before the separator. Pressure transducers are also placed in the same measuring point (in space). Four orifices are also positioned radially in a 90°pattern that is later connected in a single line and fed to a thin-filmed piezo pressure transducer. This measurement station also appears in Figure 1. The volume-flow measurements are completed at the e-heater’s inlet.
In order to introduce water content in the separator path, a mixed-flow nozzle (water and air under pressure) is used. Before the mixture is injected, water and air flow are measured along with their temperature. Type K thermocouples are also used here, same as the measuring stations. The choice of thermistors would yield a more accurate measurement, but due to the lack of present amplifiers, thermocouples were chosen.
To quantify variables such as escaping water and air through the drain hole, two more volume-flow meters are necessary; again, one for air and one for water. Schematics of the testbench coupled with the measuring points appear at [9].
3. Results
Liquid water separators can be to protect the aluminium turbine stage from potential erosion. Erosion due to liquid water impingements is extremely well documented [18] and should be avoided at all costs in a machine that is set to never be opened. Due to the nature of PEM fuel cells, liquid water content is present in the exhaust. Liquid water is present in the flow due to the low temperatures and pressures of the air, sometimes completely saturated, and sometimes due to condensation downstream of the turbine blade passage due to flow property changes from the enthalpy exchange.
Generally, to asses the performance of liquid water separators, pressure drop or performance map impact and also liquid water content after exiting are the quantities that directly influence the turbine stage. The pressure drop has an impact on the turbine performance map; the water content on the integrity of the wheel.
The main air-mass flow correction is carried out so that each different test, by season, day, atmospheric conditions, etc., can be compared witch each other and that some lab conditions of the manufacturer can also be included.
Tests showed that the pressure drop between separators was extremely similar. A slightly less aggressive pressure-drop gradient appears on the mesh-type separator, meaning that at higher values of corrected air-mass flow, a smaller pressure drop appears. To asses the impact of the separators at the turbine stage, the worst-performing separator was chosen—the centrifugal separator, which also causes a swirl in the flow as a function of separation.
The performance map seen in Figure 2 is corrected to account only for the induced swirl and not for the pressure drop, due to the separators’ pressure-drop tendencies being ever so similar, as seen by Figure 3. The performance map impact is <1% of efficiency in regards to pressure ratio as seen by Figure 2, and therefore the swirl impact from the centrifugal separator is minimal.
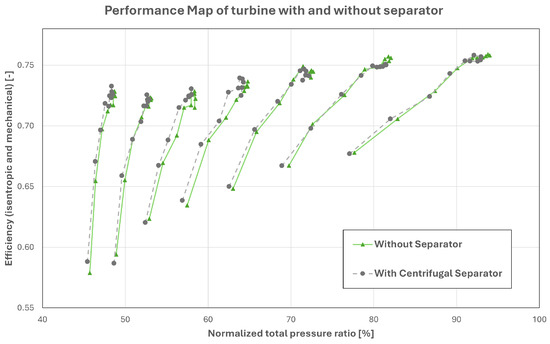
Figure 2.
An efficiency map of the turbine stage impacted by the water separators. Due to the poorer performance of the centrifugal-type separator, it is chosen for the performance map impact. It appears that for the same efficiency (isentropic, including mechanical), a higher pressure ration is observed at the turbine stage without the separator.
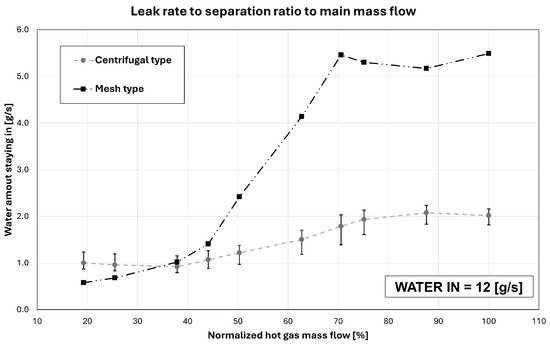
Figure 3.
The liquid water separation ability of the centrifugal and mesh-type separators. The error bars represent the difference escaping air has on the centrifugal separator; the mesh type does not leak air. It appears that after 40% of the normalized hot-gas flow, the mesh-type separator performs extremely poorly with the centrifugal type, with consistent water-content removal.
To quantify the effectiveness of the liquid water separator, the quantity of the liquid water being left in the exhaust of the separator is used. The centrifugal separator is greatly influenced by air escaping through the drain orifice, while the mesh-type separator develops less than 1% of leaking air at all operation points and does not require this air to increase the separation level. Air escaping through the drain hinders the turbine output power and must be limited at all costs. Figure 3 shows the water content after the separator appears, while also visibly indicating the effect the air escaping through the orifice has. In Figure 3, the points are a mean value of the combined escaping air influence and not a specific value. Values smaller than 150 kg/h of the main air-mass flow are not present, since the turbocharger cannot spin at lower values. The measurements were carried out with 10 g/s of liquid water at the nozzle. Figure 3 shows that the centrifugal separator achieves a minimum of 1 g/s of water content being left in the exhaust at the minimum main air-mass flow and a maximum of almost 3 g/s for mass flows above 500 kg/h. Also, the escaping air ranges from 2% to 4%. The best overall behaviour of the centrifugal separator appeared to occur at 2.5% escaping air. Since the escaping air is low, it does not significantly affect the turbine power.
The mesh-type separator shows that for low main air-mass flows kg/h, the water content after it is extremely low. The tipping point occurs above 400 kg/h, where the water content increases drastically with minimal separation taking place. The low separation at high air-mass flows indicates a greater problem with erosion protection: at higher mass flows, the impact speeds of the water content increase; therefore, more water droplets entering the volute may theoretically contribute to greater erosion.
In conclusion, it is apparent when comparing the two separators that the centrifugal separator type outperforms the mesh-type separator.
The goal of the testbench was also to induce erosion on a turbine wheel from a fuel-cell charging system. CFD simulations seem to agree with the literature that erosion in radial inflow turbines appears at similar areas of the turbine [7,19] and volute [10]. The liquid water content was selected to match the worst possible operating point of the worst liquid water separator.
The developed erosion pattern was similar to the incubation stage of erosion, resulting mostly in a change in roughness, an approximately 0.1 mm roughness change.
Since the experiments were mainly conducted at a constant rotational speed, at the highest probable erosion conditions, the erosion marks and patterns presented at the same spot every time, more specifically at the tip of the LESS. The erosion impact appeared to decrease when moving closer to the hub of the wheel, while increasing when moving axially outward.
CFD simulations reveal the possibility of erosion at the TEPS [19]. Although droplet impacts were suspected to appear at this area, no erosion was uncovered. Since no erosion was noticed at the TEPS, it is safe to assume that no condensation happens at the blade path, and if it occurs, it is not enough to cause erosion.
Finally, to investigate the impact of wet or dry erosion [20], different liquid water contents where assessed at the worst probable erosion rotational speed.
To quantify the regions where material removal or displacement takes place, 3D scanning of the whole wheel was completed. All the scans were performed independently of each wheel, meaning that each eroded wheel was compared to itself before the experiments, after machining. No computer-generated models were used, so that machining differences between wheel and the computer-generated model are accounted for. To measure specific erosion-affected areas but also validate the 3D scanning data, a profile-measuring instrument was used to capture the contour of the eroded surface.
It was noticed that the trailing edge alongside the trailing-edge tip, and finally the surface parallel to the housing near the trailing edge, was damaged. The damages or displacements were attributed to a momentary bearing failure due to water creeping into the oil system, thus resulting in an impact of the wheel with the housing.
As mentioned before, the lack of erosion damage on the trailing-edge-pressure side suggests that no condensation happens downstream of the turbine [8,19]. This statement is also reinforced by the lack of a pattern at trailing edge. Although some areas appeared to have a displacement as seen by Figure 4, it is highly unlikely that this from erosion. As already mentioned, it is suspected to be a result of the impact. Finally, a few large areas appear to be displaced from the newly machined wheel scan. These areas are thought to be deposits from a reaction between the de-ionized water and the aluminium; this is also reinforced by the uniformity that these areas present and the large surface area they occupy.
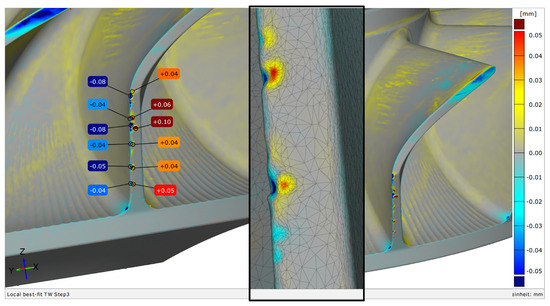
Figure 4.
Three-dimensional scanning results showing crater size comparable to wheel thickness and areas affected. Material displacement is indicated with a negative and positive legend, showing that material removal is scarce.
The damage that is attributed to erosion is present mainly on the LESS, with very small impact craters appearing at the pressure side near the fillet that joins the hub to the blade. The reason behind erosion only appearing near this area might be due to the liquid water particles not being able to follow the sharp paths of the air through the blades [7,8]. The erosion present at the LESS seems to mainly manifest as material displacement and not removal; this was expected, due to the ductile nature of aluminium [21].
To assess the blade integrity, eigenfrequency measurements were completed outside the test cell, and compared with turbine states to measure potential frequency shifts that might occur due to material loss or displacement. Potential frequency change is a result of stiffness or material distribution change in the blade, and therefore, erosion.
As seen by the 3D scanning, most of the erosion appears to be at the leading edge; this might result in a reduction in the blade area, therefore reducing the stiffness of the blade. It is then expected that the natural frequency be reduced. After testing, the natural frequency increases for the blades. This result could be attributed to the impact between the wheel and the volute; the severity of the impact is visible in Figure 4. Since the difference of the eigenfrequency is extremely small (<0.6%), it can confidently be attributed to neither erosion nor impact but measurement uncertainty. It can be stated that the structural impact of the wheel is not affected by erosion, and the notable changes in measurements are mainly a function of uncertainty.
Finally, the efficiency (total to static isentropic with mechanical) of the turbine stage is also evaluated in this publication. The turbine efficiency is calculated in regards to the compressor efficiency and the bearing efficiency to include all the work that is being consumed. The literature [9,17,22,23] strongly suggest that holistic measurements such as efficiency suffer from a great deal of error and uncertainty. It is therefore expected that the measurement uncertainty is placed at a value near 1.5–2% for our application.
The efficiency measurements appear to have a deviation of 0.1% from newly machined to eroded sample. It can confidently be assumed that this deviation between measurements is not due to erosion but induced errors from measurement. This outcome is extremely important, because it reinforces that the systems’ performance is not harmed by liquid water erosion. Therefore, the addition of a turbine will assist with power consumption reduction even after completing endurance testing.
4. Conclusions
In this publication, the results from a modified conventional hot-gas turbocharge testbench are presented. This modification was carried out in order to accept water injection in the main air-mass flow. The goal of the investigation was to induce erosion and validate how much erosion would happen alongside the characterization of liquid water separators. Measuring system-level changes from small changes in the turbine blade geometry with minimal error was the biggest challenge.
- Quantifying the liquid water effectiveness, the centrifugal-type water separator remains consistent throughout the whole operating range of the turbocharger mass flow requirements, with a maximum (worst combination of all factors) of 3 g/s liquid water being left after the separator at 20 g/s and 10 g/s liquid water at the inlet.
- Erosion experiments indicated that the turbine wheel remains in the incubation period indicated by the roughness change spotted during the 3D scanning shown in Figure 4, posing no immediate threat of altering the mechanical stresses on the blades. Eigenfrequency measurements appear to result in almost no change, with the same being present in the performance map calculations.
Concluding from the test results, centrifugal water separators tend to have a better stability of main air-mass flow in respect to liquid water content remaining than mesh-type separators. Since the turbine wheel showed minimal damage to the water injection experiments, it is expected to not reveal any implications in the complete lifetime of the system.
Author Contributions
Conceptualization, G.K. and S.K.; methodology, G.K. and S.K.; validation, S.K. and G.K.; formal analysis, G.K. and S.K.; data curation, G.K. and S.K.; writing—original draft preparation, G.K.; writing—review and editing, S.K.; project administration, S.K.; supervision, G.I. and A.K. All authors have read and agreed to the published version of the manuscript.
Funding
The authors are grateful for the financial support under research grant 19/21046A provided by the Federal Ministry for Economic Affairs and Climate Action on the basis of a decision by the German Bundestag. The authors are responsible for the content of this publication.
Institutional Review Board Statement
Not applicable.
Informed Consent Statement
Not applicable.
Data Availability Statement
The data presented in this study are available on request from the corresponding author due to confidentiality.
Conflicts of Interest
Authors G.K., S.K. and G.I. were employed by the company IHI Charging Systems International GMBH. The remaining authors declare that the research was conducted in the absence of any commercial or financial relationships that could be construed as a potential conflict of interest.
Abbreviations
The following abbreviations are used in this manuscript:
| CFD | Computational Fluid Dynamics |
| ICE | Internal Combustion Engines |
| LESS | Leading-Edge-Suction Side |
| PEM | Proton Exchange Membrane |
| TEPS | Trailing-Edge-Pressure Side |
| TW | Turbine Wheel |
References
- Mukhitdinov, O.; Urinboyeva, S.; Toshpulatov, M. Pollution of Air with Exhaust Gases of Internal Combustion Engine (Ice) Vehicles and Actions to Reduce Their Toxicity. Acta Turin Polytech. Univ. Tashkent 2018, 8, 110–115. [Google Scholar]
- Yan, Q.; Toghiani, H.; Causey, H. Steady state and dynamic performance of proton exchange membrane fuel cells (PEMFCs) under various operating conditions and load changes. J. Power Sources 2006, 161, 492–502. [Google Scholar] [CrossRef]
- Filsinger, D.; Ehrhard, J.; Kuwata, G.; Ikeya, N. Electric turbocharger for fuel cells—IHI’s contribution to sustainable mobility. In Proceedings of the FC³ Fuel Cell Conference, Chemnitz, Germany, 31 May–1 June 2022; Available online: https://nbn-resolving.org/urn:nbn:de:bsz:ch1-qucosa2-764383 (accessed on 10 September 2023).
- Filsinger, D.; Kuwata, G.; Ikeya, N. Tailored centrifugal turbomachinery for electric fuel cell turbocharger. Int. J. Rotating Mach. 2021, 2021, 3972387. [Google Scholar] [CrossRef]
- Walton, J.F., II; Tomaszewski, M.J.; Heshmat, C.A.; Heshmat, H. On the Development of an Oil-Free Electric Turbocharger for Fuel Cells. In Proceedings of the ASME Turbo Expo 2006: Power for Land, Sea, and Air, Barcelona, Spain, 8–11 May 2006; Available online: https://asmedigitalcollection.asme.org/GT/proceedings-pdf/GT2006/42401/395/4569706/395_1.pdf (accessed on 15 August 2023).
- Ismagilov, F.; Vavilov, V.; Miniyarov, A.; Urazbakhtin, R. Super high-speed electric motor with amorphous magnetic circuit for the hydrogen fuel cell air supply system. Int. J. Hydrogen Energy 2018, 43, 11180–11189. [Google Scholar] [CrossRef]
- Clevenger, W., Jr.; Tabakoff, W. Erosion in Radial Inflow Turbines. Volume 4: Erosion Rates on Internal Surfaces; Technical Report; Hydronautics, Incorporated: Washington, DC, USA, 1975. [Google Scholar]
- Tim, W.; Sebastian, L.; Christoph, B.; Jens, F. Investigation of water droplet erosion in the radial turbine of a fuel cell turbocharger. In Proceedings of the Global Power and Propulsion Society, Xi’an, China, 18–20 October 2021; pp. 18–20. [Google Scholar]
- Karaksis, G.; Kunze, S.; Iosifidis, G.; Kalfas, A. Development of a Test Stand for Electric Fuel Cell Turbocharger Integrity Testing, Part-1 Setup. In Proceedings of the Measuring Techniques in Turbomachinery, Larnaca, Cyprus, 29–30 April 2024; pp. 1–9. [Google Scholar]
- Thiruvengadam, A. Handbook of Cavitation Erosion; Technical Report; Hydronautics, Incorporated: Washington, DC, USA, 1974. [Google Scholar]
- Pouchot, W.; Kothmann, R.E.; Fentress, W.K.; Heymann, F.J.; VarlJen, T.C.; Chi, J.; Milton, J.D.; Glassmire, C.M.; Eyslinger, J.A.; Desai, K.A. Basic Investigation of Turbine Erosion Phenomena; Machine Elements and Processes; NASA: Washington, DC, USA, 1 September 1971. Available online: https://ntrs.nasa.gov/citations/19720004775 (accessed on 11 August 2023).
- Vater, M. Prufung und Verhalten metallischer Werkstoffe gegen Tropfenschlag und Kavitatlon, Korroslon and Metallschutz; Technical Report, Own work; June 1944; Volume 20, n. 6; pp. 171–179. [Google Scholar]
- Kirols, H.; Kevorkov, D.; Uihlein, A.; Medraj, M. The effect of initial surface roughness on water droplet erosion behaviour. Wear 2015, 342–343, 198–209. [Google Scholar] [CrossRef]
- Rudy, S.; Thiruvengadam, A. Experimental and Analytical Investigations on Multiple Liquid Impact Erosion; Technical Report; NASA: Washington, DC, USA, 1969.
- Kirols, H.; Mahdipoor, M.; Kevorkov, D.; Uihlein, A.; Medraj, M. Energy based approach for understanding water droplet erosion. Mater. Des. 2016, 104, 76–86. [Google Scholar] [CrossRef]
- Arcella, F.; Heymann, F. Analytical Investigation of Turbine Erosion Phenomena; Technical Report; NASA: Washington, DC, USA, 1966.
- Guillou, E. Uncertainty and Measurement Sensitivity of Turbocharger Compressor Gas Stands. Comput. Fluid Dyn. 2013, 1. [Google Scholar] [CrossRef]
- Marzbali, M.; Yeganehdoust, F.; Ibrahim, M.E.; Tarasi, F.; Jadidi, M. Liquid–Solid Impact Mechanism, Liquid Impingement Erosion, and Erosion-Resistant Surface Engineering: A Review. Coatings 2023, 13, 577. [Google Scholar] [CrossRef]
- Wittmann, T.; Lück, S.; Hertwig, T.; Bode, C.; Friedrichs, J. The influence of condensation on the performance map of a fuel cell turbocharger turbine. In Proceedings of the Turbo Expo: Power for Land, Sea, and Air, Online, 7–11 June 2021; American Society of Mechanical Engineers: New York, NY, USA, 2021; Volume 84997, p. V006T19A001. [Google Scholar]
- Pouchot, W. Hydrodynamic Model of Correlation of Metal Removal Rates from Repetitive Drop Impact; ASTM International: West Conshohocken, PA, USA, 1970. [Google Scholar]
- Heymann, F.J. Toward Quantitative Prediction of Liquid Impact Erosion; NASA: Washington, DC, USA, 1 January 1970; Volume 1, pp. 212–243. [CrossRef]
- Mai, H.; Sens, M.; Pucher, H. Parameterstudie zur Turbolader-Kennfeldvermessung. In Proceedings of the Informationstagung Motoren, Bad Neuenahr, Germany, 15 April 2010. [Google Scholar]
- Brun, K.; Nored, M. Guideline for field testing of gas turbine and centrifugal compressor performance. Guidel. Release 2006, 2, 1–79. [Google Scholar]
Disclaimer/Publisher’s Note: The statements, opinions and data contained in all publications are solely those of the individual author(s) and contributor(s) and not of MDPI and/or the editor(s). MDPI and/or the editor(s) disclaim responsibility for any injury to people or property resulting from any ideas, methods, instructions or products referred to in the content. |
© 2025 by the authors. Licensee MDPI, Basel, Switzerland. This article is an open access article distributed under the terms and conditions of the Creative Commons Attribution (CC BY) license (https://creativecommons.org/licenses/by/4.0/).