1. Introduction
With emerging hybrid electric aircraft architectures, the on-board heat generation is expected to see a huge increase compared to today’s aircraft. To cope with this challenge, the Clean Aviation TheMa4HERA project has the goal to develop technologies enabling the thermal management of up to 1 MW of on-board heat generation. In a first step, it is attempted to leverage yet unused heat sinks as a “quick win” solution. The cabin and crown outer sidewall, hardly used for thermal management today, is such a candidate.
In today’s aircraft design, care is taken to install insulation to avoid the excessive overflow of air from the cabin and crown to the exterior skin. In a literature review [
1], it was found that cabin relative humidity measurements are reported in the order of 16% ± 5% RH. While this is perceived as dry for some passengers, the dew point of this air is around −5 °C, and hence frost can form on the cold aircraft structure if this air overflows behind the insulation blankets. Ref. [
2] describes the cycle of air ingress and frost formation behind the insulation at the interior side of the fuselage. The stack effect leads to warm cabin air mounting to the crown where it overflows to the cold air gap between the insulation and the fuselage through leakages between the insulation blankets or around structural elements like rods. The contained moisture condenses as frost and accumulates on the fuselage. In warm ground conditions, the water melts. Ideally, the liquid water is drained by the shingling of the insulation blankets; however, it happens that some water drips onto cabin interiors and ultimately into the cabin (“rain in the plane”). Ref. [
3] shows the formation of frost on the outboard side of the insulation blankets. This frost formation cycle is the major inhibitor to use the crown and cabin skin to release heat to the cold exterior environment in cruise. Ref. [
4] suggests that the injection of dry air behind the insulation layer could counteract the leakage of moist cabin air behind the insulation and thereby keep the exterior skin dry. However, the source of air suggested originates from bleed air and thus has a negative impact on system performance as it increases the bleed air amount needed.
In [
5], a solution is suggested that provides dry air at low energetical cost, thereby protecting the cabin sidewall from the ingress of moist air and, as a side effect, enables the use of the cabin sidewall for heat exchange with the cold exterior environment. This solution supplies air behind the insulation in the upper section of the aircraft, lets it flow down along the cold fuselage structure, and extracts air from behind the insulation at the level of the cabin floor. A fan blows this air upwards again in a closed duct. Through this, the air is only dehumidified once and then dry air is recirculated, in contrast to today’s system where a constant flow of moist air behind the insulation layer forms (approx. 2–4 kg/h per frame bay [
6]). This paper provides evidence of a first experimental verification of the system in the Fraunhofer Lining and Insulation Test Environment.
2. Method
2.1. Measurement Setup
The LITE chamber (
Figure 1) at Fraunhofer was constructed with the aim to perform research on cabin sidewall systems. It consists of four frame bays, a cocoon cooling on the exterior side to replicate outside temperatures down to −30 °C, and a conditioned cabin emulation section.
The size of the chamber is equivalent to roughly 9 passengers’ space; hence the ventilation system is set to a supply airflow rate of 368 kg/h (9.4 L/s or 20 cfm per passenger in correspondence with ASHRAE 161 [
7]). The cabin is conditioned to normal cabin conditions of approx. 23 °C. To detect moisture-related issues, relative humidity is exaggerated to 30 % RH.
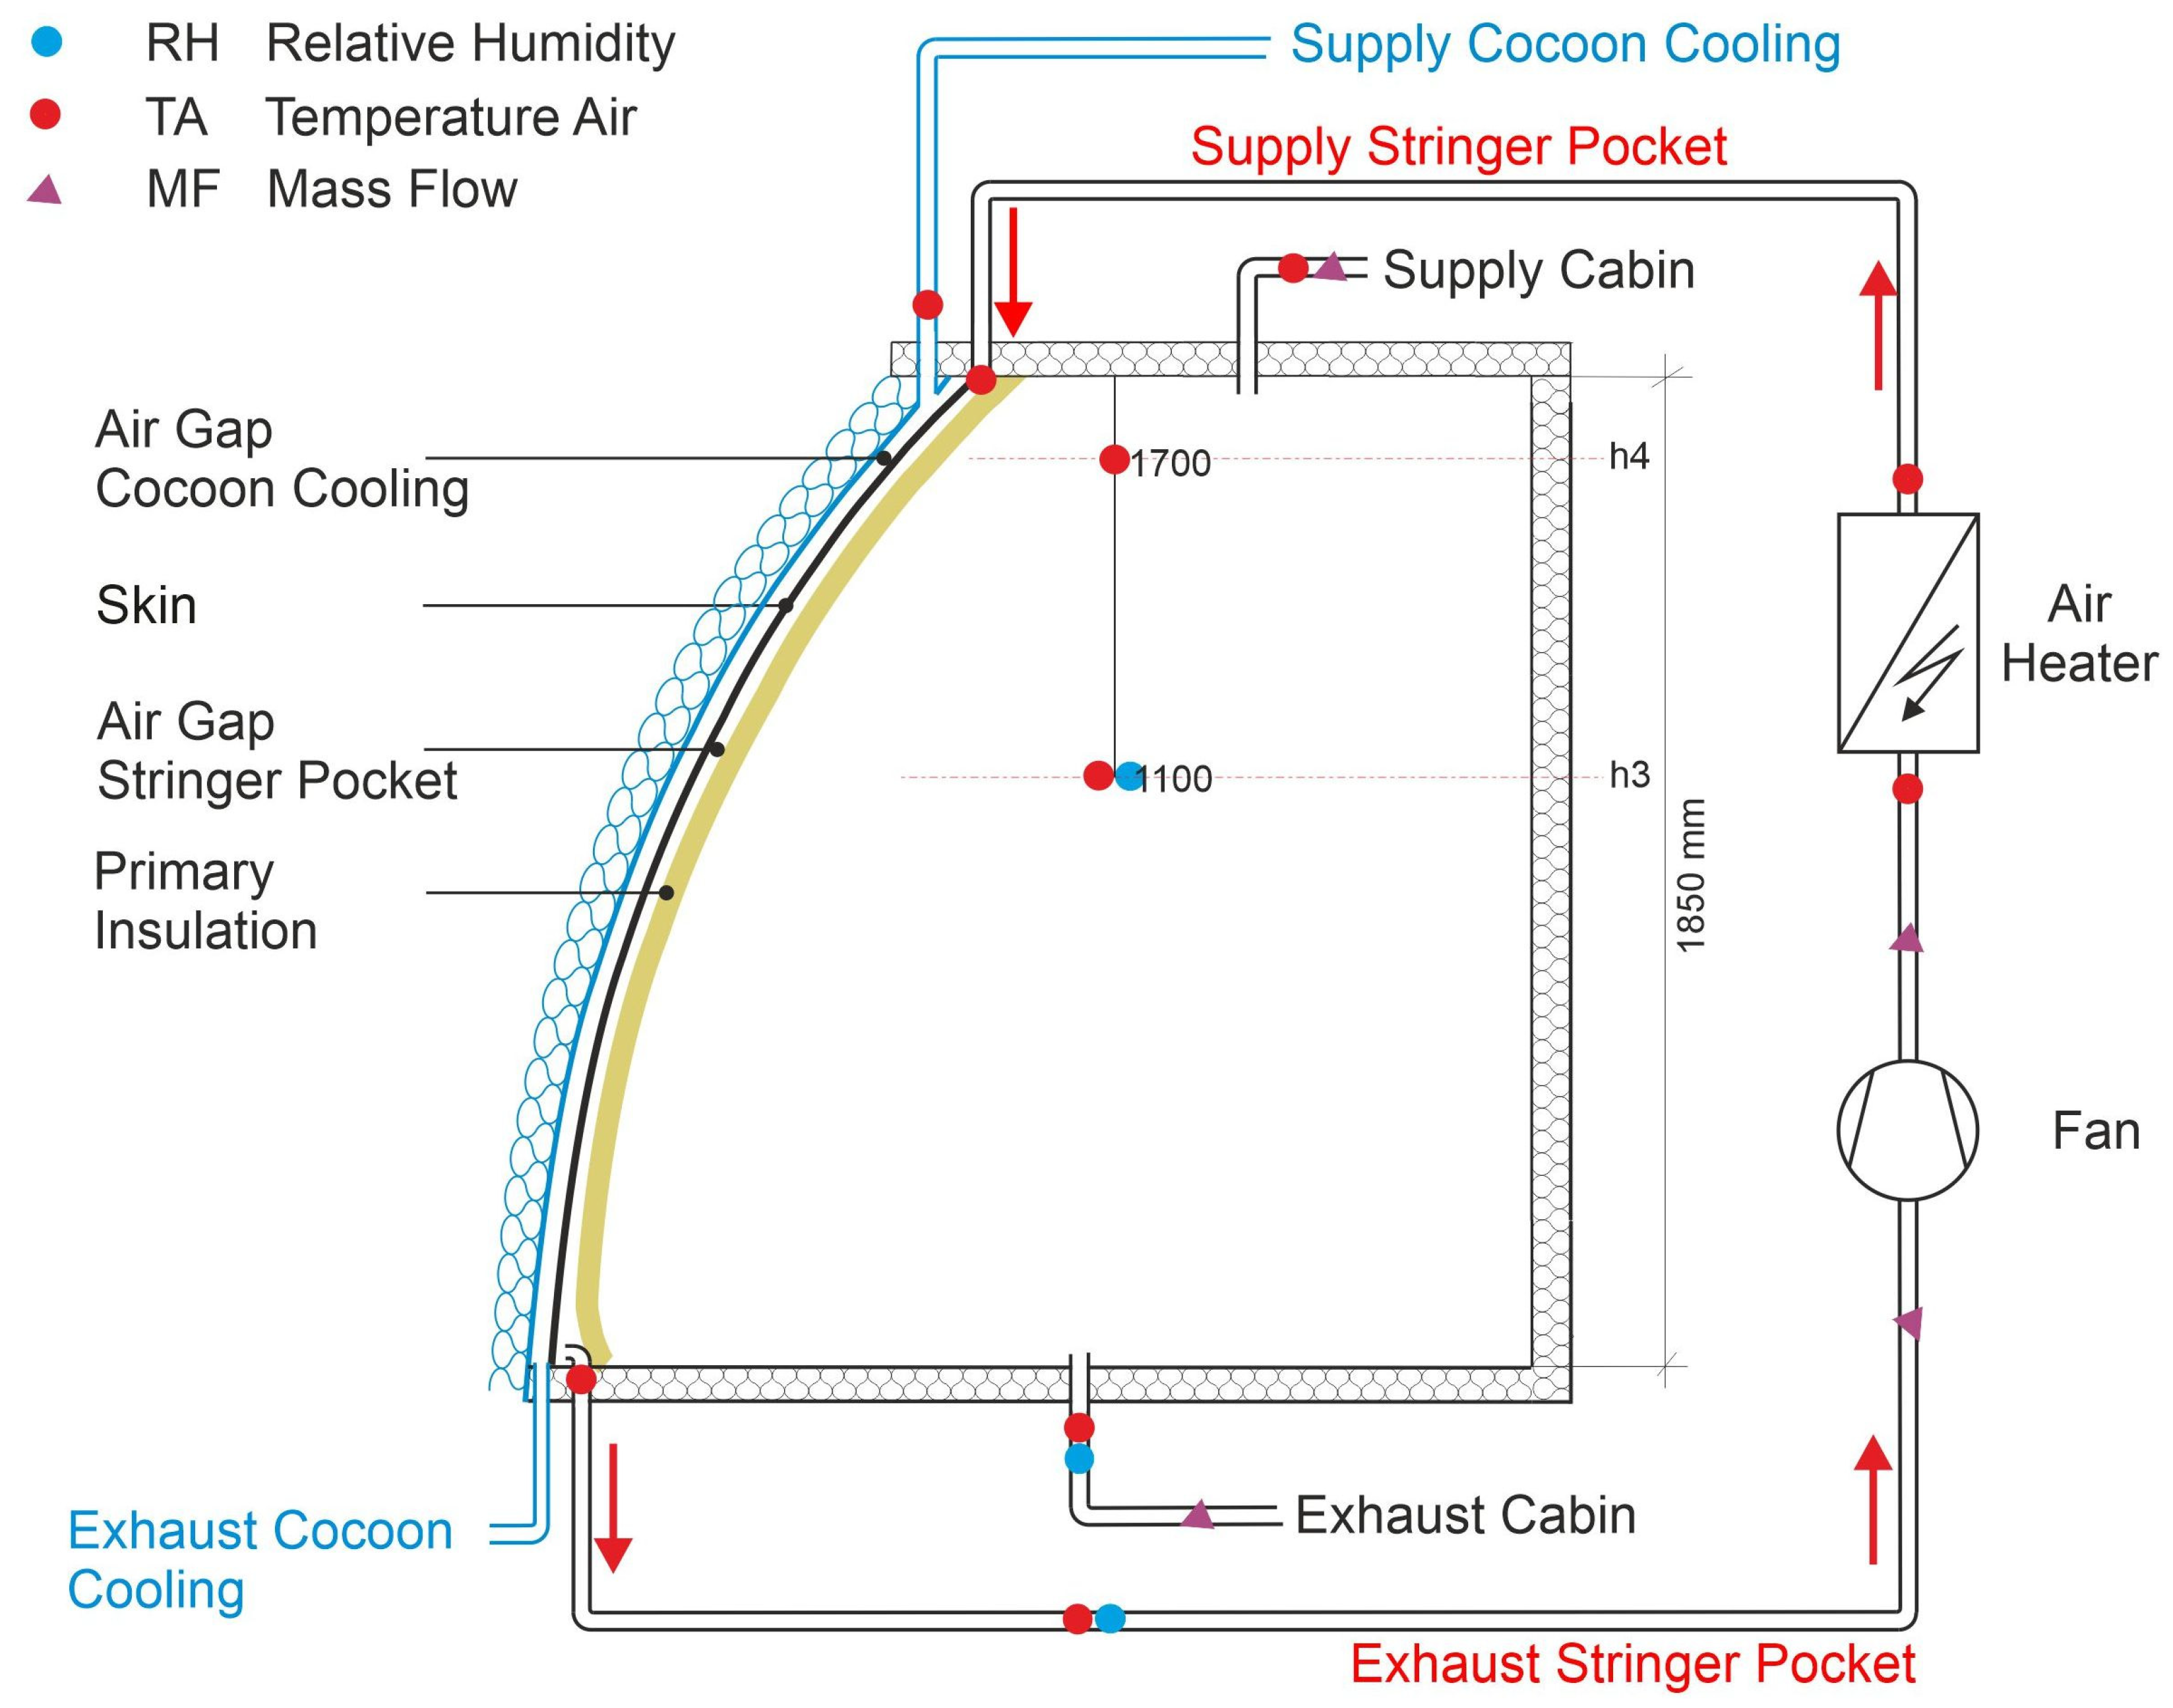
Figure 2 illustrates the test setup and measurement system. The cocoon cooling consists of an air gap on the exterior side of the aircraft skin. Through this gap, cooled air is blown to replicate cold in-flight exterior conditions. The second air gap, between the interior side of the skin and the exterior side of the insulation, is referred to as stringer pocket. Here, an air supply and extraction system recirculates air towards the cold skin. An air heater is mounted in this recirculation line to provide an air supply into the stringer pocket. This heater is an emulation of equipment requiring cooling in the hybrid electric regional aircraft. The third airflow path is the cabin supply and exhaust emulating cabin ventilation.
Temperatures are measured with 4-wire PT100 sensors (±0.1 K @20 °C), and flow rates are measured with Schmidt SS20.500 thermal anemometers (0.06–35 m/s, ±3%). Pressure differentials between the cabin and the stringer pockets are measured using Fischer DE23 transducers (measurement range: ±25 Pa; 1% accuracy).
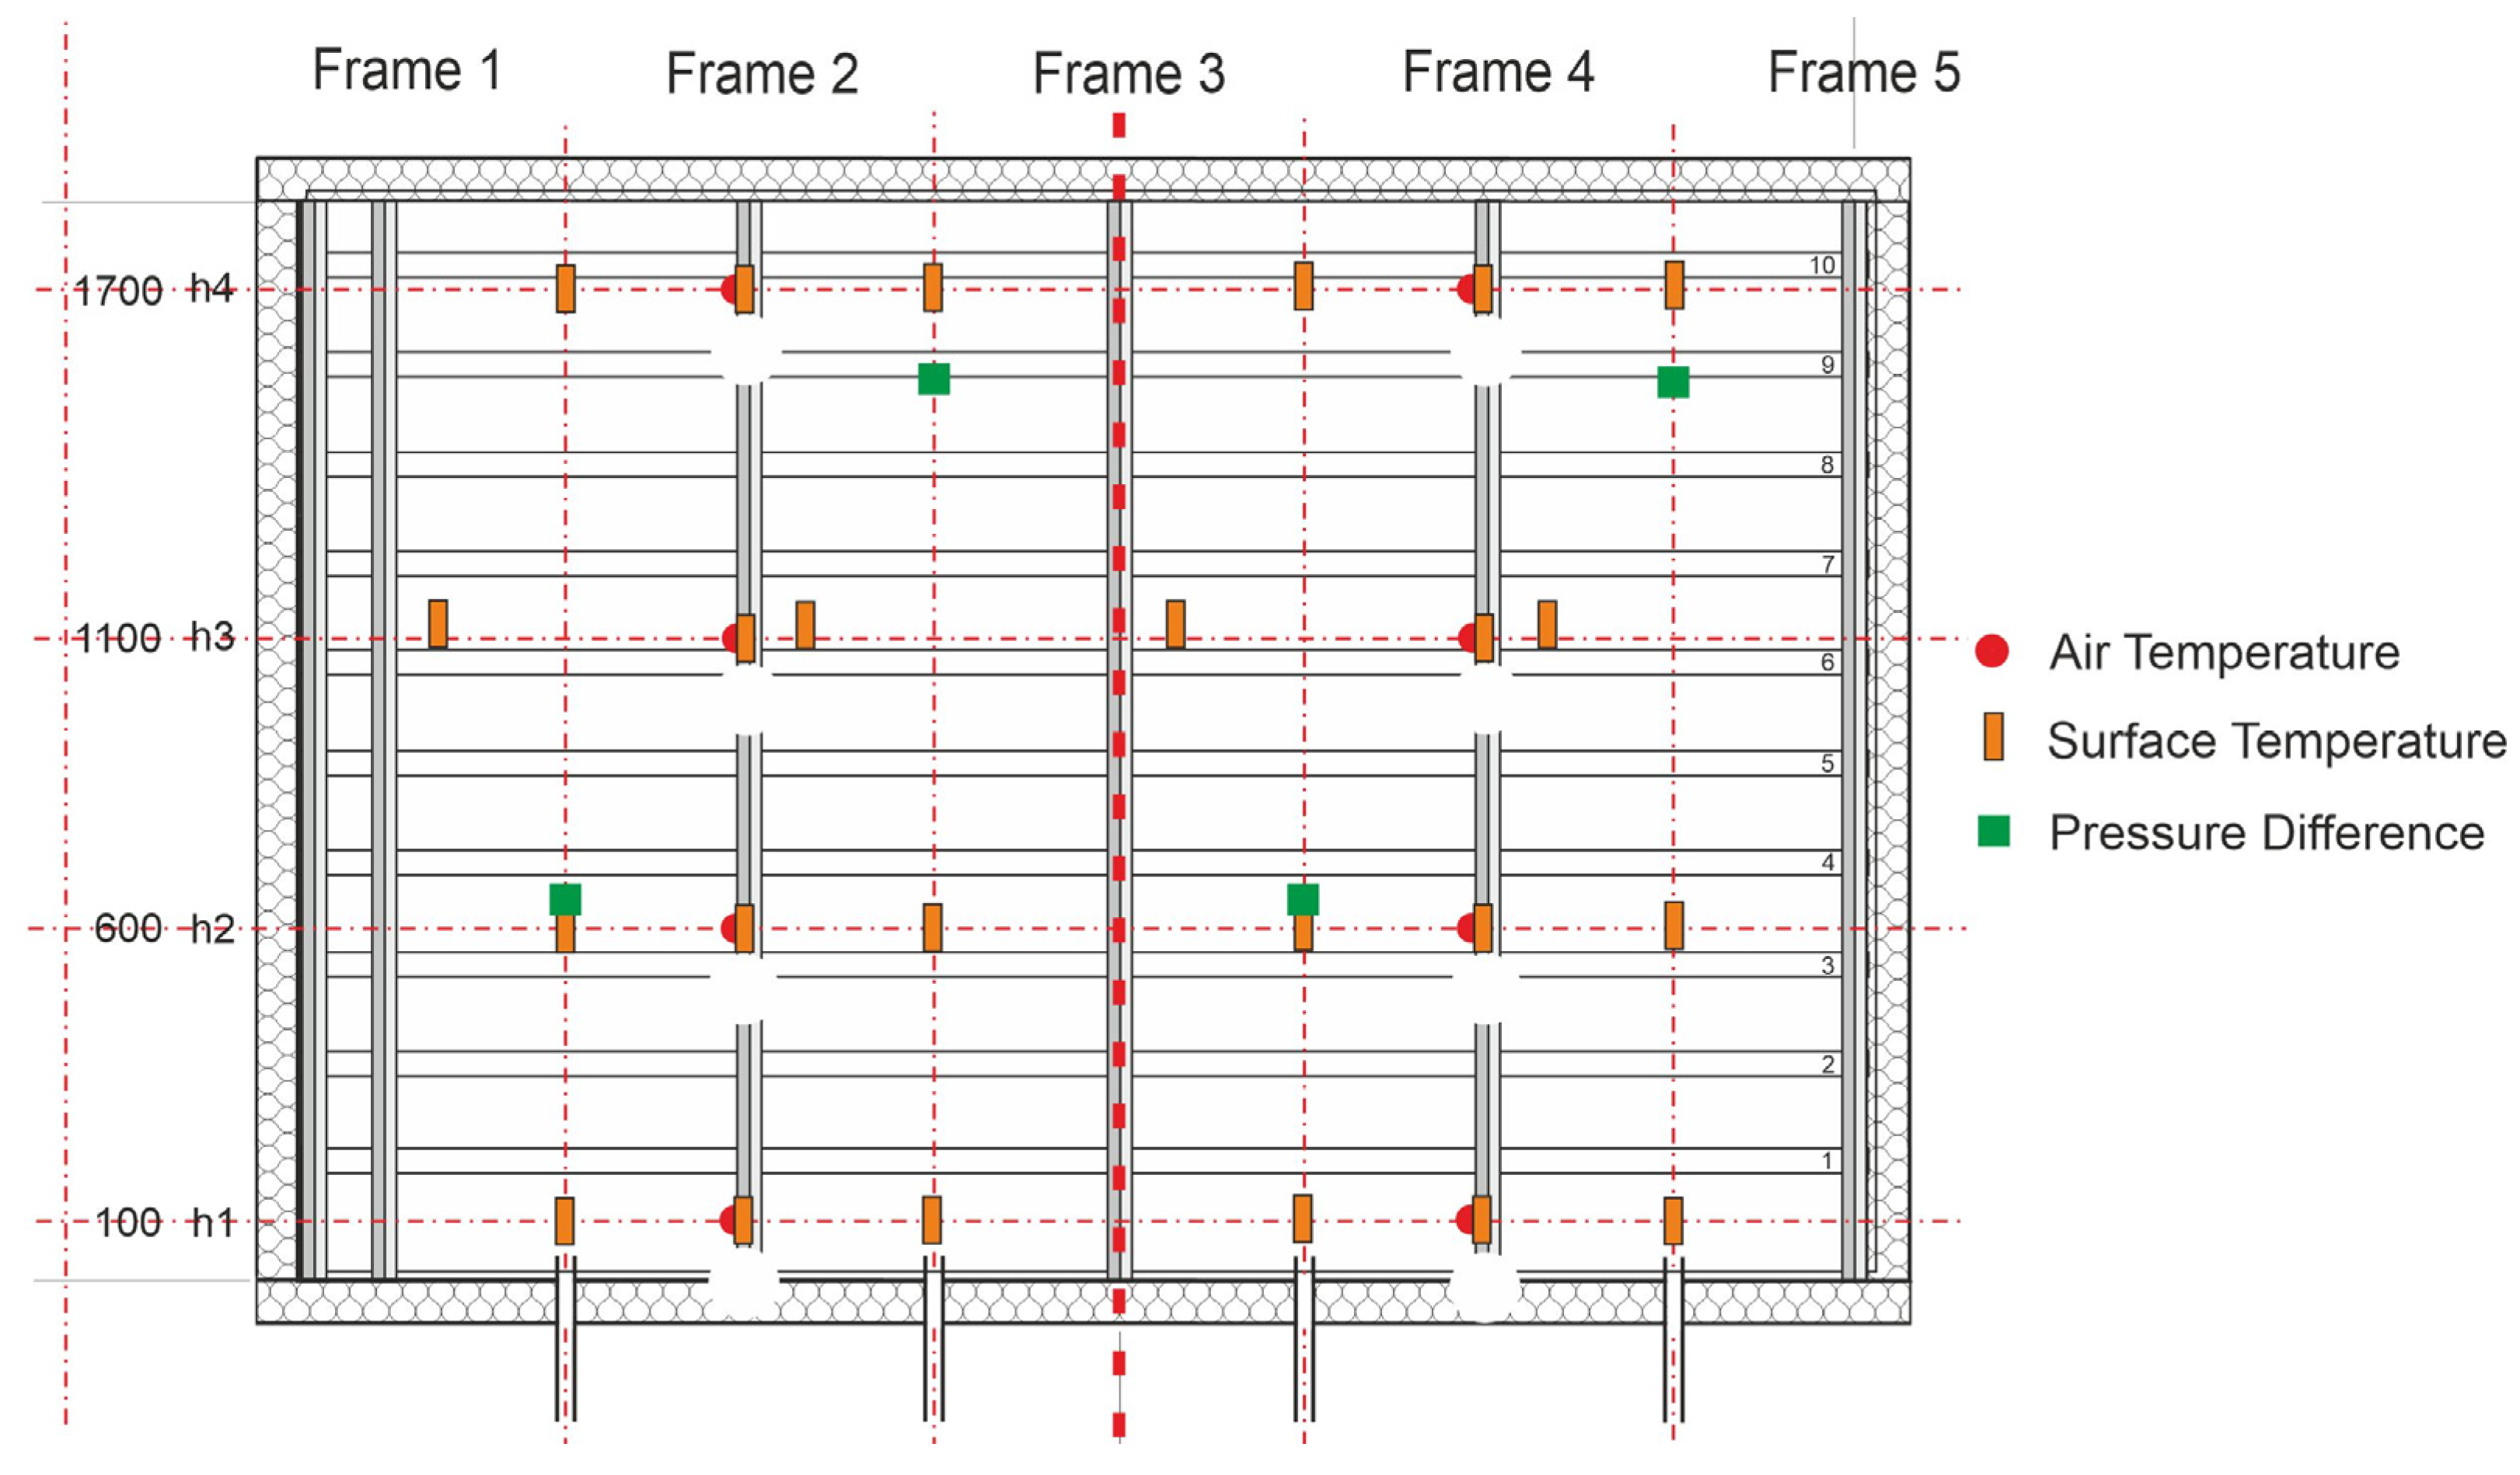
Figure 3 shows the measurement locations of skin temperatures (frame bays 1–4), frame temperatures (frames 2 and 4), air temperatures (below frames 2 and 4), and pressure differences between the frame bay and the cabin.
It was observed that due to the long ducting required to obtain an accurate flow rate measurement for the recirculation flow (several meters of ducting), heat exchange between the recirculation duct and the laboratory occurred. This led to the heating of the cold return air and the cooling of the air downstream the heater. Therefore, it was decided to use the supply and exhaust temperatures in the frame bays to estimate the actual heat release at the aircraft skin (Equation (1)). The airflow rates were measured in the duct after uniting/before splitting the four air supplies and exhausts for the frame bay ventilation. Supply temperatures were measured in frame bays 2 and 3 and the extraction temperature in the return air duct directly after uniting the four branches.
2.2. Theoretical Flow Rate Sizing
For heat release, it was considered that the entire stringer pocket surface contributes to heat removal. The assumptions shown in
Table 1 were made for the pre-calculation:
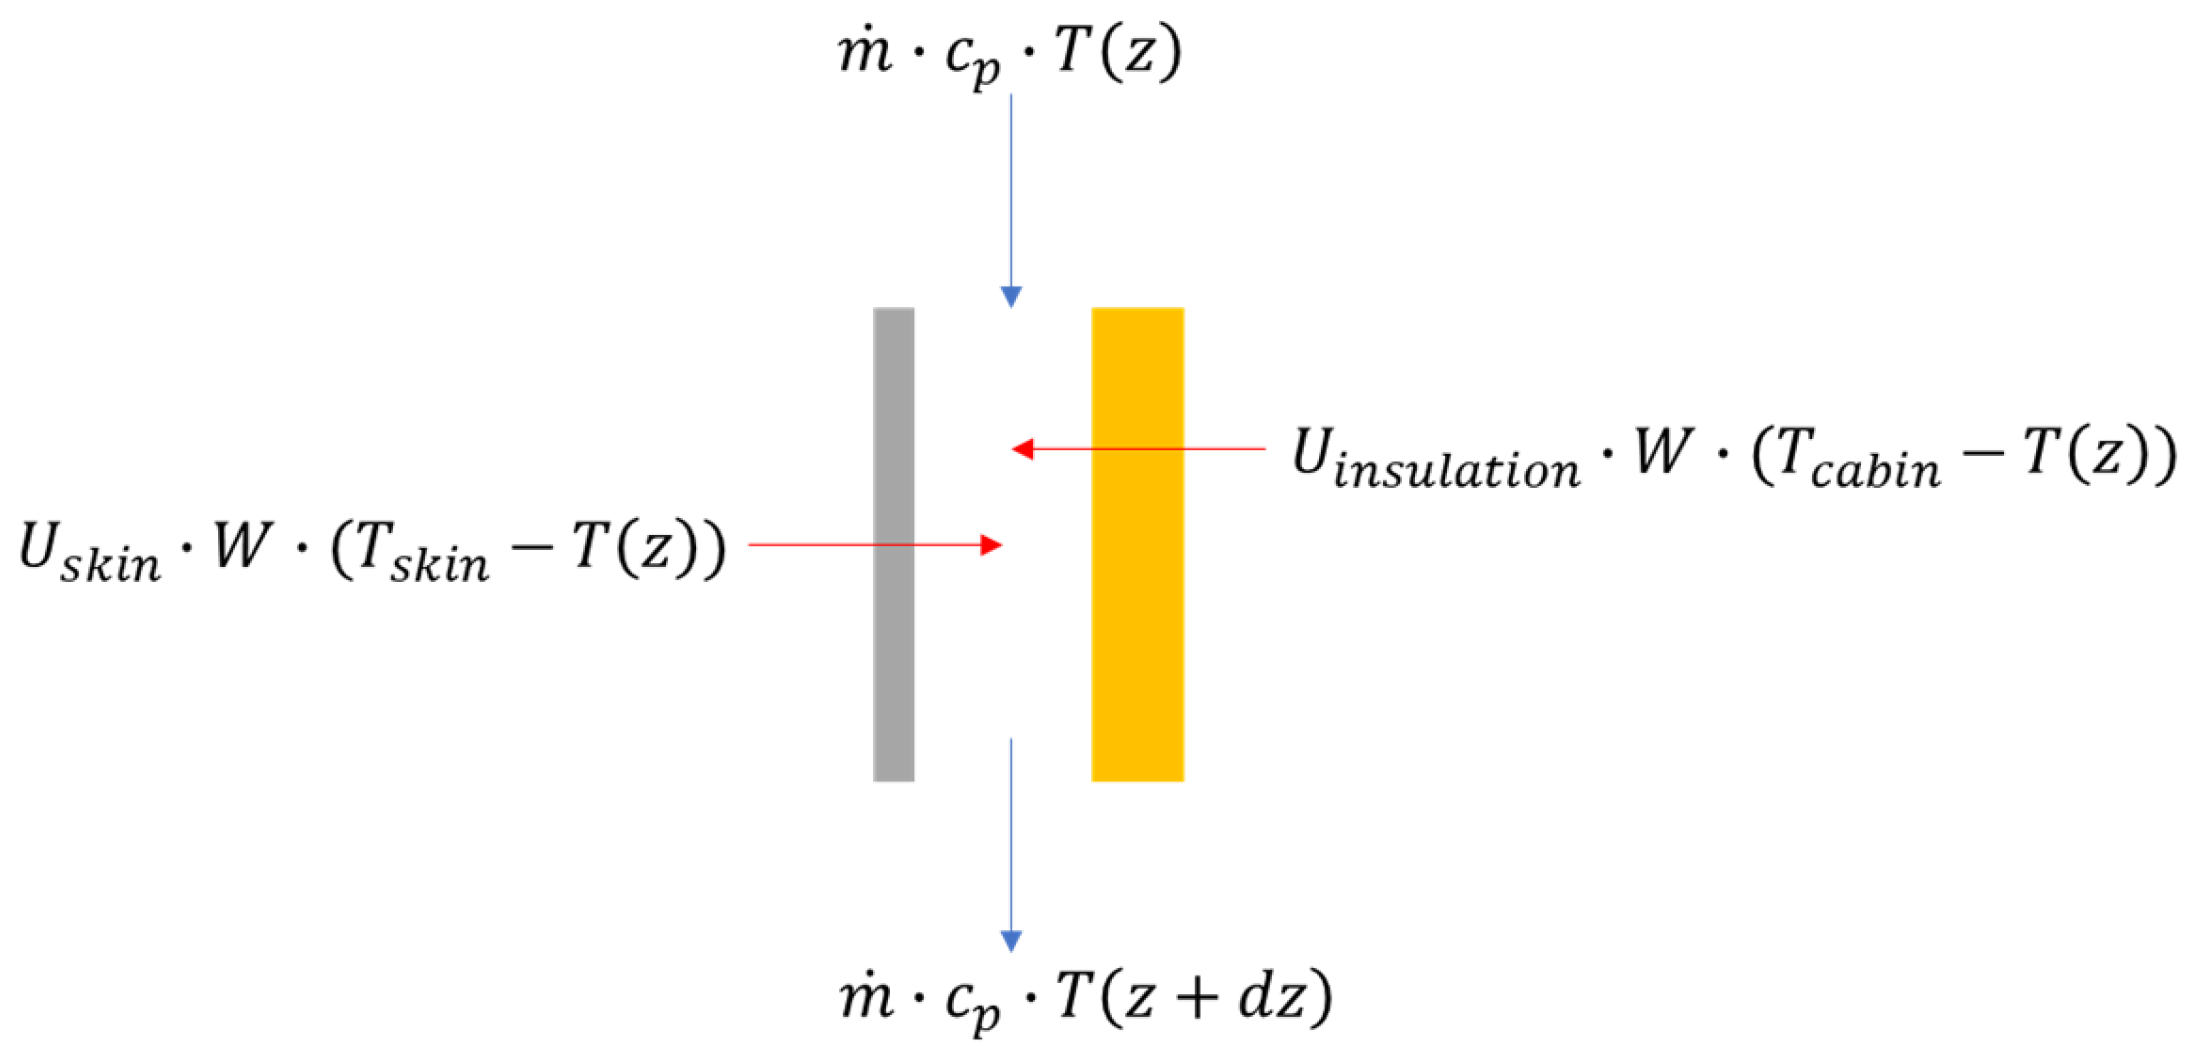
To elaborate the temperature decline along the flow path, the differential heat exchange along an infinitesimal strip of the flow path was considered, taking into account the heat exchange with the skin and the cabin (
Figure 4). Solving the differential balance equation leads to Equations (2) and (3).
For an infinitively long skin, the temperature only depends on the exterior and cabin temperature and the resistances to the gap (2). For finite flow lengths, the resulting exit temperature is obtained by Equation (2). Using Equation (1), the heat flow rate can be computed.
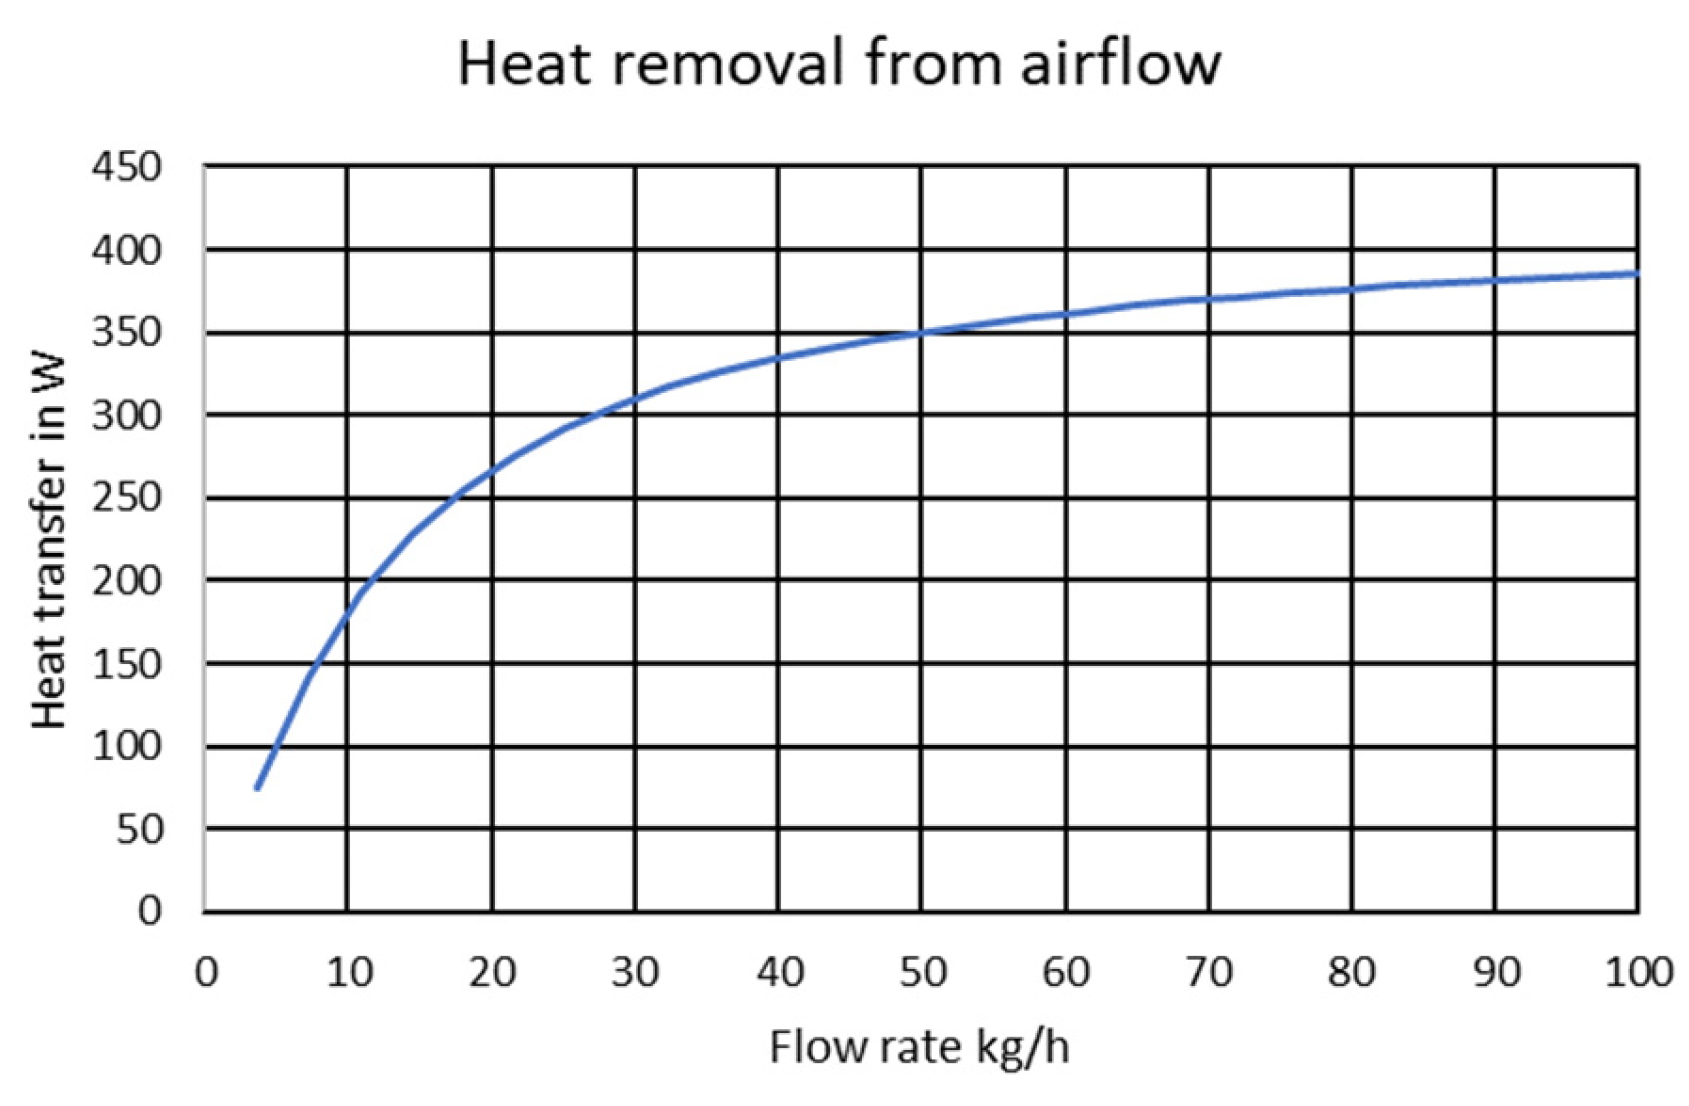
Varying the airflow rate behind the primary insulation and considering the test bench geometry, the curve in
Figure 5 is obtained. Low flow rates do not entirely use the cooling potential of the skin, while increasing the flow rate above 50 kg/h does not lead to a substantial additional benefit because the skin heat transfer becomes the limiting factor. As an intermediate compromise, the flow rate target of 30 kg/h was selected, thus leading to a total flow rate behind the insulation of 120 kg/h in the four frame bays. With this setting, a theoretical heat removal of 310 W per frame bay (1240 W total) should be achievable. Assuming a supply air temperature of 60 °C, the air would theoretically leave the lower frame bay section at 23 °C, thus a difference of 37 K.
3. Results
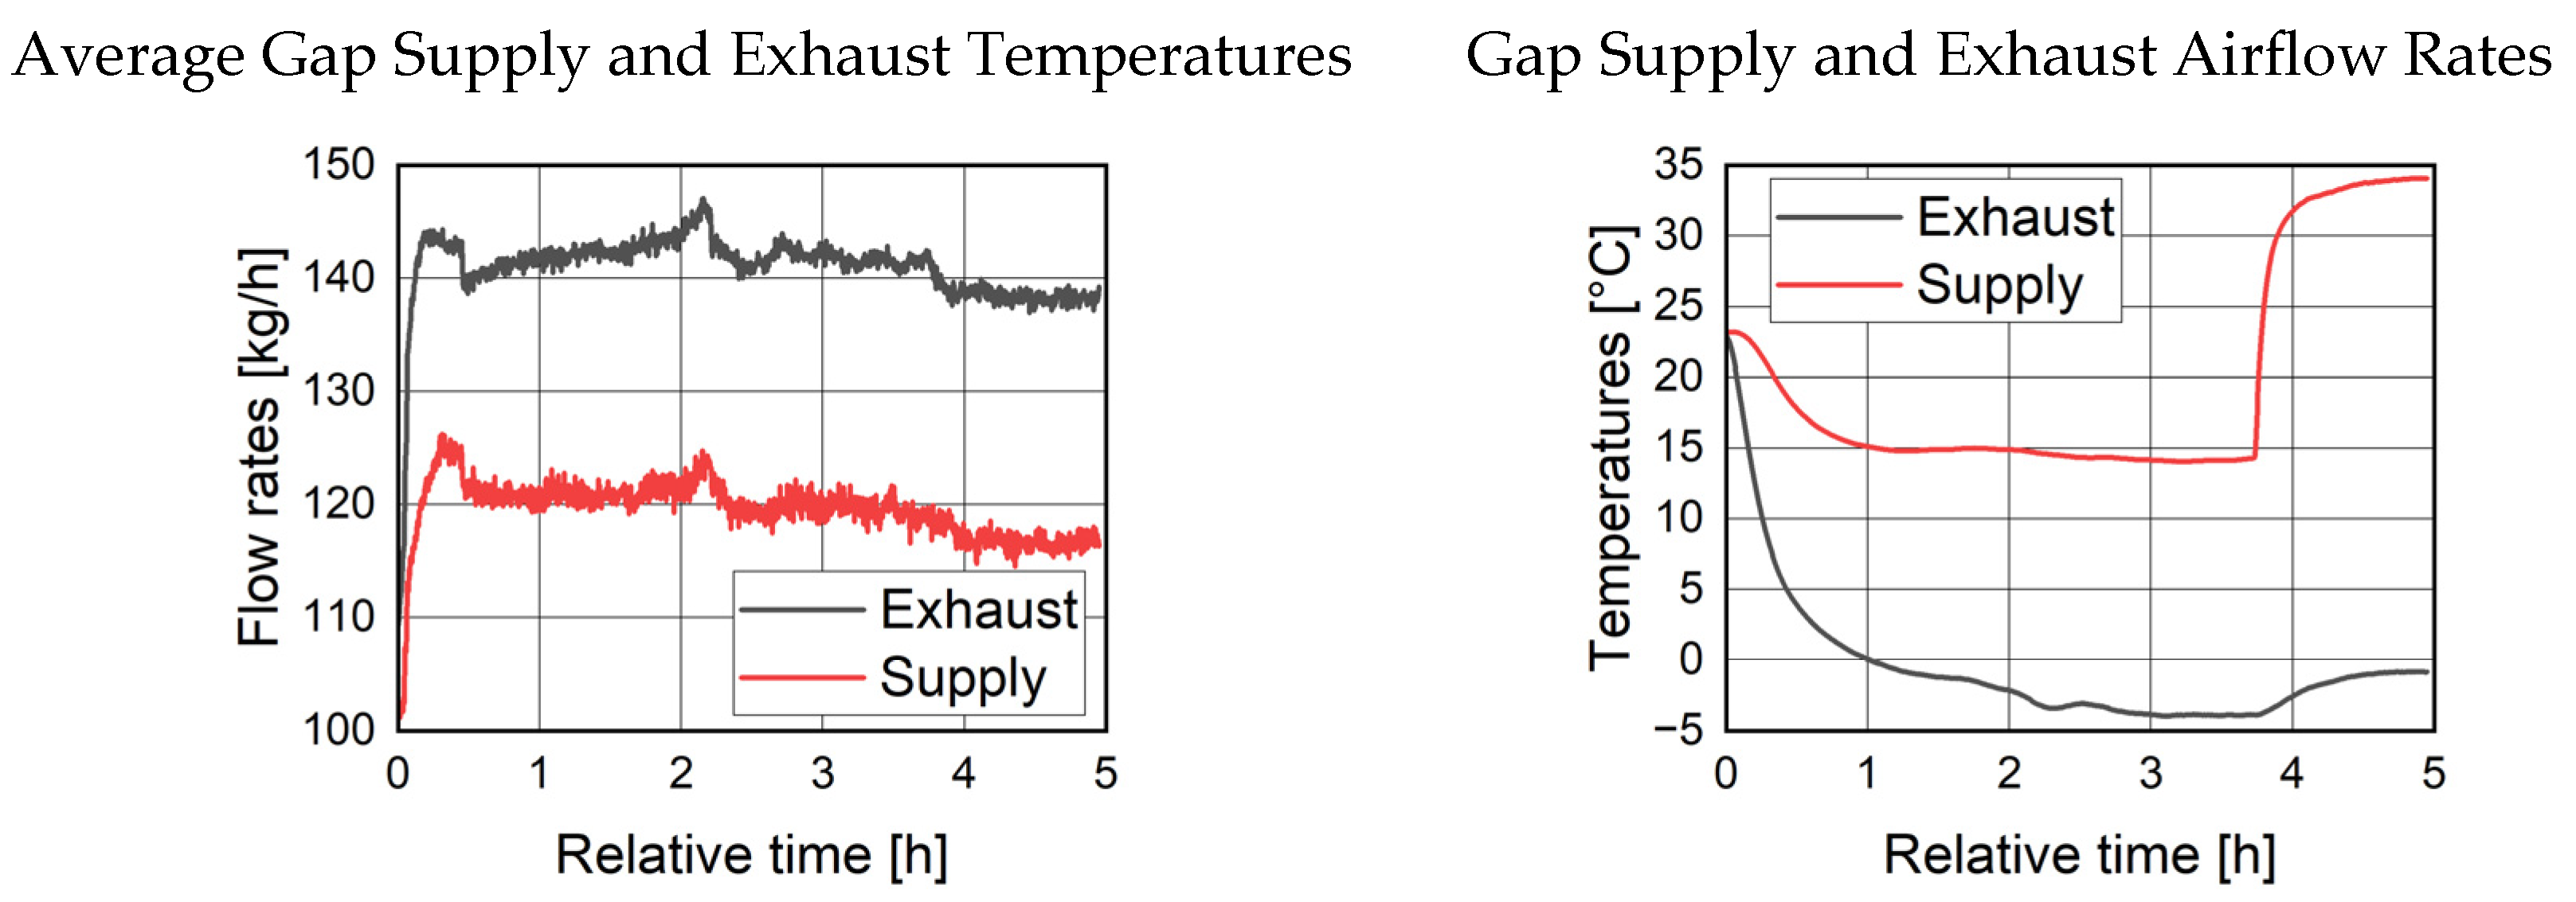
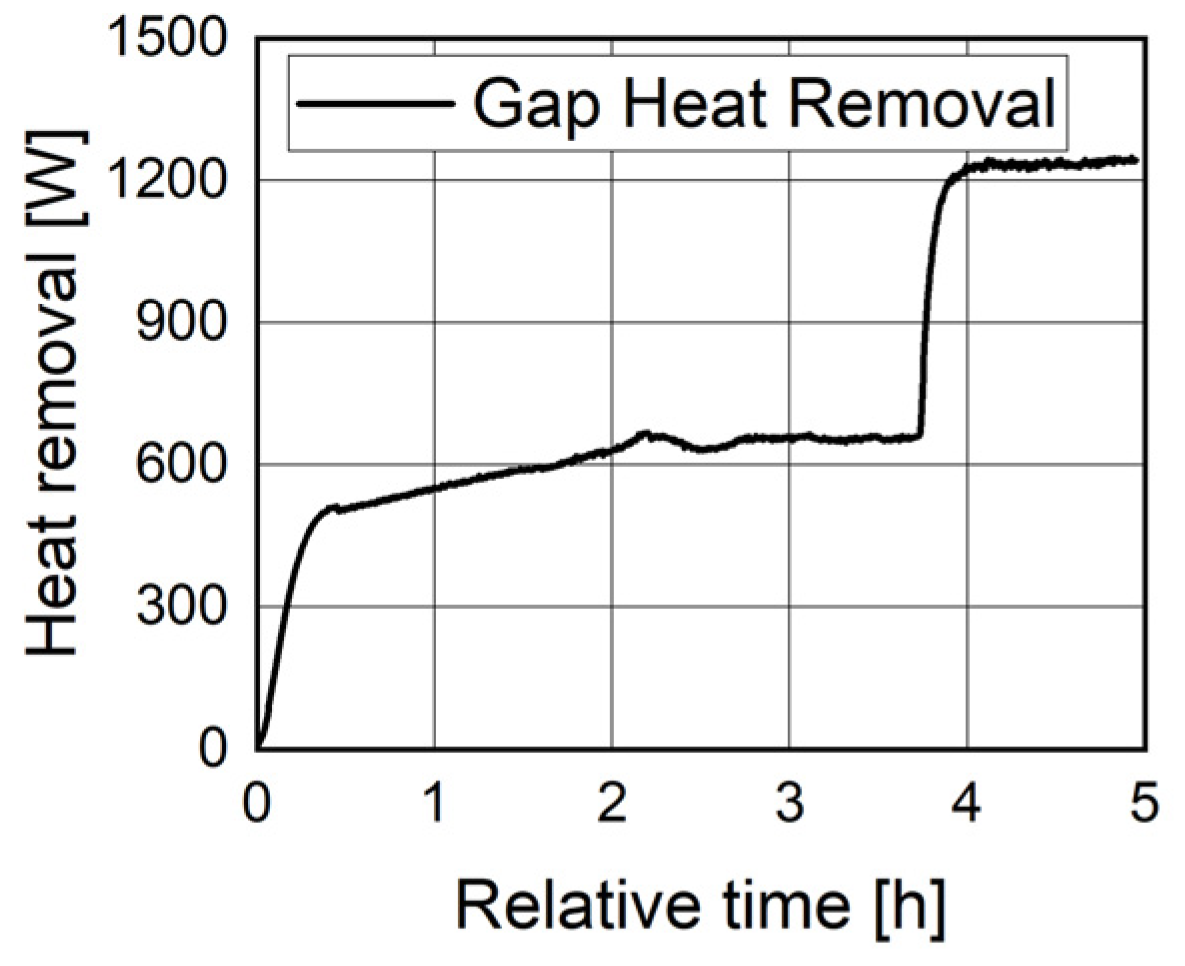
3.1. Transient Evolution of Gap Supply and Exhaust
In a first stage, the heater simulating a device was not used and the heat ingress into the gap ventilation system results from heat added by the fan and conduction from the laboratory into the ducting connecting the gap exhaust and supply. At 3.75 h, the heater was turned on. A safety switch avoiding the overheating of the coil led to a limitation of the heating power, and additionally heat was lost from the ducting into the laboratory; therefore, only 34.0 °C was reached in the gap supply at the end of the test (
Figure 6). As 117 kg/h were supplied, but 138 kg/h extracted, 21 kg/h must have entered into the gap. This air originated from the cabin and overflowed through leakages in the insulation layer, e.g., blanket joints. While the heater was not activated, the heat removal in the gap stabilized at 655 W; with the heater active, this was increased to 1238 W (
Figure 7). The temperature difference between supply and exhaust was 34.8 K when the heater was activated.
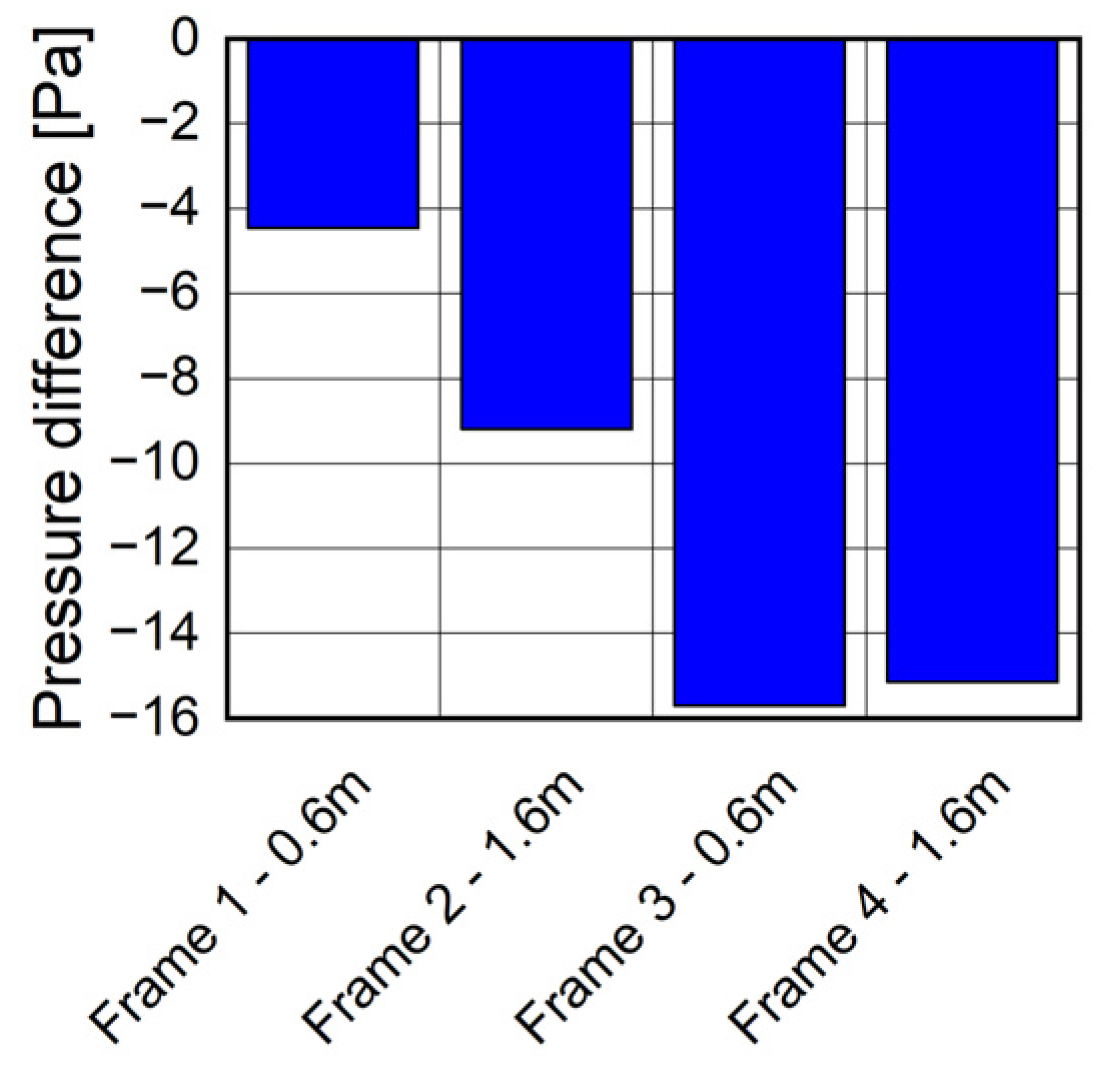
3.2. Steady-State Measurement Distributions
The results presented in this section refer to the temporal average between 4.5 and 5 h. The pressure differences (
Figure 8) show that a gradient behind the insulation formed from −4.5 Pa in the lower left frame bay to −15.8 (−15.1) Pa in the right-hand frame bays.
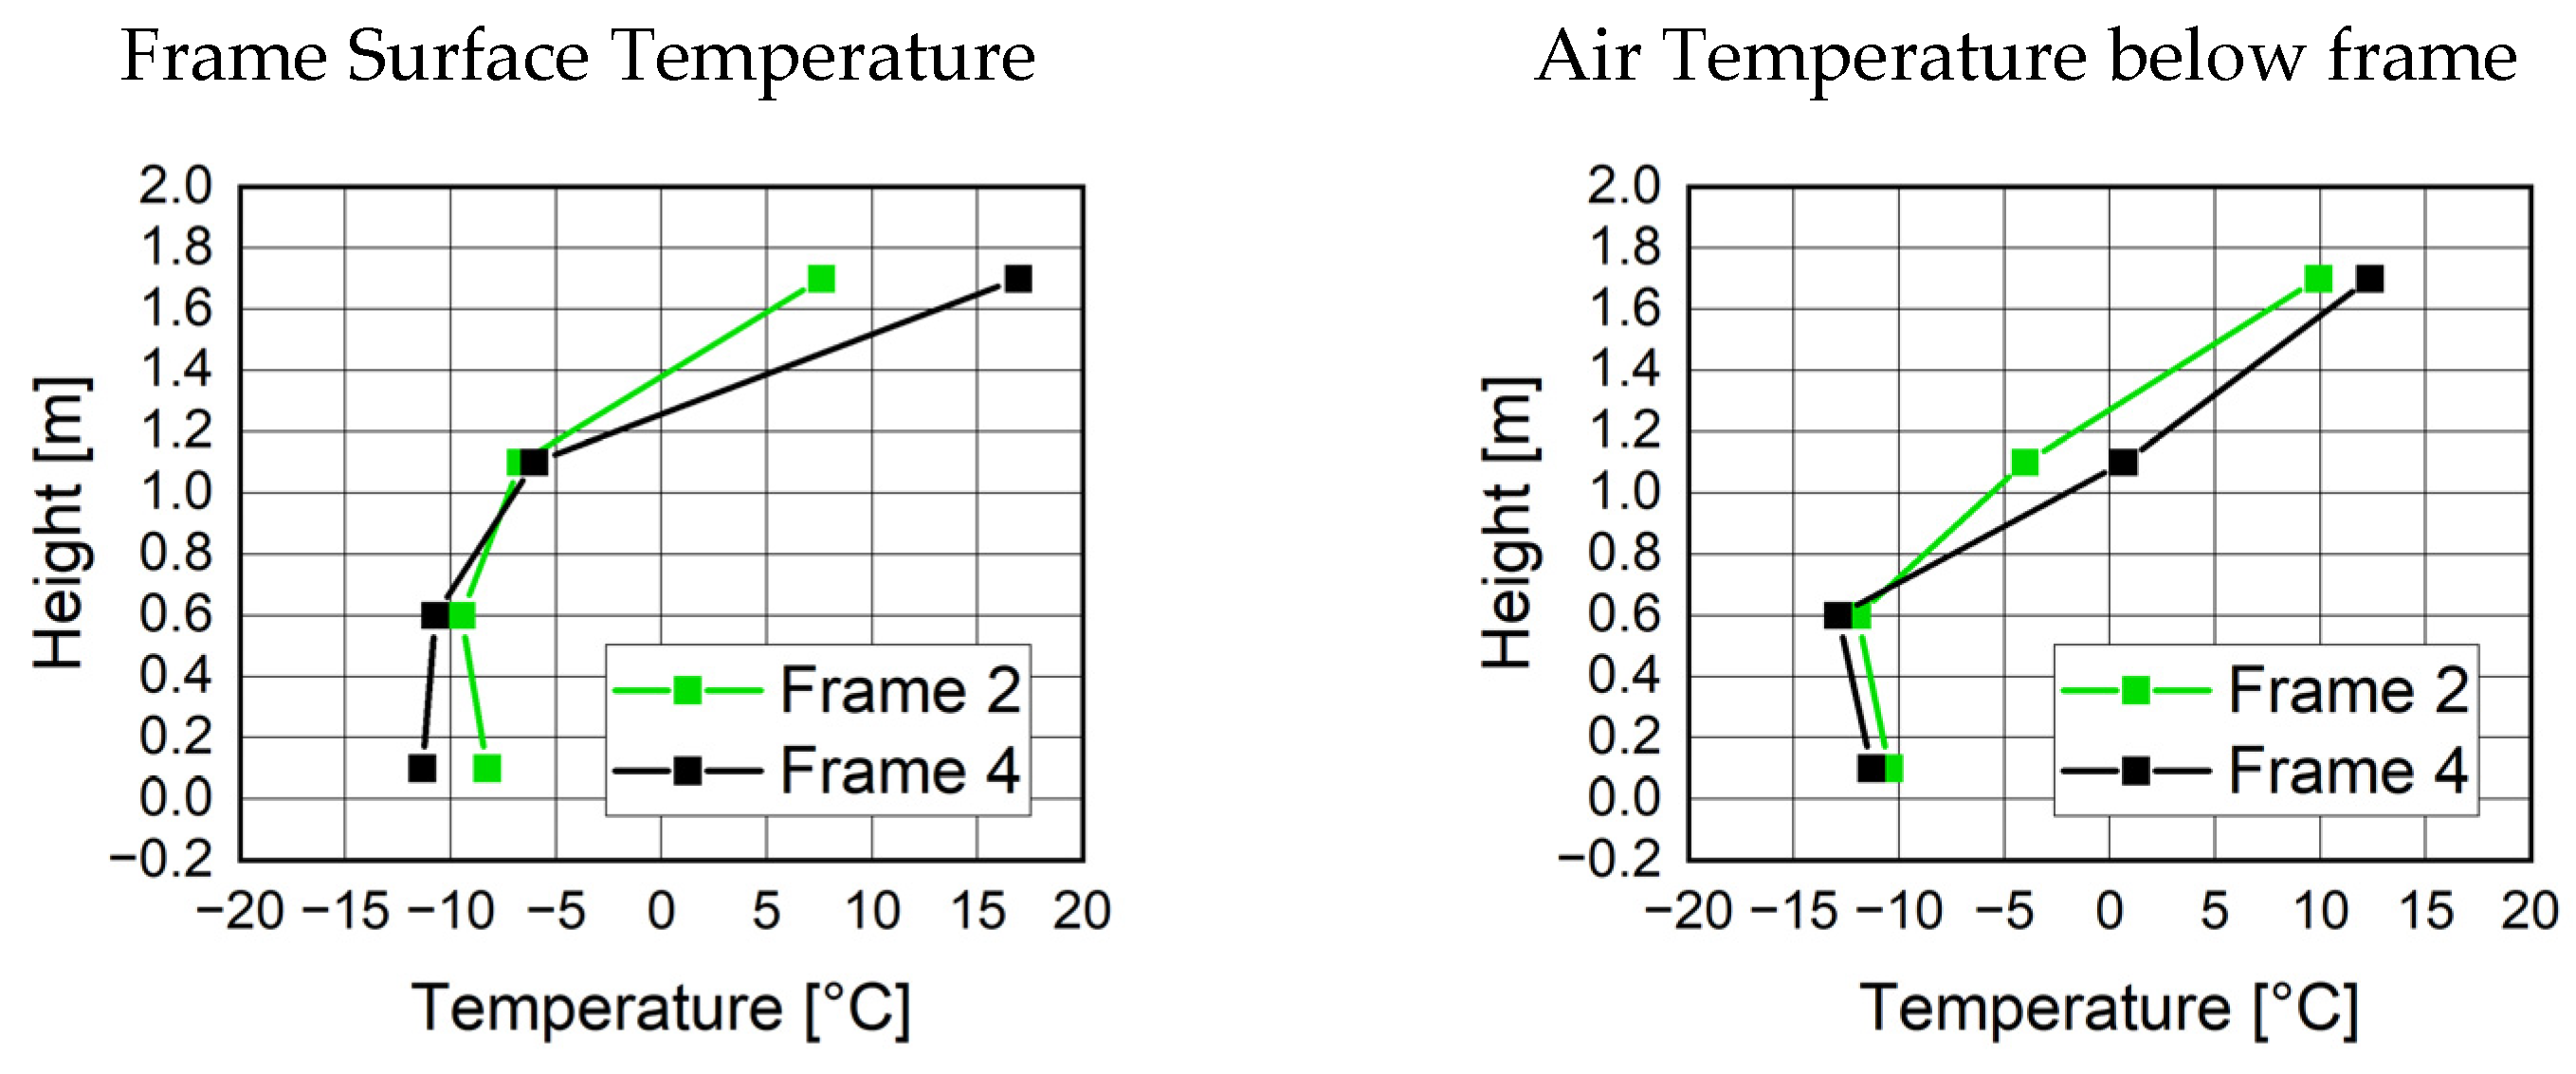
Figure 9 shows the frame bay surface temperature distributions. Frame bays 1 and 3 show an expected profile with higher temperatures in the upper section where the warm air is blown and lower temperatures in the lower section after the air flowed along the cold structure. Frame bays 2 and 4 show a more constant profile. There could be two reasons for this: an uneven distribution of the air supply split in the four frame bays, e.g., due to different effective gap sizes behind the insulation (flexible and non-defined shape), and an uneven distribution of the cooled air on the outboard side of the skin in the cocoon. Generally, temperatures between 0.1 and 0.6 m above the floor were stabilized, indicating that thermal saturation was reached in the airflow path.
Figure 10 shows the measured frame surface temperatures and air temperature below the frame. Here, a higher gradient is obvious compared to the skin. This could be an indication that the entered air found its way along the frame. Due to the S-shape of the frame and the insulation being wrapped above it, it is likely that some gap was left here, serving as a flow path for the air. Again, the section below 0.6 m appears to be thermally saturated.
4. Conclusions
The test seemed to confirm the theoretical considerations on the heat transfer in the frame bay air gap. While a total heat removal of 1240 W at a 37 K difference was predicted, the test revealed 1238 W at a 35 K temperature difference between supply and extraction.
Pressure differences were higher compared to measurements of a passive frame bay air volume [
6]. At the same time, the air ingress was actively increased to approx. 30 kg/h compared to an estimated passive ingress of 2–4 kg/h reported in [
6]. Thus, the recirculation system along the exterior skin for thermal management, reusing already dehumidified air to avoid frost formation on the skin, proved its effectiveness.
5. Discussion
A rule-of-thumb scaling of the test bench results to a single-aisle aircraft, assuming 40 frame bays on two sides (thus, 10 × 2 = 20 times larger heat transfer area), makes the removal of 24 kW of heat a realistic estimate. Considering hot ground conditions, e.g., +40 °C exterior temperature and 20 °C cabin temperature, the amount of heat dissipation is expected to drop to 7.5 kW. Solar load could further decrease this potential and lead to an inhomogeneous boundary condition to be further assessed.
The current work showed a first proof of concept to release heat behind the cabin sidewall. For an implementation into the aircraft, it should be assessed to which extent this system interacts with other systems and functions like the inhibition of smoke propagation, electrical wiring, ECS ducts, and structural supports.
6. Patents
The idea to recirculate the air behind the insulation, thereby avoiding frost buildup, is patented: EP 4 201 807 A1, Verfahren und Vorrichtung zum Reduzieren von Kondensatausfall an inneren Oberflächen einer Flugzeugaußenhaut und benachbarten Bauteilen, published 28 June 2023.
Author Contributions
Conceptualization, V.N.; methodology, V.N.; formal analysis, V.N.; investigation, G.R.; resources, V.N.; data curation, V.N.; writing—original draft preparation, V.N.; visualization, V.N.; supervision, V.N.; project administration, V.N.; funding acquisition, V.N. All authors have read and agreed to the published version of the manuscript.
Funding
The work was conducted with financial support from the HORIZON-JU-Clean-Aviation-2022-01, Project: 101102008—TheMa4HERA.
![Engproc 90 00104 i001]()
Data Availability Statement
The original contributions presented in this study are included in the article. Further inquiries can be directed to the corresponding author.
Acknowledgments
The authors would like to thank Hutchinson for the supply of the insulation blanket test specimen.
Conflicts of Interest
The authors declare no conflicts of interest. The funders had no role in the design of the study; in the collection, analyses, or interpretation of data; in the writing of the manuscript; or in the decision to publish the results.
References
- Chen, R.; Fang, L.; Liu, J.; Herbig, B.; Norrefeldt, V.; Mayer, F.; Fox, R.; Wargocki, P. Cabin air quality on non-smoking commercial flights: A review of published data on airborne pollutants. Indoor Air 2021, 31, 926–957. [Google Scholar] [CrossRef] [PubMed]
- Huber, P.; Schuster, K.; Townsend, R. Controlling Nuisance Moisture in Commercial Airplanes. Aero 05. 1999. Available online: https://www.boeing.com/commercial/aeromagazine/aero_05/m/m01/index.html (accessed on 13 September 2021).
- Westhoff, A.; Wagner, C. Experimental study of moist air flow in the gap between the aircraft’s fuselage and its cabin wall. CEAS Aeronaut J. 2020, 11, 591–607. [Google Scholar] [CrossRef]
- Walkinshaw, D.S.; Horstman, R.H. Stack Pressure-Created Airflows in Insulation Envelopes, Part 2: Passenger Aircraft. ASHRAE J. 2020, 5, 32–46. [Google Scholar]
- Norrefeldt, V. Verfahren und Vorrichtung zum Reduzieren von Kondensatausfall an inneren Oberflächen einer Flugzeugaußenhaut und benachbarten Bauteilen. Patent No. EP 4 201 807 A1, 28 June 2023. [Google Scholar]
- Norrefeldt, V.; Riedl, G. Investigation of the Impact of a Particle Foam Insulation on Airflow, Temperature Distribution, Pressure Profile and Frost Buildup on the Aircraft Structure. Aerospace 2021, 8, 359. [Google Scholar] [CrossRef]
- ASHRAE 161; Air Quality Within Commercial Aircraft. The American National Standards Institute (ANSI): Washington, DC, USA, 2006.
| Disclaimer/Publisher’s Note: The statements, opinions and data contained in all publications are solely those of the individual author(s) and contributor(s) and not of MDPI and/or the editor(s). MDPI and/or the editor(s) disclaim responsibility for any injury to people or property resulting from any ideas, methods, instructions or products referred to in the content. |
© 2025 by the authors. Licensee MDPI, Basel, Switzerland. This article is an open access article distributed under the terms and conditions of the Creative Commons Attribution (CC BY) license (https://creativecommons.org/licenses/by/4.0/).


