1. Introduction
With the maturation of technologies such as fuel cells and batteries for electric flight or hydrogen-propelled aircraft, thermal management becomes more and more of a challenge. In today’s commercial aircraft, passenger heat emission prevails as the major heat load, followed by systems such as the avionics compartment. In a former project, avionics heat loads were replicated at 15.6 kW [
1] for an aircraft carrying around 300 passengers and crew members emitting about 22.5 kW. Since passenger and system heat loads are of a similar order of magnitude, the amount of air required to cool the passenger cabin is sufficient to provide cooling for system heat loads, accepting to operate these systems at higher temperatures than the cabin. Thus, the major cooling concept can rely on the ECS system providing a constant flow of conditioned outside air into the fuselage.
The last Clean Aviation call [
2], targets on-board thermal management up to 1 MW to reach the goals of a 100-passenger hybrid electric aircraft. The passenger heat load only represents less than 1% of the total heat load on-board. Hence, today’s ECS cannot cope with this amount of heat.
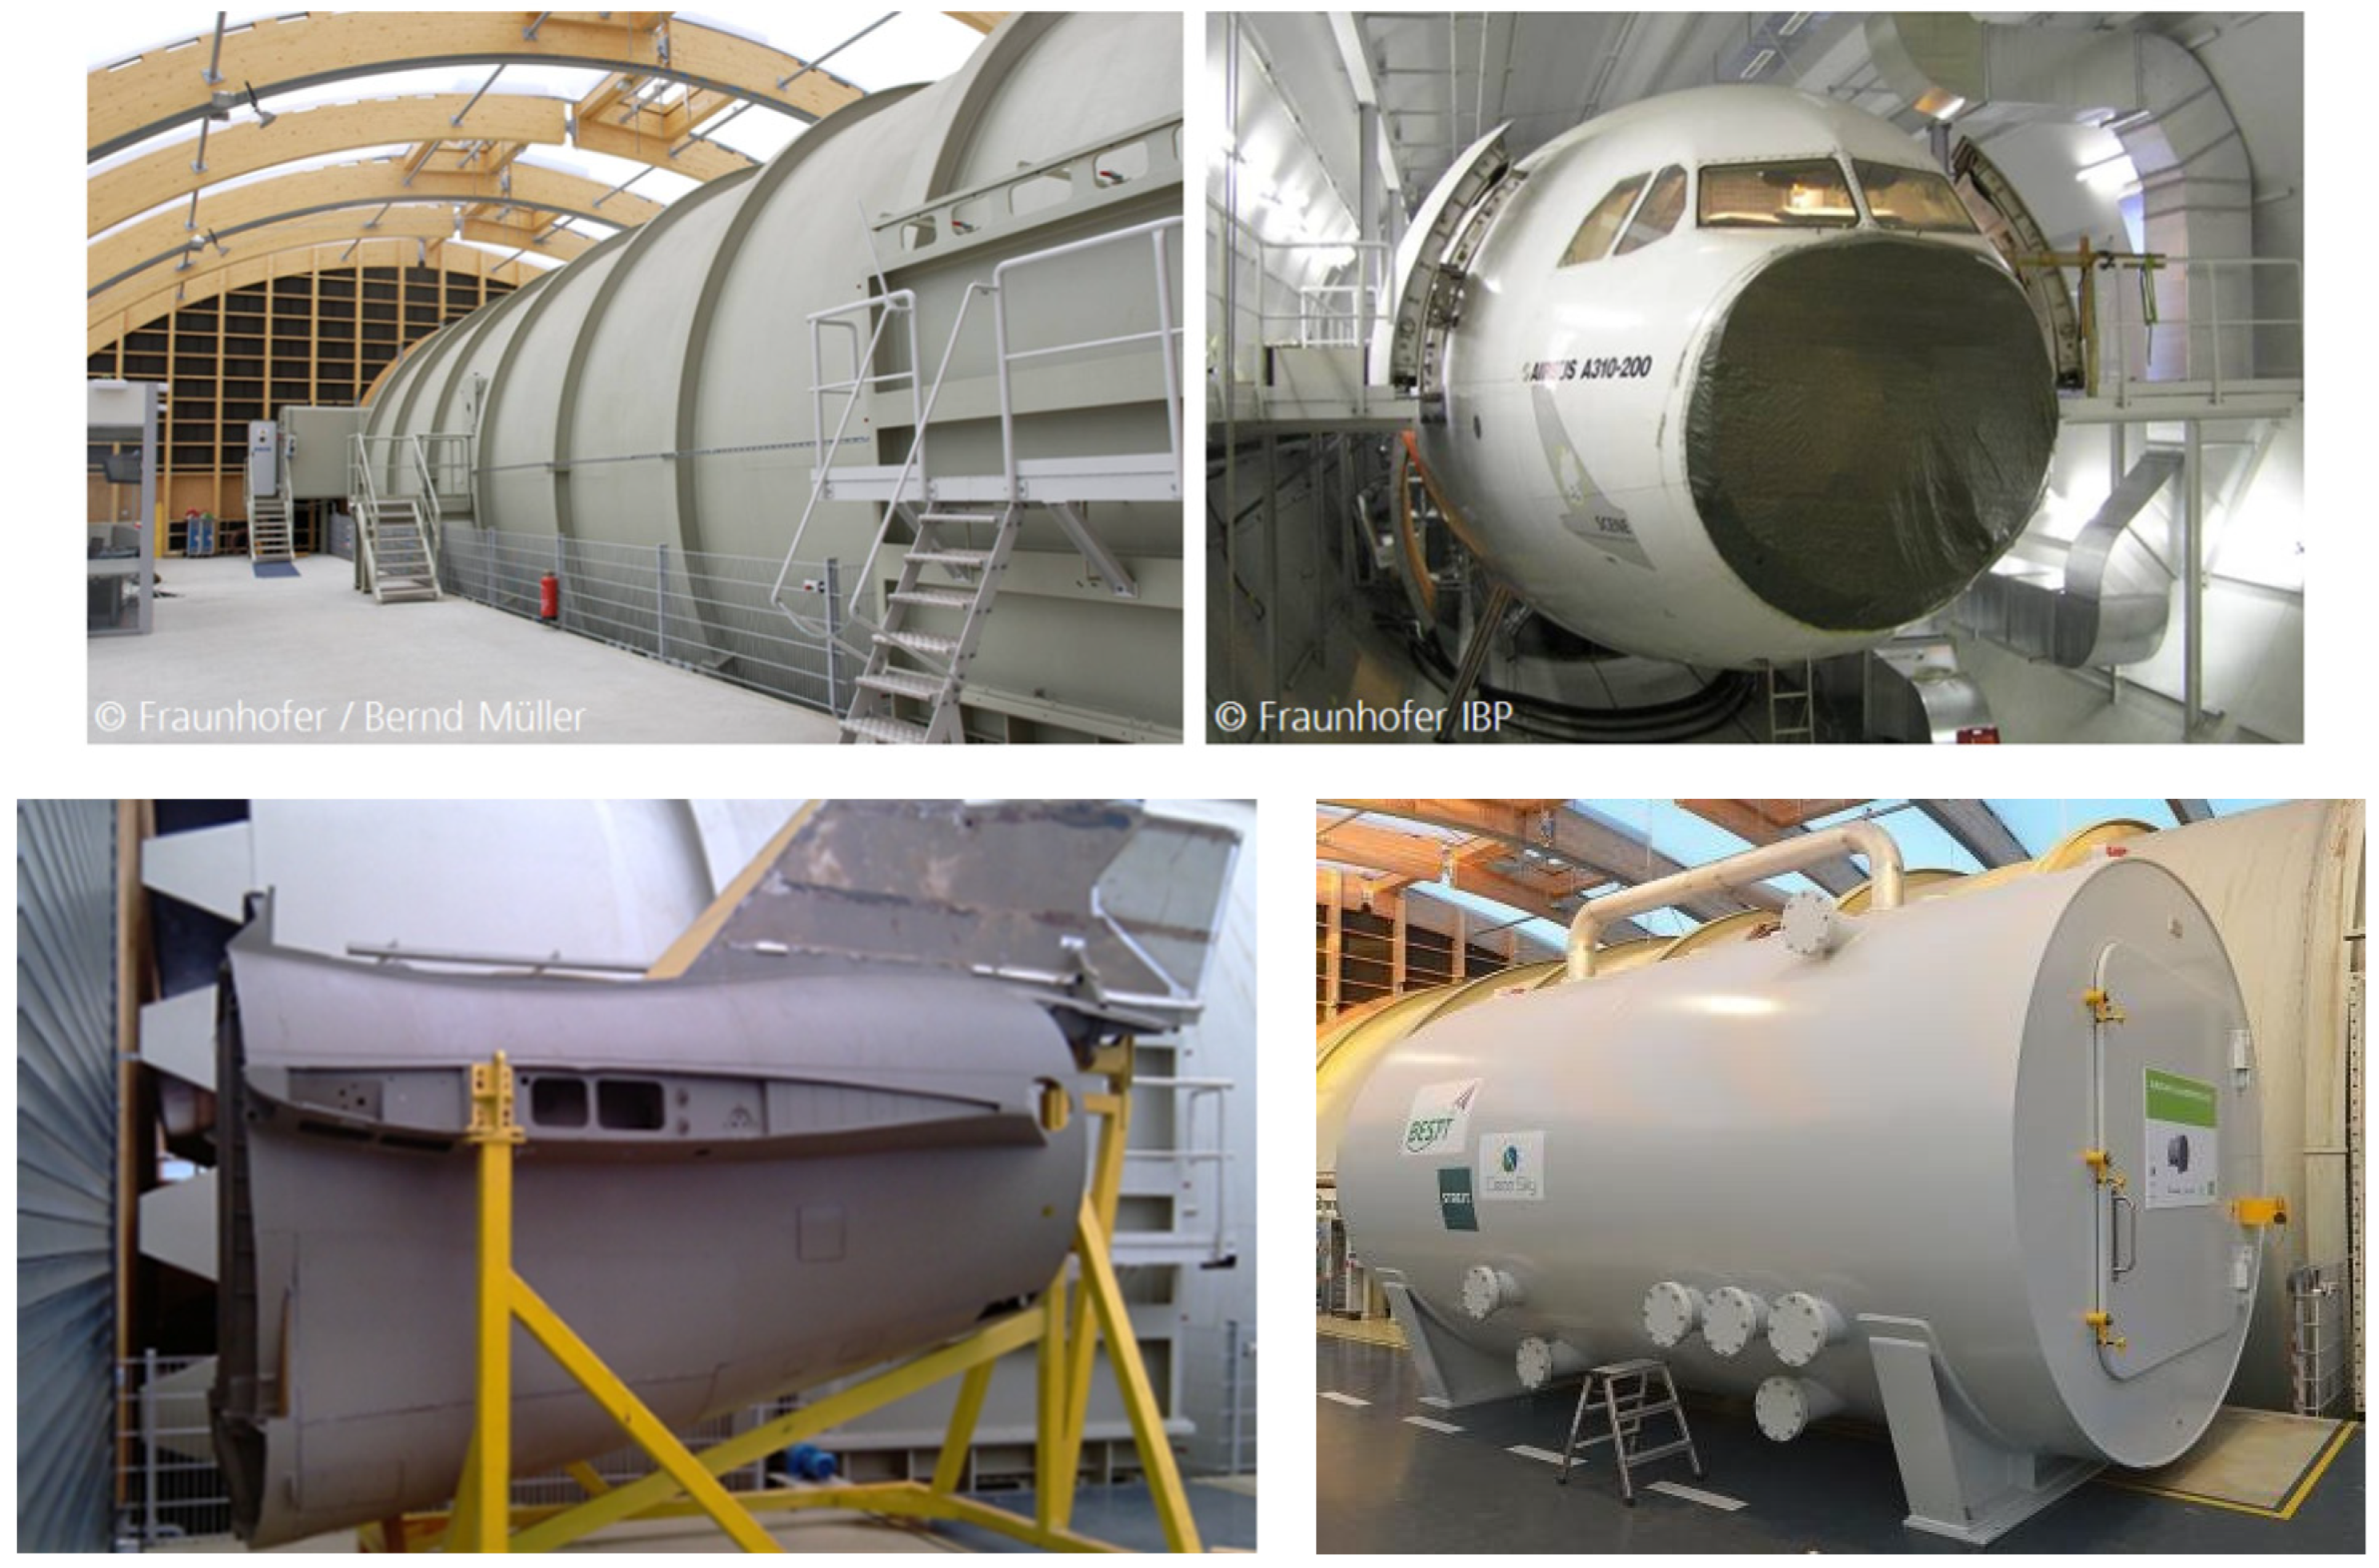
The Flight Test Facility (
Figure 1) is a testing environment that allows for the investigation of prototype test items on the ground under realistic temperature and pressure conditions. It consists of two low-pressure chambers, a wide-body front fuselage mock-up, including the cabin, crown, galley, cockpit, avionics bay, fwd cargo, and bilge. Furthermore, it hosts three business jet demonstrators (cockpit section, cabin, and empennage). These mock-ups can be operated at cabin pressures down to 568 hPa. An exterior cooling system allows temperatures to reach down to −50 °C on the business jet demonstrators and −30 °C on the wide-body demonstrator. Through this, the total temperature and pressure in the cruise can be replicated on the mock-up skin. The Aircraft Calorimeter allows for the simulation of lower pressures down to 5 hPa and −60 °C and is suited for component testing in extreme climates.
This paper outlines past thermal tests performed in the test bench and future developments that will enhance its capability and ensure its pertinence for future research opportunities. These are:
Investigation of heat pipes to increase thermal conductivity
Investigation of normal operation and failure scenarios in the airliner avionics compartment
Thermal model validation measurements for the more-electric business jet
Enhanced skin heat dissipation
Future developments for the thermal test bench focus on the following items:
Provision of a 250 kW heat source
Integration of cryogenic cooling using LN2 to emulate LH2
Parallel operation of test chambers at different pressures to replicate exterior and cabin pressure
2. Thermal Tests Performed on the Flight Test Facility Test Bench
2.1. Heat Pipe Investigation
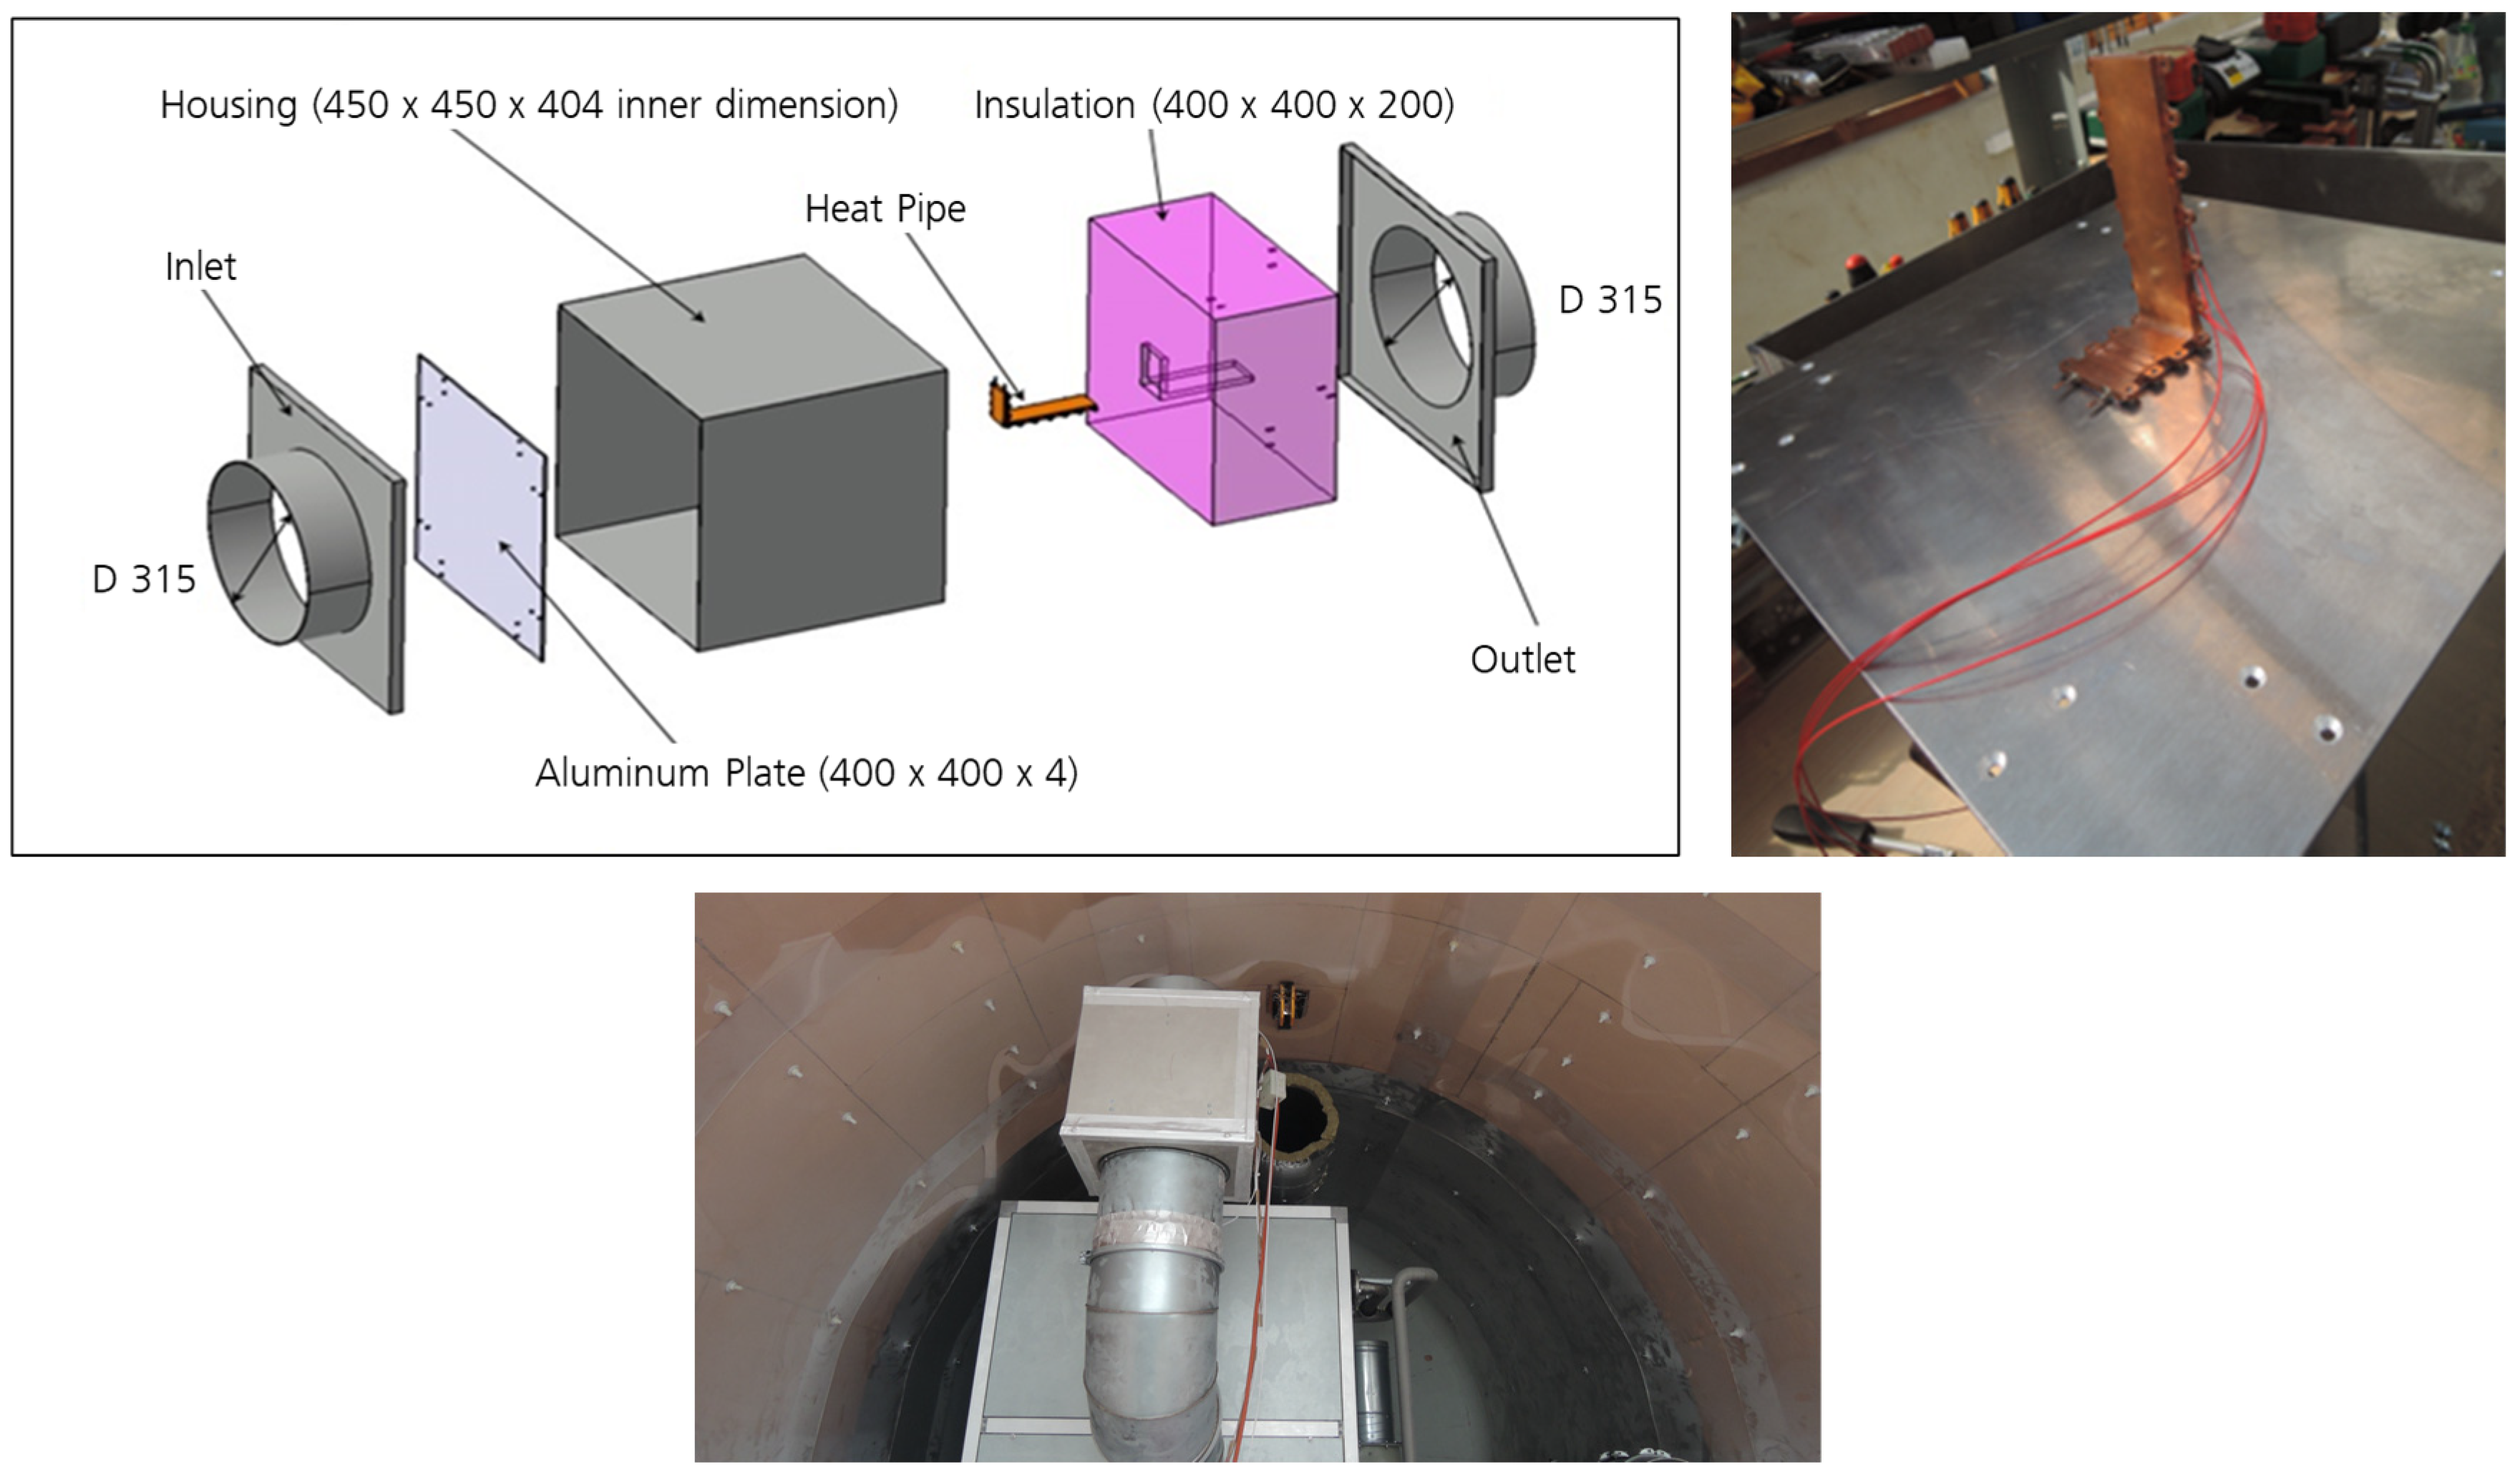
Ultimately, the environment remains the only sink for heat during flight. Heat pipes use a self-driven cycle of fluid flowing between a condenser (ejection of heat) and an evaporator (absorption of heat) to enhance thermal conductivity. A prototype heat pipe using water as the fluid was investigated in the aircraft calorimeter. Two questions were to be answered: whether the orientation impacts performance, as gravity might ease the downward movement of the liquid phase, and which conductivity enhancement can be obtained. An L-shaped heat pipe made of copper was mounted with the condenser (
Figure 2) on a metal plate to emulate the exterior aircraft skin. An electric heat foil (38 × 102 mm) was mounted on the evaporator of the heat pipe. The installation was housed in a Styrofoam block to inhibit secondary heat losses (
Figure 1). An airflow was directed straight onto the skin plate to replicate a thermal convective heat transfer coefficient of approx. 100 W/m
2 K as encountered in flight. The setup was placed inside a housing so that air could flow around it, and it was connected to the ventilation system of the Aircraft Calorimeter chamber (
Figure 1 bottom). Different heat flow rates and thermal boundary conditions were applied.
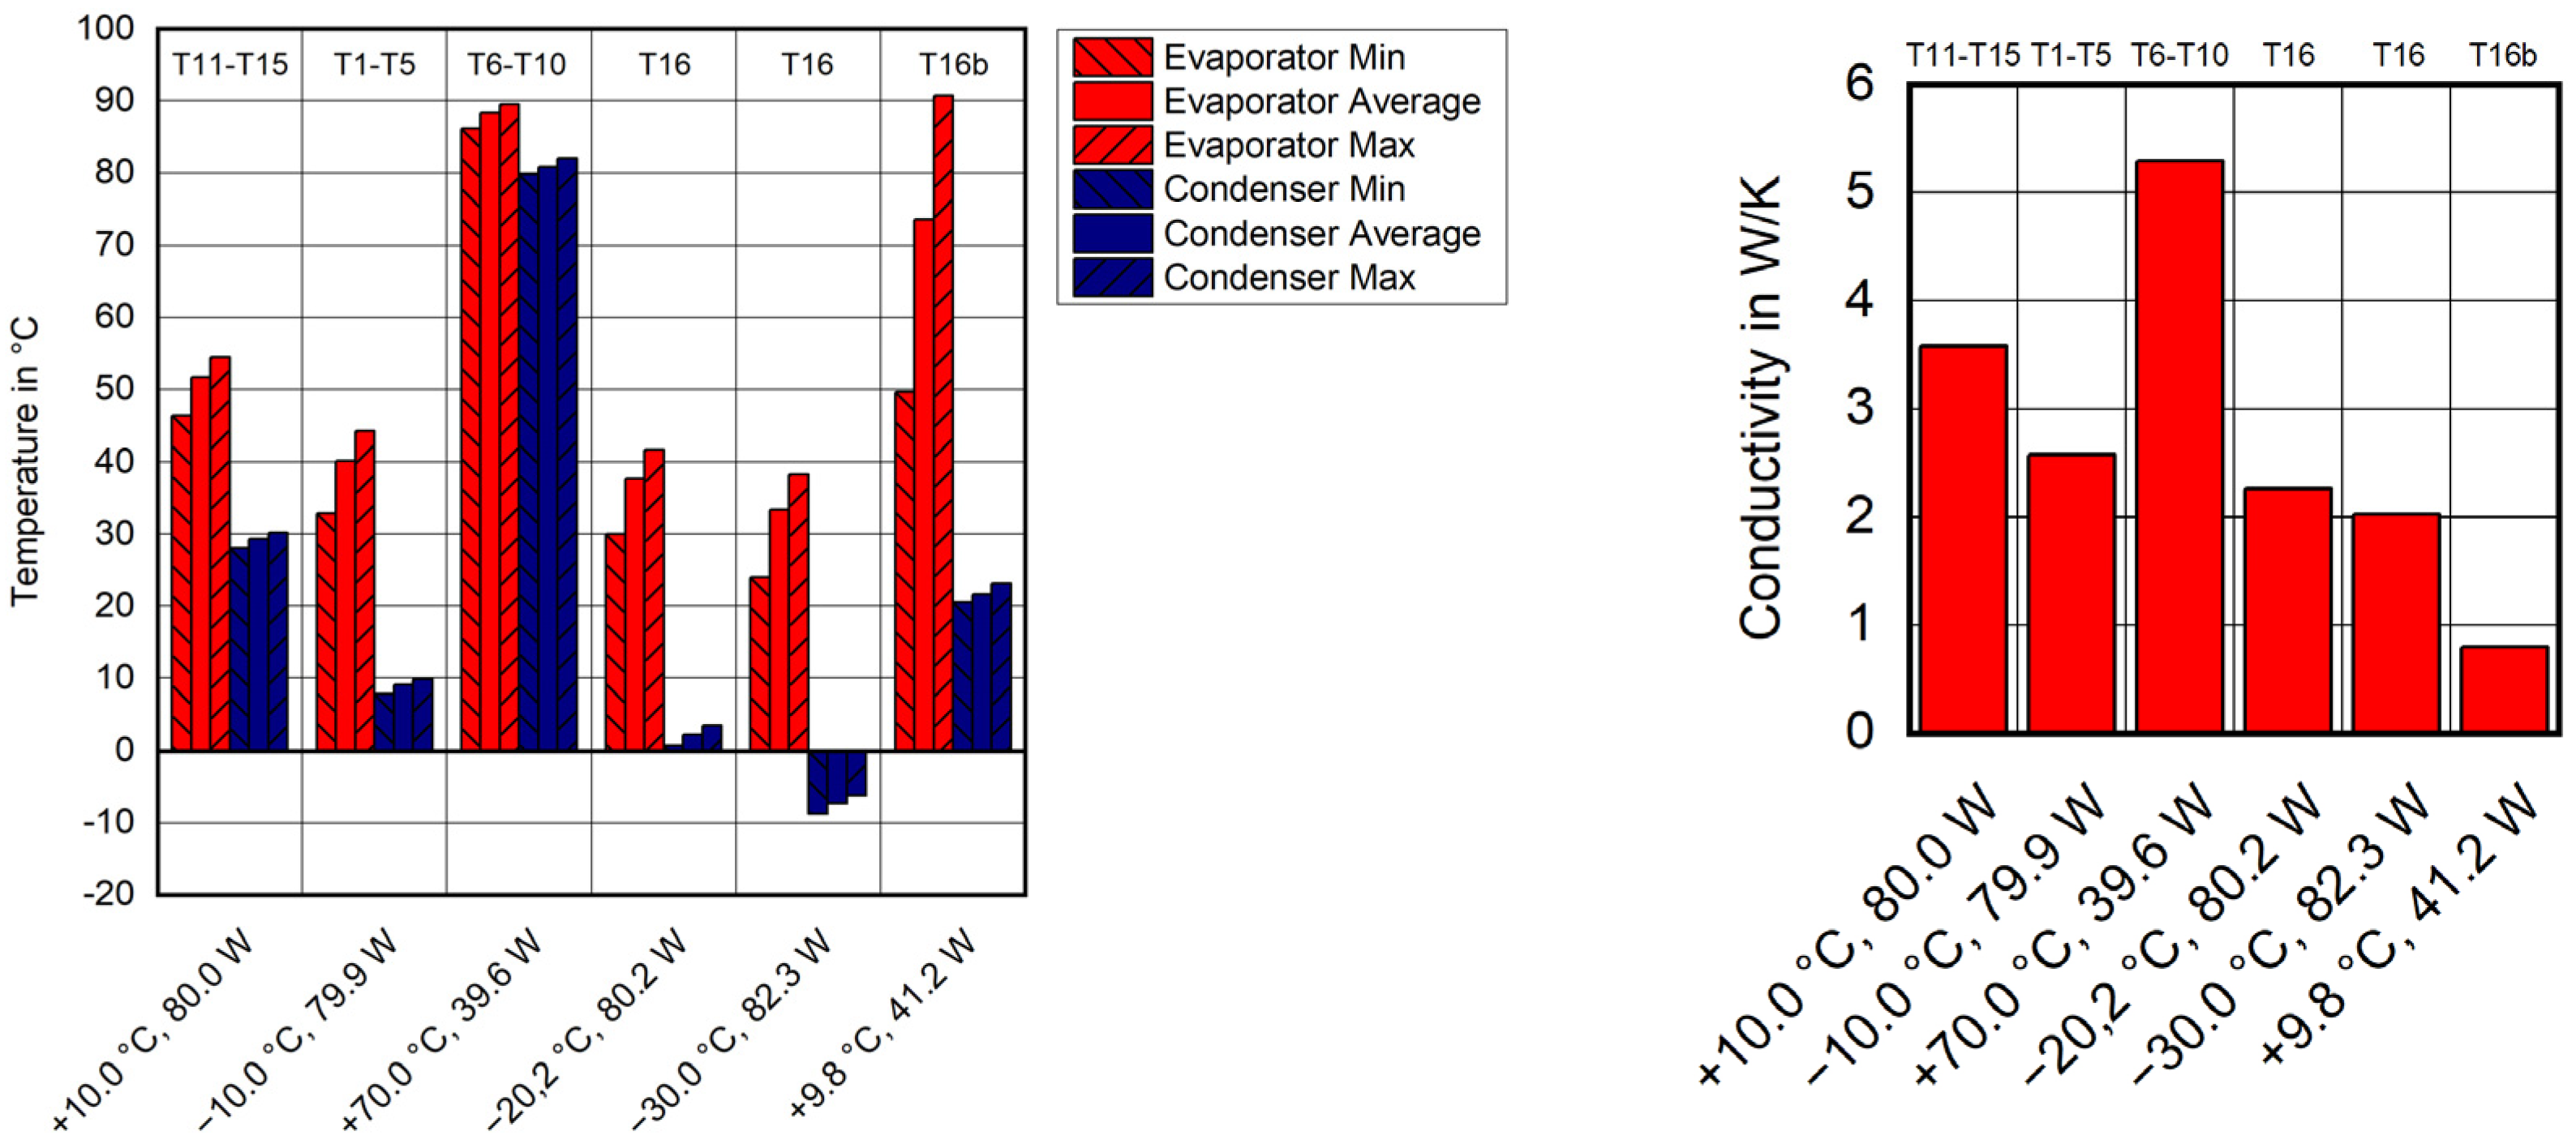
The test was performed in steps. First, an exterior air temperature on the skin plate of +10 °C was tested with a total heat flow of 80 W. This is equivalent to a heat inflow of 20.6 kW/m
2. Then, the temperature was altered to −10 °C and +70 °C. At +70 °C, the heat load had to be reduced to 40 W to avoid overheating. In these tests, the orientation of the heat pipe was altered, leading to the ranges shown in
Figure 2 on the left. Rotation does hardly alter the heat pipe’s temperature distribution. Hence, the effect of gravity is minor compared to the expansion due to evaporation and the capillary suction of liquid water in the system.
In the next two tests, the exterior temperature was subsequently lowered to −20 and −30 °C at 80 W of heat ingress. Then, the heat load was switched off, causing the heat pipe to freeze. After bringing it back to melting temperatures again, it was revealed that the cycle did not restart anymore at +10 °C, and only 40 W of heat could be dissipated. Here, the dissipation occurred through pure conduction through the L-shaped copper geometry. Therefore, thermal gradients along the heat pipe increased.
Figure 3 (left) shows the evaporator and condenser temperatures measured. From the temperature difference and the applied heat load, the effective conductivity can be computed. A trend of higher conductivity at higher temperatures is obvious; however, at excessively high temperatures (+70 °C), the transmissible heat flow decreases. After the heat pipe was frozen and thus destroyed, the solid conductivity was found to be 0.8 W/K. The functioning cycle of water in the heat pipe thus leads to an increase in conductivity of 250 to 670 % and transmissible flow rates of up to 20.6 kW/m
2.
2.2. Normal and Failure Cases in the Airliner Avionics Compartment
To assess the thermal boundary condition in the avionics compartment under normal and failure cases [
1], a thermal emulation of racks equipped with LRUs was integrated in the wide-body mock-up (
Figure 4).
The skin was cooled or heated to obtain the required exterior boundary condition. The avionics heat load was replicated by heat foils, amounting to a total of 15.6 kW of heat release. The following cases were investigated, leading to the main conclusions and temperature distributions shown in
Figure 5:
Cruise at −14 °C, normal operation: Reference case
Hot day on the ground, 37 °C, normal operation: The avionics supply air temperature reaches 6 K higher temperature, and the average air temperature in the avionics increases by 16.5 K compared to the cruise case.
Loss of blowing: This leads to a cooler air temperature in the avionics bay because less heat is ejected into the compartment. On the other hand, equipment cooled by blowing increases in temperature, but remains below the threshold of 180 °C set out for the test.
Loss of extraction: This leads to a strong increase in avionics bay air temperature, as the heated blowing air is not extracted. Still, temperatures remain in a similar range as the 37 °C ground case.
Total loss of ventilation: This test had to be aborted after 30 min because LRU emulators reached the critical threshold of 180 °C.
It can be concluded that the avionics bay has some reserves to cope with a loss of blowing or loss of extraction scenario by using skin conductivity for cooling. However, a total loss of ventilation must be avoided and mitigated as quickly as possible.
2.3. Thermal Model Validation of the More Electric Business Jet
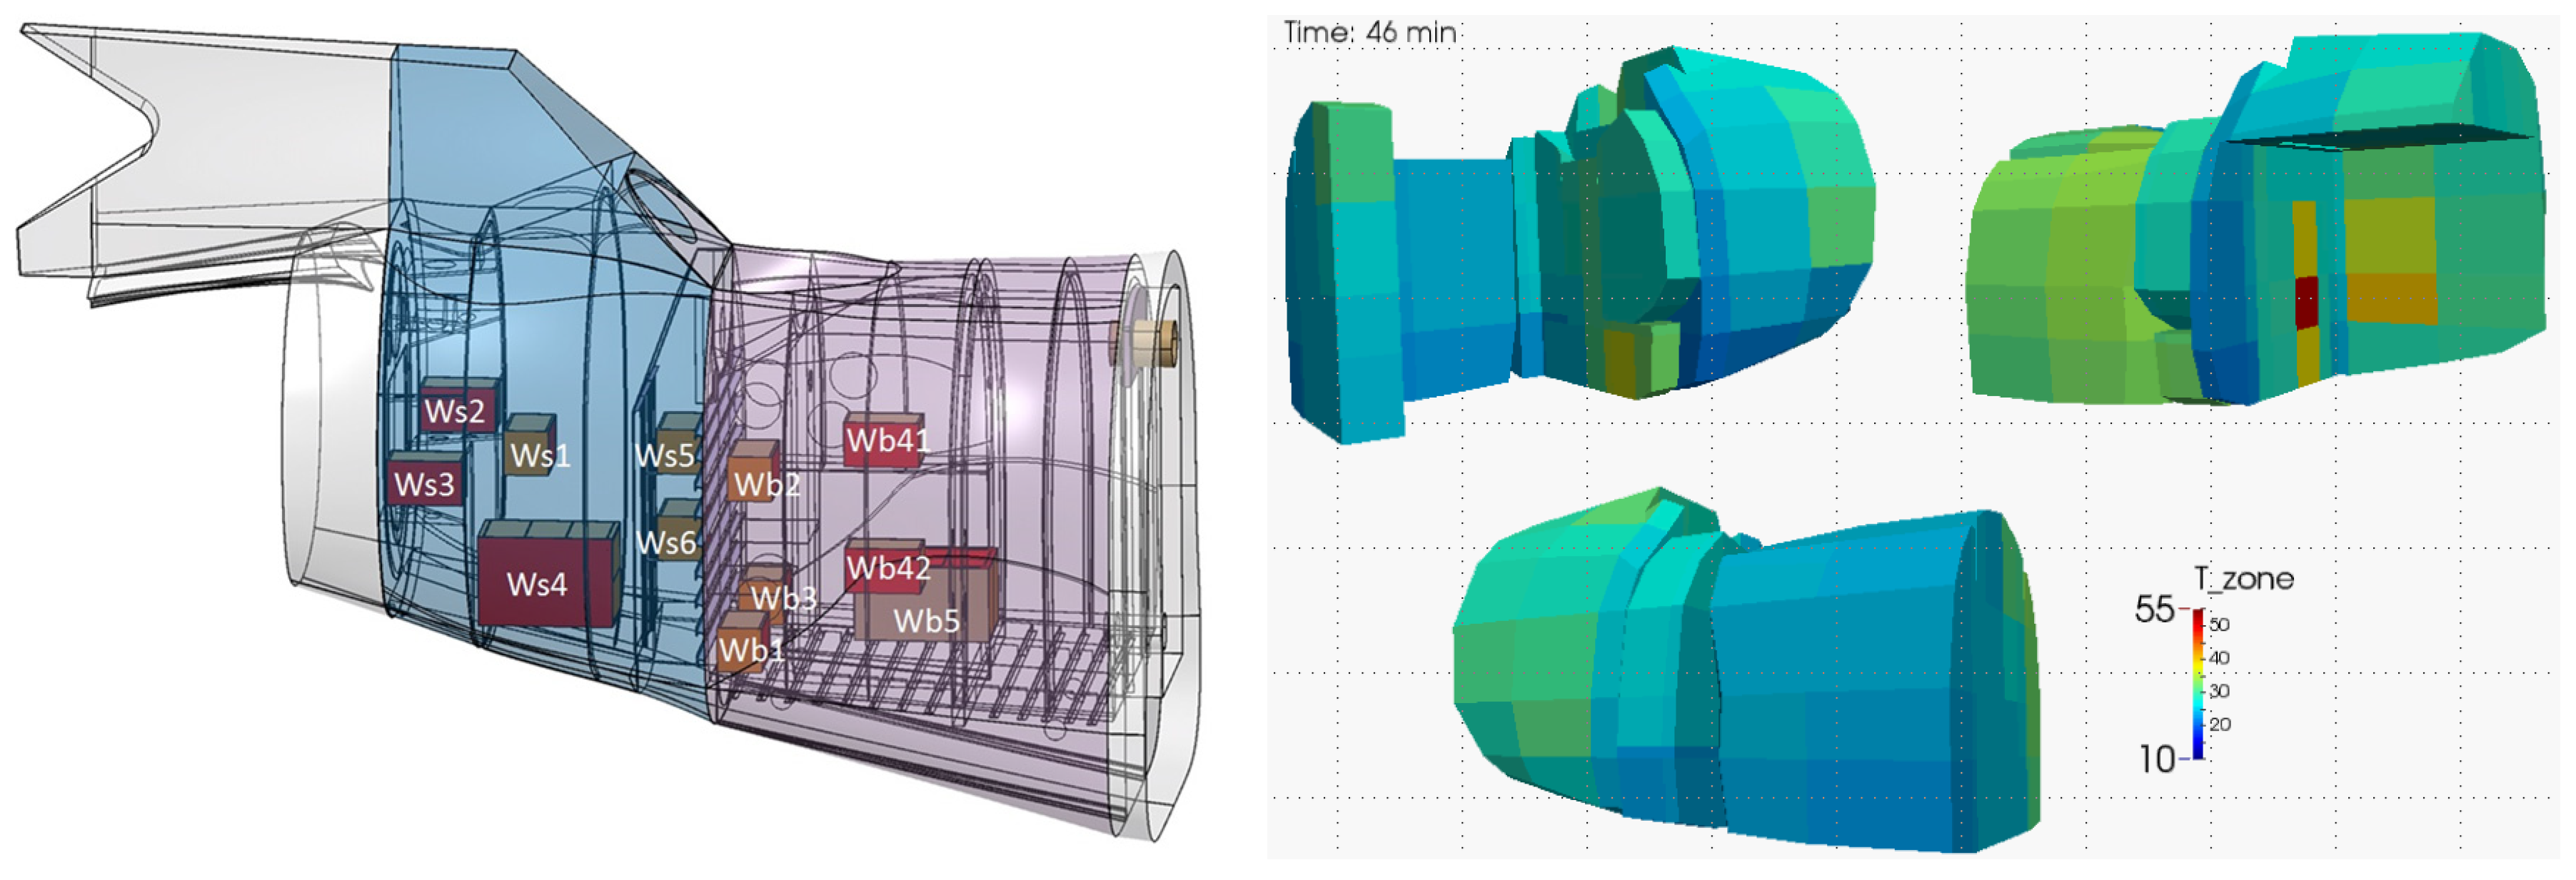
The trend toward higher electrification is even perceivable in the business jet application. To predict equipment temperatures under different thermal management strategies and throughout the entire flight envelope, the zonal modeling approach was developed and validated through thermal tests on the business jet demonstrator. Zonal models subdivide the interior space into rectangular zones that exchange heat and air. Furthermore, a radiation module calculates radiative heat exchanges for hot equipment [
3,
4]. The approach has a noticeably lower computation time than CFD models but still allows for the consideration of local distribution of sources.
Figure 6 shows the geometry of the simulation model and the zonal decomposition with predicted temperature distribution.
In the business jet, the avionics equipment is mainly located in the aft fuselage, which consists of a pressurized and an unpressurized section. The potential of air to cool the equipment was investigated under a broad range of conditions, including variations in:
Cabin and exterior pressure
Ground conditions using the chimney effect to generate airflow
Ram air flushing of unpressurized area
Normal and failure ECS operation cases
Hot and cold diversion cases
In total, 144 stabilized equipment temperatures were collected for 12 different equipment simulators throughout the operational points. Equipment temperatures typically reached around 100 °C.
Figure 7 shows the distribution of deviations between the simulation and the model. A total of 75% of predicted equipment temperatures were within ±5 K, and 96% within ±10 K. The single case with a deviation larger than 20 K occurred because the equipment was located directly behind a blower and thus received high cooling from a local jet, which is not modeled in the zonal approach exchanging air over the entire surface of a zone. The study proves that the zonal model is a valid tool for assessing the impact of different operational scenarios on the internal temperature distribution within a relatively short time.
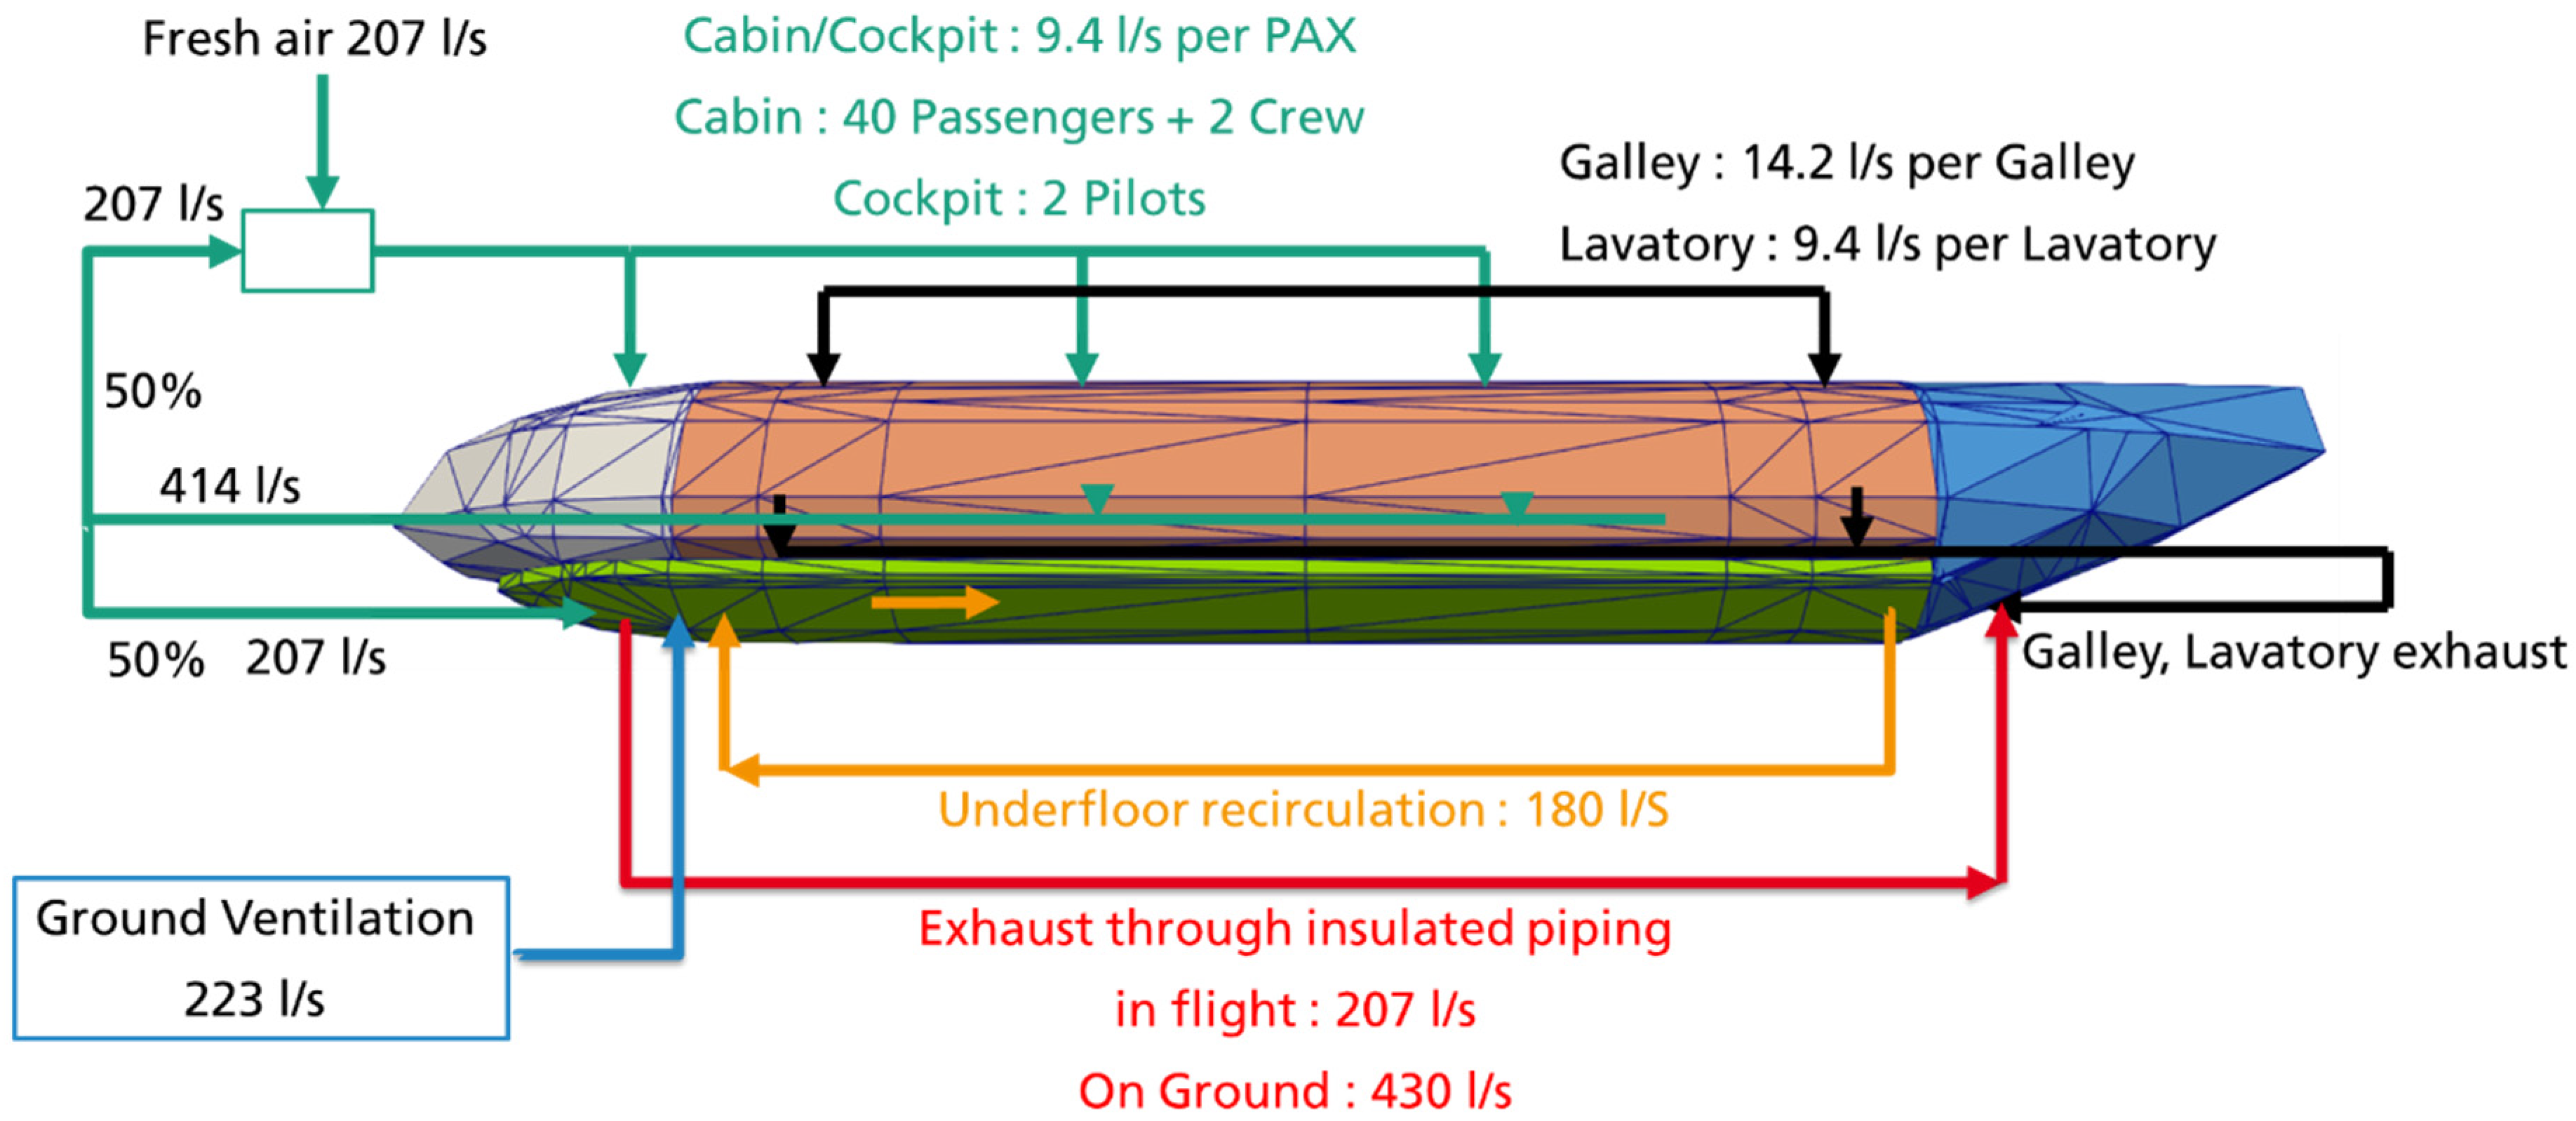
2.4. Enhanced Skin Dissipation
Currently, the Flight Test Facility is being refurbished as part of the ORCHESTRA project to investigate the potential of the bilge to further dissipate heat. For this, an underfloor recirculation between the bilge and avionics compartments is integrated that makes use of the cold bilge skin as a heat sink. Additionally, cabin exhaust air is used to cool the avionics compartment. Hot avionics exhaust air is ducted to the outflow valve to reduce its heat dissipation into the bilge (
Figure 8).
A yet unused heat-exchanging area is the skin behind the sidewall. Today, efforts are made to prevent air from flowing behind the sidewall to the cold skin, as this leads to the buildup of condensate and ultimately can result in “rain in the plane” [
5]. Therefore, the idea was developed to recirculate air behind the sidewall, thereby releasing heat to the fuselage skin while not guiding new, moist air to the cold skin. This study is further described in [
6]. It is estimated that a heat loss of 24 kW could be achieved on a typical single-aisle jet aircraft.
3. Thermal Test Bench Future Enhancements
The Fraunhofer Thermal Test Bench has already proven its capability to investigate thermal management questions in the aerospace sector. Still, to cope with new challenges in decarbonizing the aircraft sector, some developments are necessary and planned. To ensure the future of the Flight Test Facility, it is intended to extend both its capability to provide and remove heat.
3.1. Provision of 250 kW Heat Source
In current applications, heat is merely generated by electric foils. However, new designs reaching the MW threshold of total heat release need to be tested under higher heat loads. In order to provide such high heat loads, a liquid-based system connected to a thermal gas burner will be extended. Similar to domestic heating, but on a larger scale, the liquid cycle allows for accurate control of the heat flow rate by modifying the mixing ratio of heated and backflowing water and by altering the flow rate. Using water allows for carrier temperatures up to approx. 80 °C, which is typically close to the max. operational temperature of electronics. This extension could, for example, be used to show the potential to cool a battery by ram air in the Aircraft Calorimeter. For this, the test chamber can be brought to external pressure, and a fan can produce a large amount of cooled air used to lower the temperature of the hot water.
3.2. Integration of Cryogenic Cooling
Another path of development on the cooling side is the use of cryogenic LH2 from the tank to provide cooling before it is chemically used for energy generation. To assess such designs, a liquid nitrogen distribution infrastructure will be set up at the laboratory. The setup includes an evaporator to investigate the potential for using gaseous low-temperature fluids in cooling applications. The advantage of using LN2 to emulate the cryogenic fluid is that safety constraints are noticeably lower, making the test setup and operation easier and ultimately more cost-effective.
3.3. Parallel Pressure Chamber Operation
The electrification of the aircraft fleet necessitates the replacement of the classical bleed air-based ECS with an electric one. To test such designs within a realistic temperature and pressure envelope, two chambers are needed: one that emulates the exterior conditions at flight altitude pressure and temperature, and one that emulates cabin pressure. The interconnection of the Aircraft Calorimeter and the large low-pressure vessel, as shown in
Figure 9, will allow for such testing to be performed in the future. Currently, work is being planned to ensure the parallel use of both chambers at different pressure levels.
4. Conclusions
This paper provided an exemplary overview of thermal management research conducted in the past at the Thermal Test Bench of the Fraunhofer Flight Test Facility. While in the past it was still possible to emulate heat loads with electrical heaters and cool them with air provided by the ECS, future applications require higher heat loads in testing and more powerful heat sinks than ventilation air. For these challenges, the Flight Test Facility is currently being enhanced to continue providing valuable contributions to national, European, and international research collaborations in the future.
Author Contributions
Conceptualization, methodology, formal analysis, investigation, data curation V.N., M.P. and A.P.; software, validation A.P., writing—original draft preparation, V.N.; writing—review and editing, M.P. and A.P.; Test setup, M.K. and M.P. All authors have read and agreed to the published version of the manuscript.
Funding
This research was funded by the European Community’s Clean Sky JTI under grant agreement no CSJU-GAM-ED-2008-001, the German “Bundesministerium für Wirtschaft und Technologie” grant agreement no. 20Y0803I, from the HORIZON-JU-Clean-Aviation-2022-01, Project: 101102008—TheMa4HERA and ORCHESTRA under Grant Agreement number: 101006771.
![Engproc 90 00103 i001]()
Data Availability Statement
Some data presented here can be shared upon request.
Conflicts of Interest
The authors declare no conflicts of interest.
References
- Pschirer, M.; Kirmayr, T.; Grün, G. Full-Scale Experimental Investigations on Different Operating Modes of the Avionics Ventilation System. In Proceedings of the Workshop on Aircraft Systems Technologies AST2013, Hamburg, Germany, 23–24 April 2013. [Google Scholar]
- Clean Aviation: CAJU-GB-2022-03-16 Annex Call 1 Topics Descriptions. 2022. Available online: https://clean-aviation.eu/sites/default/files/2022-03/CAJU-GB-2022-03-16%20Annex-Call-1-topics-descriptions_published.pdf (accessed on 3 April 2025).
- Norrefeldt, V.; Grün, G.; Sedlbauer, K. Velocity propagating zonal model for the estimation of the airflow pattern and temperature distribution in a confined space. Build. Environ. 2012, 48, 183–194. [Google Scholar] [CrossRef]
- Pathak, A.; Norrefeldt, V.; Lemouedda, A.; Grün, G. The Modelica Thermal Model Generation Tool for Automatted Creation of Coupled Airflow, Radiation Model and Wall Model in Modelica. In Proceedings of the 10th Modelica Conference, Lund, Sweden, 10–12 March 2014. [Google Scholar]
- Huber, P.; Schuster, K.; Townsend, R. Controlling Nuisance Moisture in Commercial Airplanes. Aero 05. 1999. Available online: https://www.boeing.com/commercial/aeromagazine/aero_05/m/m01/index.html (accessed on 13 September 2021).
- Norrefeldt, V.; Riedl, G. Use of the cabin sidewall for thermal management application. In Proceedings of the Engineering Proceedings of the EASN Conference, Thessaloniki, Greece, 8–11 October 2024. [Google Scholar]
| Disclaimer/Publisher’s Note: The statements, opinions and data contained in all publications are solely those of the individual author(s) and contributor(s) and not of MDPI and/or the editor(s). MDPI and/or the editor(s) disclaim responsibility for any injury to people or property resulting from any ideas, methods, instructions or products referred to in the content. |
© 2025 by the authors. Licensee MDPI, Basel, Switzerland. This article is an open access article distributed under the terms and conditions of the Creative Commons Attribution (CC BY) license (https://creativecommons.org/licenses/by/4.0/).


