
Image Classification to Identify Style Composition Ratios in Crossover Cars †


Abstract
1. Introduction
2. Related Work
2.1. AI in Industry
2.2. AI-Driven Automotive Styling
2.3. Image Recognition Technology
2.3.1. Applications of Machine Learning
2.3.2. Image Feature Extraction Techniques
3. Methods
3.1. Procedure
3.1.1. Data Collection and Preprocessing
3.1.2. Feature Extraction and Model Training
3.1.3. Application and Expert Evaluation
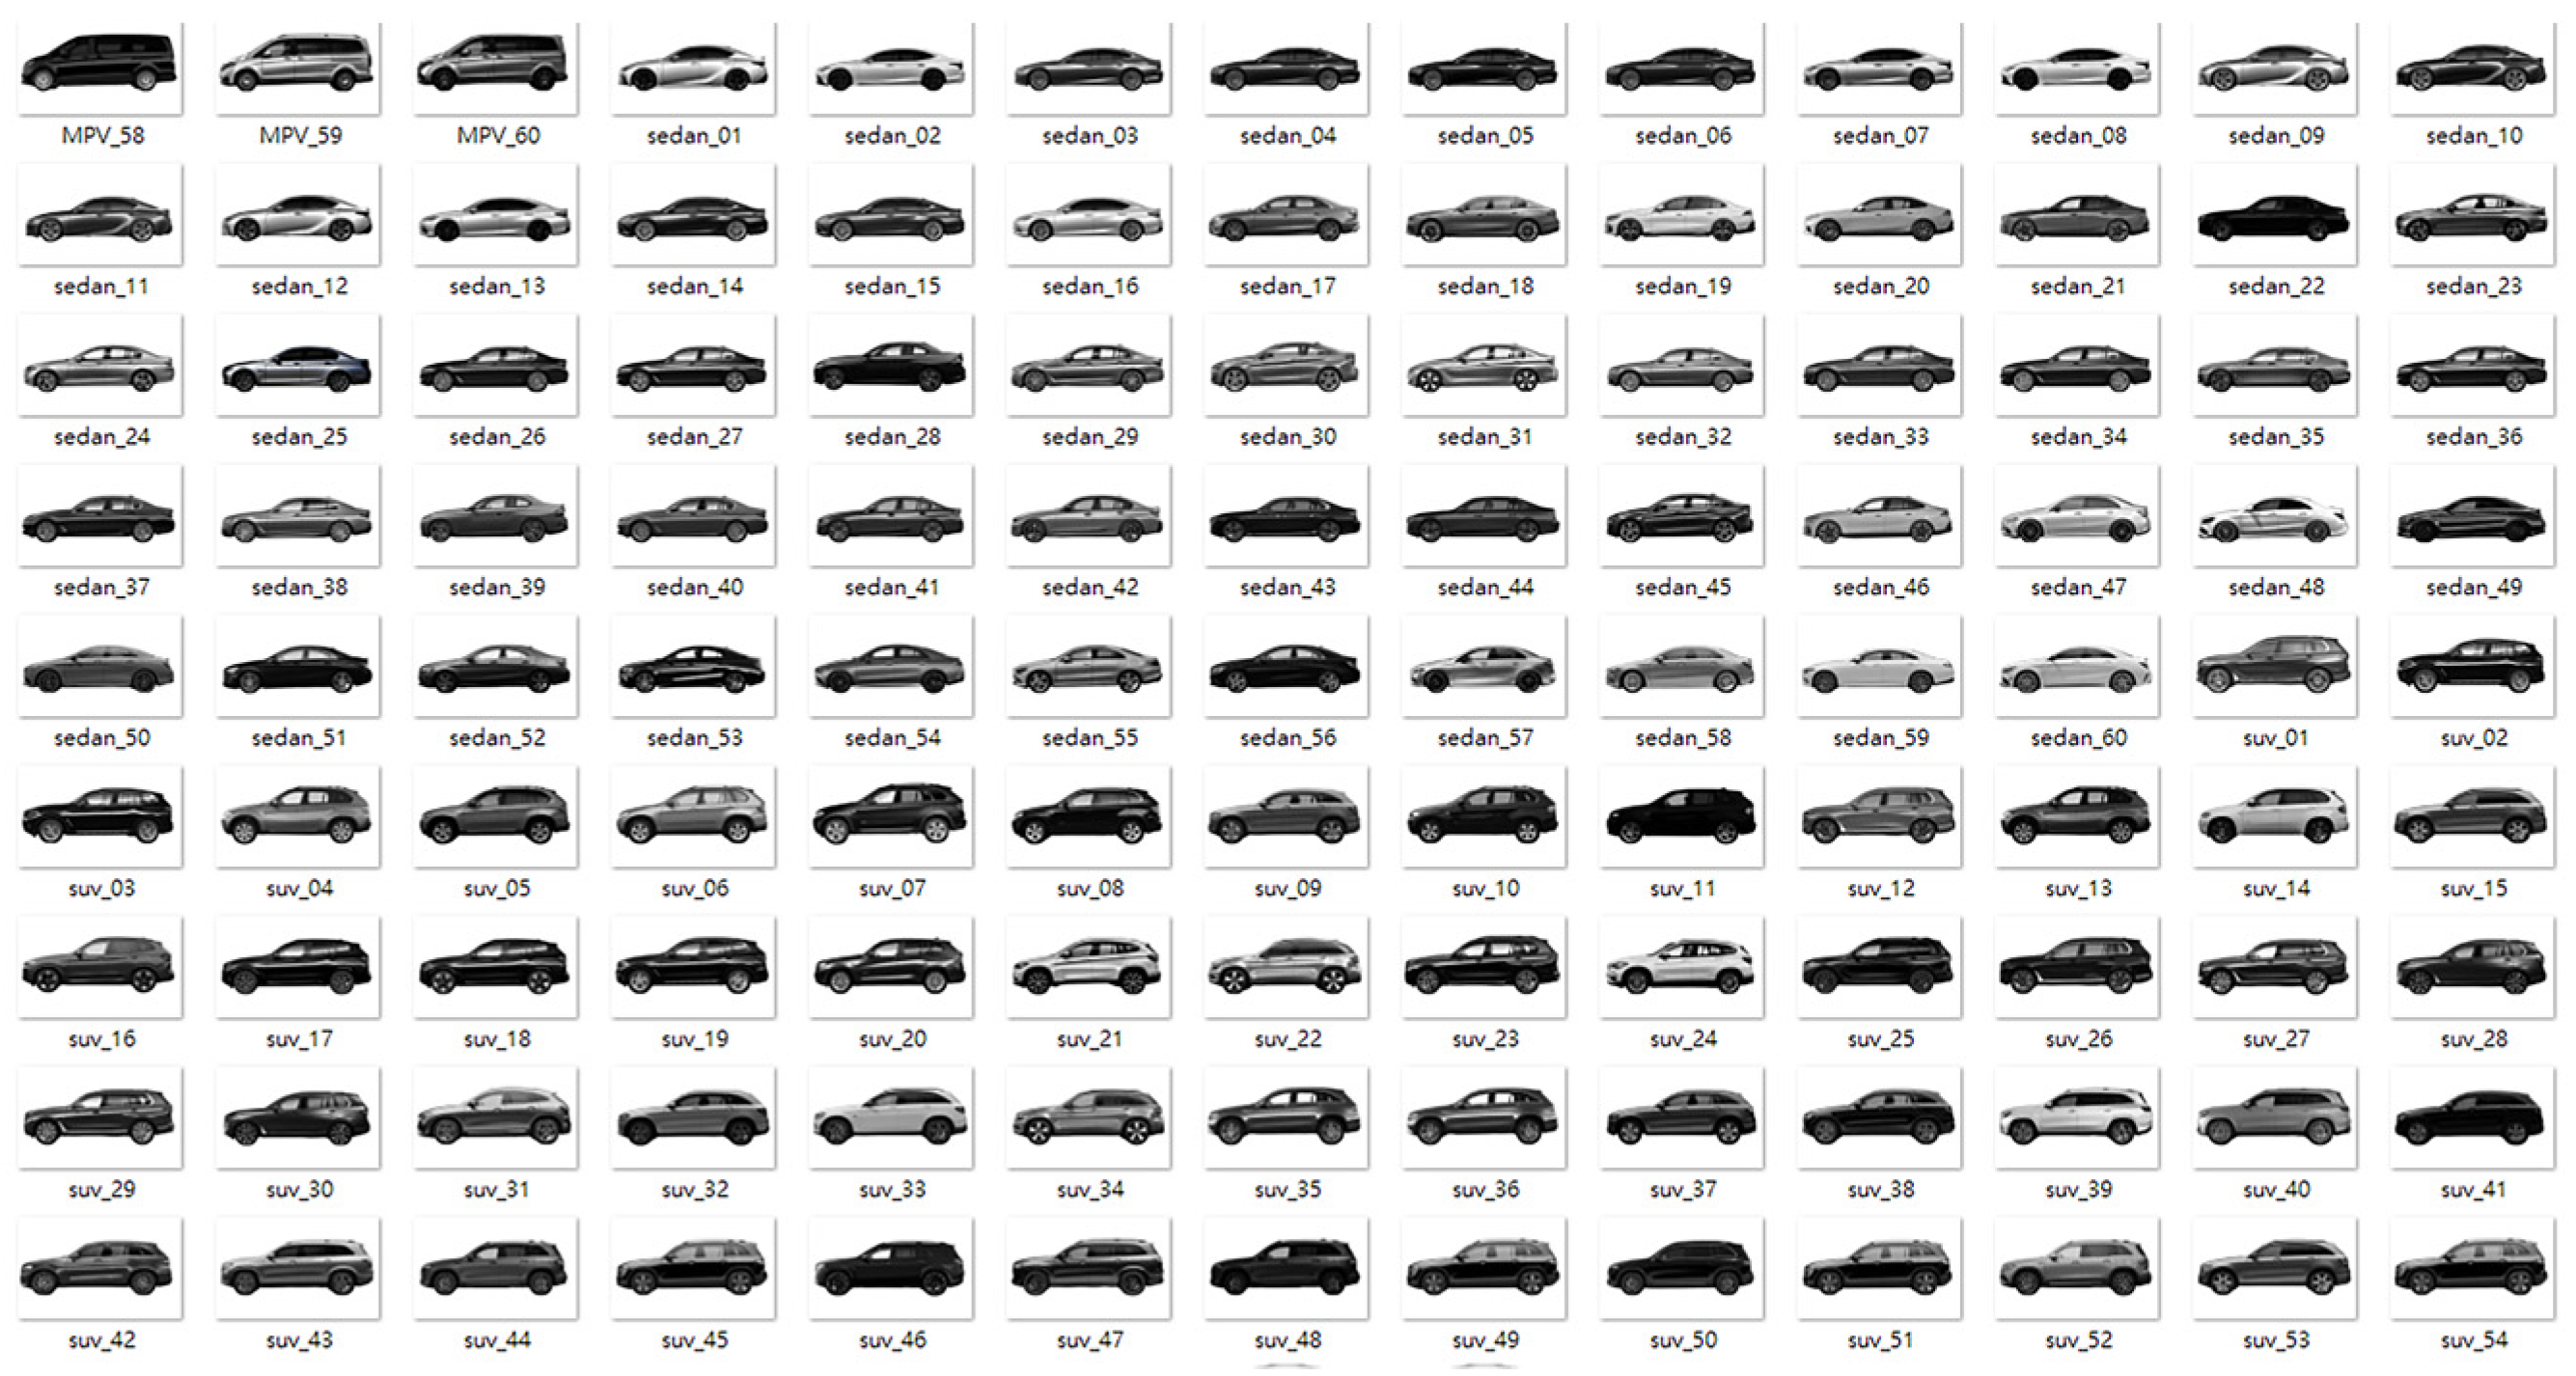
3.2. Data Collection
3.3. Data Preprocessing
3.4. Feature Extraction and Classification Techniques
3.5. Validation and Testing
3.5.1. Reasonableness of Analyzed Car Model
3.5.2. Use of the Classification Model in Predicting Car Sales Trends and New Car Model Design
4. Conclusions
Author Contributions
Funding
Institutional Review Board Statement
Informed Consent Statement
Data Availability Statement
Conflicts of Interest
References
- Agarwal, T.; Saroha, N.; Kumar, G. Consumer Behaviour Analysis for Purchasing a Passenger Car in Indian Context. In Proceedings of the Mathematical Analysis II: Optimisation, Differential Equations and Graph Theory: ICRAPAM 2018, New Delhi, India, 23–25 October 2020; pp. 165–177. [Google Scholar]
- Guan-Chun, Z. 2023 Global Electric Vehicle Sales Ranking: PHEVs and Mini Cars Become Market Favorites. Available online: https://www.artc.org.tw/tw/knowledge/articles/13733 (accessed on 10 July 2024).
- Verganti, R.; Vendraminelli, L.; Iansiti, M. Innovation and Design in the Age of Artificial Intelligence. J. Prod. Innov. Manag. 2020, 37, 212–227. [Google Scholar] [CrossRef]
- Iansiti, M.; Lakhani, K.R. From Disruption to Collision: The New Competitive Dynamics. MIT Sloan Manag. Rev. 2020, 61, 34–39. [Google Scholar]
- Liedtka, J. Perspective: Linking Design Thinking with Innovation Outcomes through Cognitive Bias Reduction. J. Prod. Innov. Manag. 2014, 32, 925–938. [Google Scholar] [CrossRef]
- Bayyou, D. Artificially intelligent self-driving vehicle technologies, benefits and challenges. Int. J. Emerg. Technol. Comput. Sci. Electron. 2019, 26, 5–13. [Google Scholar]
- Wang, J.; Ma, Y.; Zhang, L.; Gao, R.X.; Wu, D. Deep learning for smart manufacturing: Methods and applications. J. Manuf. Syst. 2018, 48, 144–156. [Google Scholar] [CrossRef]
- Dhingra, S.; Madda, R.B.; Patan, R.; Jiao, P.; Barri, K.; Alavi, A.H. Internet of things-based fog and cloud computing technology for smart traffic monitoring. Internet Things 2021, 14, 100175. [Google Scholar] [CrossRef]
- Kamencay, P.; Markovic, M.; Dubovan, J.; Dado, M.; Benedikovic, D. Neural-Network-Optimized Vehicle Classification Using Clustered Image and Fiber-Sensor Datasets. IEEE Access 2023, 11, 41315–41324. [Google Scholar] [CrossRef]
- Hicham, B.; Ahmed, A.; Mohammed, M. Vehicle Type Classification Using Convolutional Neural Network. In Proceedings of the 2018 IEEE 5th International Congress on Information Science and Technology (CiSt), Marrakech, Morocco, 21–27 October 2018; pp. 313–316. [Google Scholar]
- Wang, H.-H.; Shen, Y.-Y.; Hung, Y.-Y. Car Types and Semantics Classification Using Weka. In Proceedings of the 2022 5th Artificial Intelligence and Cloud Computing Conference, Osaka, Japan, 17–19 December 2022; pp. 34–41. [Google Scholar]
- Wang, H.-H.; Liu, C.-K.; Yu, S.-B. Predicting Consumer Preferences by the Deformation Threshold of Product Appearance. In Proceedings of the 2023 IEEE 5th Eurasia Conference on Biomedical Engineering, Healthcare and Sustainability, Tainan, Taiwan, 2–4 June 2023. [Google Scholar]
- Wang, H.-H.; Chen, C.-P. A case study on evolution of car styling and brand consistency using deep learning. Symmetry 2020, 12, 2074. [Google Scholar] [CrossRef]
- Tan, S.H.; Chuah, J.H.; Chow, C.-O.; Kanesan, J.; Leong, H.Y. Artificial intelligent systems for vehicle classification: A survey. Eng. Appl. Artif. Intell. 2024, 129, 107497. [Google Scholar] [CrossRef]
- Asry, N.I.M.; Mustapha, A.; Mostafa, S.A. Comparative Analysis of Machine Learning Algorithms in Vehicle Image Classification. In Methods and Applications for Modeling and Simulation of Complex Systems; Communications in Computer and Information Science; Springer: Singapore, 2024; pp. 426–436. [Google Scholar]


| Hatchback | MPV | Sedan | SUV | |
|---|---|---|---|---|
| Unknown01 | 16.7% | 33.3% | 0% | 50% |
| Unknown02 | 33.3% | 16.7% | 0% | 50% |
| Unknown03 | 33.3% | 16.7% | 0% | 50% |
| Unknown04 | 33.3% | 0% | 16.7% | 50% |
| Unknown05 | 33.3% | 0% | 16.7% | 50% |
| Unknown06 | 33.3% | 0% | 16.7% | 50% |
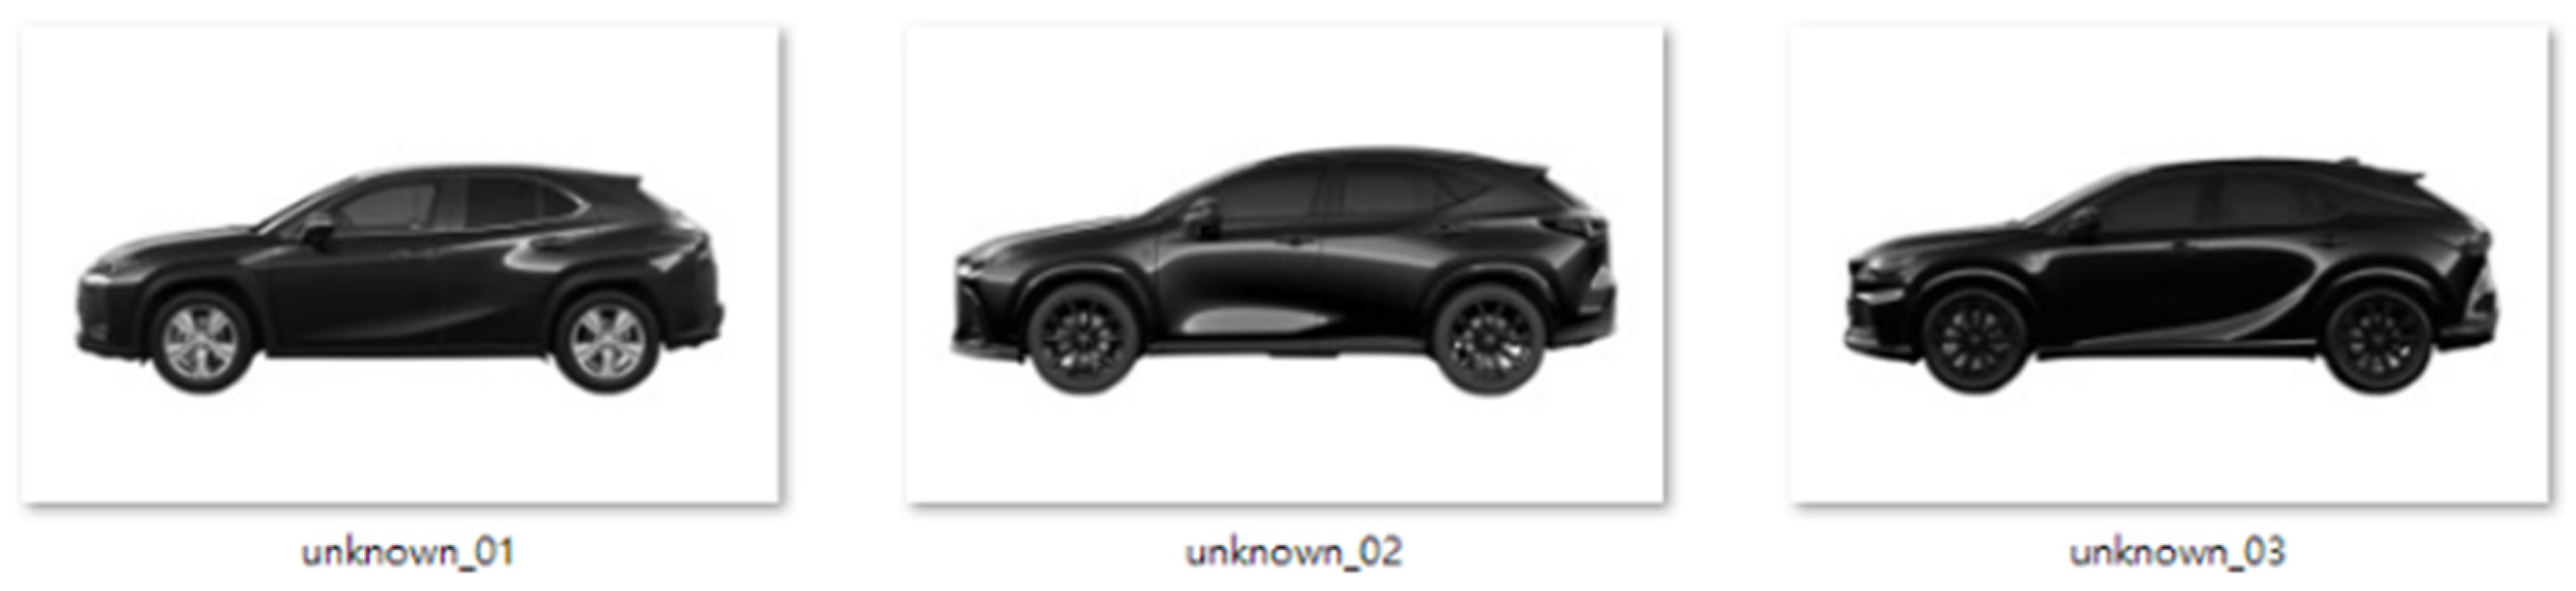
| Hatchback | MPV | Sedan | SUV | |
|---|---|---|---|---|
| Unknown01 | 33.3% | 0% | 33.3% | 33.3% |
| Unknown02 | 33.3% | 0% | 33.3% | 33.3% |
| Unknown03 | 50% | 0% | 16.7% | 33.3% |
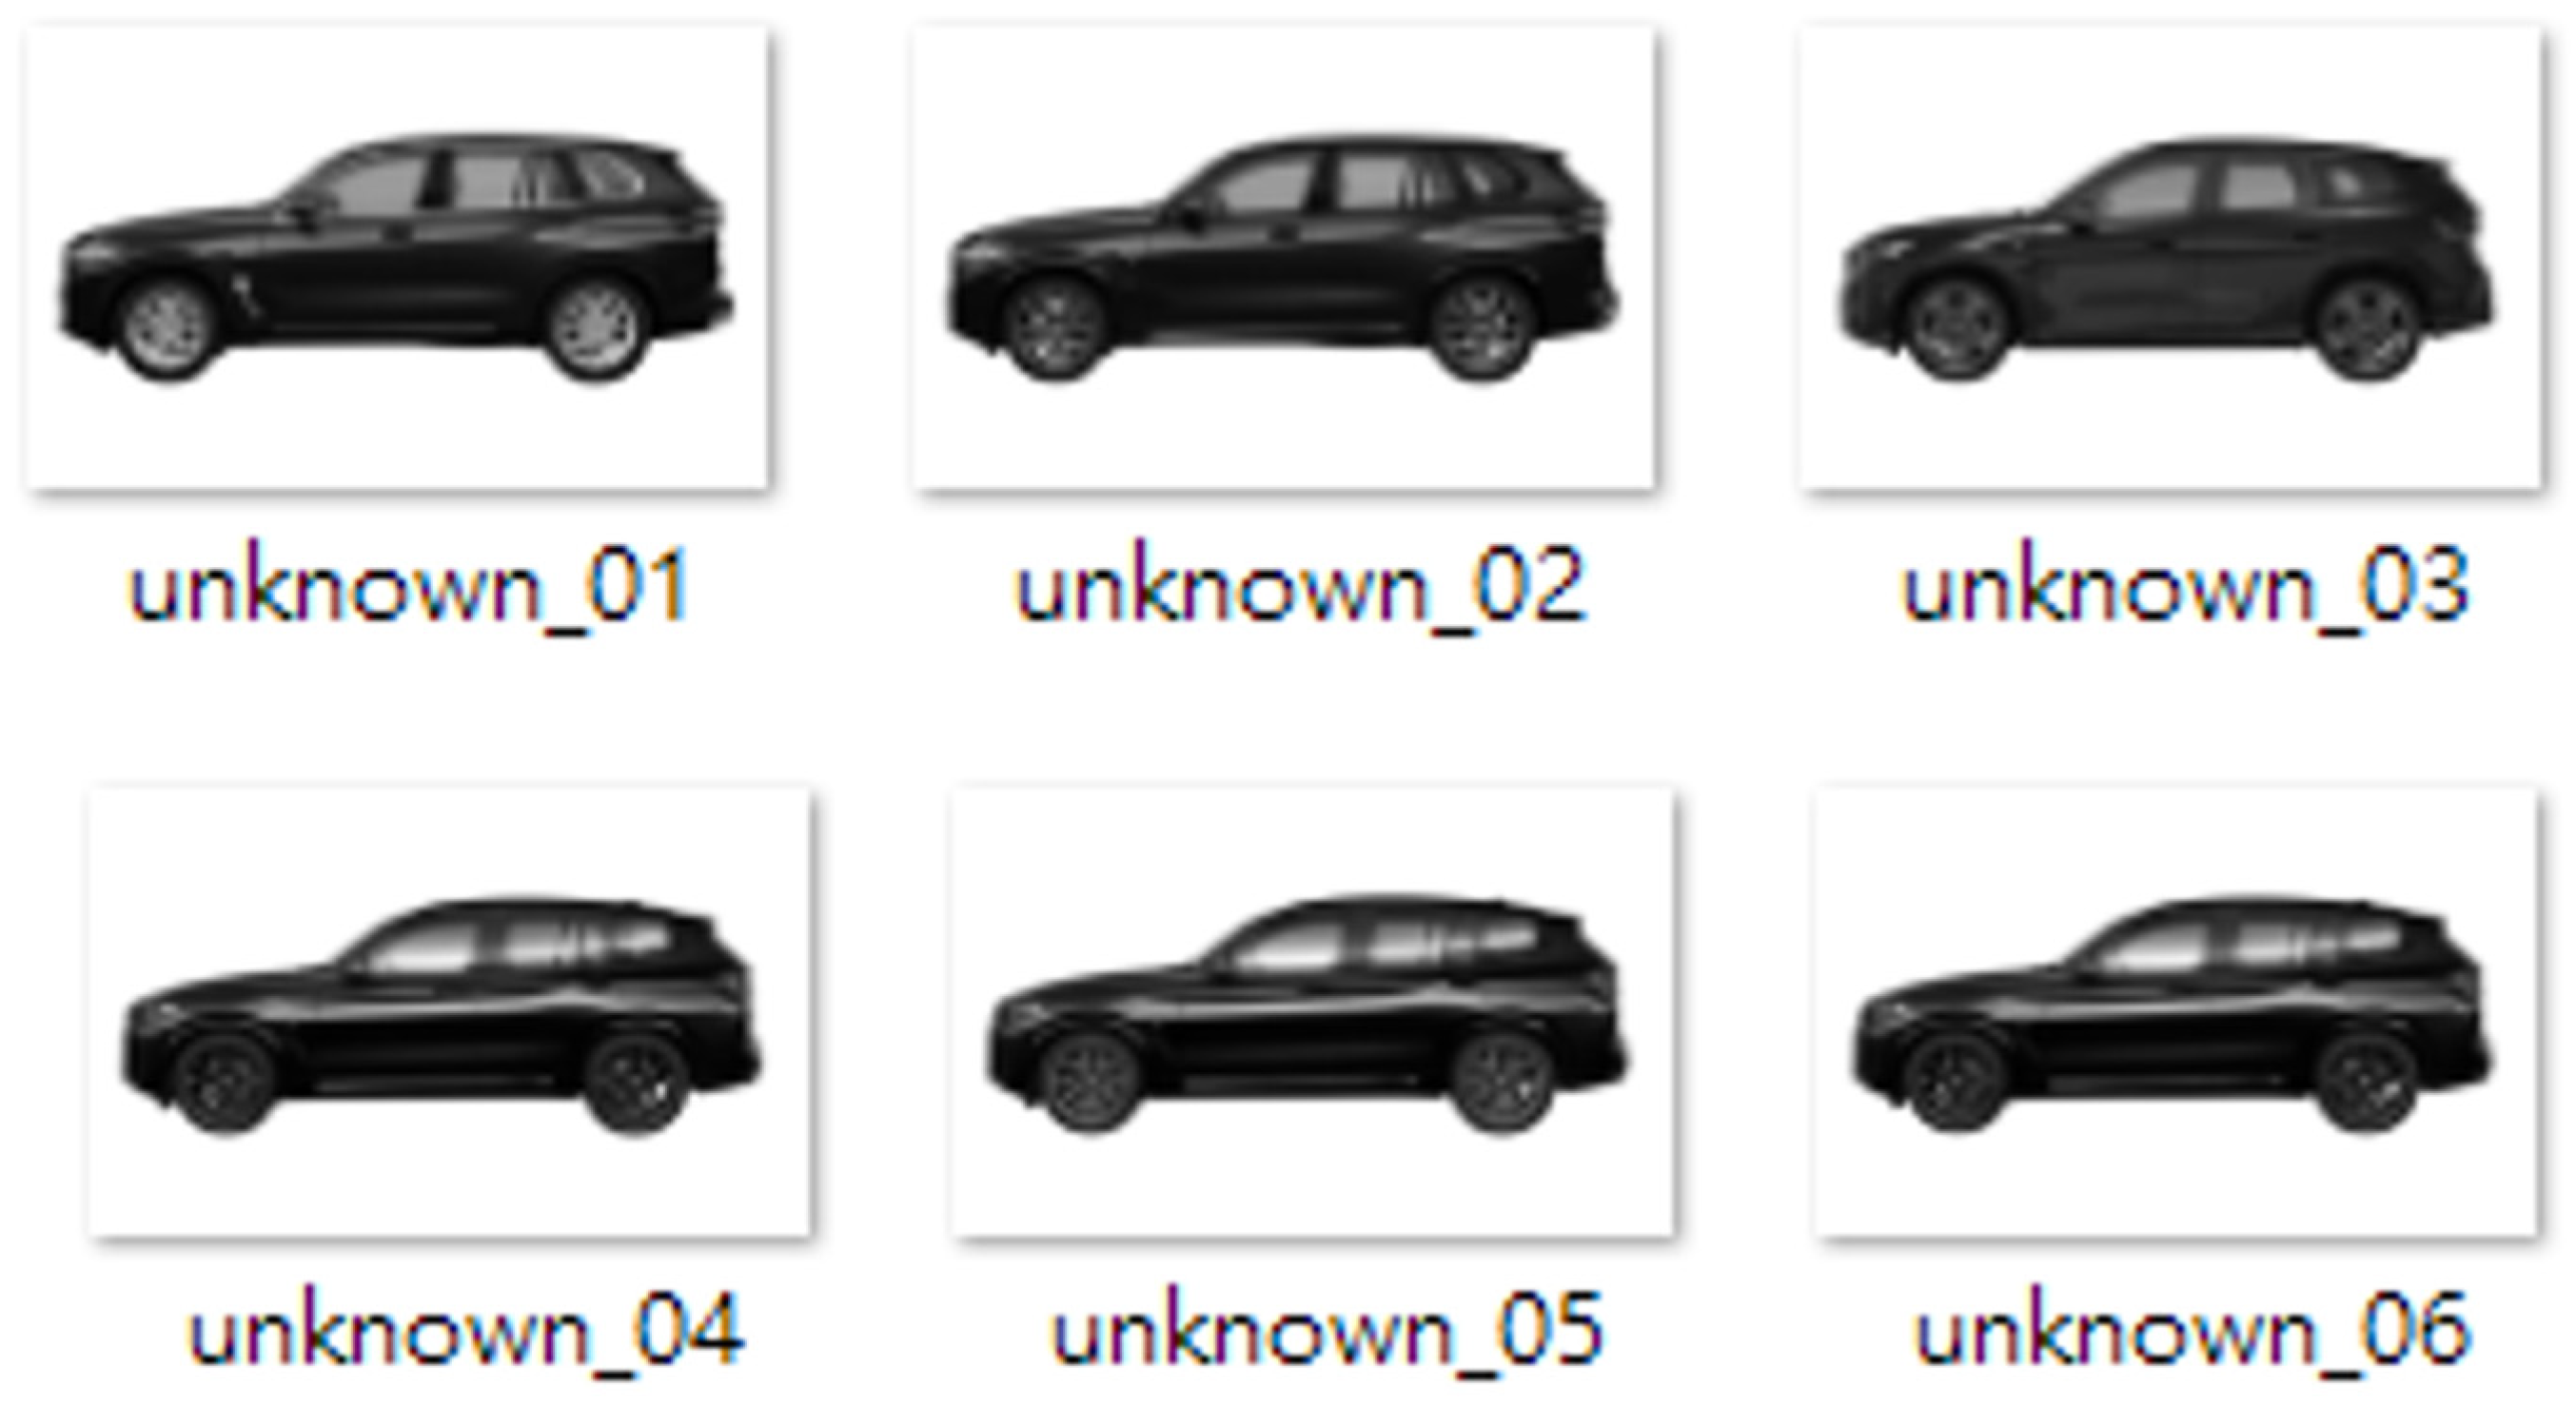
| Hatchback | MPV | Sedan | SUV | |
|---|---|---|---|---|
| Unknown01 | 16.7% | 33.3% | 0% | 50% |
| Unknown02 | 33.3% | 0% | 33.3% | 33.3% |
| Answer | Reasons and Suggestions |
|---|---|
| Expert A (agree) | Car model one has the highest proportion of SUVs, which aligns with my understanding. The proportion of hatchbacks and MPVs is also appropriate. Car model two appears to be evenly split among hatchbacks, sedans, and SUVs. In reality, it combines the front of an SUV, the chassis of a sedan, and the rear of a hatchback, making it highly valuable for reference. |
| Expert B (agree) | In model one, SUVs have the highest proportion, matching technical and design logic. The proportions of hatchbacks and MPVs are also appropriate. Model two seems to be evenly split among hatchbacks, sedans, and SUVs. In reality, it combines the front of an SUV, the chassis of a sedan, and the rear of a hatchback. This innovative design shows the potential of technical fusion and is valuable for reference. |
| Expert C (agree) | Model one shows SUVs as the highest proportion, matching my judgment. Hatchbacks and MPVs are also reasonable. This composition combines an SUV front, sedan chassis, and hatchback rear. The analysis matches my observations and is valuable for reference. |
| Expert D (agree) | The model for car one shows the highest proportion of SUVs, slightly lower for MPVs, and an appropriate proportion of hatchbacks, reflecting actual hatchback features. For car two, the analysis shows an even split among hatchbacks, sedans, and SUVs, but I believe the hatchback proportion should be higher and the SUV and sedan proportions lower. Despite this discrepancy, the analysis method is still valuable for reference. |
| Expert E (agree) | The model for car one shows the actual car is composed of various car features. For car two, the analysis results show an even split among hatchbacks, sedans, and SUVs. However, I believe hatchbacks should be 60% and sedans close to 0%. Despite the model fitting proportions from a features perspective, it has blind spots in length and wheelbase. This analysis method is still valuable for reference. |
| Answer | Reasons and Suggestions |
|---|---|
| Expert A (valuable) | The classification model, through analyzing sales data, can accurately predict market reactions to new car models and develop effective strategies. It is expected to help designers create more popular models, increasing the success rate. |
| Expert B (valuable) | Using the classification model to analyze sales data of best-selling car models helps designers understand market demands, improving the acceptance and sales success rate of new car models. |
| Expert C (valuable) | From a product development perspective, the classification model can refine design directions, reduce risks, improve efficiency, and ensure that new car models better meet market demands, increasing their chances of success. |
| Expert D (valuable) | The application of the classification model can provide designers with market insights, assisting in the creation of more popular car models. If applied in design education, it can help educational institutions adjust their curriculum to train competitive design talent, promoting the development of the automotive industry. |
| Expert E (valuable) | I believe the application of the classification model is very helpful. It demonstrates the potential of data analysis in business decisions and provides valuable market insights, helping me better understand consumer needs. |
Disclaimer/Publisher’s Note: The statements, opinions and data contained in all publications are solely those of the individual author(s) and contributor(s) and not of MDPI and/or the editor(s). MDPI and/or the editor(s) disclaim responsibility for any injury to people or property resulting from any ideas, methods, instructions or products referred to in the content. |
© 2025 by the authors. Licensee MDPI, Basel, Switzerland. This article is an open access article distributed under the terms and conditions of the Creative Commons Attribution (CC BY) license (https://creativecommons.org/licenses/by/4.0/).
Share and Cite
Wang, H.-H.; Su, H.-J. Image Classification to Identify Style Composition Ratios in Crossover Cars. Eng. Proc. 2025, 89, 26. https://doi.org/10.3390/engproc2025089026
Wang H-H, Su H-J. Image Classification to Identify Style Composition Ratios in Crossover Cars. Engineering Proceedings. 2025; 89(1):26. https://doi.org/10.3390/engproc2025089026
Chicago/Turabian StyleWang, Hung-Hsiang, and Hung-Jui Su. 2025. "Image Classification to Identify Style Composition Ratios in Crossover Cars" Engineering Proceedings 89, no. 1: 26. https://doi.org/10.3390/engproc2025089026
APA StyleWang, H.-H., & Su, H.-J. (2025). Image Classification to Identify Style Composition Ratios in Crossover Cars. Engineering Proceedings, 89(1), 26. https://doi.org/10.3390/engproc2025089026