1. Introduction
The awareness and acceptance of being inclusive toward individuals with disabilities have been increasing. Taiwanese Sign Language has been officially recognized as a tool for communication as it safeguards cultural and linguistic heritage and raises the awareness of culture and language for individuals with hearing disabilities. Beyond the essential support, the public must understand the value of inclusivity.
1.1. Technology in Education
The acceptance of educational technologies, particularly those to enhance language learning, has been a subject of research recently. Technology acceptance models (TAMs) and their applications provide frameworks for understanding users’ attitudes and intentions toward new technologies. Perceived ease of use (PEOU) and perceived usefulness (PU) are key determinants of user acceptance [
1]. When users perceive a technology as easy to use and useful, they are more likely to adopt it for educational purposes [
2,
3].
Innovations in sign language technology improve communication, accessibility, and inclusivity for the hearing-impaired community, underscoring the goal to enhance sign language learning and support the hearing-impaired [
4]. Incorporating the perspectives of the hearing-impaired is crucial; their engagement with the community is beneficial to them [
5].
1.2. Technological Innovations in Sign Language Learning
Augmented reality (AR) and artificial intelligence (AI) are used to create innovative tools for learning sign language [
6,
7,
8,
9]. Such advanced technology offers unique opportunities to enhance the interactivity and effectiveness of educational resources, particularly for individuals with hearing impairment. For example, AR has been adopted in learning sign languages in English [
10], Indonesian [
7], and Peruvian [
11]. Several applications have been developed to facilitate communication between the hearing and the hearing-impaired by adopting AI technologies and sign language capturing. Yet, it has been developed in English, Hindi, Thai, Greek, Korean, and Cantonese [
12]. However, state-of-the-art technologies have not been adopted to fulfill the needs of the hearing-impaired in Taiwan.
Therefore, we developed an “Interactive System of Digital Sign Language Picture Books” that integrates cutting-edge technologies to enhance the learning experience for the hearing and the hearing-impaired. The system uses AR to enable users to interact with animated content more engagingly. AI technology focuses on sign language recognition to provide learners with immediate feedback on the accuracy of their sign language. This real-time feedback helps learners understand and correct their signs, thereby enhancing the learning experience. By combining AR and AI, the system improves the visual and interactive aspects of sign language education and supports an inclusive reading environment that caters to diverse user needs and abilities.
2. Materials and Methods
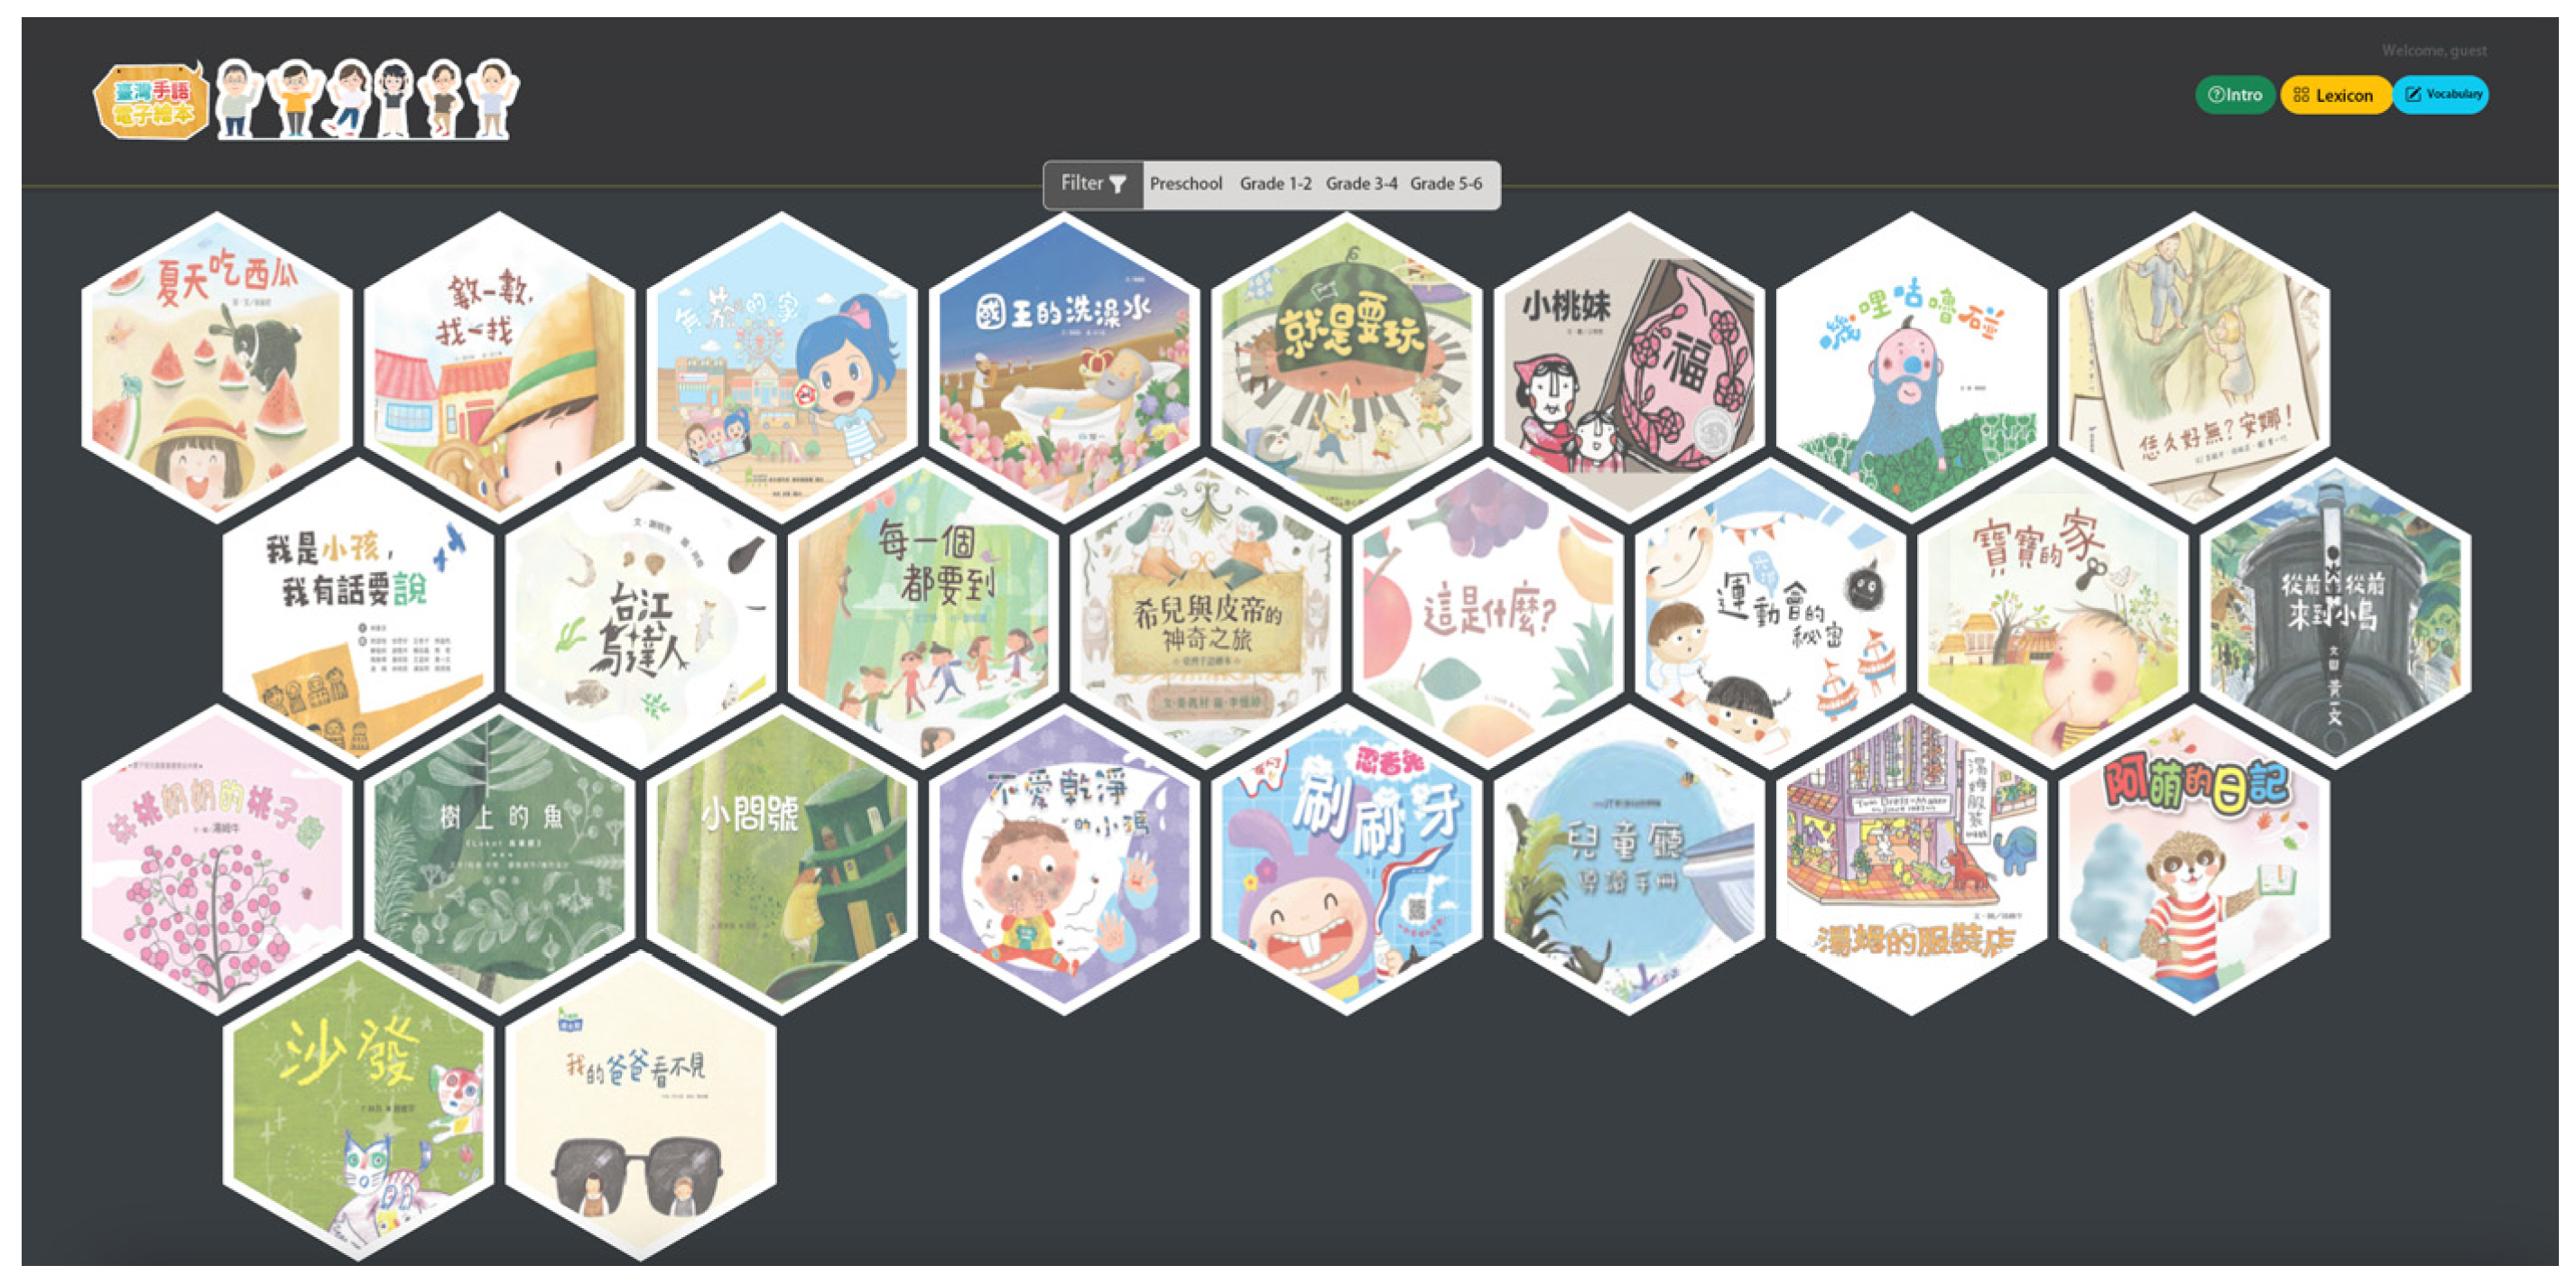
To foster a sustainable learning environment, the system was developed in Taiwanese Sign Language (
Figure 1). For testing the system, 82 participants were recruited, including sign language instructors and students. The participants included the hearing and the hearing-impaired who had an interest in learning sign language.
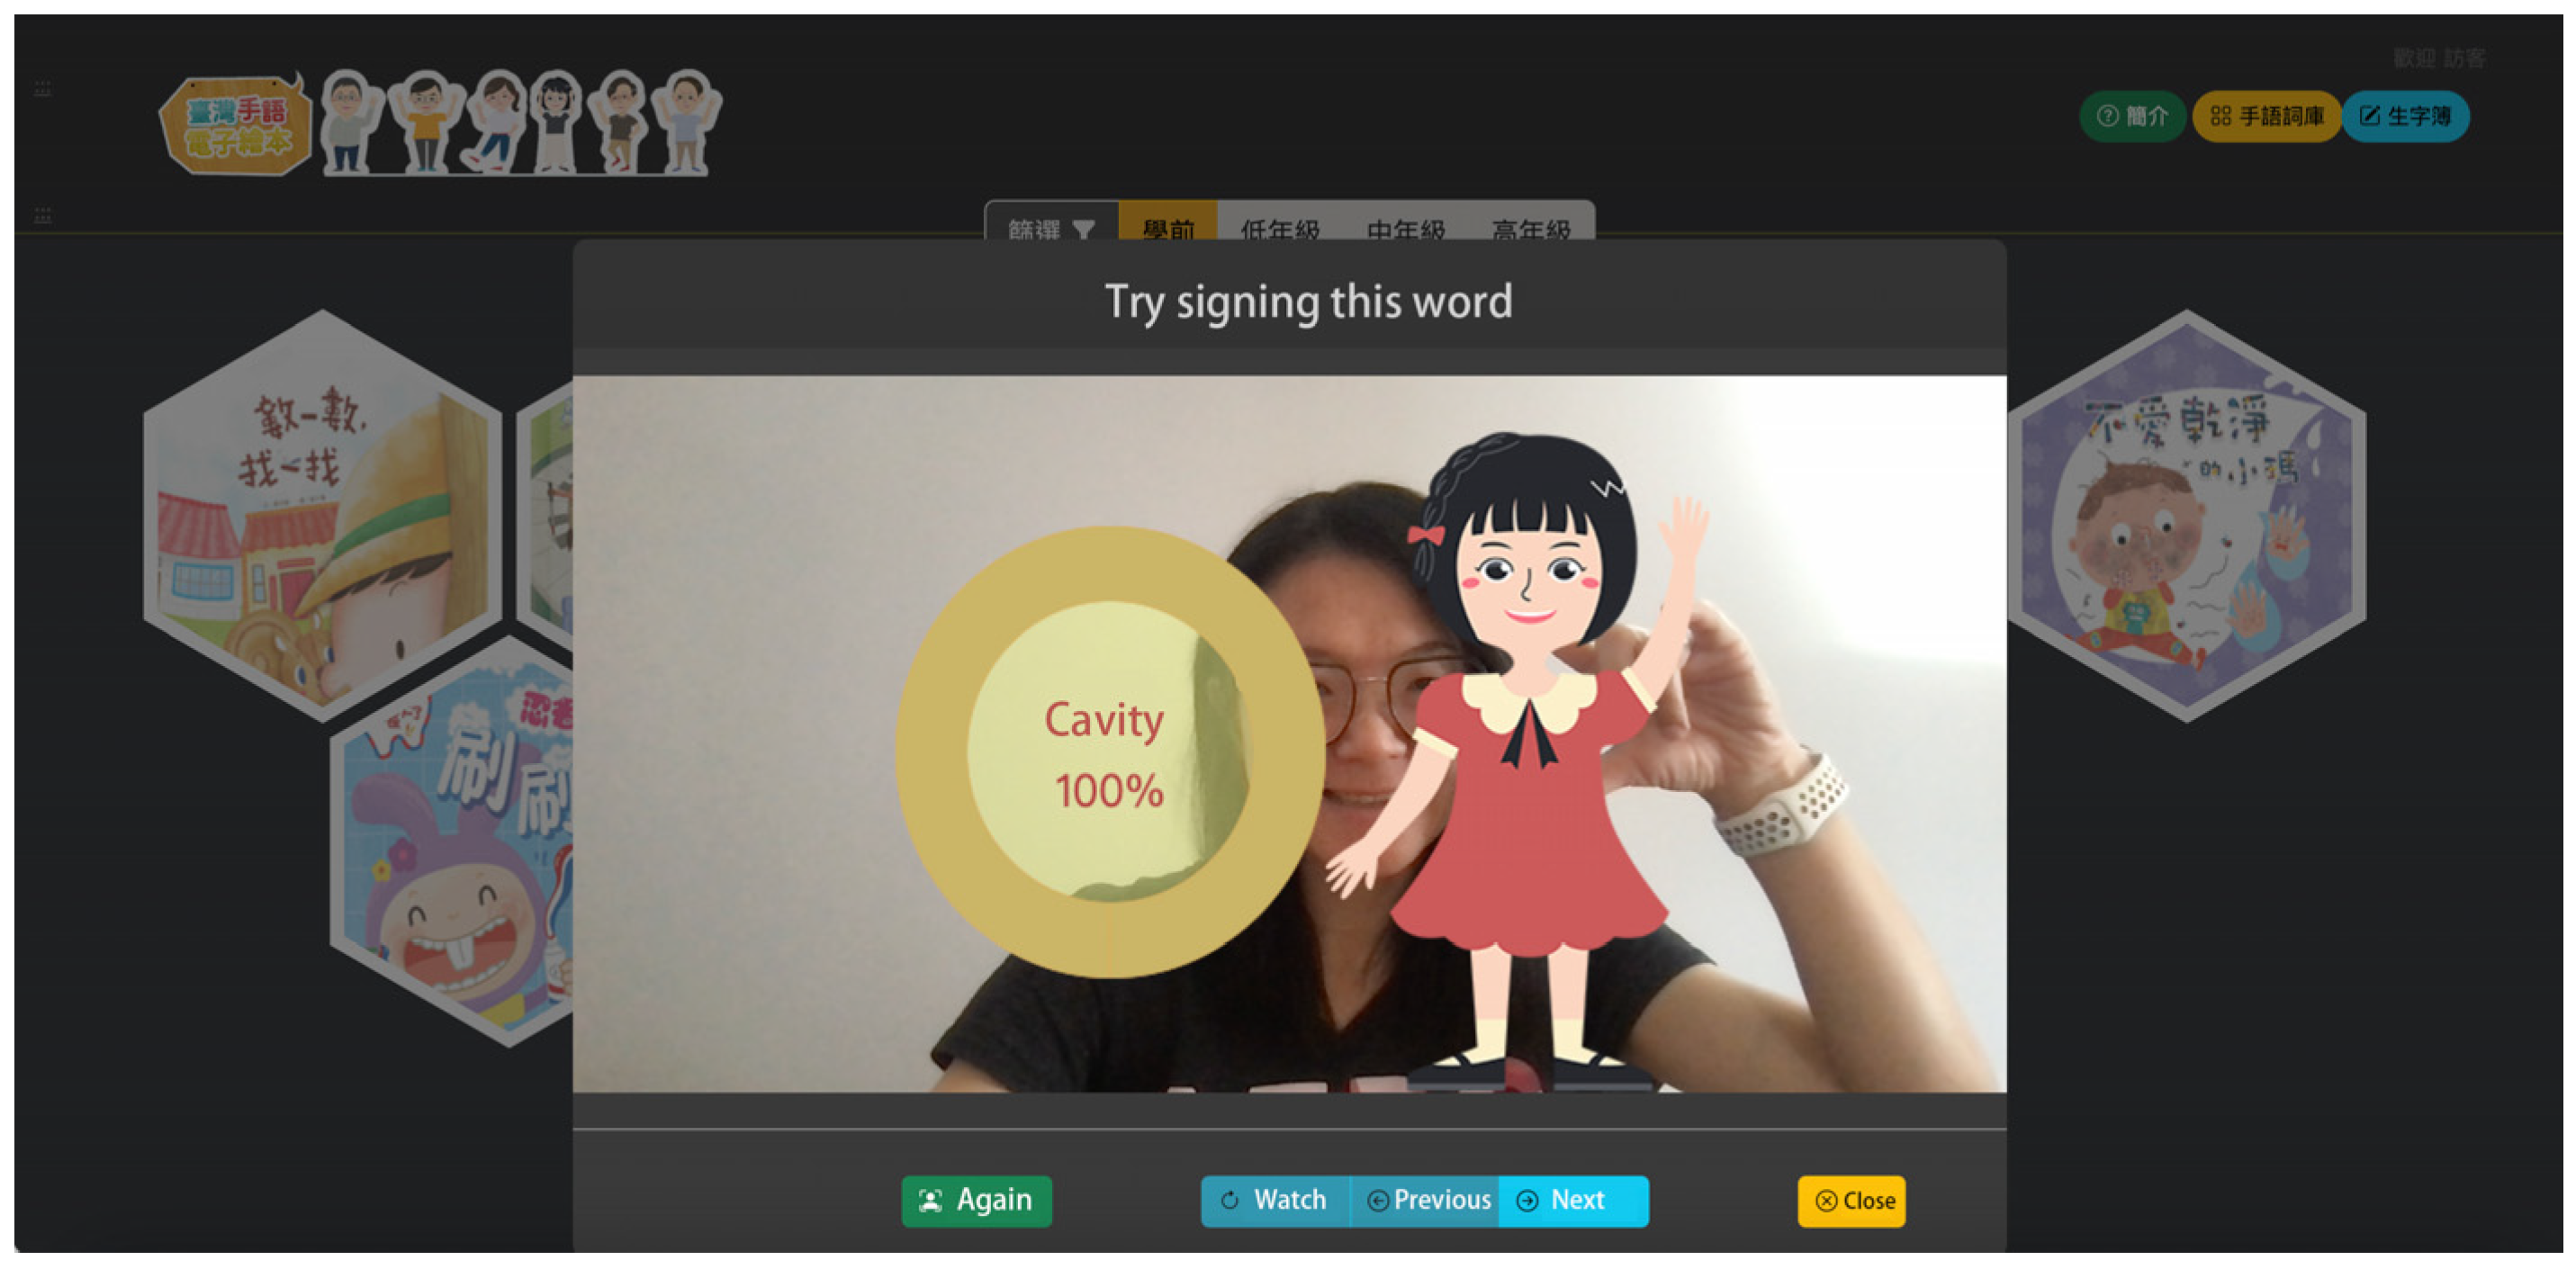
Participants began by selecting a story of interest from the main page of the system. Upon selection, they proceeded to watch a video that featured storybooks accompanied by sign language representations embedded within the content. Following the viewing, participants engaged in sign language practice by signing in front of the camera, which was initiated by clicking a designated green button on the user interface. The AI-driven recognition system subsequently analyzed their signing performance and provided immediate feedback, presenting the accuracy of their signed vocabulary as a percentage (
Figure 2).
TAM was employed to examine learners’ acceptance of the system and identify the perceived usefulness and perceived ease of use and their influence on users’ attitudes toward and intentions. The results were used to predict users’ behavior in the successful implementation of technology [
1].
Before using the system, the participants were informed about the study’s objectives and procedures. Each participant used the system for 10−15 min. Then, they completed a questionnaire to assess their acceptance of the system. The collected data were analyzed using structural equation modeling (SEM) to conduct factor and path analyses to predict the user acceptance of the system. A survey questionnaire was developed for this study, encompassing four constructs and 14 items. The items were tailored to align with the objectives of this research. The theoretical framework of TAM includes four constructs: perceived usefulness (PU), perceived ease of use (PEOU), attitude toward using (ATU), and behavioral intention to use (BIU), which are used to predict the actual system use (ASU) by the users.
In the questionnaire, the perceived usefulness (PU) construct included four items (1-1 to 1-4); the perceived ease of use (PEOU) construct included five items (2-1 to 2-5); the attitude toward using (ATU) construct included three items (3-1 to 3-3); and the behavioral intention to use (BIU) construct included two items (4-1 to 4-2). A five-point Likert scale ranging from (1) “Strongly Disagree” to (5) “Strongly Agree” was used to score the items. The constructs and items are detailed in
Table 1. Data collection was conducted electronically through an online survey.
The participants completed questionnaires using a computer, tablet, or mobile phone. The collected data were analyzed using JASP and SmartPLS 4 for descriptive statistics and structural equation modeling (SEM) to explore relationships among latent variables of TAM. SmartPLS 4 was chosen for SEM analysis due to its availability for small sample sizes and its capability to handle complex causal models involving multiple constructs. Partial Least Squares (PLS), a method within SEM, was appropriate for this study as it has predictive power and model interpretability.
3. Results
In SmartPLS, the measurement model represents the first stage of testing. In this stage (the outer model), convergent validity and discriminant validity are determined to see whether the items in each construct reflect that construct. The second stage involves testing the inner model to verify the proposed hypotheses and evaluate the explanatory power of the constructs.
The descriptive statistics are presented in
Table 2. Females outnumbered males at 74.4% and 25.6% of the total number of participants. The majority of participants were 31−60 years old. The ratio of the hearing and hearing-impaired was equal.
Descriptive statistics for the four constructs in this study are presented in
Table 3. The average scores for each construct are all above 4.5, with the highest average of 4.707 observed in “Attitude Toward Using” and the lowest average of 4.537 in “Behavioral Intention to Use”.
3.1. Outer Model
In the outer model, internal consistency was assessed using Cronbach’s alpha (
Table 4). A reliability level of 0.7 or higher is recommended [
13]. Cronbach’s alpha of the constructs exceeded 0.7, ranging from 0.877 to 0.905. Composite reliability (CR represents the reliability of all measurements. The higher the CR value of a latent variable, the better the items measure the latent variable, indicating higher internal consistency of the construct [
13]. In this study, the CR of all constructs exceeded 0.7, ranging from 0.822 to 0.908.
CR and average variance extracted (AVE) were used to assess the reliability of constructs. If these values meet the standard thresholds, it indicates good construct reliability [
14]. AVE measures the extent to which a latent variable explains the variance of its indicators. A higher AVE value indicates a greater degree of variance explained by the latent variable [
15]. AVE must be greater than 0.5, with 0.36−0.5 being an acceptable range. A higher AVE value signifies a higher convergent validity of the construct [
16]. In this study, AVEs were higher than 0.5, indicating sufficient convergent validity for each construct (
Table 5).
Discriminant validity is used to assess the extent to which measurement variables distinguish between different constructs, indicating low correlation between items from different constructs. According to the Fornell–Larcker criterion, the square root of the average variance extracted (AVE) for each latent construct should be greater than the correlation coefficients between that construct and other constructs, demonstrating discriminant validity between constructs [
16,
17]. The discriminant validity of the four constructs investigated in this study is shown in
Table 6. The square root of AVE for each latent construct exceeds the correlation coefficients between that construct and other constructs, indicating discriminant validity among the constructs.
However, Henseler et al. [
18] argue that the Fornell–Larcker criterion may lack sensitivity, thus proposing the heterotrait–monotrait ratio of correlations (HTMT) as an alternative index to assess discriminant validity between constructs. According to their recommendation, the HTMT values between constructs should be less than 1 to indicate discriminant validity. In this study, all HTMT values between constructs are below 1, demonstrating discriminant validity (as shown in
Table 7).
3.2. Structural Model/Inner Model: Hypothesis Verification and Analysis Test
Structural model (inner model) analysis includes (1) model fit analysis, (2) overall model explained variance (R2), (3) path coefficients, and (4) collinearity assessment.
3.2.1. Model Fit Analysis
Model fit analysis assesses the goodness of fit using the standardized root mean square residual (SRMR), where a good fit is indicated by an SRMR value below 0.08 or 0.1 [
19]. In this study, the SRMR value for the model is 0.075 (see
Table 8), indicating a good model fit.
3.2.2. The Explained Variance (R2) of the Overall Research Model
The explained variance (R
2), also known as the coefficient of determination, is used to explain the goodness of fit in a linear regression model. It indicates the causal relationships between the latent variables in the model, reflecting the extent to which the independent variables can explain the dependent variable. This metric can represent the in-sample predictive power and is commonly used as a criterion to judge the quality of a model. However, since R
2 can be influenced by the number of paths from other constructs, it is prone to bias. Therefore, the adjusted R
2 is often used for evaluation. The R
2 value ranges from 0 to 1, where a smaller value indicates poorer explanatory power, and a larger value indicates better explanatory power. A value of 0 means the independent variables are completely unrelated to the dependent variable, while a value of 1 means the independent variables can fully explain the dependent variable. The critical values for R
2 are 0.67, 0.33, and 0.19, which represent different levels of explanatory power for the model: substantial, moderate, and weak, respectively [
20,
21].
In the context of this research model, the constructs of attitude toward use (ATU) and behavioral intention (BI) exhibit substantial explanatory power, while the construct of perceived usefulness (PU) demonstrates moderate explanatory power (
Table 9).
3.2.3. Path Coefficient
Collinearity assessment utilizes the variance inflation factor (VIF) to evaluate collinearity among constructs. A VIF value should be less than 5 to indicate that there is no collinearity problem among the constructs. In this study, the VIF values range between 1 and 1.89, all of which are below 5, indicating no collinearity issues (see
Table 10).
3.2.4. Collinearity Assessment
Collinearity assessment utilizes the variance inflation factor (VIF) to evaluate collinearity among constructs. A VIF value should be less than 5 to indicate that there is no collinearity problem among the constructs. In this study, the VIF values range between 1 and 1.89, all of which are below 5, indicating no collinearity issues (see
Table 11).
The research hypotheses and their path coefficients are shown in
Figure 3. The arrows on the figure represent the paths, and the numbers on the paths indicate the path coefficients. An asterisk following a path coefficient indicates that the path has a significant difference.
The research results show that the path coefficients for H1, H2, and H5 are positive. Perceived ease of use (PEOU) positively influences perceived usefulness (PU), as shown by path H1 (p < 0.001), and perceived ease of use (PEOU) positively influences attitude toward use (ATU), as shown by path H2 (p < 0.001). Thus, hypotheses H1 and H2 are supported. Additionally, attitude toward use (ATU) positively influences behavioral intention (BIU), as shown by path H5 (p < 0.01), supporting hypothesis H5.
However, perceived usefulness (PU) does not have a significant positive influence on attitude toward use (ATU), path H3 (p > 0.01), nor on behavioral intention (BIU), path H4 (p > 0.01). Therefore, hypotheses H3 and H4 are not supported. This indicates that perceived usefulness (PU) does not have a significant positive influence on attitude toward use or behavioral intention.
4. Discussion
The research results indicate multiple positive relationships regarding learners’ acceptance of technology when interacting with the sign language picture book system developed in this study. Firstly, three hypotheses are supported: the perceived ease of use of the system for learning sign language positively influences perceived usefulness (H1), perceived ease of use positively influences attitude toward use (H2), and attitude toward use positively influences behavioral intention (H5). This suggests that if learners find the system easy to use, they will also perceive it as useful. Moreover, when learners consider the system useful, it positively affects their attitude toward using it and their behavioral intention to use it. However, the study results show that the system’s perceived usefulness (PU) does not significantly positively impact attitude toward use (ATU) and behavioral intention (BIU). The possible reasons for this are as follows: (1) the sign language recognition accuracy of the system needs improvement, (2) the content of the sign language materials should provide thematic dialogue learning scenarios, and (3) a search function should be provided to allow users to look up content by entering keywords. Additionally, because the current teaching content is more suitable for learners with some foundational knowledge, it is recommended that the materials be categorized by different levels of difficulty. For beginners, the sign language actions and speed in the videos might be too fast, so it may be necessary to slow down the speed and provide more demonstrations in the video content. These suggestions aim to enhance users’ perceived usefulness of the system.
5. Conclusions
The development of the Interactive System of Digital Sign Language Picture Books contributes to enriching the reading and learning experience of deaf and hearing-impaired communities. Furthermore, it could promote social inclusion by facilitating better communication between deaf and hearing individuals and raising awareness of sign language in broader society. Evaluating the interactive system using the technology acceptance model (TAM) has provided us with valuable insights into how target users perceive the system for learning and reading through Taiwanese Sign Language.
The limitations of this study include the lack of examination of external variables influencing the acceptance of the sign language picture book system. Examples of such variables could include instructional content design, information or system quality, self-efficacy, enjoyment, or gamification, among others. Therefore, future research is recommended to incorporate these external variables to further explore the system’s acceptance.
Additionally, since participants were all first-time users of the system developed in this study, acceptance may vary over time with prolonged system use. Factors such as improvement in sign language proficiency or increased familiarity with system usage could influence acceptance. Therefore, future studies could also delve deeper into the impact of external variables on the acceptance of this system.
Author Contributions
Conceptualization, K.-F.H., T.-Y.T., S.-H.C., S.-Y.C. and Y.-H.W.; methodology, K.-F.H. and Y.-H.W.; software, K.-F.H.; validation, Y.-H.W.; formal analysis, Y.-H.W.; investigation, K.-F.H., Y.-H.W., C.-C.W. and K.-Y.H.; resources, S.-Y.C.; data curation, Y.-H.W.; writing—original draft preparation, Y.-H.W.; writing—review and editing, Y.-H.W.; visualization, Y.-H.W.; supervision, K.-F.H. and T.-Y.T.; project administration, K.-F.H.; funding acquisition, T.-Y.T., S.-H.C. and S.-Y.C. All authors have read and agreed to the published version of the manuscript.
Funding
This research was funded by the National Taiwan Library, grant number NTL-lsy1120028.
Institutional Review Board Statement
Not applicable.
Informed Consent Statement
Not applicable.
Data Availability Statement
Data are contained within the article.
Conflicts of Interest
The authors declare no conflicts of interest. The funders had no role in the design of the study; in the collection, analyses, or interpretation of data; in the writing of the manuscript; or in the decision to publish the results.
References
- Eason, G.; Noble, B.; Sneddon, I.N. On certain integrals of Lipschitz-Hankel type involving products of Bessel functions. Philos. Trans. R. Soc. Lond. 1955, 247, 529–551. [Google Scholar]
- Maxwell, J.C. A Treatise on Electricity and Magnetism, 3rd ed.; Clarendon: Oxford, UK, 1892; Volume 2, pp. 68–73. [Google Scholar]
- Jacobs, I.S.; Bean, C.P. Fine particles, thin films and exchange anisotropy. In Magnetism; Rado, G.T., Suhl, H., Eds.; Academic: New York, NY, USA, 1963; Volume III, pp. 271–350. [Google Scholar]
- Fox, N.; Woll, B.; Cormier, K. Best practices for sign language technology research. Univers. Access Inf. Soc. 2023, 0123456789. [Google Scholar] [CrossRef]
- Bragg, D.; Koller, O.; Bellard, M.; Berke, L.; Boudreault, P.; Braffort, A.; Caselli, N.; Huenerfauth, M.; Kacorri, H.; Verhoef, T.; et al. Sign language recognition, generation, and translation: An interdisciplinary perspective. In Proceedings of the ASSETS 2019—21st International ACM SIGACCESS Conference on Computers and Accessibility, Pittsburgh, PA, USA, 28–30 October 2019; pp. 16–31. [Google Scholar] [CrossRef]
- Yorozu, Y.; Hirano, M.; Oka, K.; Tagawa, Y. Electron spectroscopy studies on magneto-optical media and plastic substrate interface. IEEE Transl. J. Magn. Jpn. 1987, 2, 740–741. [Google Scholar] [CrossRef]
- Young, M. The Technical Writer’s Handbook; University Science: Mill Valley, CA, USA, 1989. [Google Scholar]
- Adeyanju, I.A.; Bello, O.O.; Adegboye, M.A. Machine learning methods for sign language recognition: A critical review and analysis. Intell. Syst. Appl. 2021, 12, 200056. [Google Scholar] [CrossRef]
- Nedjar, I.; M’hamedi, M. Interactive system based on artificial intelligence and robotic arm to enhance arabic sign language learning in deaf children. Educ. Inf. Technol. 2024, 29, 24563–24580. [Google Scholar] [CrossRef]
- Soogund, N.; Joseph, M. SignAR: A Sign Language Translator Application with Augmented Reality using Text and Image Recognition. In Proceedings of the 2019 IEEE International Conference on Intelligent Techniques in Control, Optimization and Signal Processing (INCOS), Tamilnadu, India, 11–13 April 2019; IEEE: Piscataway, NJ, USA, 2019. [Google Scholar] [CrossRef]
- Cabanillas-Carbonell, M.; Cusi-Ruiz, P.; Prudencio-Galvez, D.; Salazar, J.L.H. Mobile Application with Augmented Reality to Improve the Process of Learning Sign Language. Int. J. Interact. Mob. Technol. 2022, 16, 51–64. [Google Scholar] [CrossRef]
- Papastratis, I.; Chatzikonstantinou, C.; Konstantinidis, D.; Dimitropoulos, K.; Daras, P. Artificial intelligence technologies for sign language. Sensors 2021, 21, 5843. [Google Scholar] [CrossRef] [PubMed]
- Nunnally, J.C. Psychometric Theory; McGraw Hill: New York, NY, USA, 1978. [Google Scholar]
- Hair, J.; Anderson, R.; Tatham, R.; Black, W. Multivariate Data Analysis, 5th ed.; Prentice Hall: Hoboken, NJ, USA, 1998. [Google Scholar]
- Chang, S. Partial Least Squares Structural Equation Modeling (PLS-SEM): Application Using SmartPLS; Wu-Nan: Taipei, Taiwan, 2021. [Google Scholar]
- Fornell, C.; Larcker, D.F. Evaluating Structural Equation Models with Unobservable Variables and Measurement Error. J. Mark. Res. 1981, 18, 39–50. [Google Scholar] [CrossRef]
- Segars, A.H.; Grover, V. Strategic Information Systems Planning Success: An Investigation of the Construct and Its Measurement. MIS Q. 1998, 22, 139–163. [Google Scholar] [CrossRef]
- Henseler, J.; Ringle, C.M.; Sarstedt, M. A new criterion for assessing discriminant validity in variance-based structural equation modeling. J. Acad. Mark. Sci. 2015, 43, 115–135. [Google Scholar] [CrossRef]
- Garson, G.D. Partial Least Squares Regression and Structural Equation Models; Statistical Associates Publishers: Raleigh, NC, USA, 2016. [Google Scholar]
- Chin, W.W. The partial least squares approach for structural equation modeling. In Modern Methods for Business Research; Marcoulides, G.A., Ed.; Lawrence Erlbaum Associates Publishers: Mahwah, NJ, USA, 1998; chapter 10; pp. 295–336. [Google Scholar]
- Höck, M.; Ringle, C.M. Local strategic networks in the software industry: An empirical analysis of the value continuum. Int. J. Knowl. Manag. Stud. 2010, 4, 132–151. [Google Scholar] [CrossRef]
| Disclaimer/Publisher’s Note: The statements, opinions and data contained in all publications are solely those of the individual author(s) and contributor(s) and not of MDPI and/or the editor(s). MDPI and/or the editor(s) disclaim responsibility for any injury to people or property resulting from any ideas, methods, instructions or products referred to in the content. |
© 2025 by the authors. Licensee MDPI, Basel, Switzerland. This article is an open access article distributed under the terms and conditions of the Creative Commons Attribution (CC BY) license (https://creativecommons.org/licenses/by/4.0/).


 ,
, 

